Fishbone Template for PowerPoint Presentation


Ishikawa Template PowerPoint and Google Slides
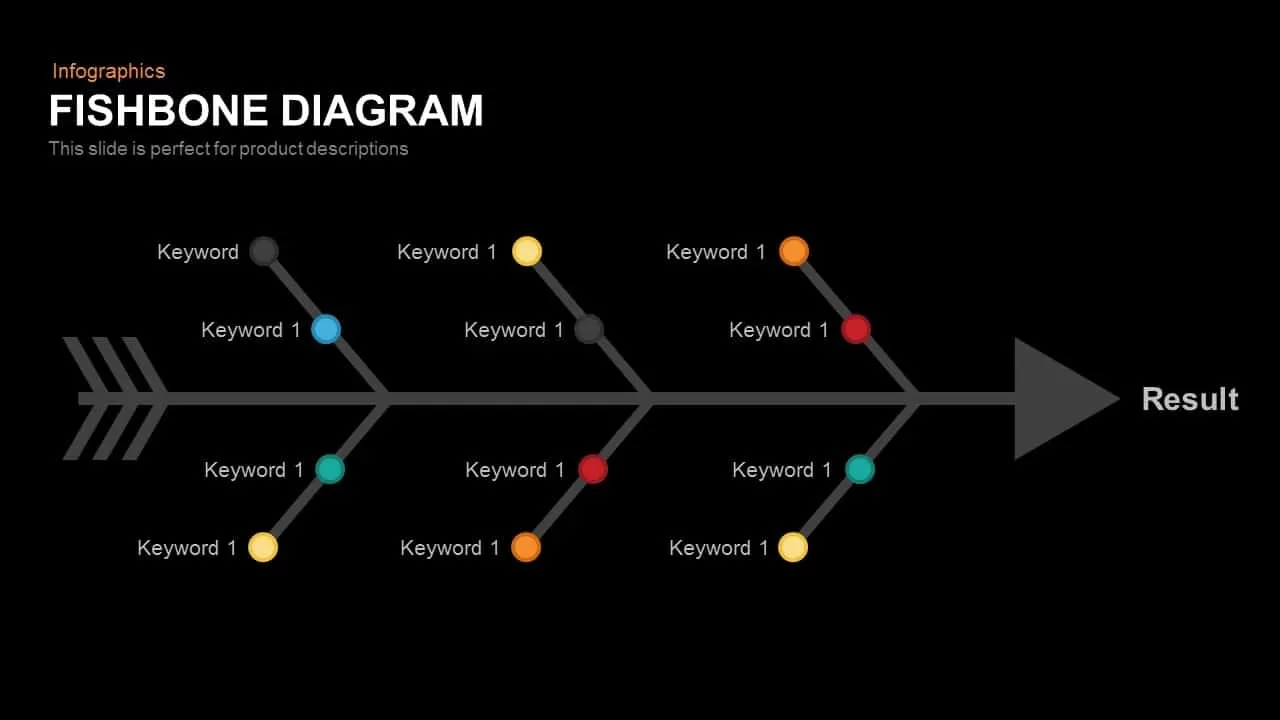
Fishbone templates are commonly used to display root-cause analysis of a problem. This problem analysis tool was developed by Professor Kaoru Ishikawa in the 1960s. So, the device is also named the Ishikawa diagram. A problem could be easily displayed if you have a proper tool. Fishbone PowerPoint is such a diagram that will show the cause-and-effect relationship between problem variables in a comprehensive fashion. Without having some knowledge of causes, we can’t find out a proper solution. Most complex issues have so many reasons behind them. This fishbone diagram template and its breakdown structure will provide a complete picture of problem analysis.
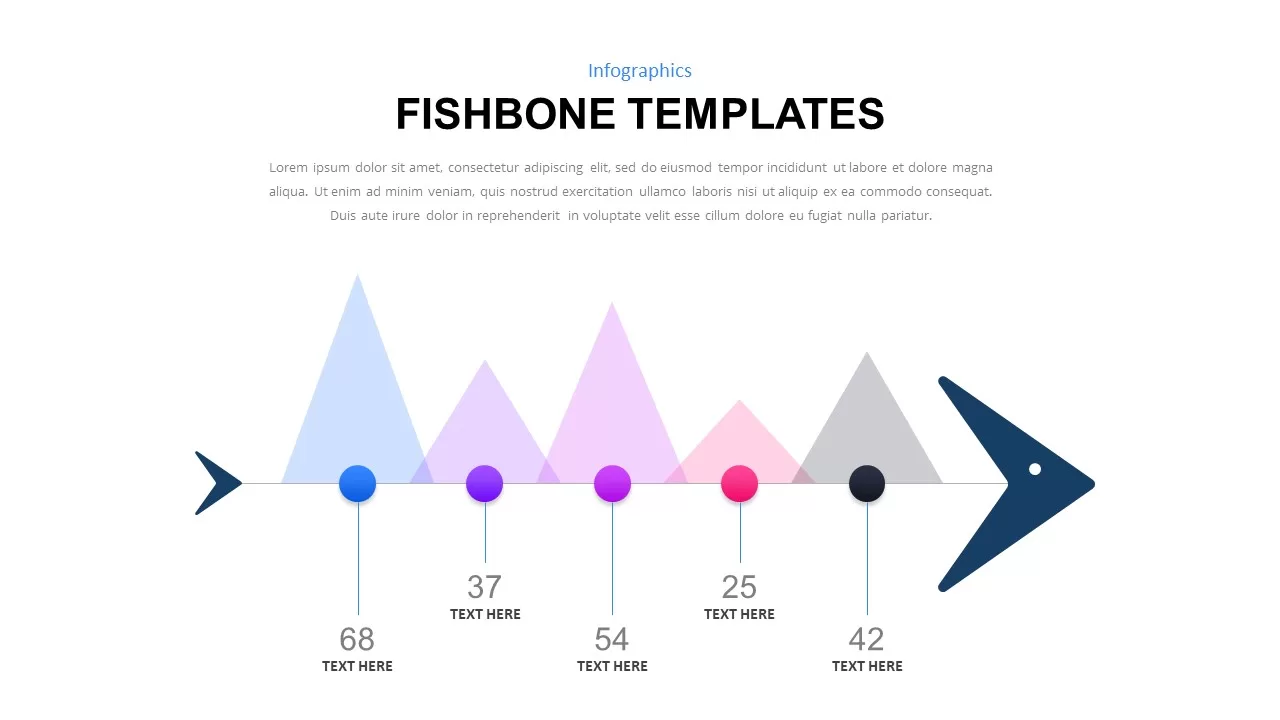
Fishbone PowerPoint template is a research tool that can be used to analyze business problems. For example, product marketing needs extensive research methodologies to find out market trends and product acceptance. If your product doesn’t show an increase in sales, you can assume some serious issues behind this problem. So, marketing professionals and researchers can use this diagram for their business purposes. So, logical examination of both causes and effects only leads to solving the possible challenge. This is a breakdown configuration of a problem with plausible ways to answer.
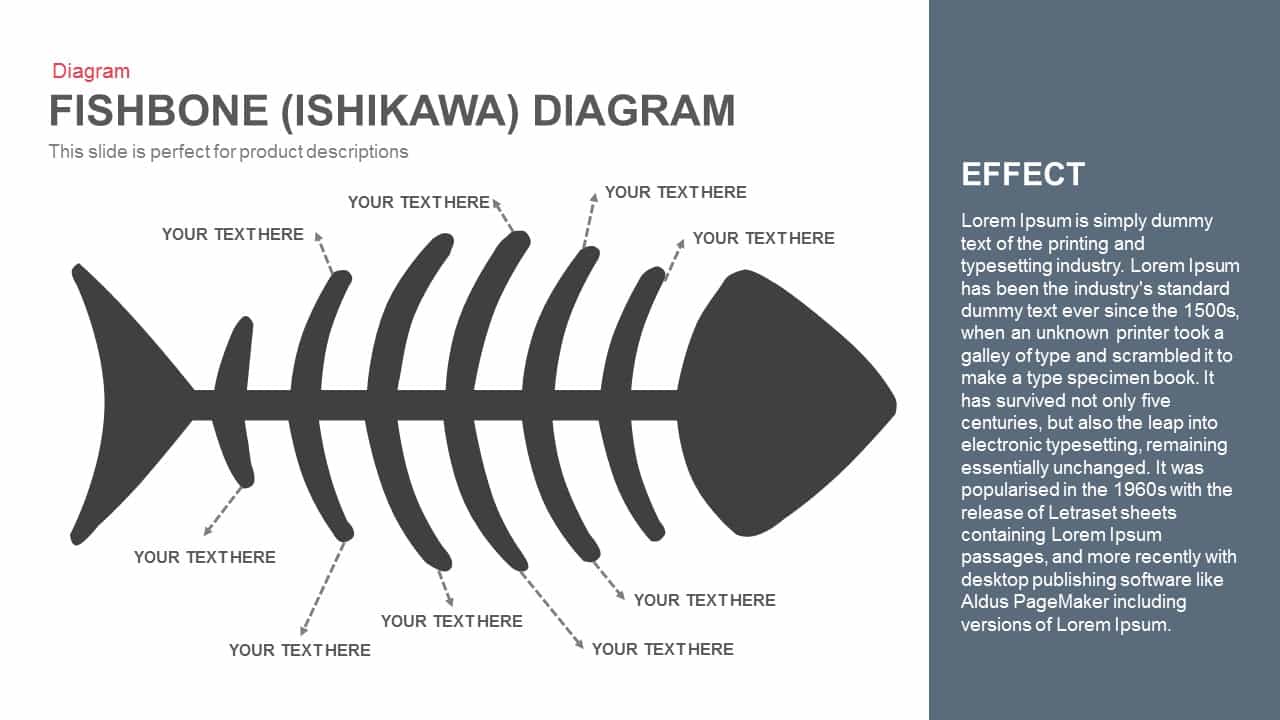
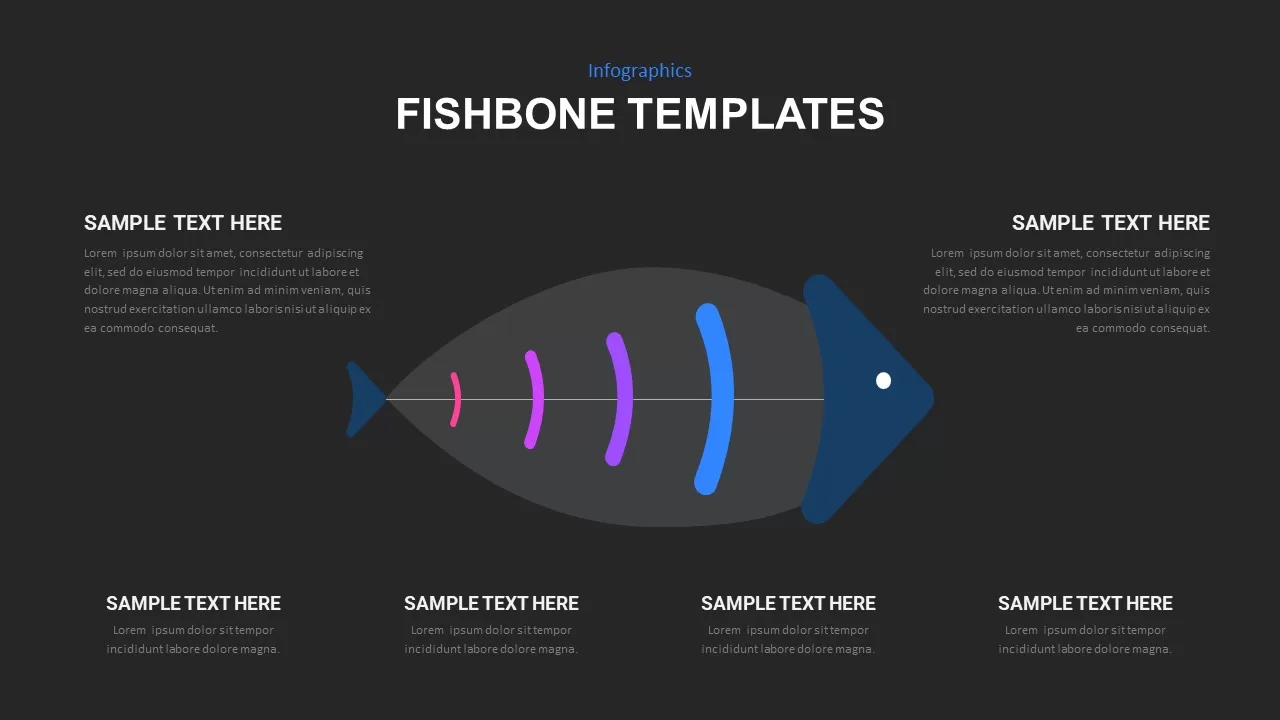
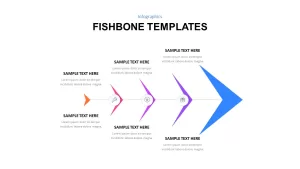
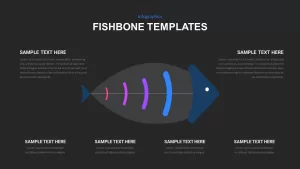
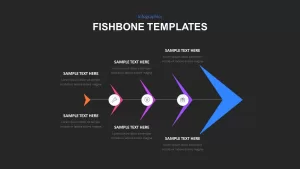
The astonishing fishbone diagram works within the Six Sigma methodology. So, PowerPoint users can download DMAIC or DMADV diagrams to incorporate. There may be political, social, and cultural issues that have denied a company’s potential growth or a product. The bones in the fishbone template represent several causes behind an effect. The head represents effects.
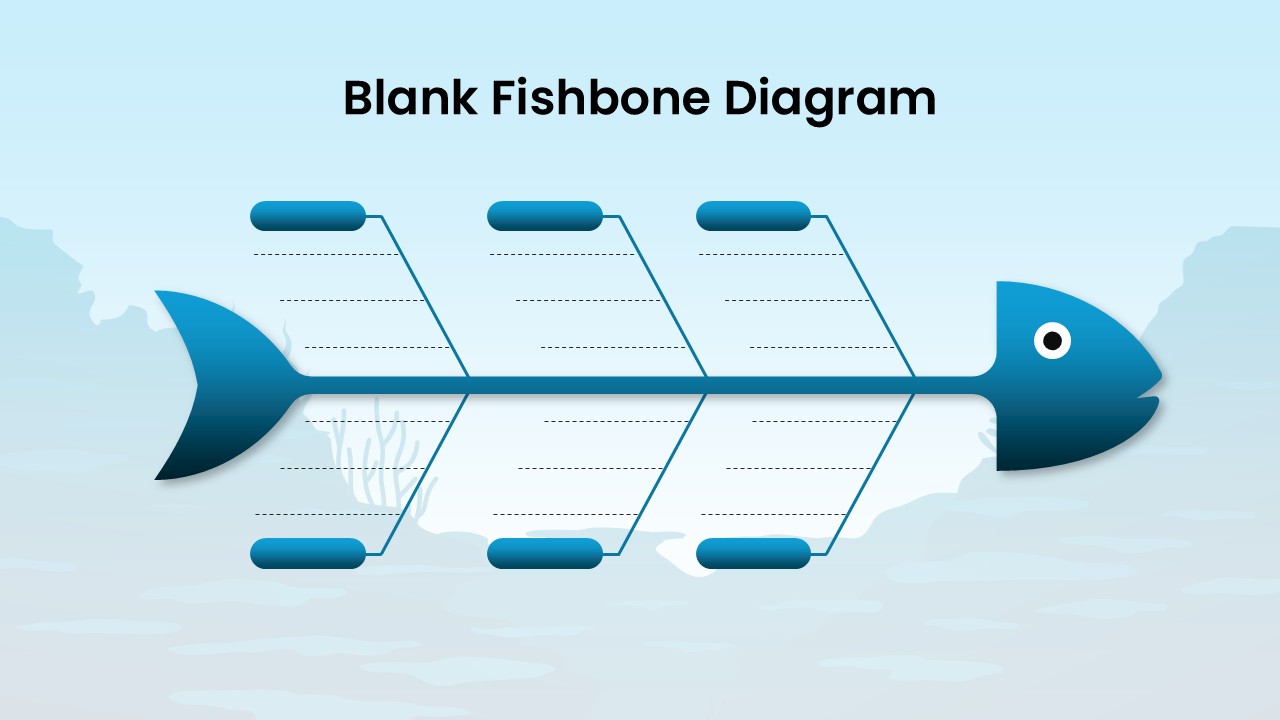
Fishbone template for PowerPoint presentation is an editable diagram that allows modifications, adjustments, and alterations. For example, if you want to reduce the number of bones or add more, you can alter the options. The fishbone structure includes a head, bone, and spine. The Ishikawa is designed for technical and theoretically sound presenters.
Login to download this file

Item ID
SB02073
Related Templates

Three-Section Fishbone Process Diagram template for PowerPoint & Google Slides
Process
Fishbone RCA Diagram Template for PowerPoint & Google Slides
Business Strategy
Fishbone Diagram Overview template for PowerPoint & Google Slides
Infographics
Fishbone Diagram Cause-and-Effect Template for PowerPoint & Google Slides
Process
Free Fishbone Diagram PowerPoint Template
Project
Free
Fishbone Diagram Analysis Template for PowerPoint & Google Slides
Flow Charts
Fishbone Cause and Effect Infographic Template for PowerPoint & Google Slides
Infographics
Fishbone Cause Analysis Diagram Template for PowerPoint & Google Slides
Process
Fishbone Infographic PowerPoint Template
Process
Blank Fishbone Diagram Template for PowerPoint & Google Slides
Process
Fishbone (Ishikawa) Diagram for PowerPoint & Google Slides
Process
5 Why Fishbone Diagram for Root Cause Analysis in PowerPoint & Google Slides
Process
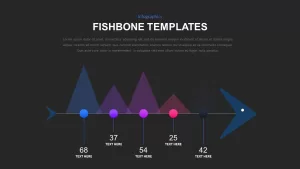
Fishbone Timeline Template
Manufacturing