Cluster Analysis Infographic Diagram Template for PowerPoint & Google Slides

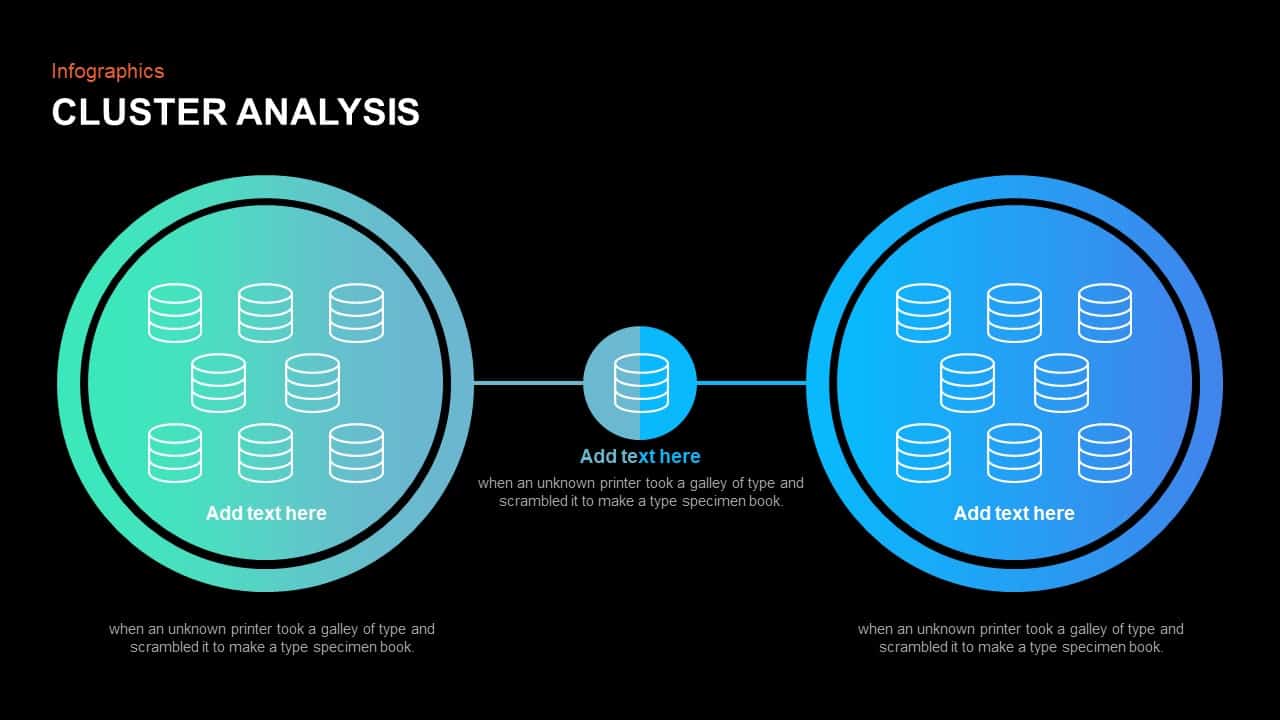

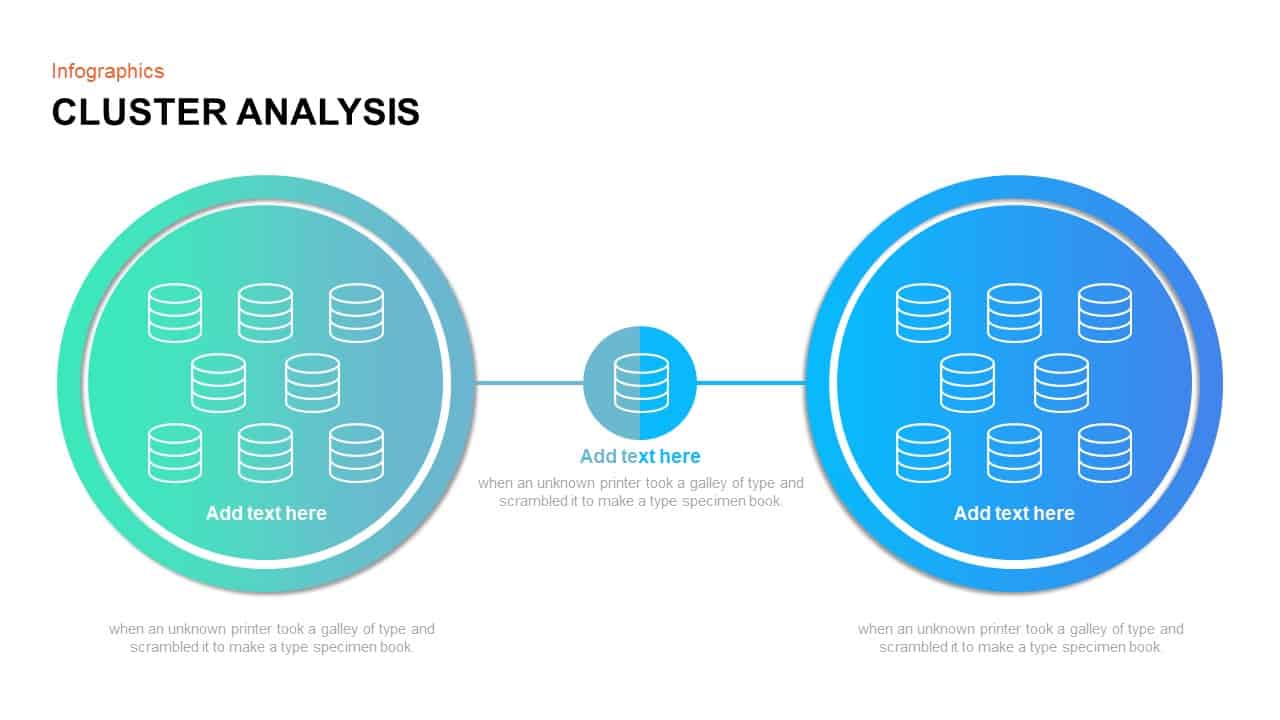
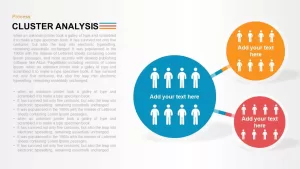

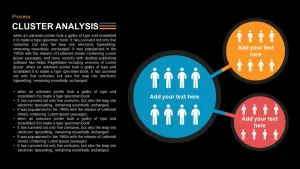

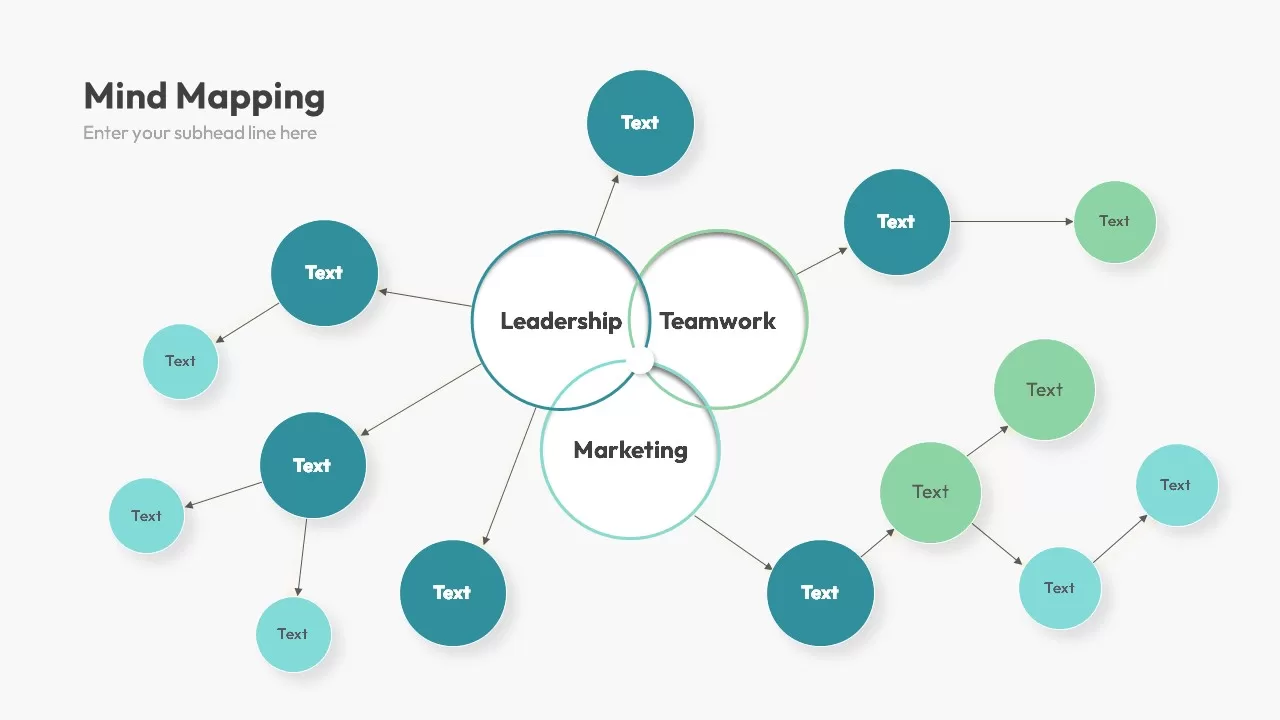
Visualize complex groupings and relationships with this versatile cluster analysis infographic slide. The design features three editable vector circles—a central primary cluster and two secondary clusters—connected by slender colored bars to clearly illustrate data segmentation, demographic splits, or resource allocation pathways. Each circle uses a distinct hue to differentiate groups, and icon placeholders within each cluster allow you to represent people, data points, or system components. Optional dashed or solid connectors guide viewer focus from the core cluster to related subgroups, while text callouts anchor supporting insights without cluttering the diagram.
Engineered on master slides with 100% vector shapes, every element is fully customizable: adjust circle sizes, recolor segments, swap icons, reposition connectors, or modify border weights in seconds to match your brand palette or presentation theme. The flat, minimal aesthetic—enhanced by subtle drop shadows and generous white space—ensures professional polish and maximum readability across devices, from HD projectors to printed handouts. Clean sans-serif typography complements both light and dark theme variants, offering flexible styling options that align with corporate or project branding and maintain contrast in any environment.
Ideal for market segmentation, demographic breakdowns, network architecture overviews, or organizational grouping presentations, this slide empowers teams to turn raw data into intuitive visual narratives. Duplicate clusters to expand beyond three nodes, overlay quantitative labels for value comparisons, or integrate percentage callouts for deeper analysis. Fully compatible with both PowerPoint and Google Slides, the template eliminates formatting headaches and accelerates slide deck development, allowing you to focus on insights rather than design adjustments.
Who is it for
Marketing analysts, data scientists, and strategy consultants will leverage this slide to present segmentation results, user personas, or network topologies. Project managers, HR teams, and operations directors can also use it to map organizational units, resource pools, or workflow clusters.
Other Uses
Beyond data segmentation, repurpose this template for ecosystem mapping, customer journey touchpoints, or supply chain node analysis. Swap icons to depict technology stacks, duplicate circles for additional clusters, or recolor segments for thematic consistency.
Login to download this file

Item ID
SB01132
Related Templates

Multi-Cluster Mind Map Infographic Template for PowerPoint & Google Slides
Mind Maps

Tri-Cluster Mind Map Infographic Template for PowerPoint & Google Slides
Mind Maps
Free Hexagon Slide Infographics Template
Infographics
Free
Animated Multi-Gear Cluster Infographic Template for PowerPoint & Google Slides
Process
Three-Branch Cluster Diagram Presentation Template for PowerPoint & Google Slides
Mind Maps

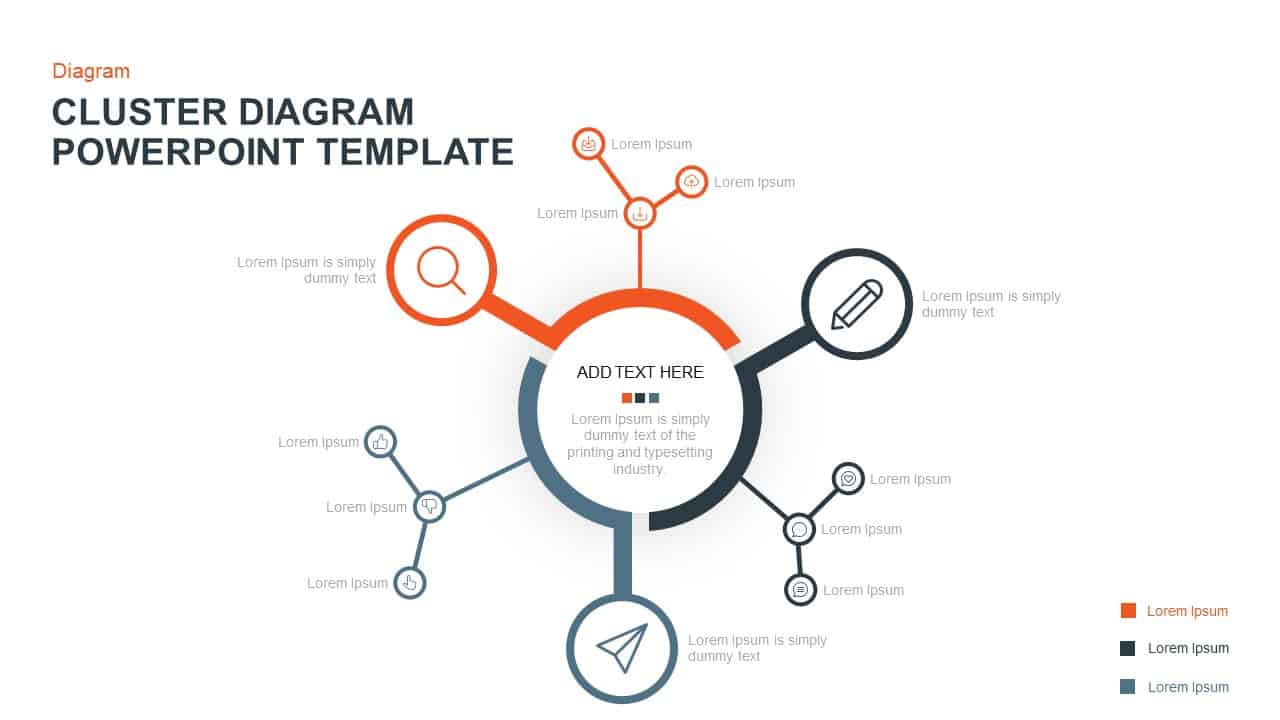
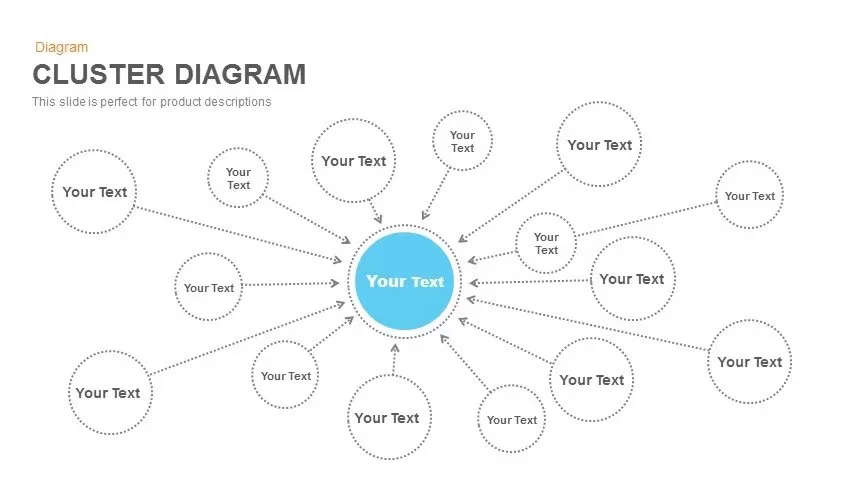
Cluster Diagram for PowerPoint & Google Slides
Process
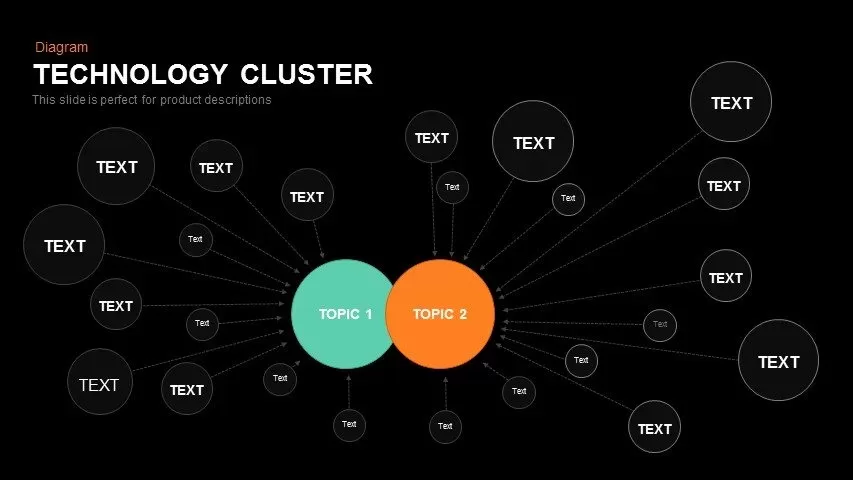
Technology Cluster PowerPoint Template
Infographics
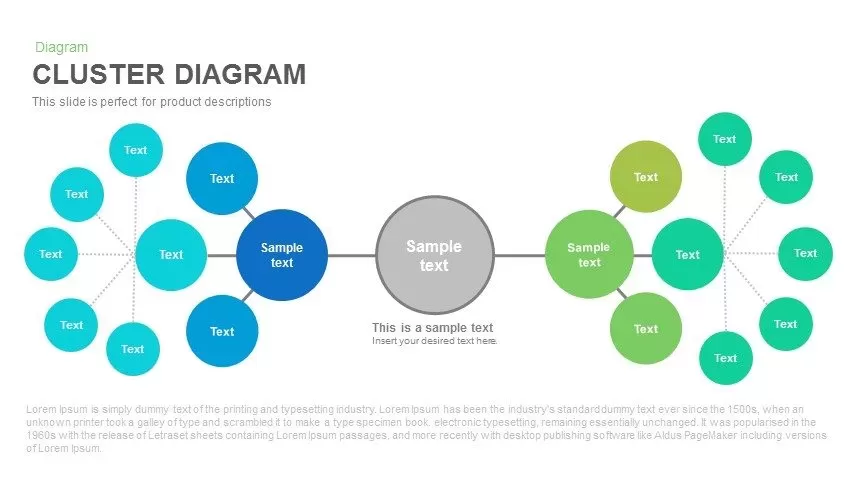
Cluster Diagram for PowerPoint & Google Slides
Mind Maps
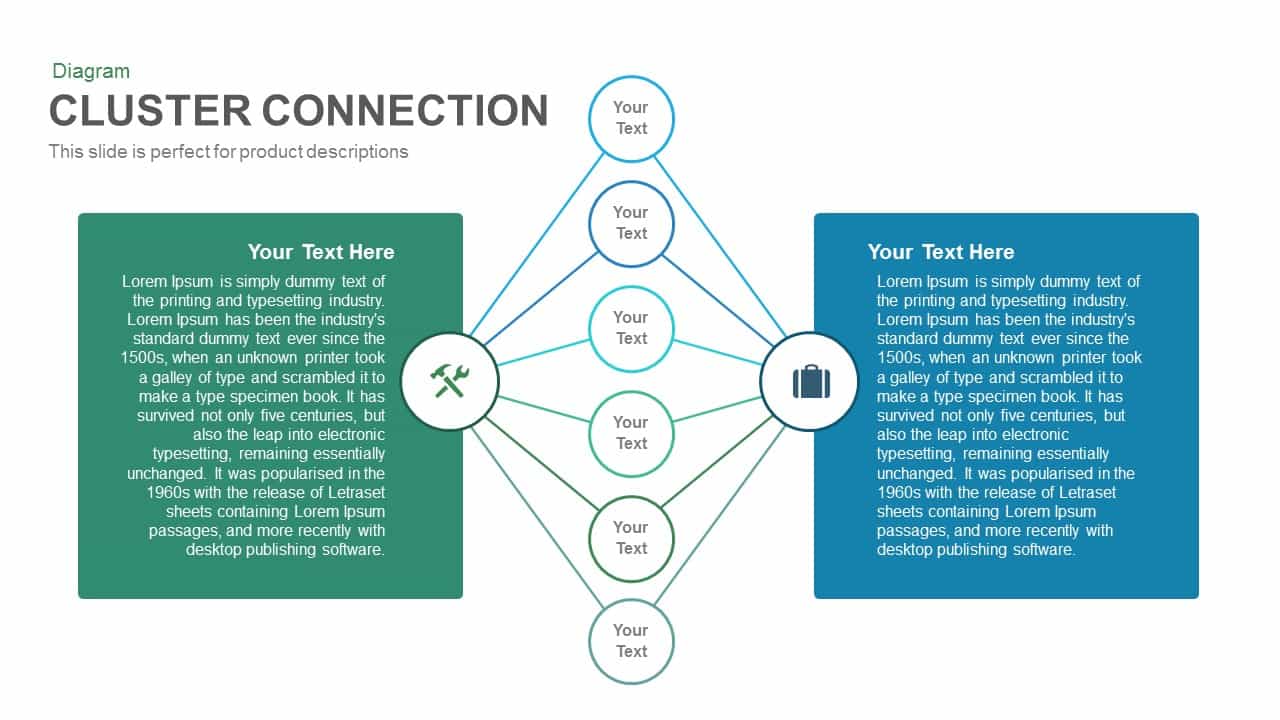
Cluster Connection PowerPoint Template
Process

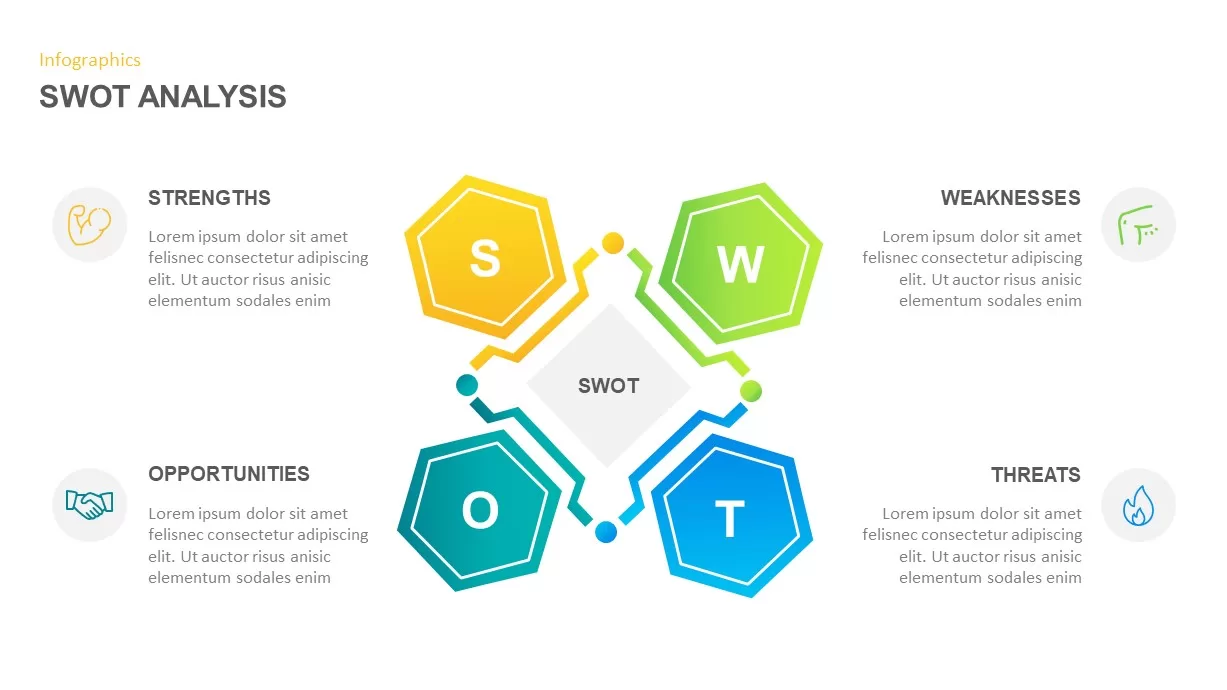
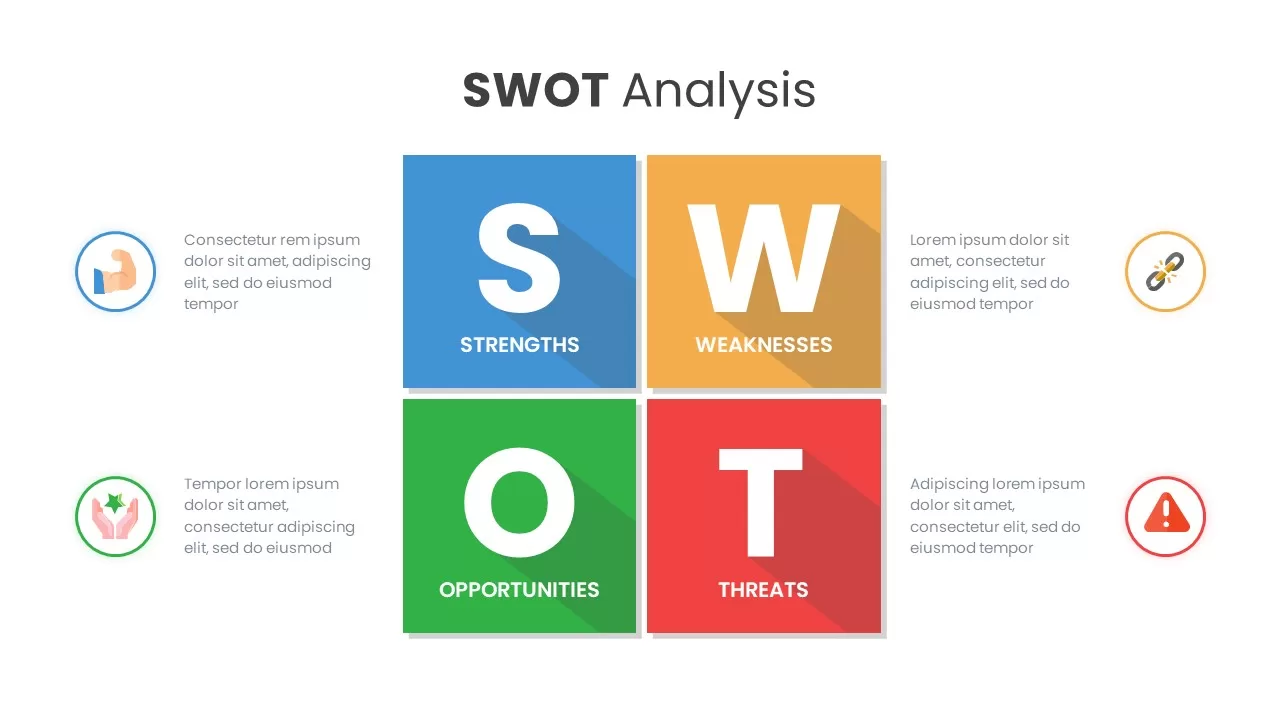
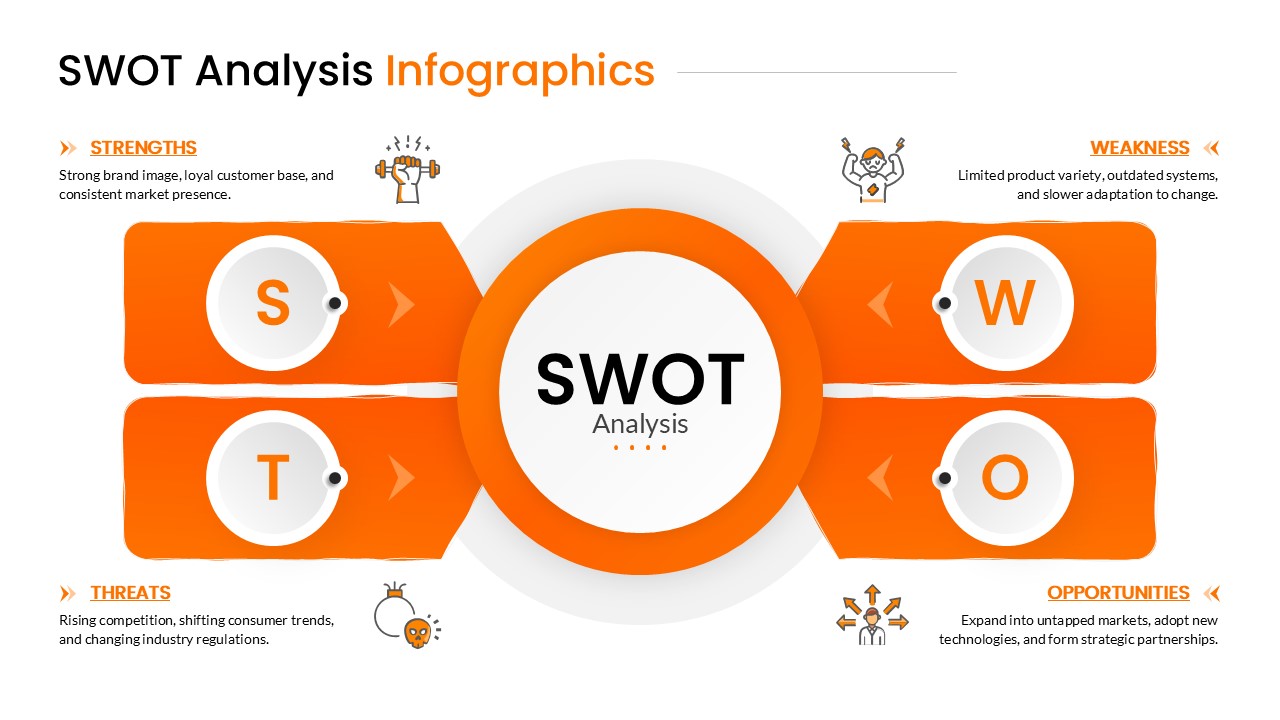
SWOT Analysis PowerPoint Slide
SWOT
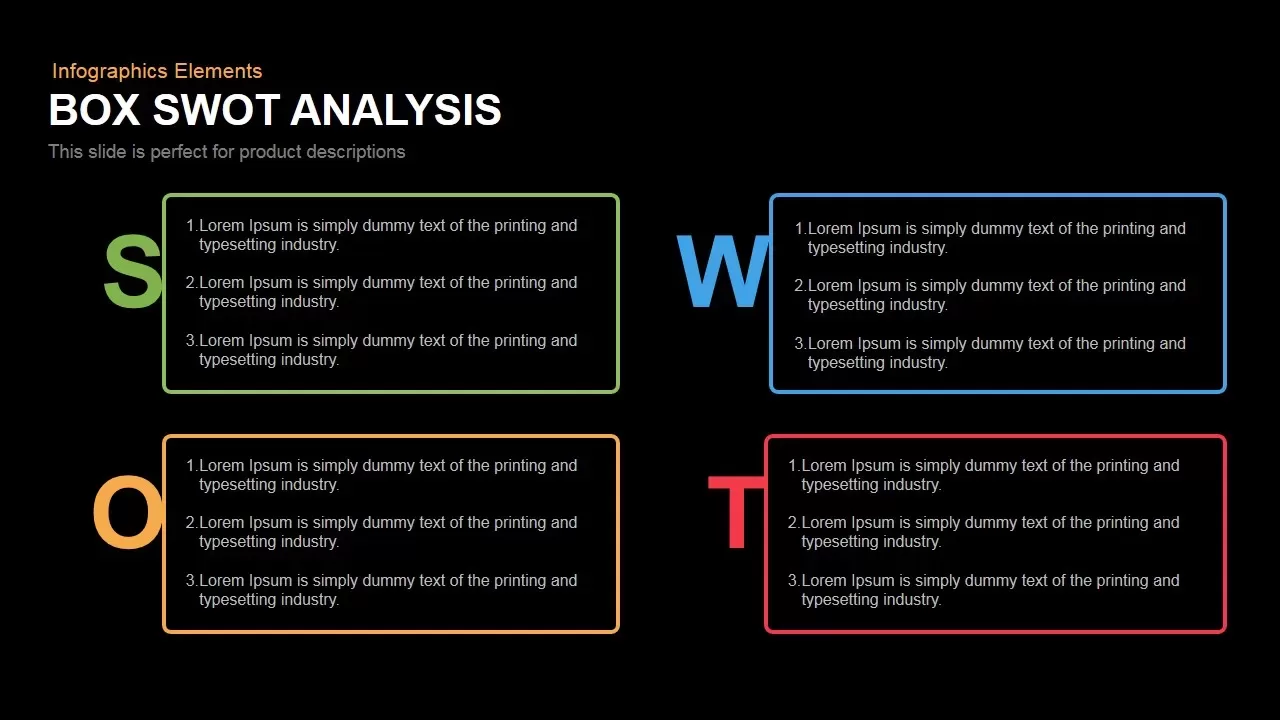
Box SWOT Analysis Infographic Template for PowerPoint & Google Slides
SWOT
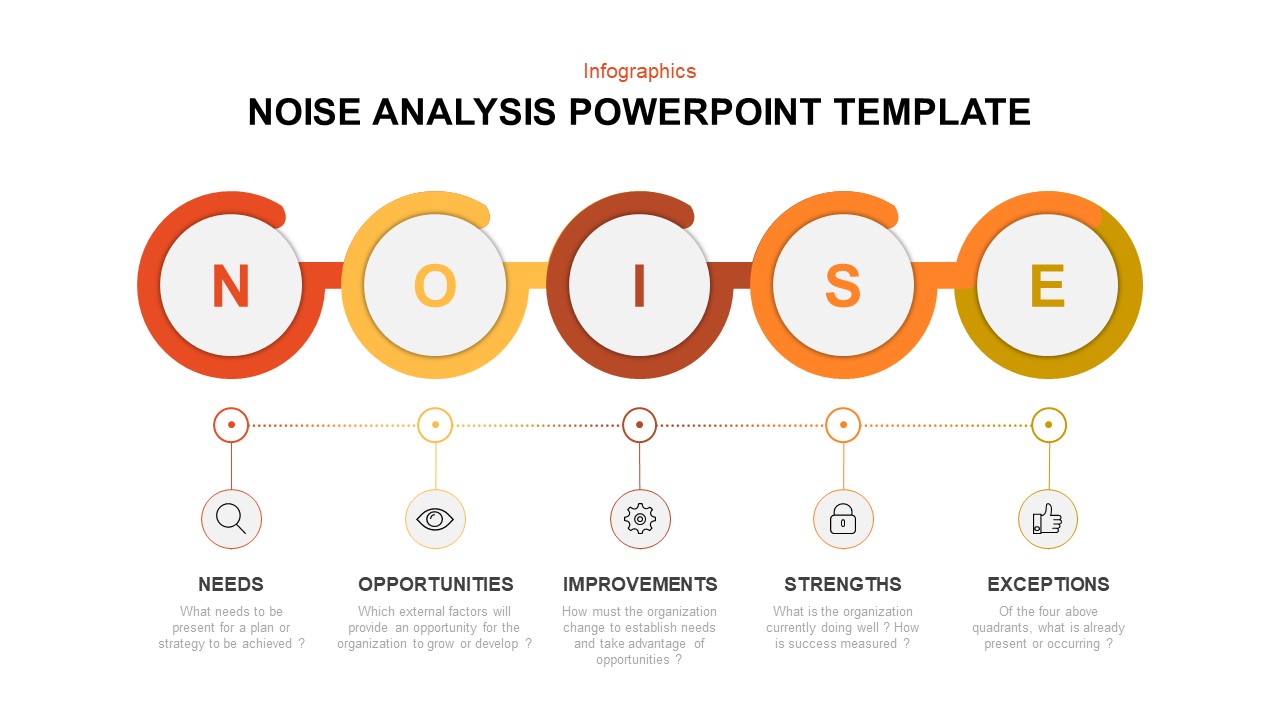
Modern Noise Analysis Infographic Template for PowerPoint & Google Slides
Process
Simple SWOT Analysis PowerPoint Template
SWOT
3D Cube SWOT Analysis Infographic Template for PowerPoint & Google Slides
SWOT
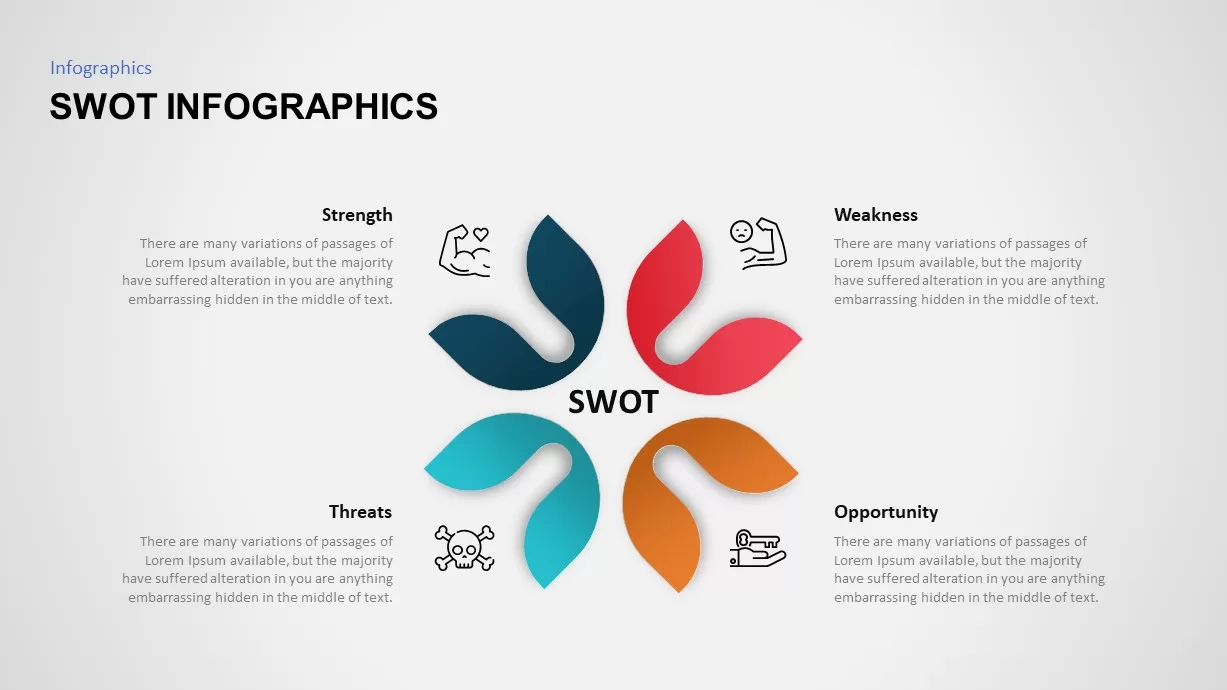
SWOT Analysis Petal Infographic Template for PowerPoint & Google Slides
SWOT
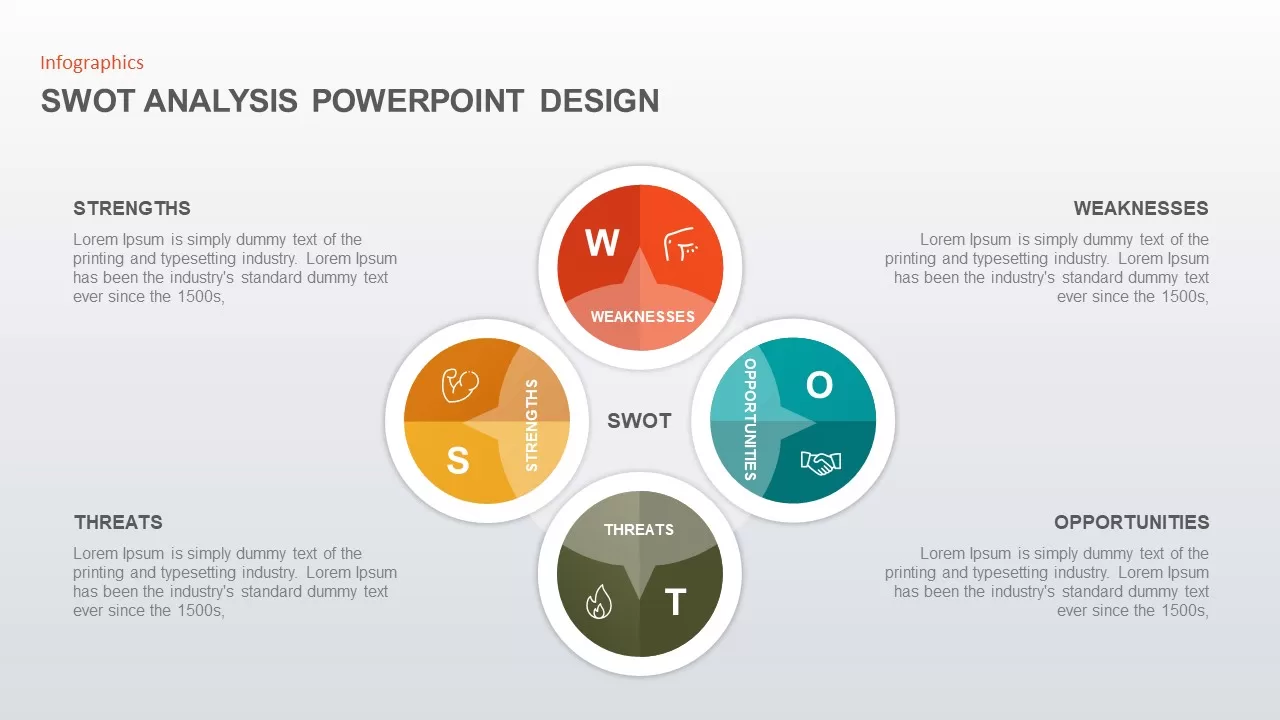
SWOT Analysis Circular Infographic Template for PowerPoint & Google Slides
SWOT
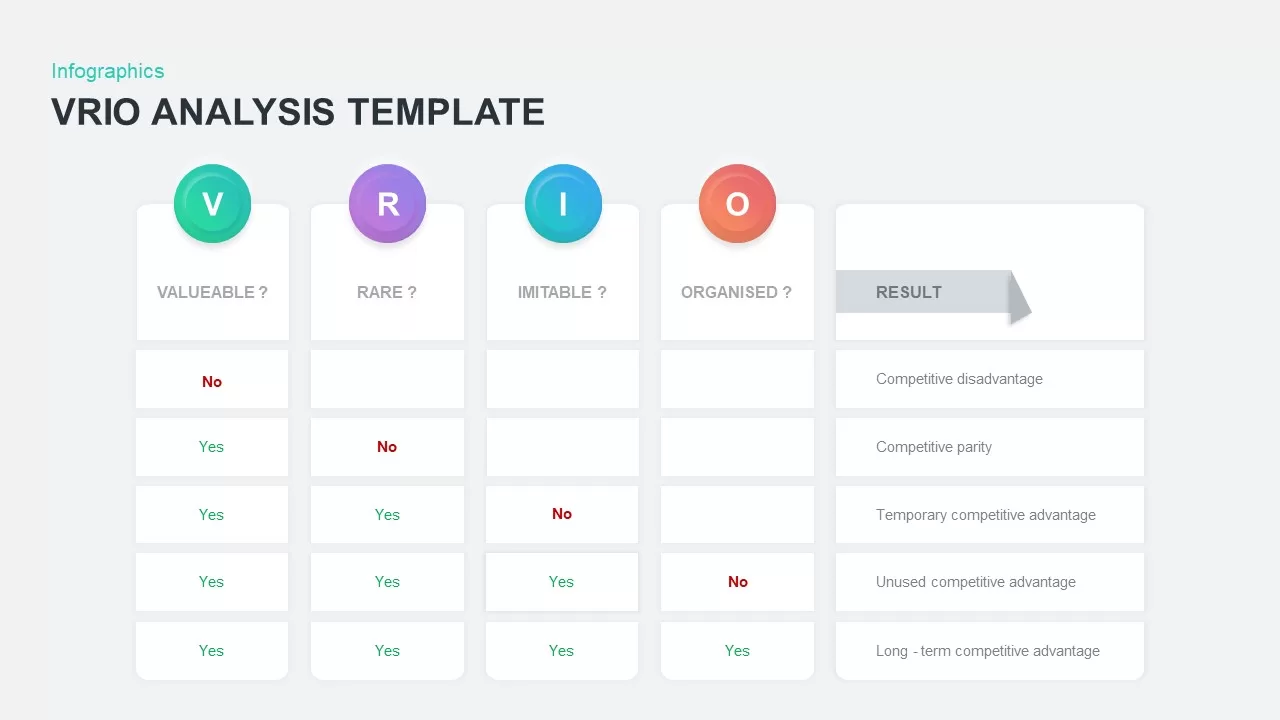
VRIO Analysis Infographic Template for PowerPoint & Google Slides
Business Strategy
SWOT Analysis Grid Infographic Template for PowerPoint & Google Slides
SWOT
SWOT Analysis Template for PowerPoint Presentation
SWOT
Root Cause Analysis Infographic Pack Template for PowerPoint & Google Slides
Process
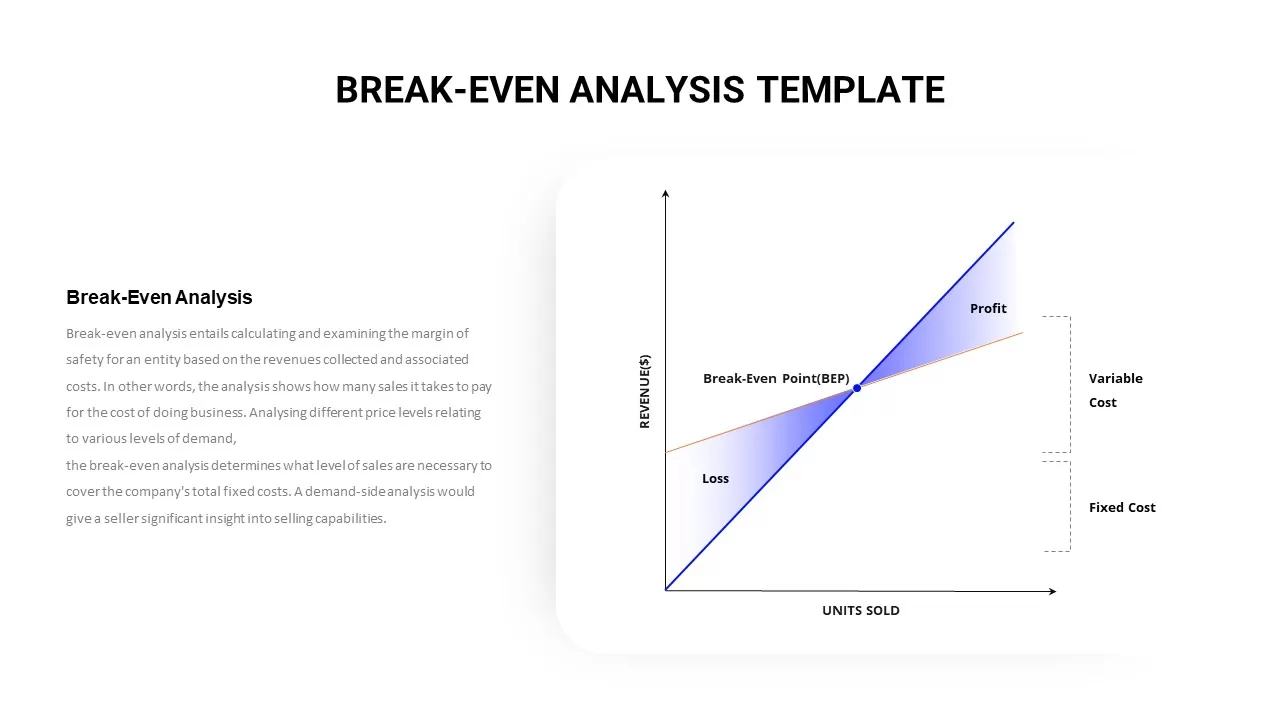
Break-Even Analysis Infographic Template for PowerPoint & Google Slides
Revenue
Category Analysis Comparison Infographic Template for PowerPoint & Google Slides
Comparison
SWOT Analysis Infographic with Circular Icons Template for PowerPoint & Google Slides
SWOT
Orange SWOT Analysis Infographic Template for PowerPoint & Google Slides
SWOT
Mobile User Data Analysis Infographic for PowerPoint & Google Slides
Process
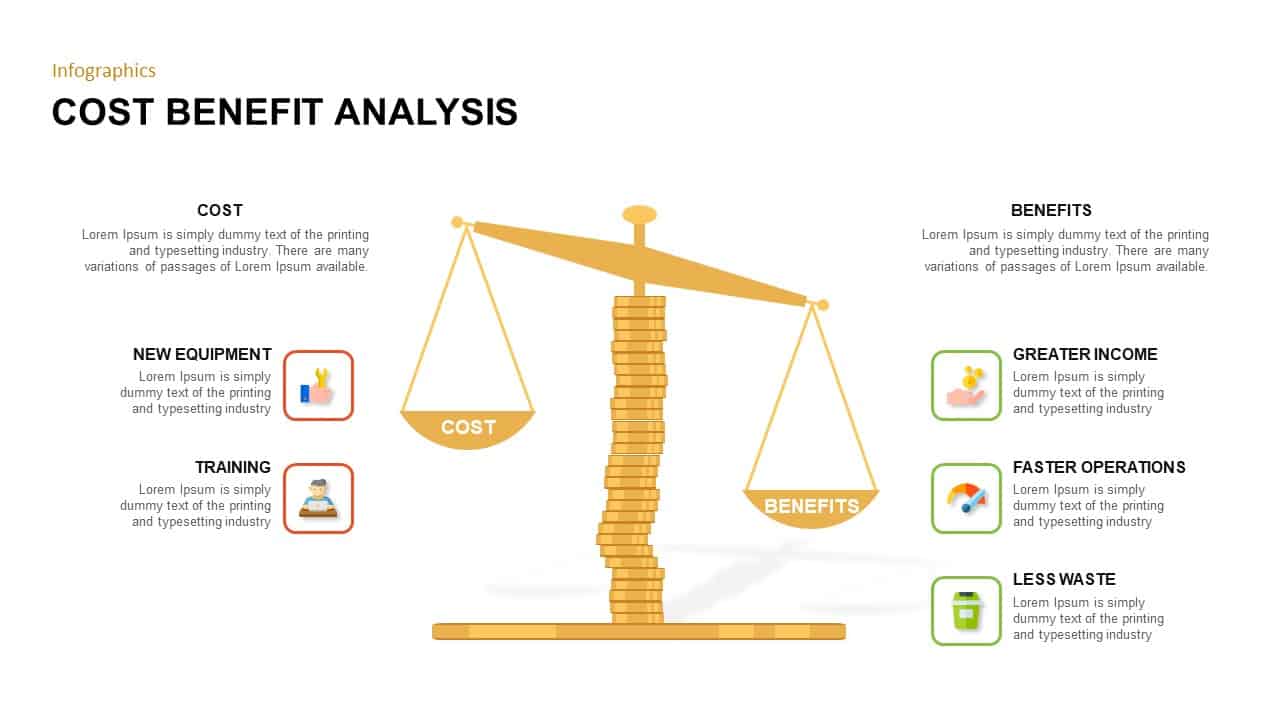
Cost Benefit Analysis PowerPoint Template
Comparison
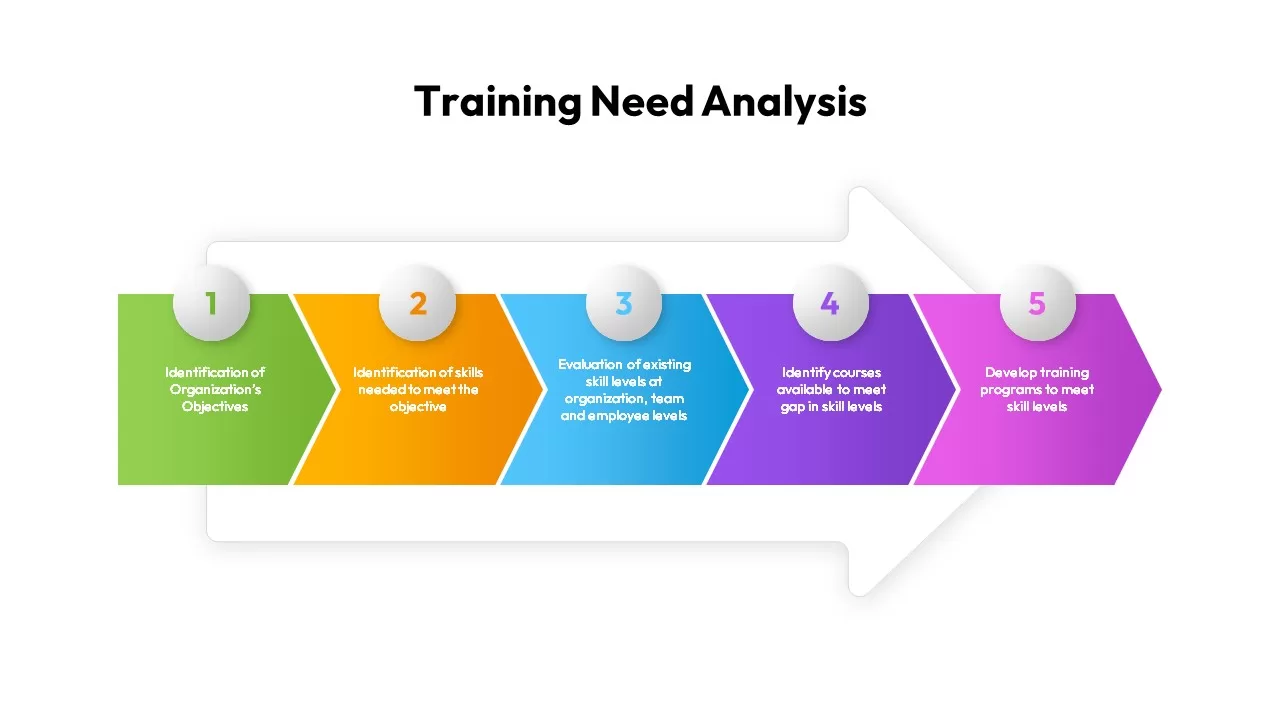
Training Need Analysis Process infographic for PowerPoint & Google Slides
Employee Performance
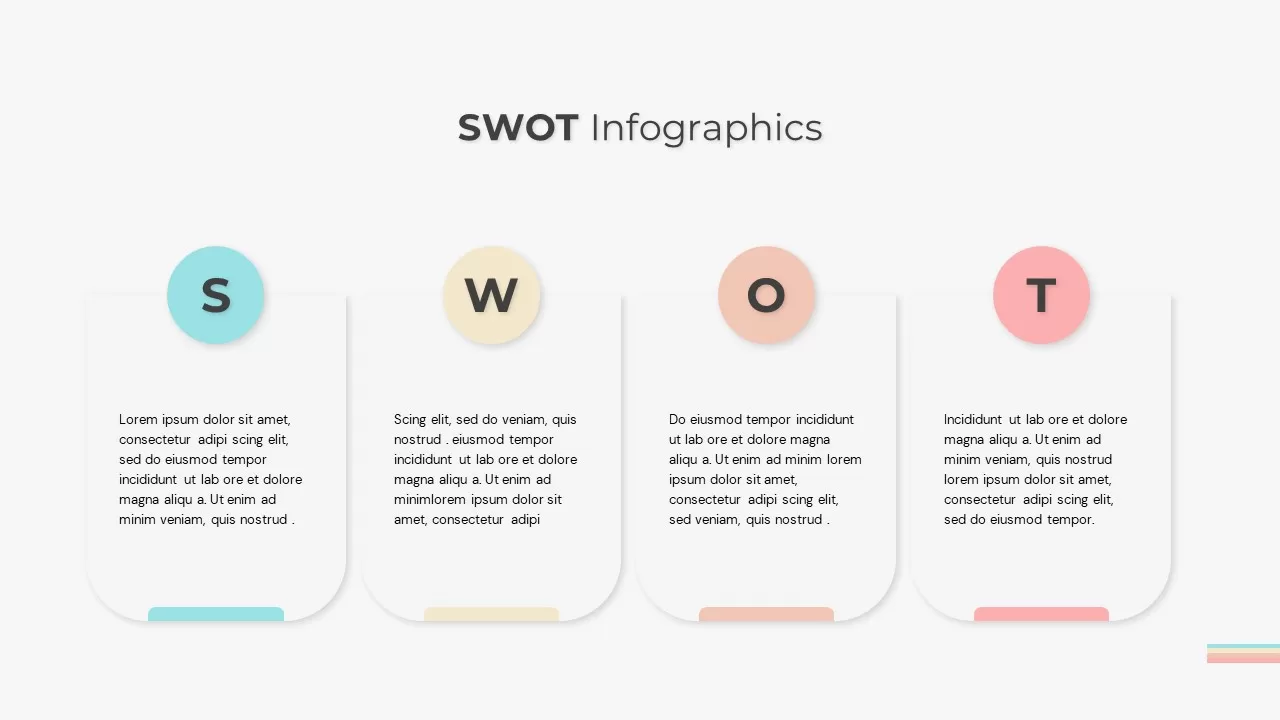
SWOT Analysis Infographic Slide for PowerPoint & Google Slides
SWOT
Modern Circle SWOT Analysis Diagram Template for PowerPoint & Google Slides
SWOT
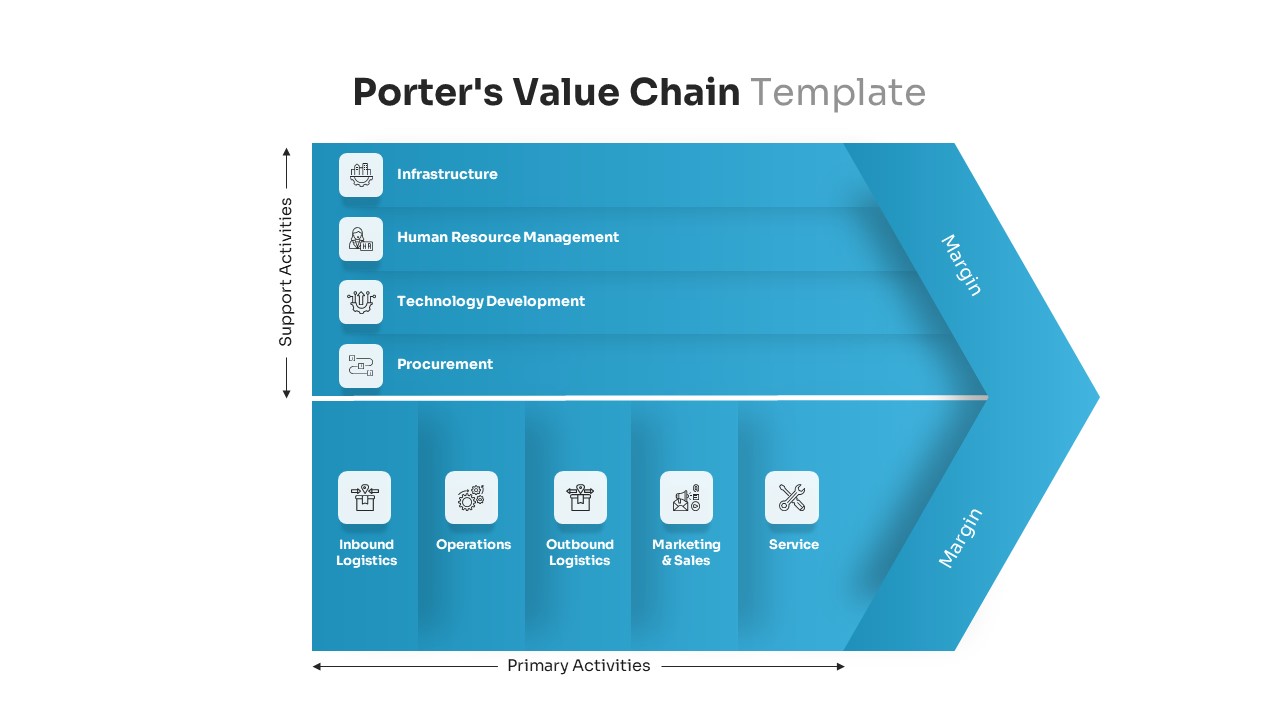
Porter’s Value Chain Analysis Diagram Template for PowerPoint & Google Slides
Business Strategy
Editable Force Field Analysis Diagram Template for PowerPoint & Google Slides
Business Plan
Professional PESTEL Analysis Diagram Template for PowerPoint & Google Slides
PEST
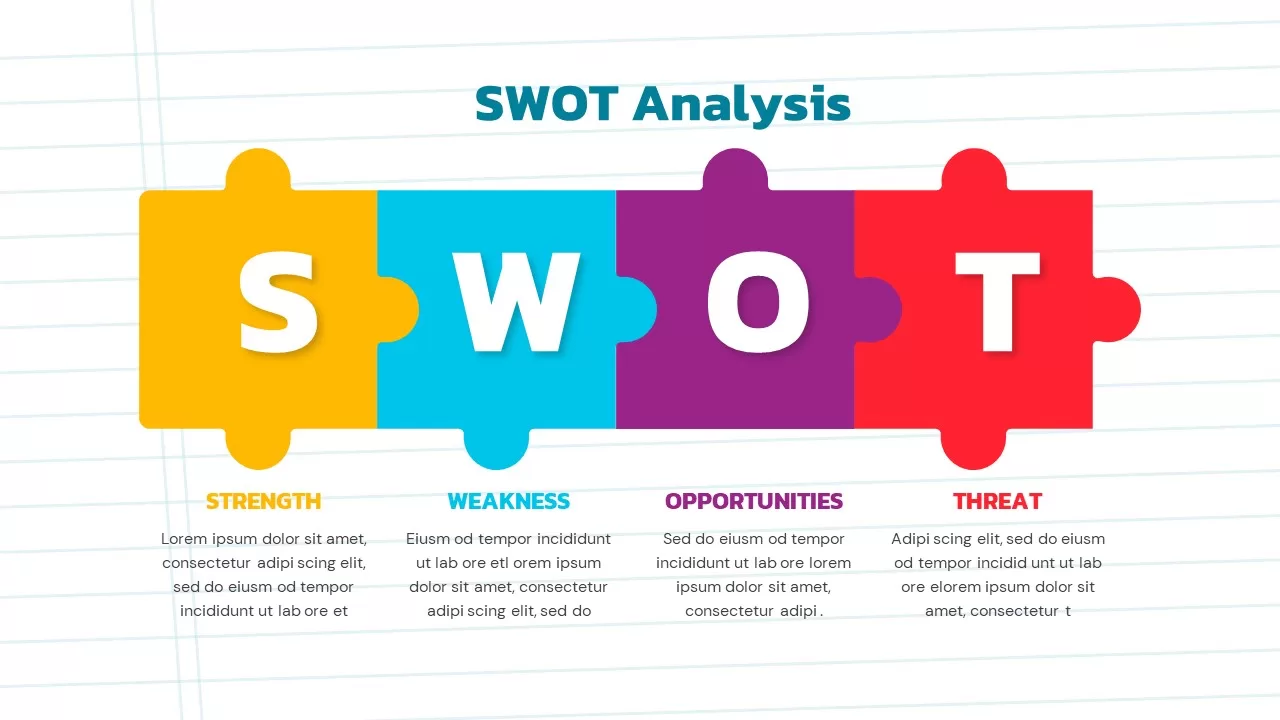
Puzzle-Style SWOT Analysis Table Diagram Template for PowerPoint & Google Slides
SWOT
PEST Analysis Circular Diagram Template for PowerPoint & Google Slides
PEST
Pestle Analysis PowerPoint Template and Slides
PEST
SWOT Analysis Gear Diagram Slide Template for PowerPoint & Google Slides
SWOT

Interactive Gap Analysis Puzzle Diagram Template for PowerPoint & Google Slides
Gap
Fishbone Diagram Analysis Template for PowerPoint & Google Slides
Flow Charts
Four-Quadrant SWOT Analysis Diagram Template for PowerPoint & Google Slides
SWOT
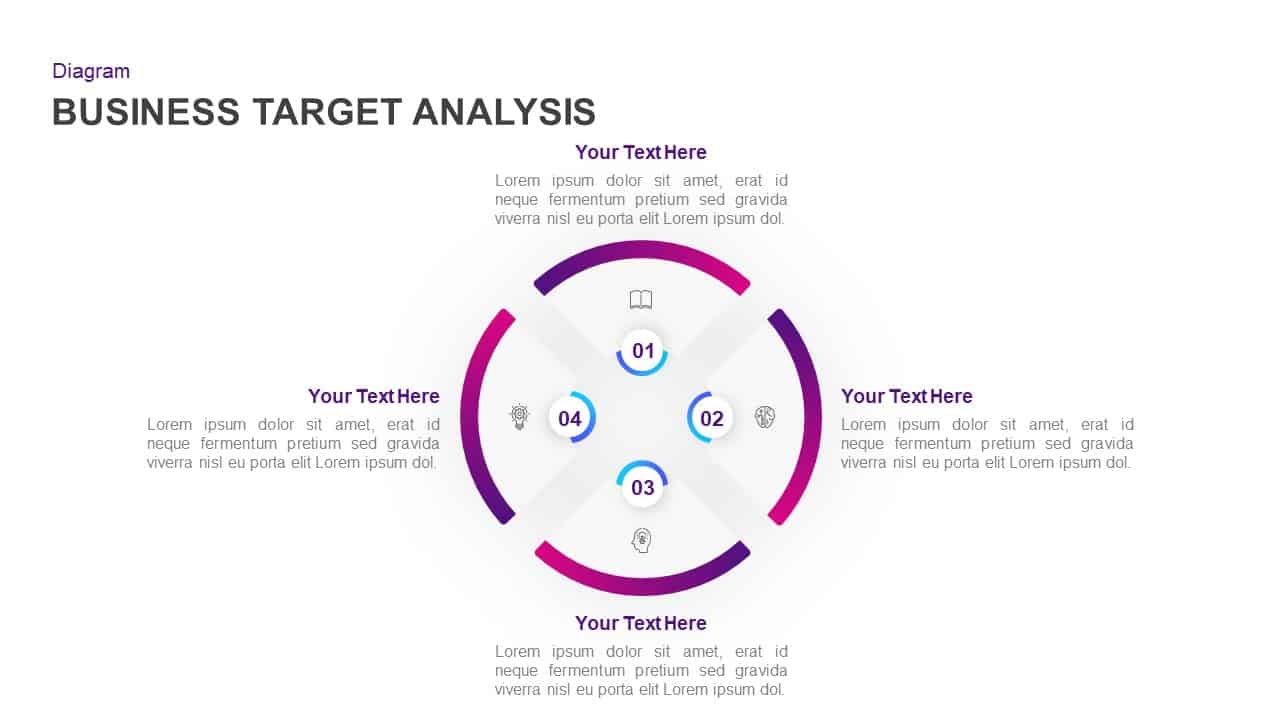
Business Target Analysis Diagram Template for PowerPoint & Google Slides
Circular
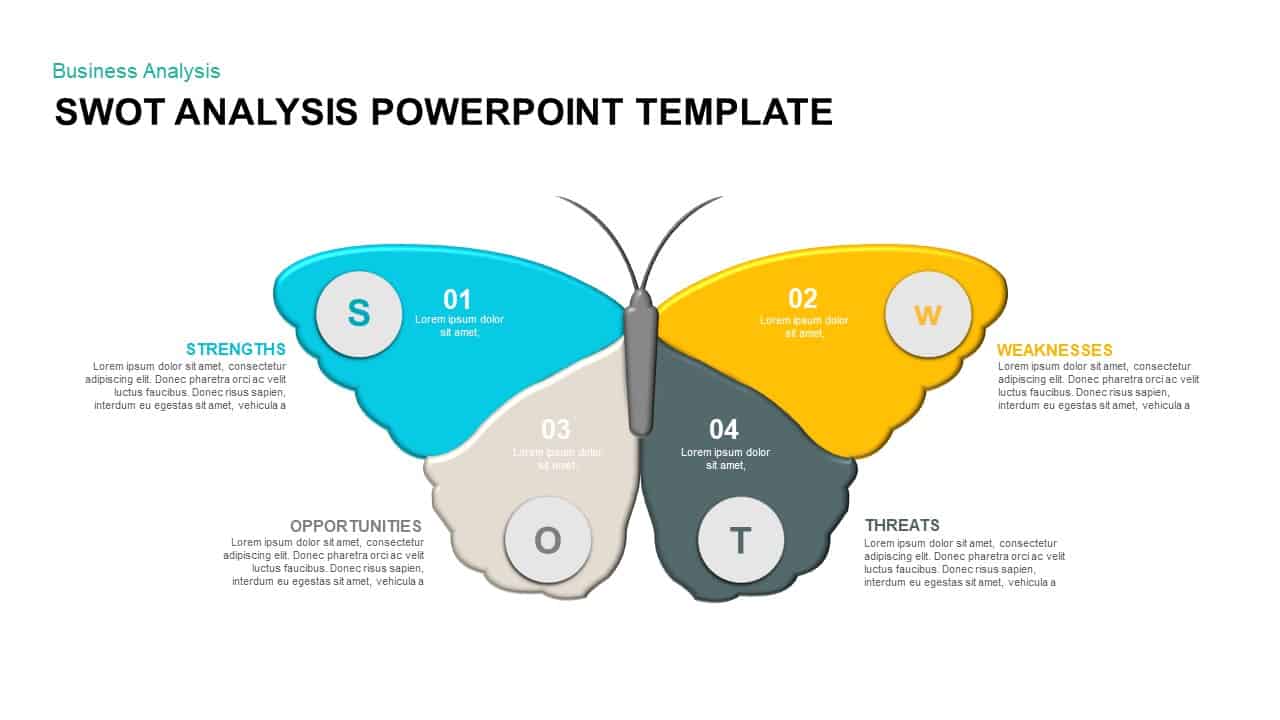
Butterfly SWOT Analysis Diagram Template for PowerPoint & Google Slides
SWOT
Four-Part SWOT Analysis Diagram Template for PowerPoint & Google Slides
SWOT
Fishbone Cause Analysis Diagram Template for PowerPoint & Google Slides
Process
IQ Scale Analysis Diagram template for PowerPoint & Google Slides
Employee Performance
SWOT Analysis Editable Template Infographics
Opportunities Challenges
Six-Step Business Analysis Diagram template for PowerPoint & Google Slides
Circular
Business Process Analysis Cycle Diagram Template for PowerPoint & Google Slides
Business Strategy
Free Root Cause Analysis PowerPoint Template
Process
Free
Experience Curve Analysis Diagram Template for PowerPoint & Google Slides
Business Strategy
Cost-Volume-Profit Analysis Diagram Template for PowerPoint & Google Slides
Finance

Colorful SWOT Analysis Diagram Template for PowerPoint & Google Slides
SWOT
Bottleneck PowerPoint Template
Process
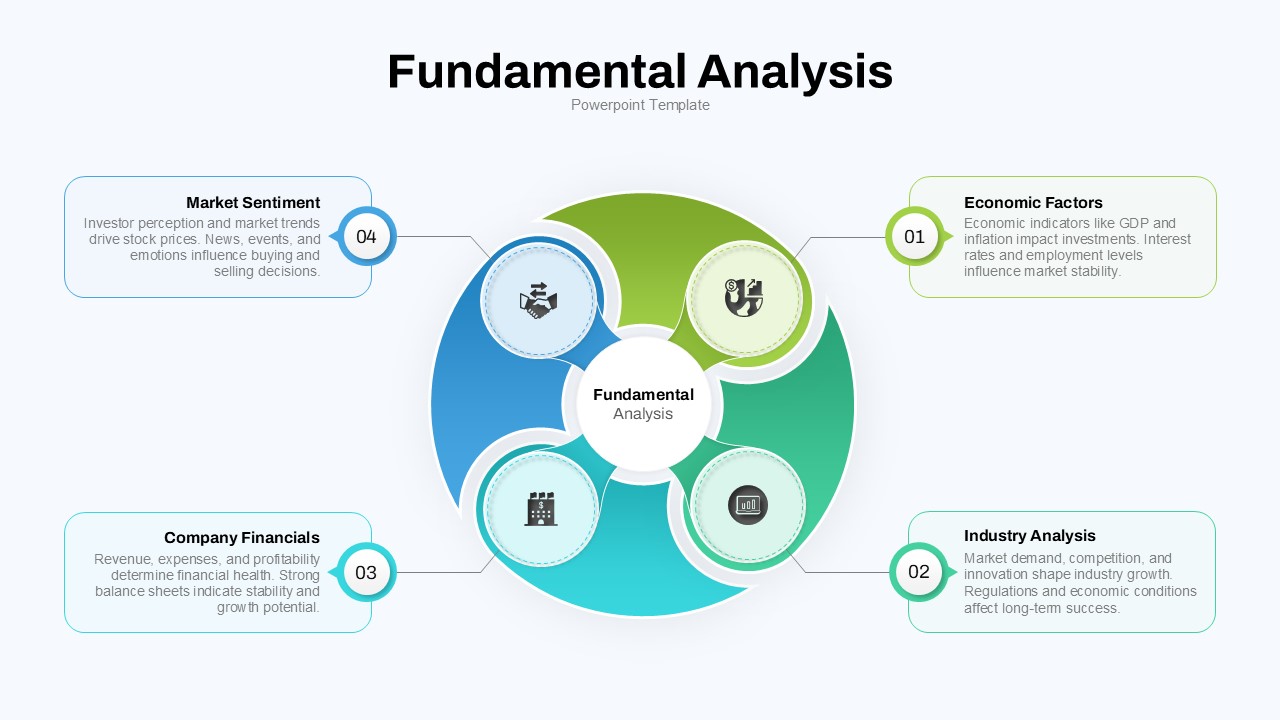
Fundamental Analysis Circular Diagram Template for PowerPoint & Google Slides
Circular
Cultural Web Analysis Circular Diagram Template for PowerPoint & Google Slides
Circular
DESTEP Marketing Analysis Diagram Template for PowerPoint & Google Slides
Circular
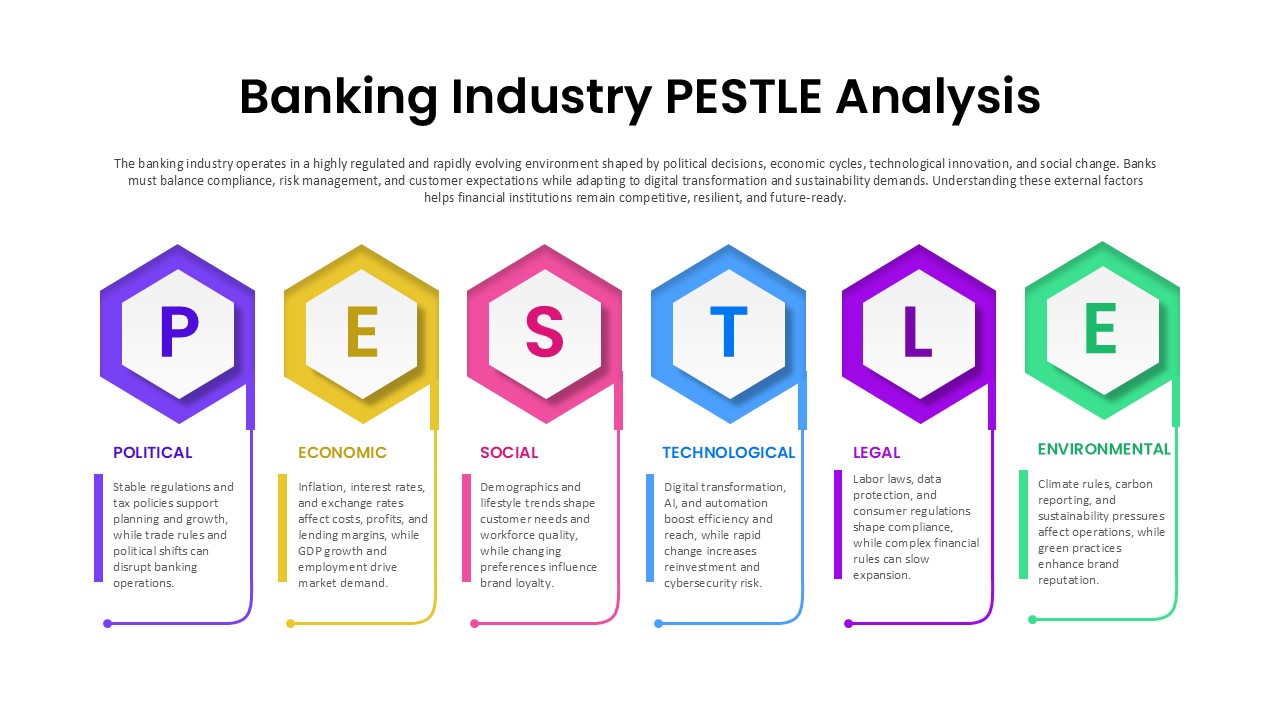
Banking Industry PESTLE Analysis Diagram Template for PowerPoint & Google Slides
PEST
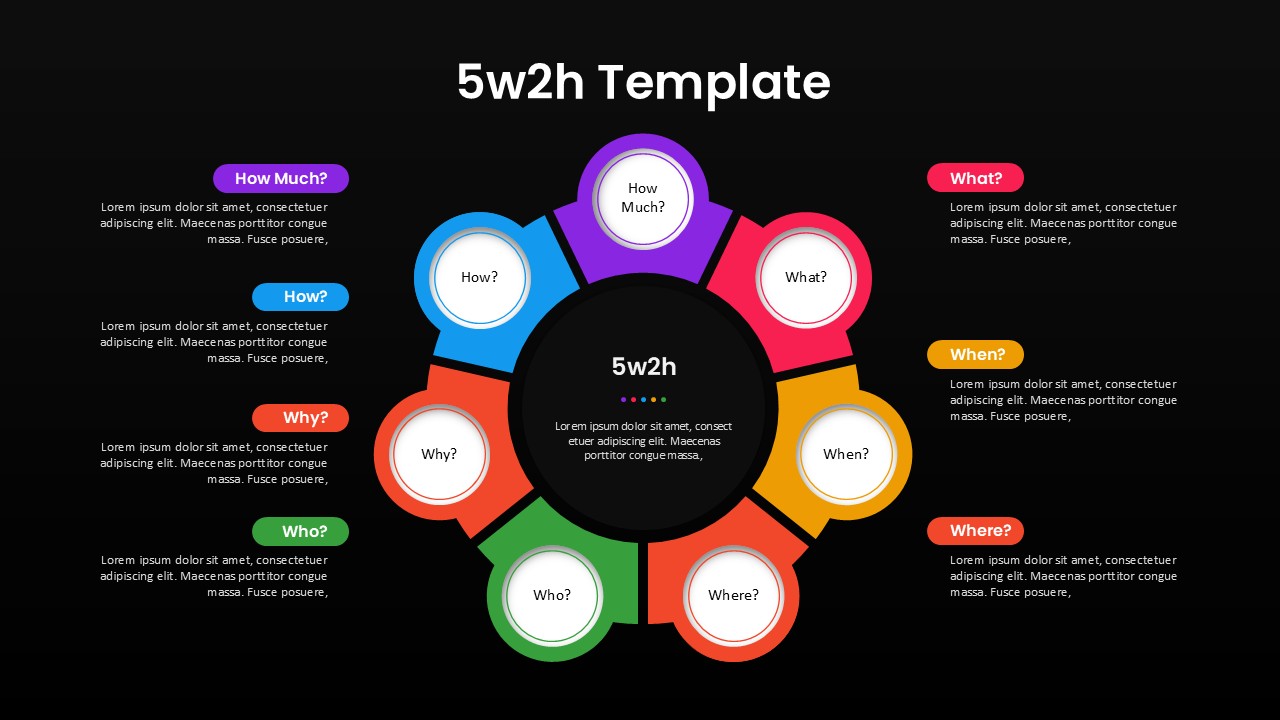
5W2H Analysis Radial Diagram Template for PowerPoint & Google Slides
Decision Tree
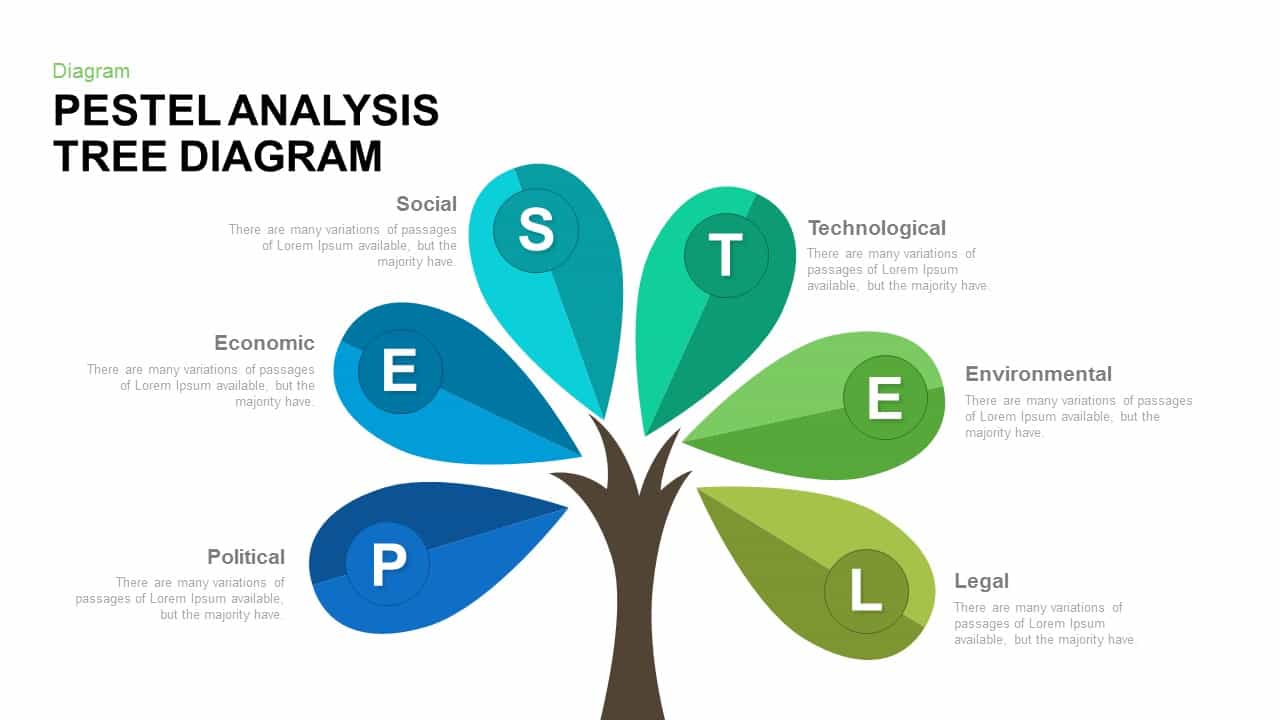
PESTEL Analysis Tree Diagram PowerPoint Template and Google Slides
Process
5 Why Fishbone Diagram for Root Cause Analysis in PowerPoint & Google Slides
Process
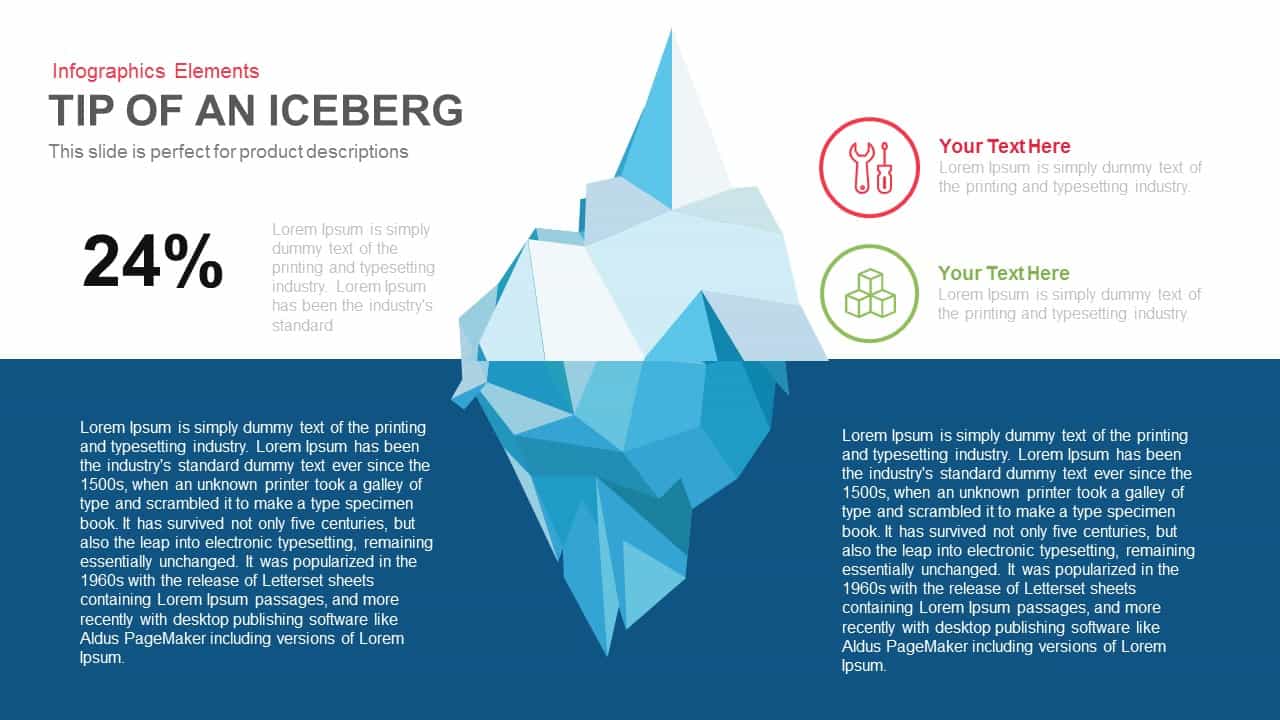
Tip of an Iceberg Infographic Diagram template for PowerPoint & Google Slides
Iceberg Charts
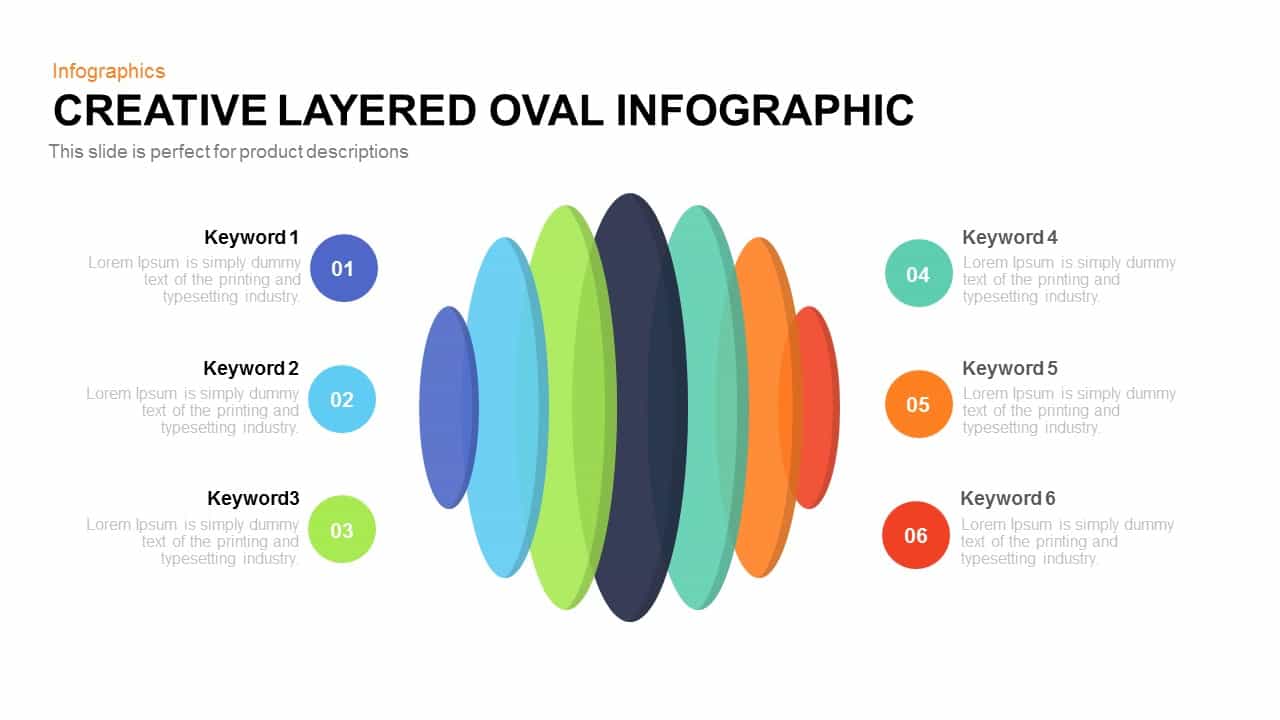
Creative Layered Oval Infographic Diagram Template for PowerPoint & Google Slides
Process
Six Section Circular Infographic Diagram Template for PowerPoint & Google Slides
Circular
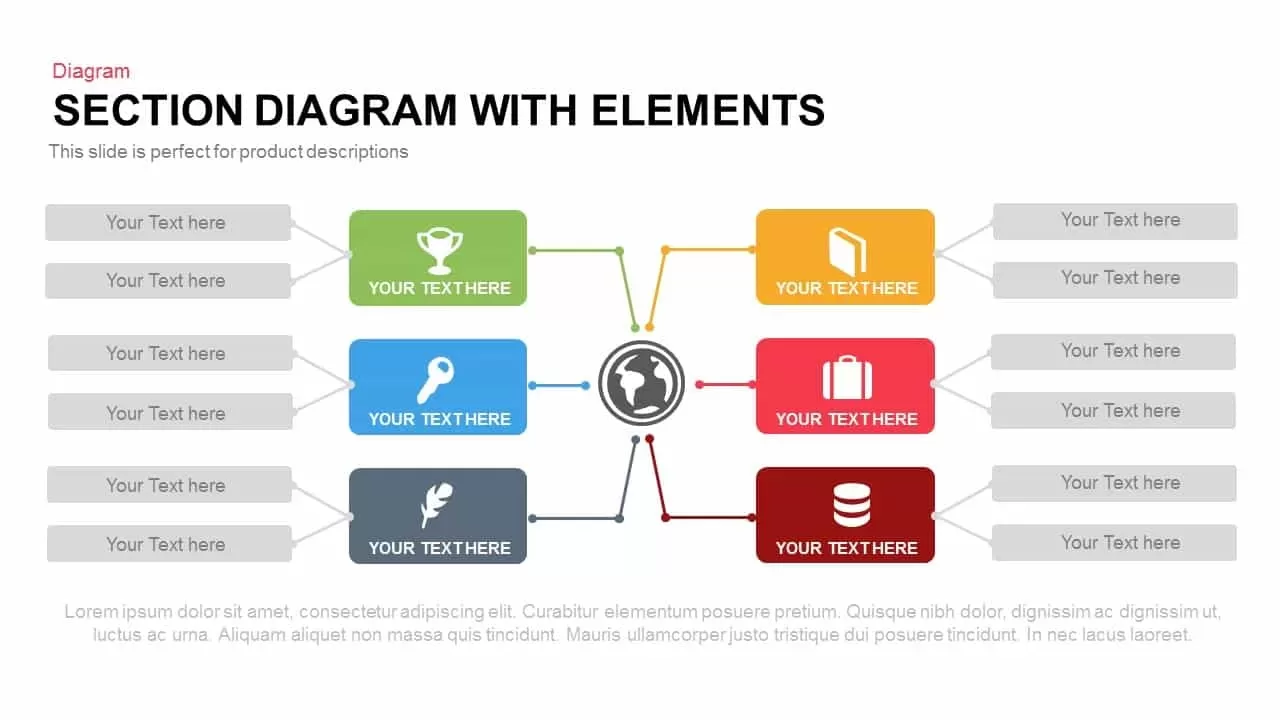
Section Diagram Elements Infographic Template for PowerPoint & Google Slides
Process
Cause and Effect Diagram Infographic Template for PowerPoint & Google Slides
Bar/Column
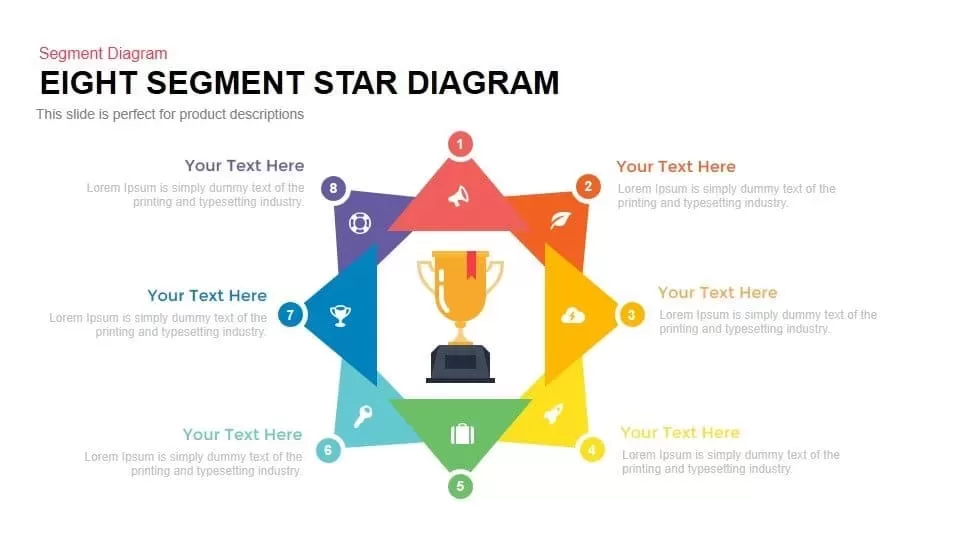
8 Segment Star Diagram Template for PowerPoint
Process
Four-Stage Linear Infographic Diagram Template for PowerPoint & Google Slides
Process
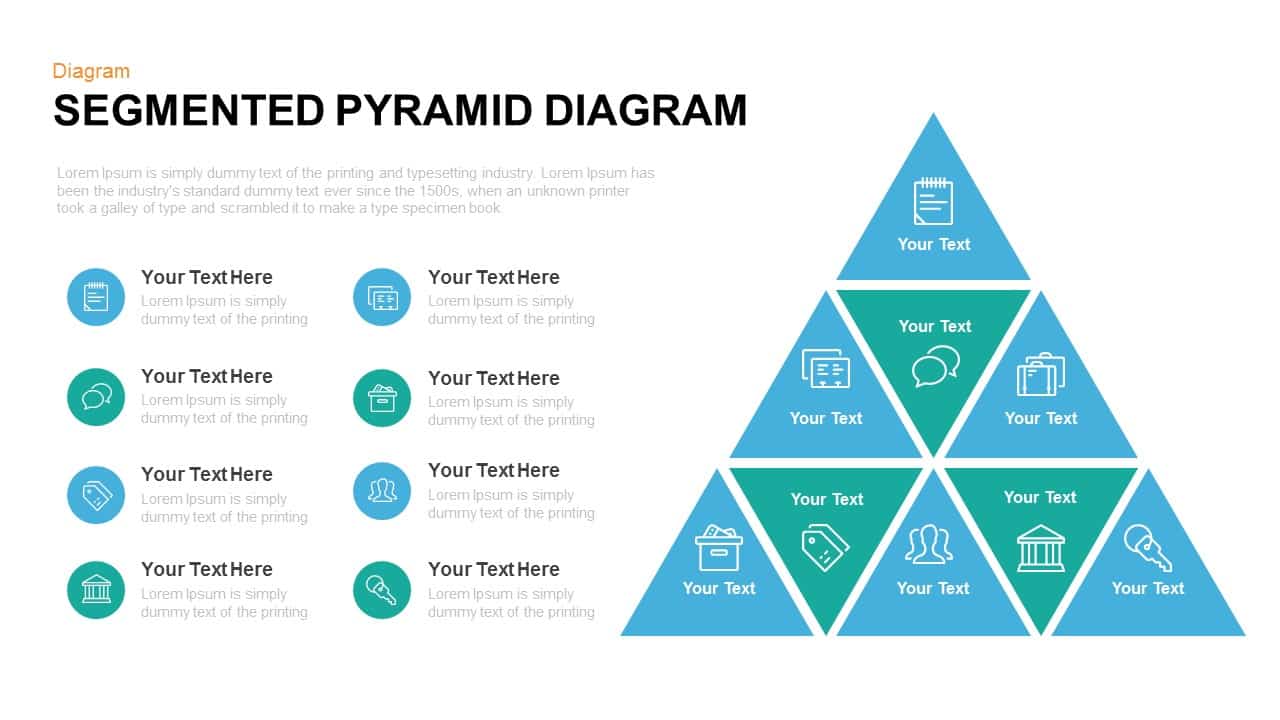
Segmented Pyramid Diagram Infographic Template for PowerPoint & Google Slides
Pyramid
Four-Section Arrow Infographic Diagram Template for PowerPoint & Google Slides
Arrow
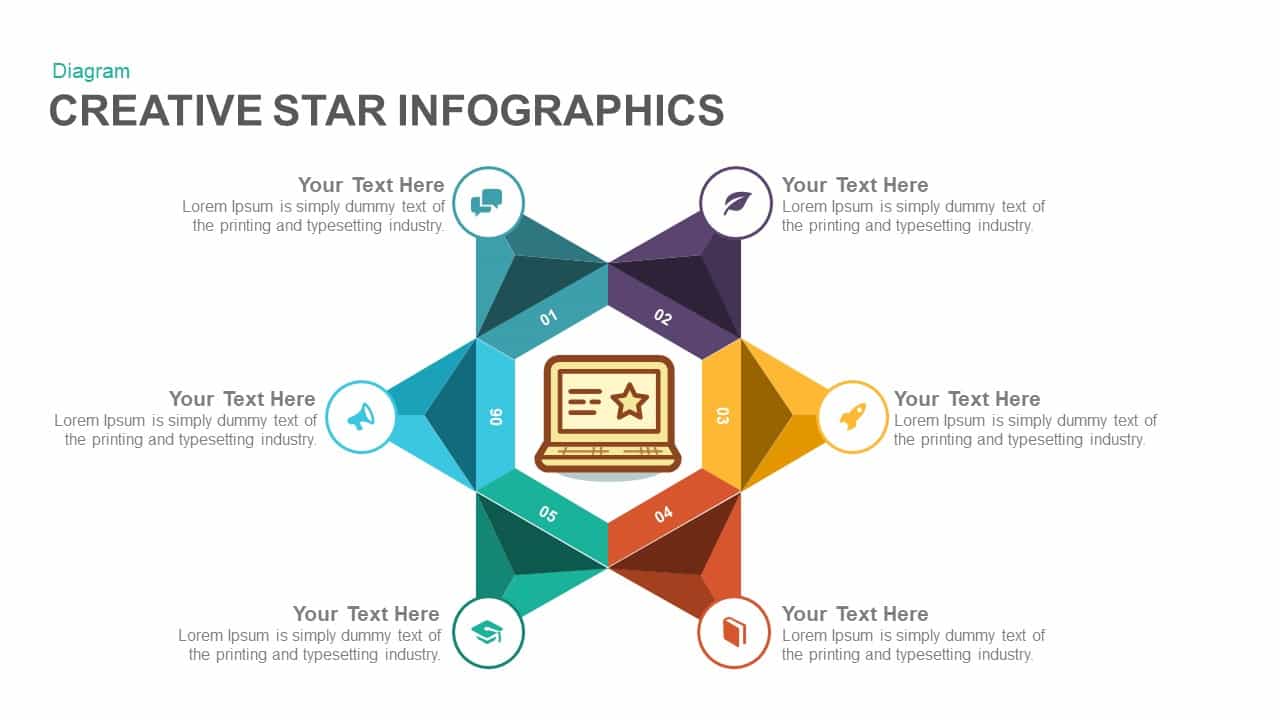
Six-Section Star Infographic Diagram Template for PowerPoint & Google Slides
Circular
Eight-Step Circular Diagram Infographic Template for PowerPoint & Google Slides
Circular
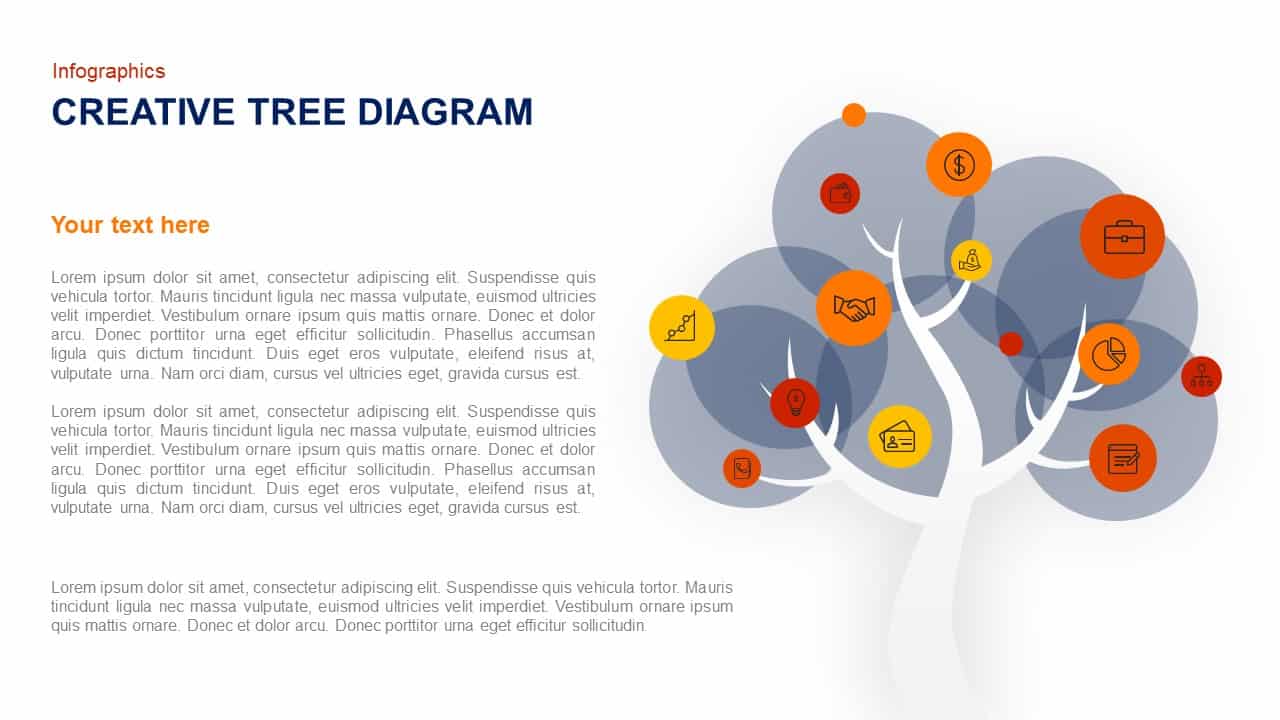
Creative Tree Infographic Diagram Template for PowerPoint & Google Slides
Infographics
Four-Stage Circular Diagram Infographic Template for PowerPoint & Google Slides
Circular
Business Services Infographics Template for PowerPoint
Infographics
4 Factors Circular Diagram Infographic Template for PowerPoint & Google Slides
Circular
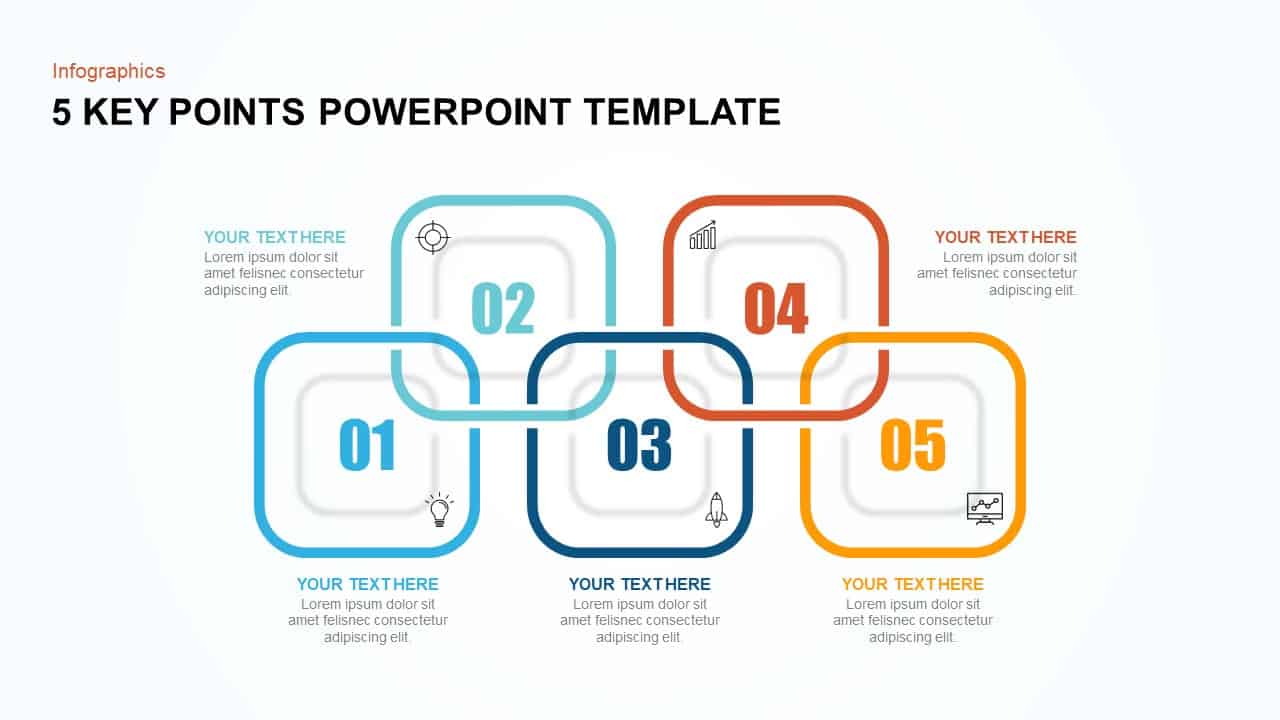
5 Key Points Infographic Diagram Template for PowerPoint & Google Slides
Process
Circular Three-Step Infographic Diagram Template for PowerPoint & Google Slides
Circular
3D Cube Shape Infographic Arrow Template
Arrow
Creative Tree Diagram Infographic Template for PowerPoint & Google Slides
Decision Tree
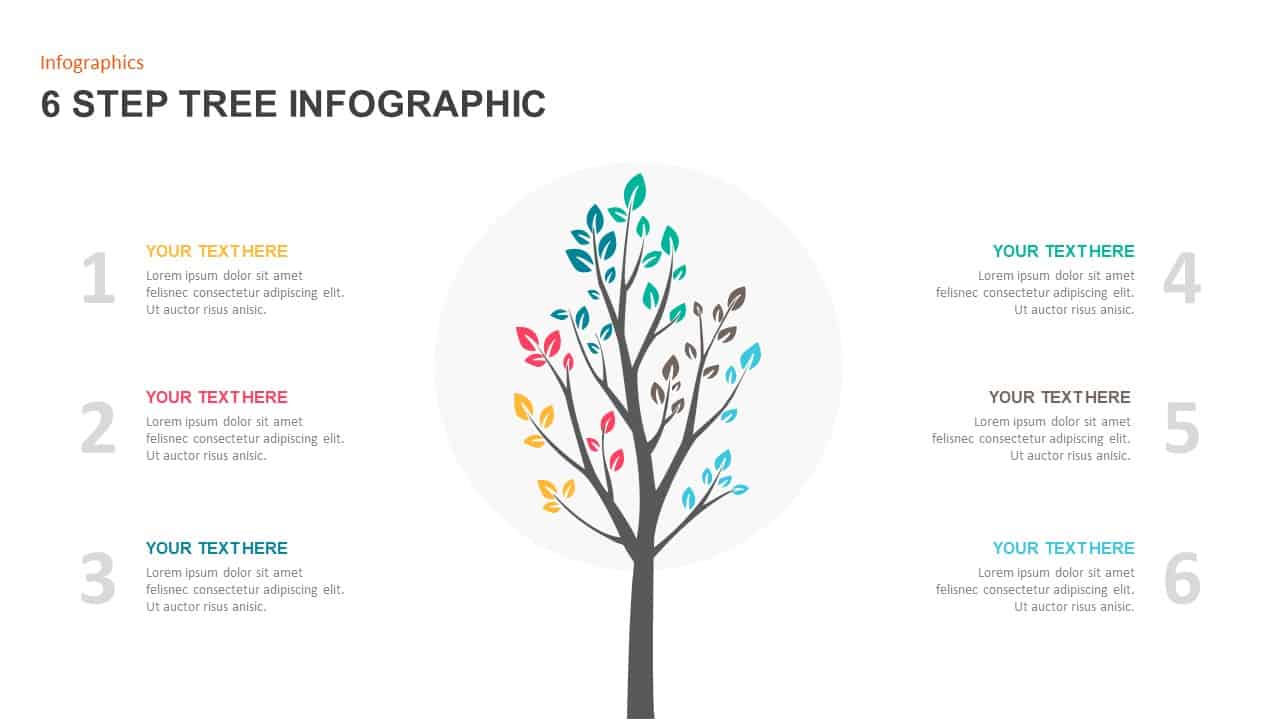
Six-Step Tree Diagram Infographic Template for PowerPoint & Google Slides
Infographics
Six-Circle Process Infographic Diagram Template for PowerPoint & Google Slides
Circular
6-Part Circular Gear Infographic Diagram Template for PowerPoint & Google Slides
Process
Circular CRM Process Infographic Diagram
Circular
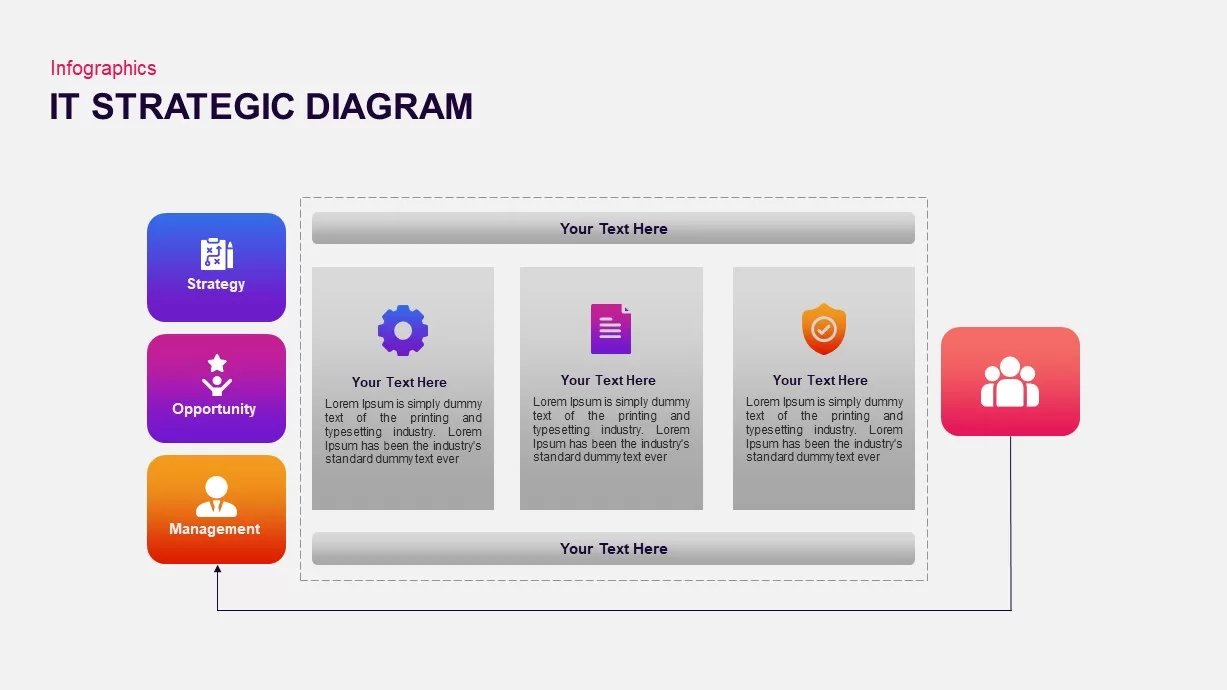
IT Strategic Diagram Infographic Pack Template for PowerPoint & Google Slides
Business Strategy
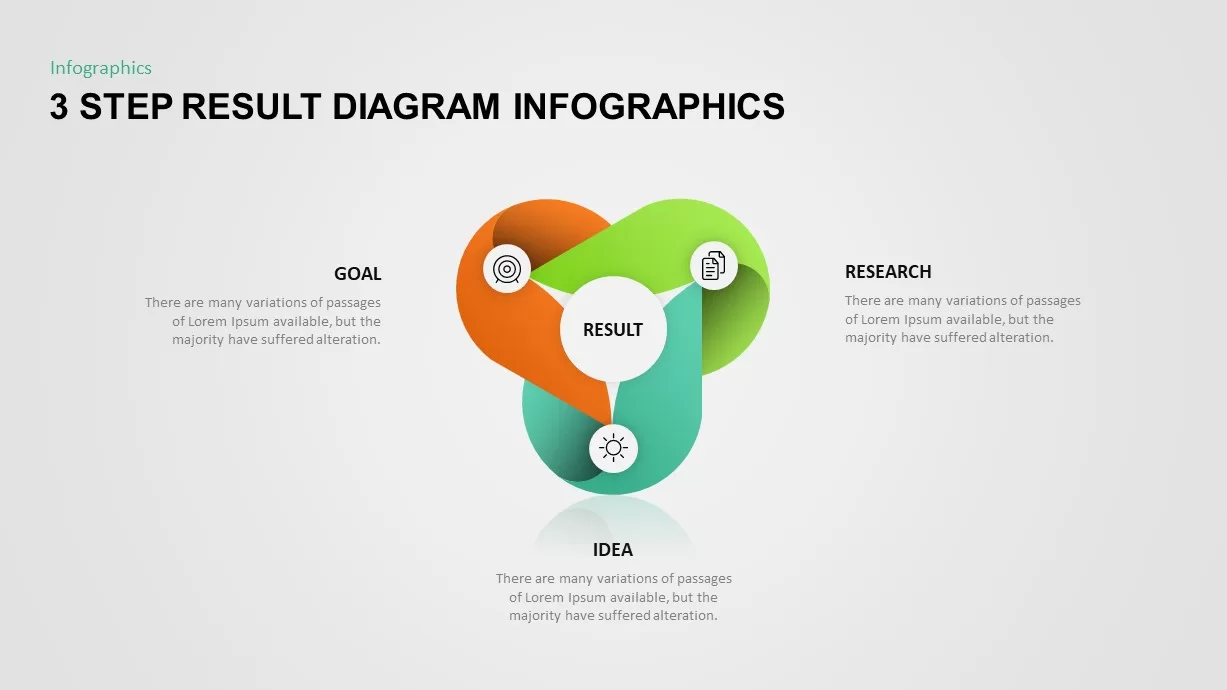
Three-Step Result Diagram Infographic Template for PowerPoint & Google Slides
Process
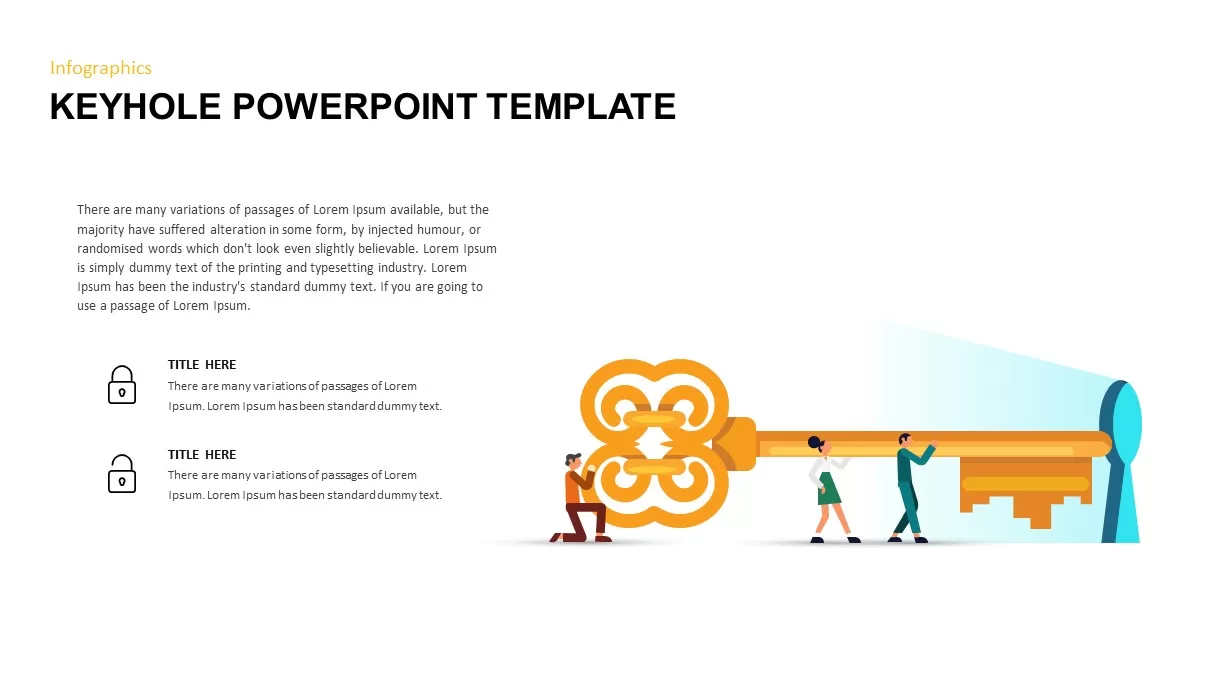
Keyhole Infographic Process Diagram Template for PowerPoint & Google Slides
Process
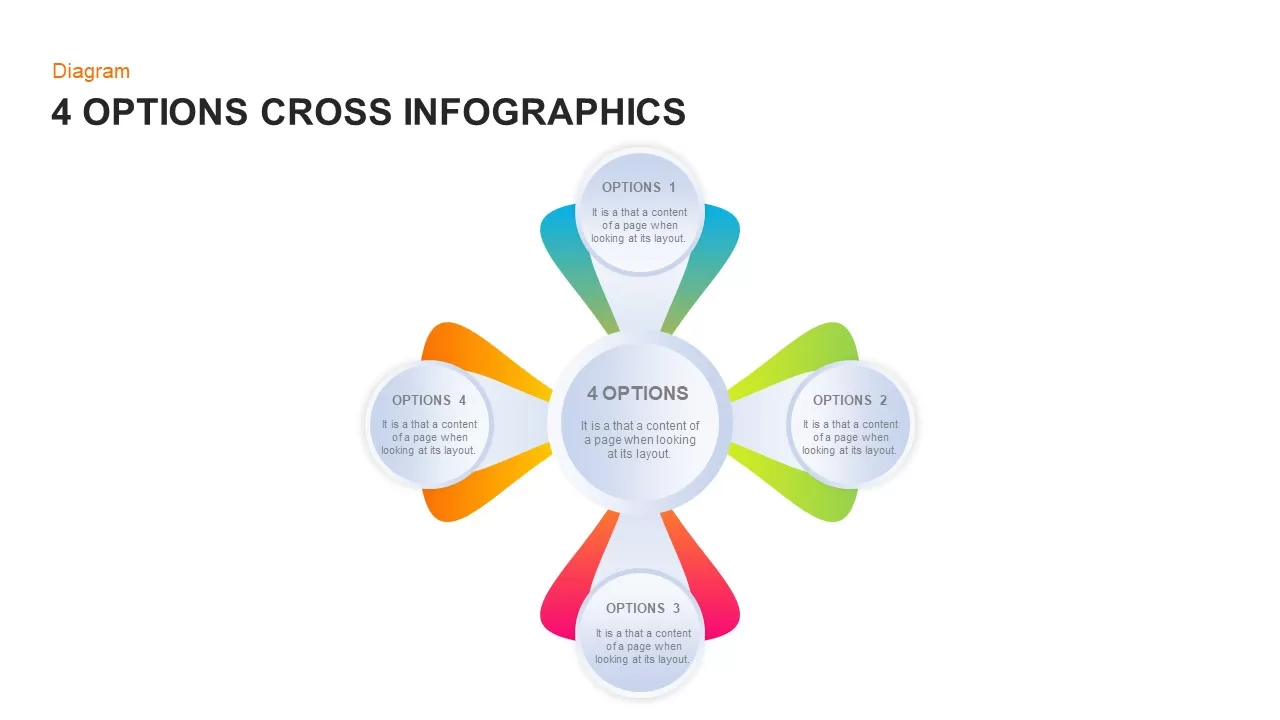
Four-Option Cross Infographic Diagram Template for PowerPoint & Google Slides
Comparison
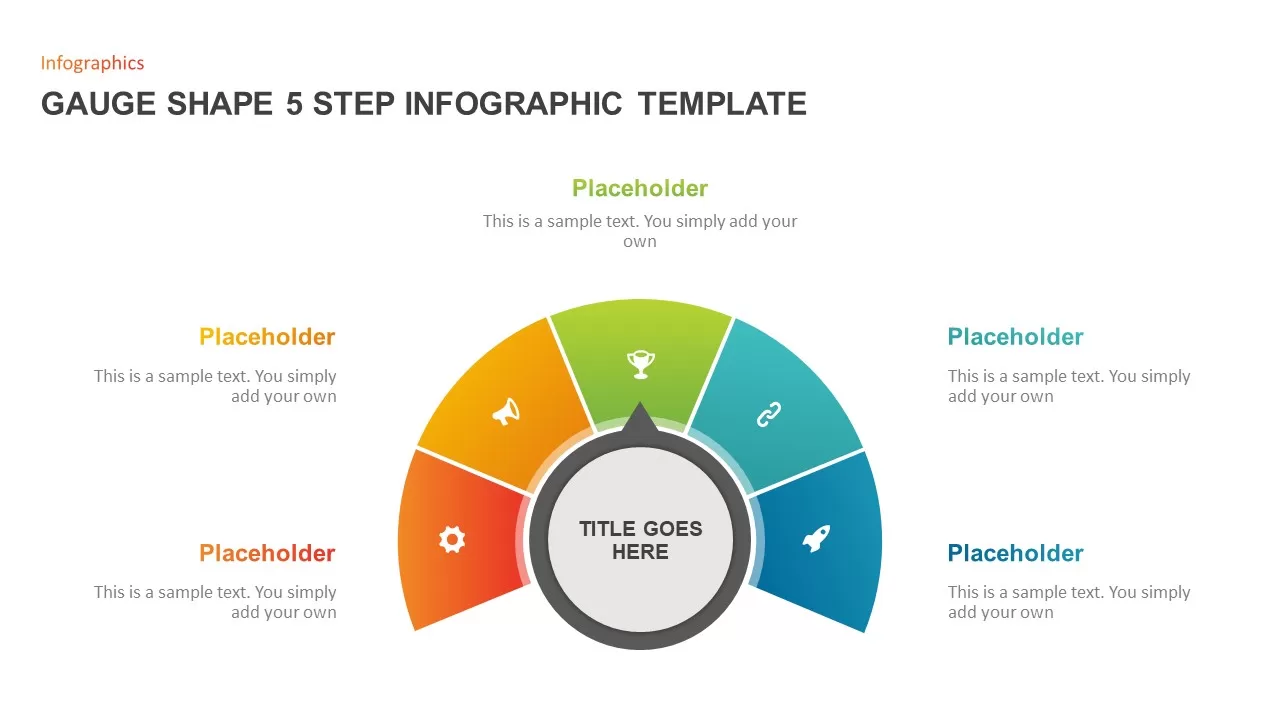
Gauge Shape 5-Step Infographic Diagram Template for PowerPoint & Google Slides
Process
Affinity Diagram Infographic Template for PowerPoint & Google Slides
Business
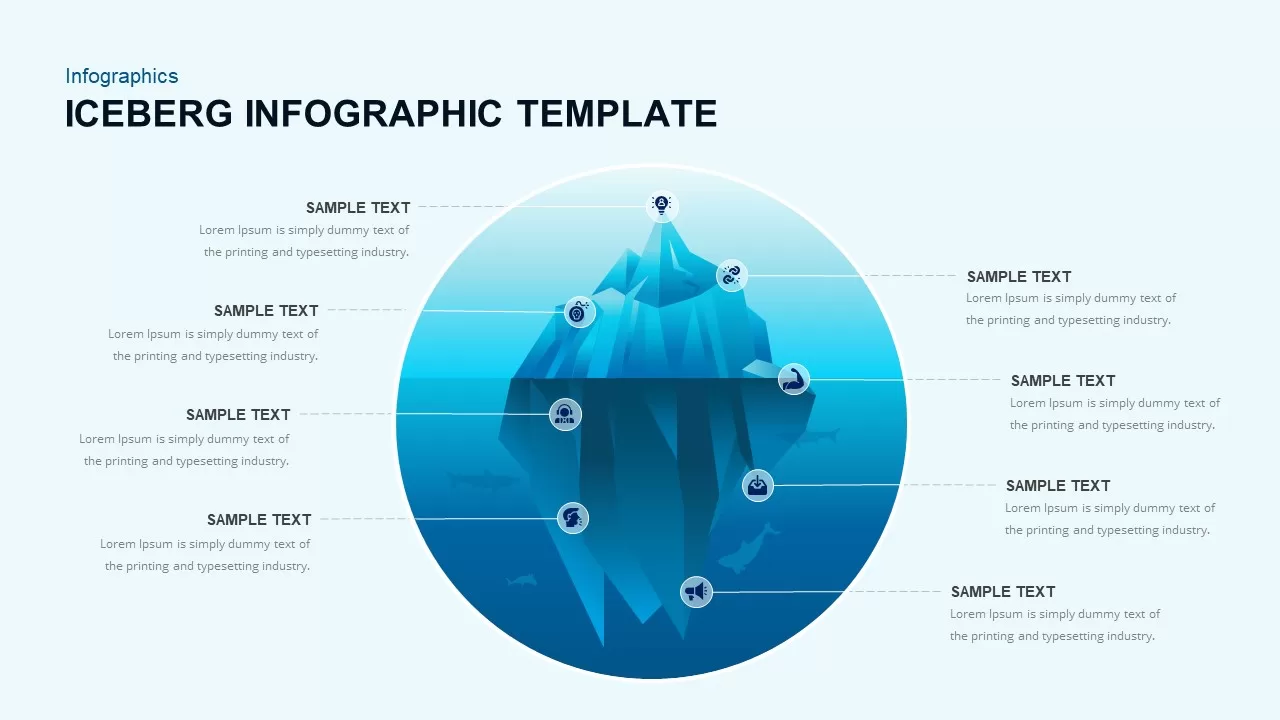
Iceberg Infographic Diagram template for PowerPoint & Google Slides
Opportunities Challenges
Minimal Process Flow Diagram Infographic Template for PowerPoint & Google Slides
Process
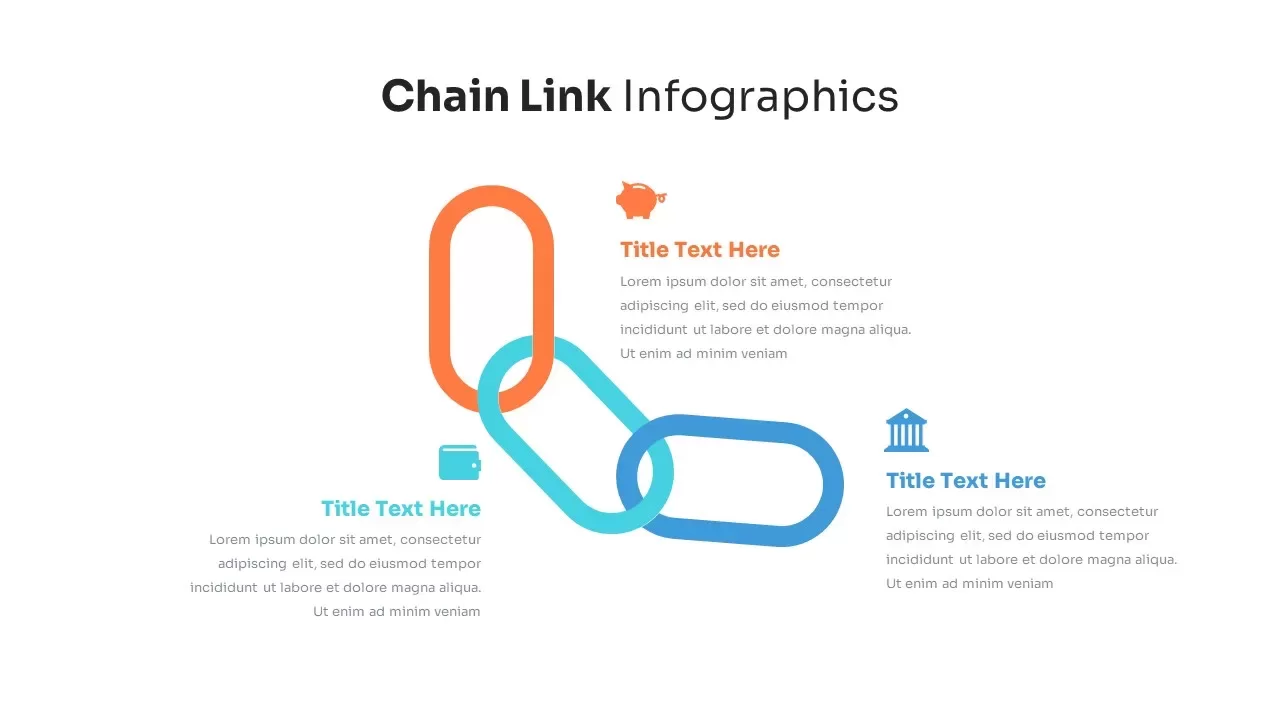
Chain Link Infographics Template
Process
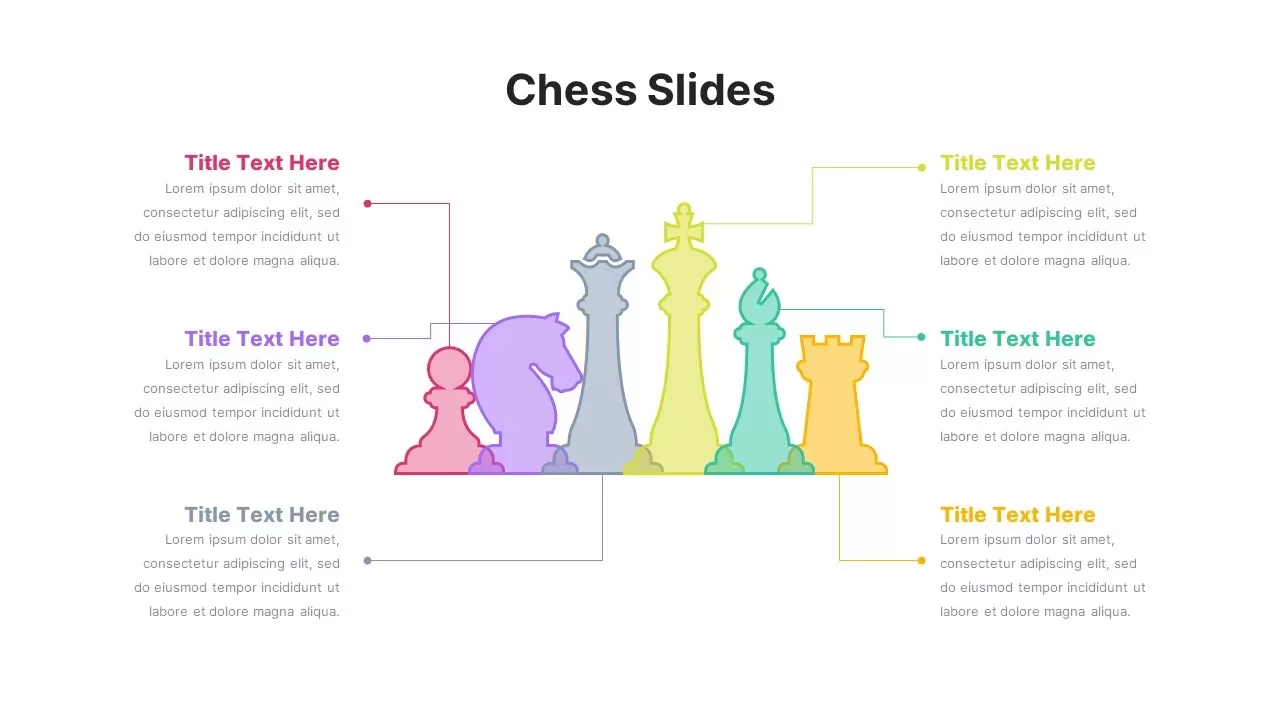
Modern Chess Infographic Diagram Template for PowerPoint & Google Slides
Comparison
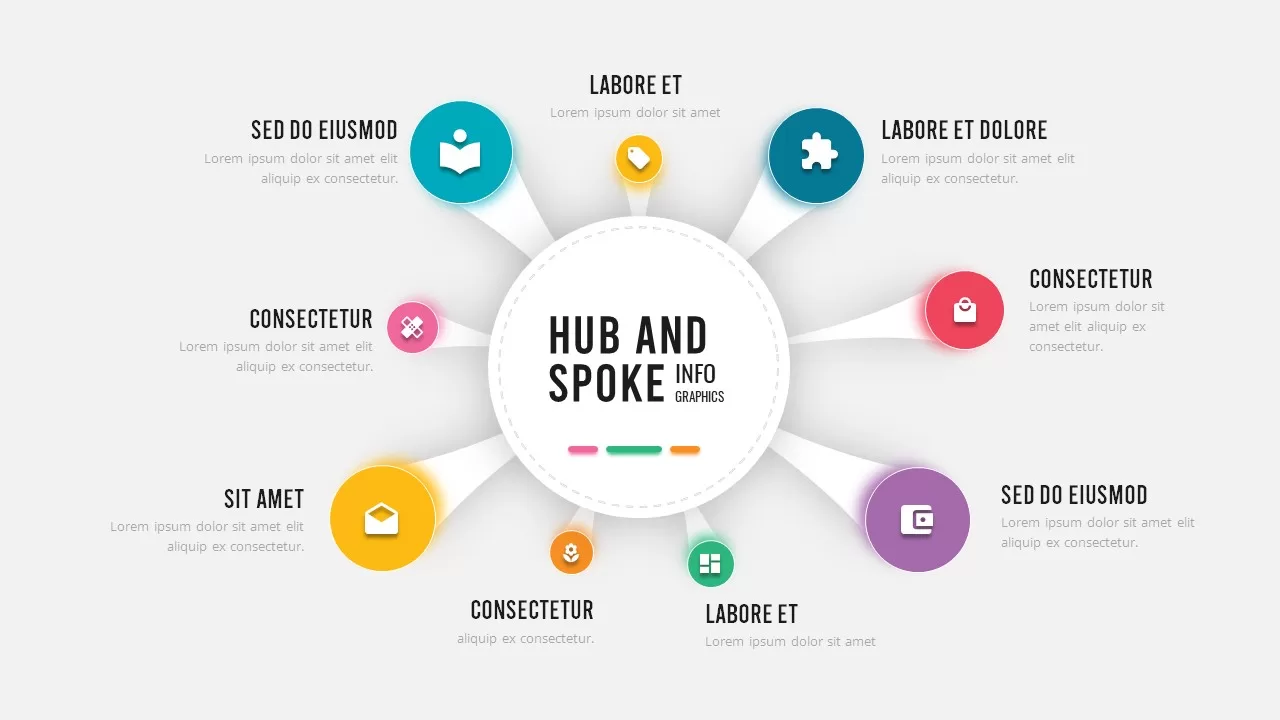
Dynamic Hub-and-Spoke Infographic Diagram Template for PowerPoint & Google Slides
Circular
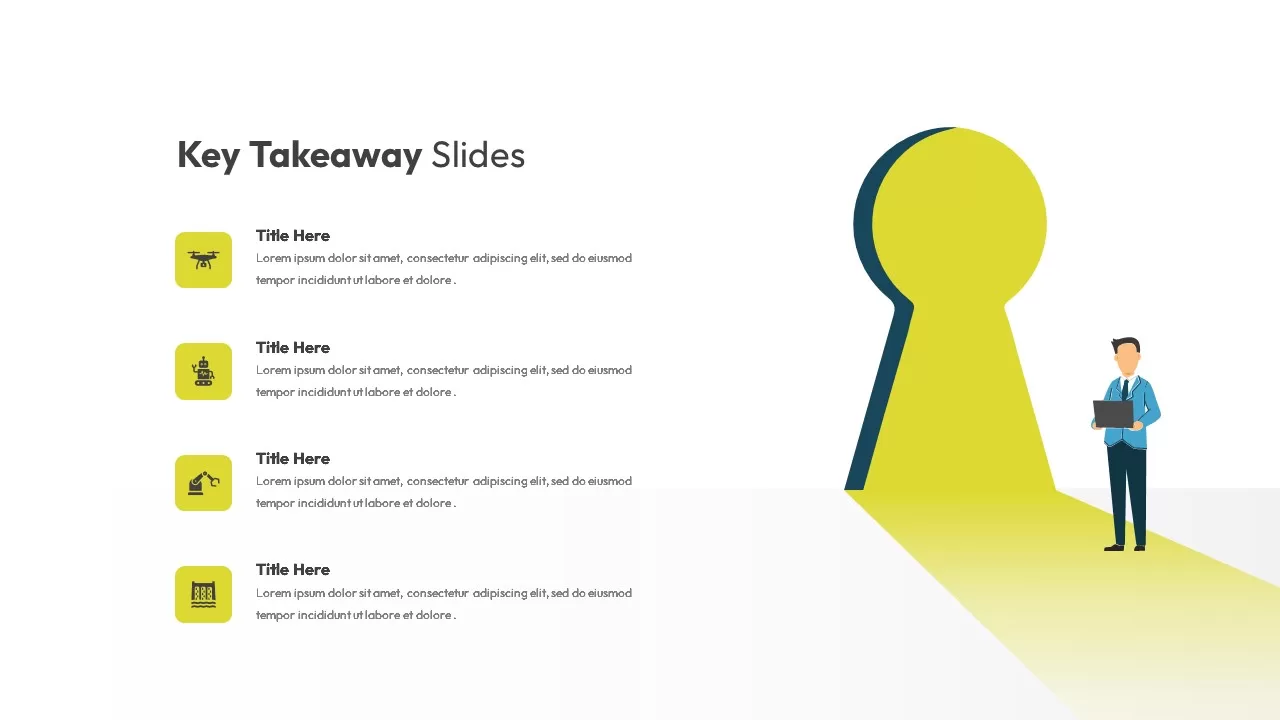
Key Takeaway Slide for PowerPoint and Google Slides
Process
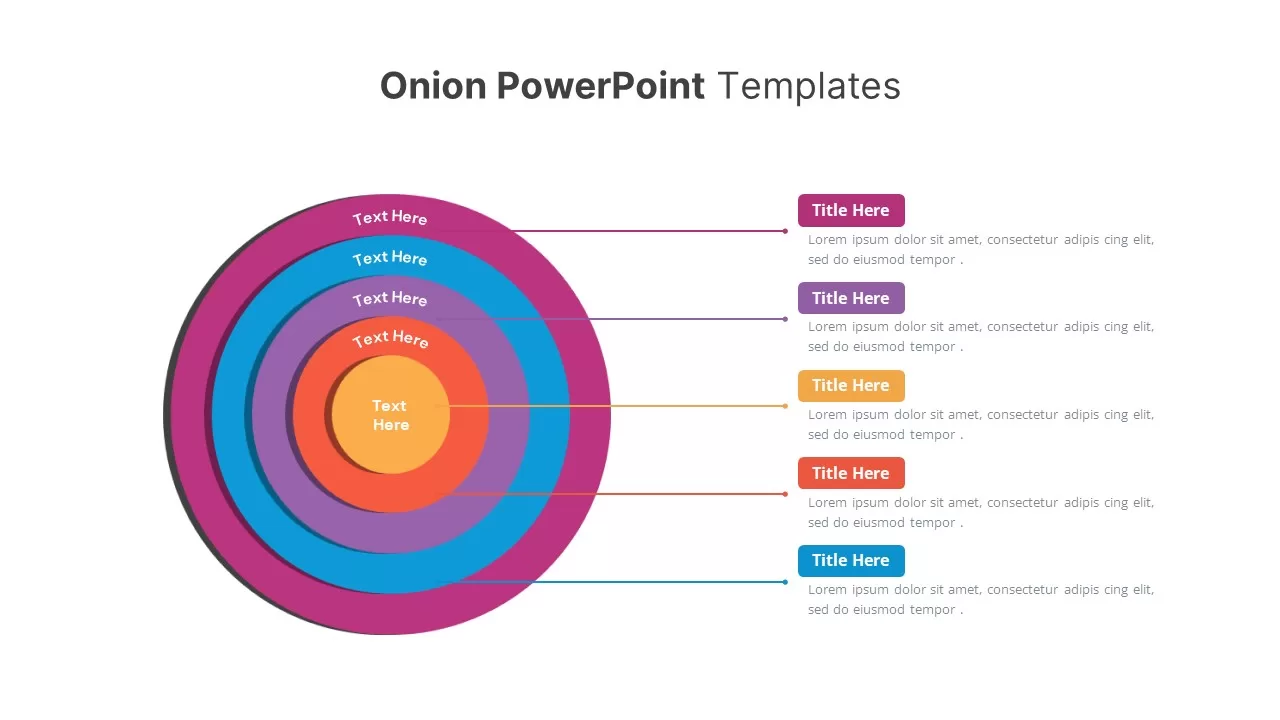
Onion Layer Infographic Diagram Template for PowerPoint & Google Slides
Process
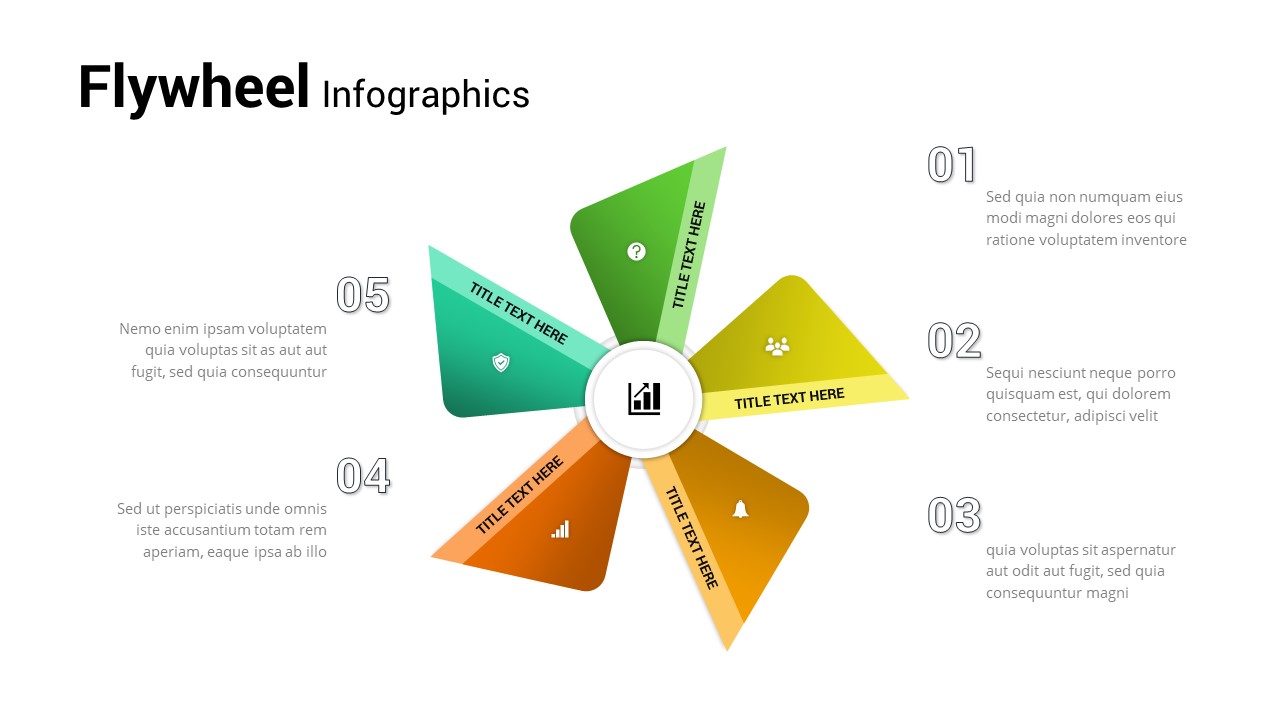
Five-Step Flywheel Infographic Diagram Template for PowerPoint & Google Slides
Process
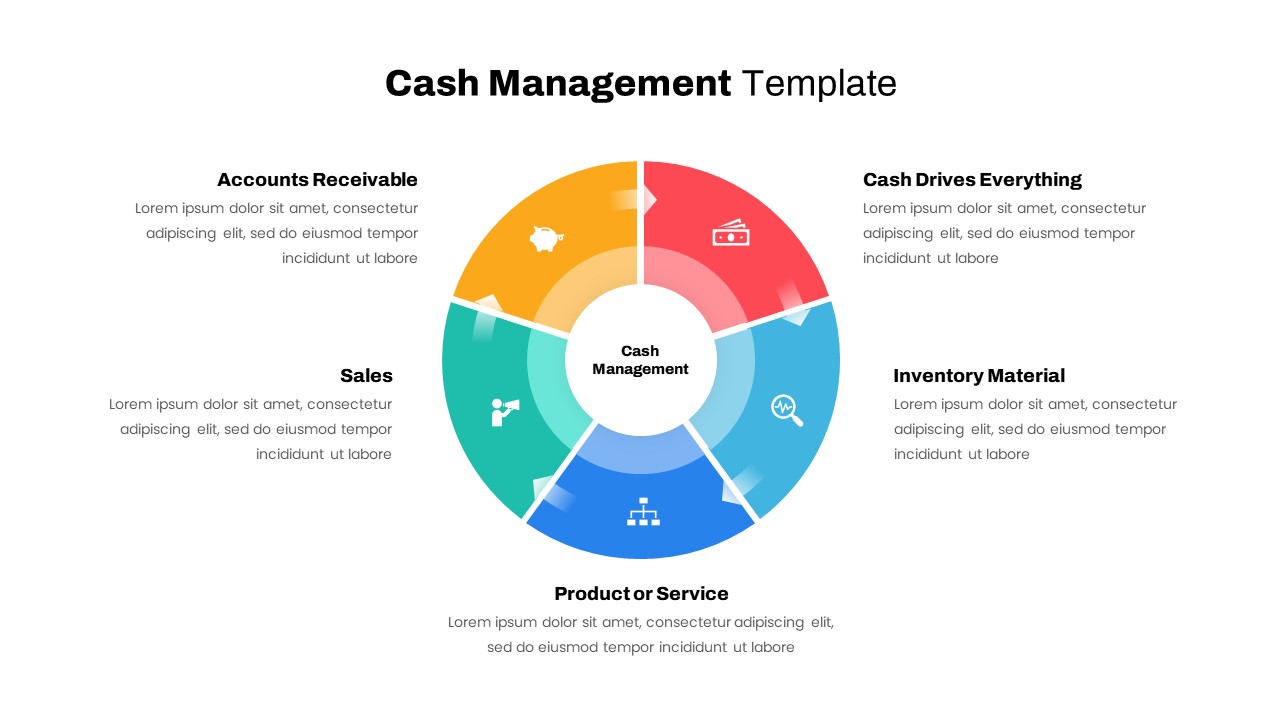
Cash Management Infographic Diagram Template for PowerPoint & Google Slides
Circular
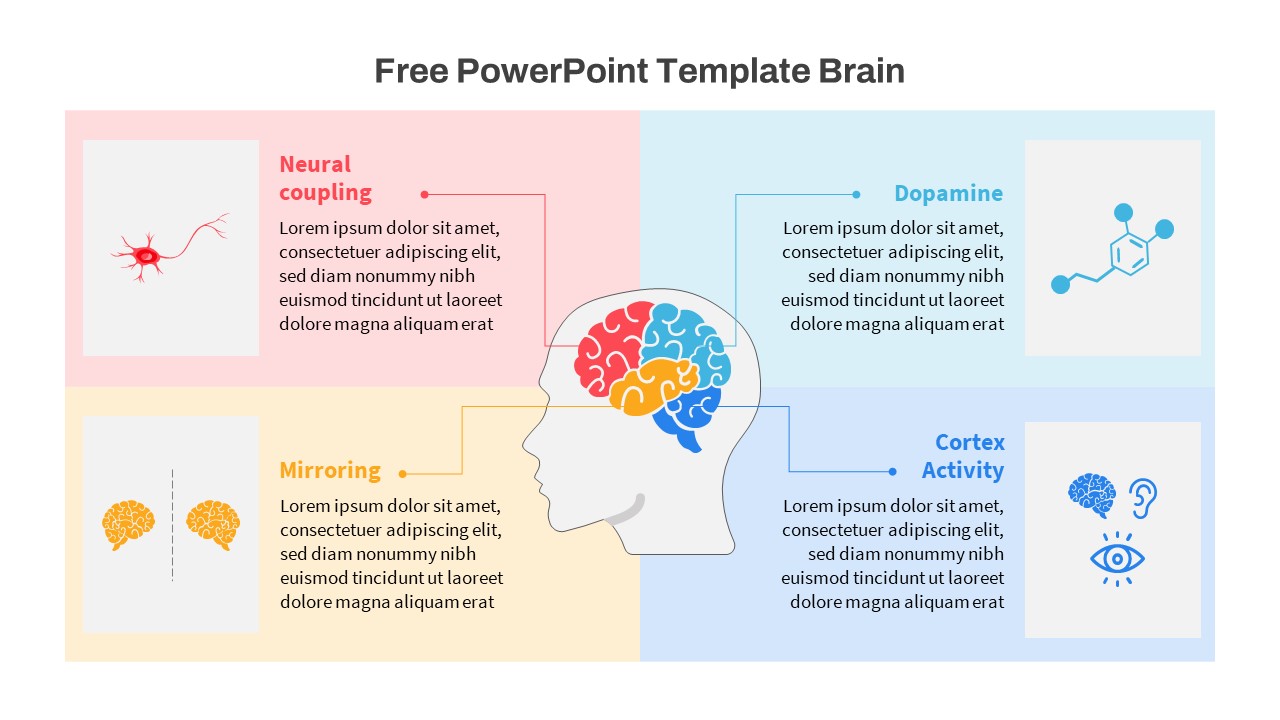
Free Brain Function Diagram Infographic Template for PowerPoint & Google Slides
Process
Free
Salience Model Venn Diagram Infographic Template for PowerPoint & Google Slides
Circular
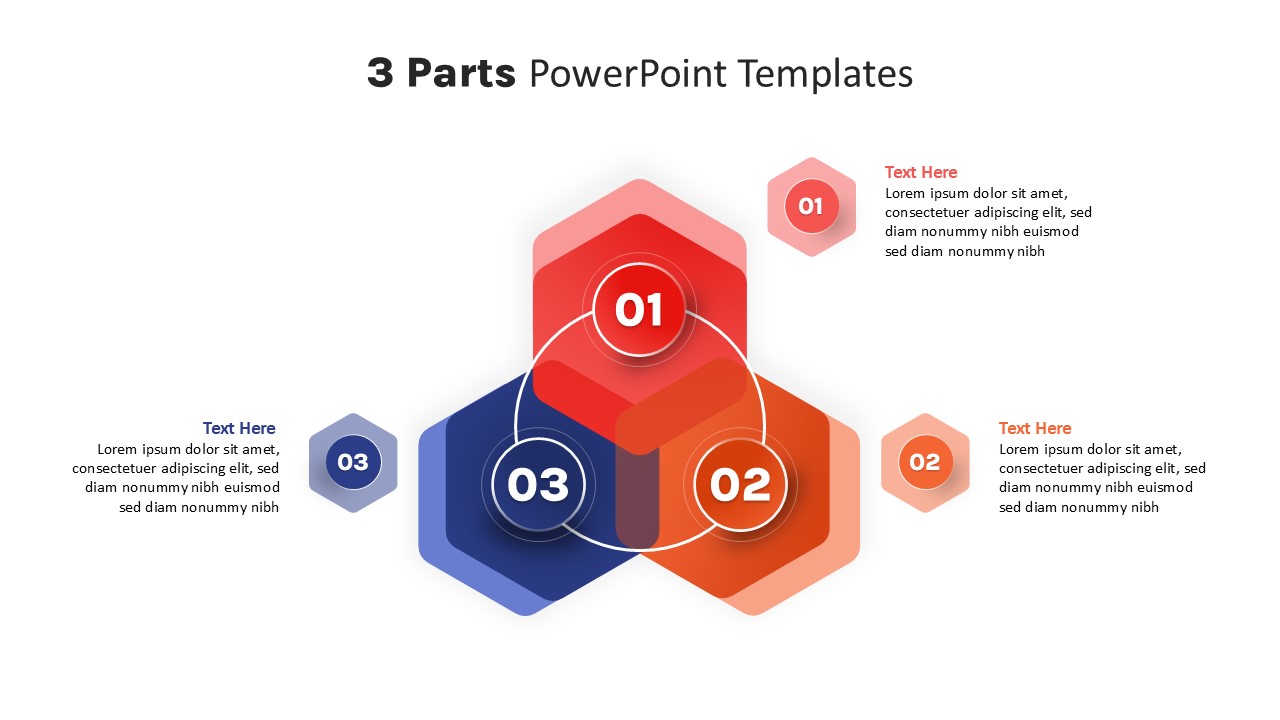
Three-Part Parts Infographic Diagram Template for PowerPoint & Google Slides
Process