Multi-Cluster Mind Map Infographic Template for PowerPoint & Google Slides

Description
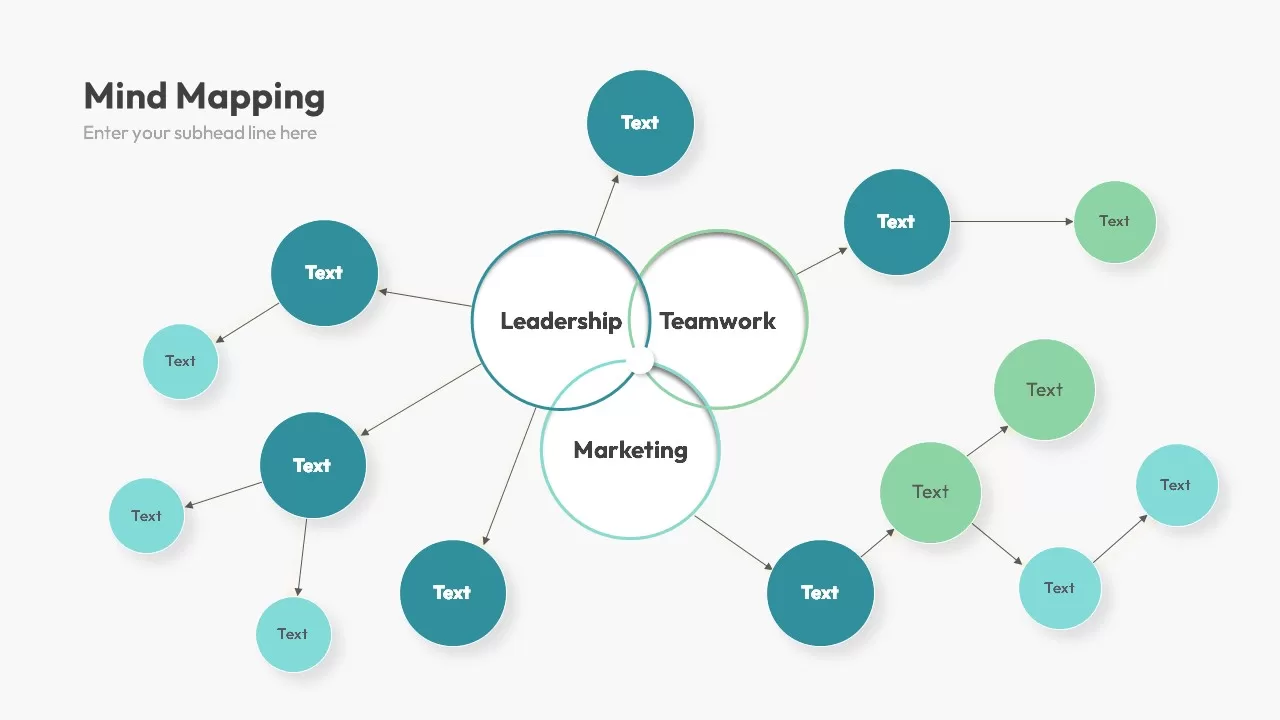
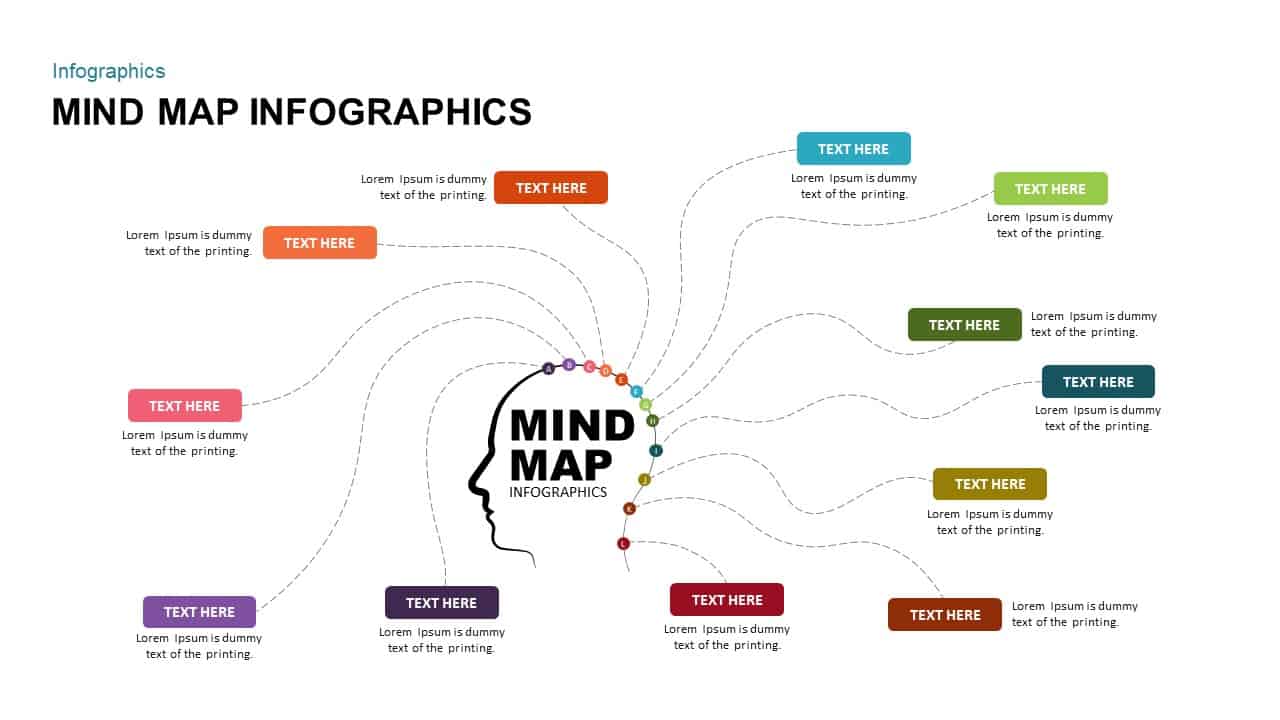
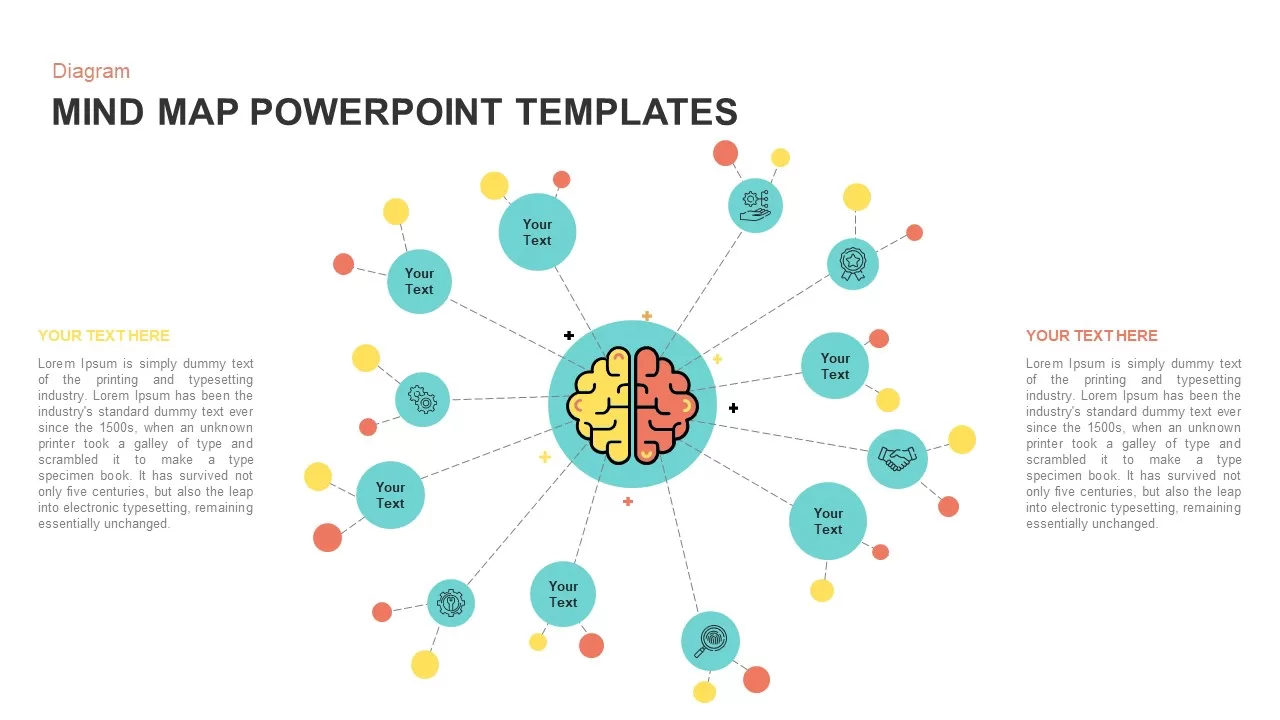
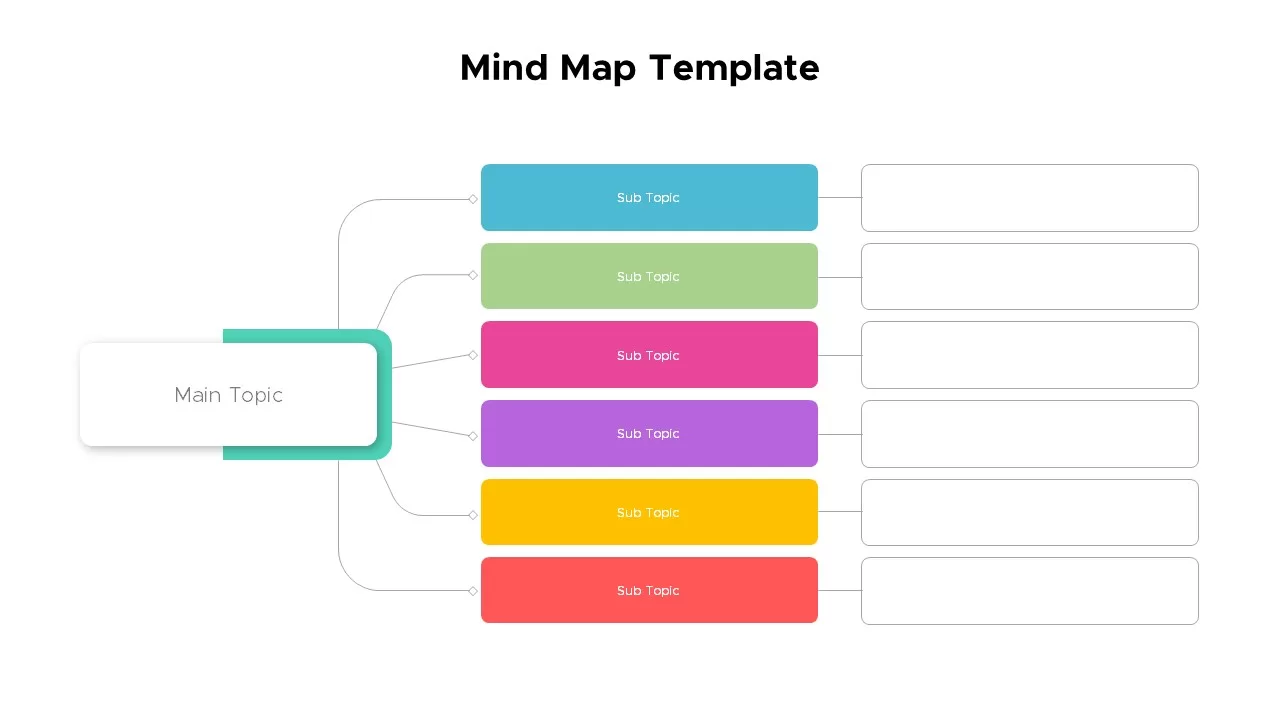
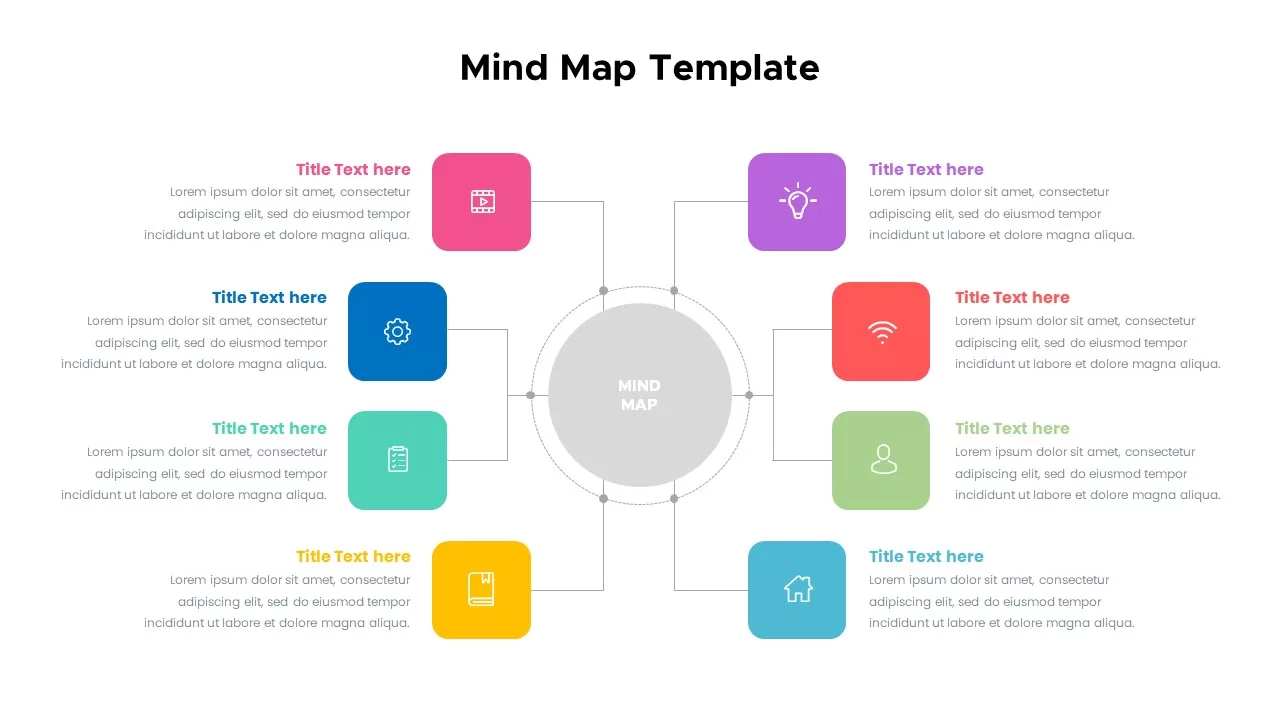
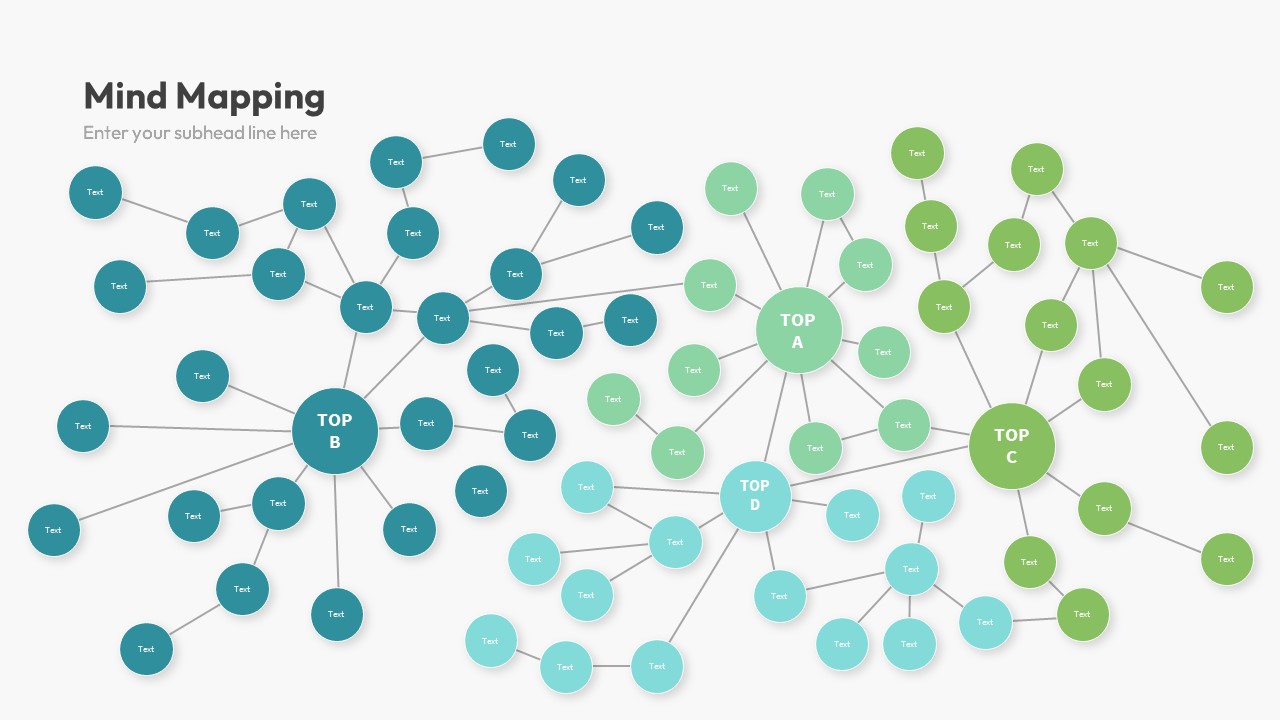
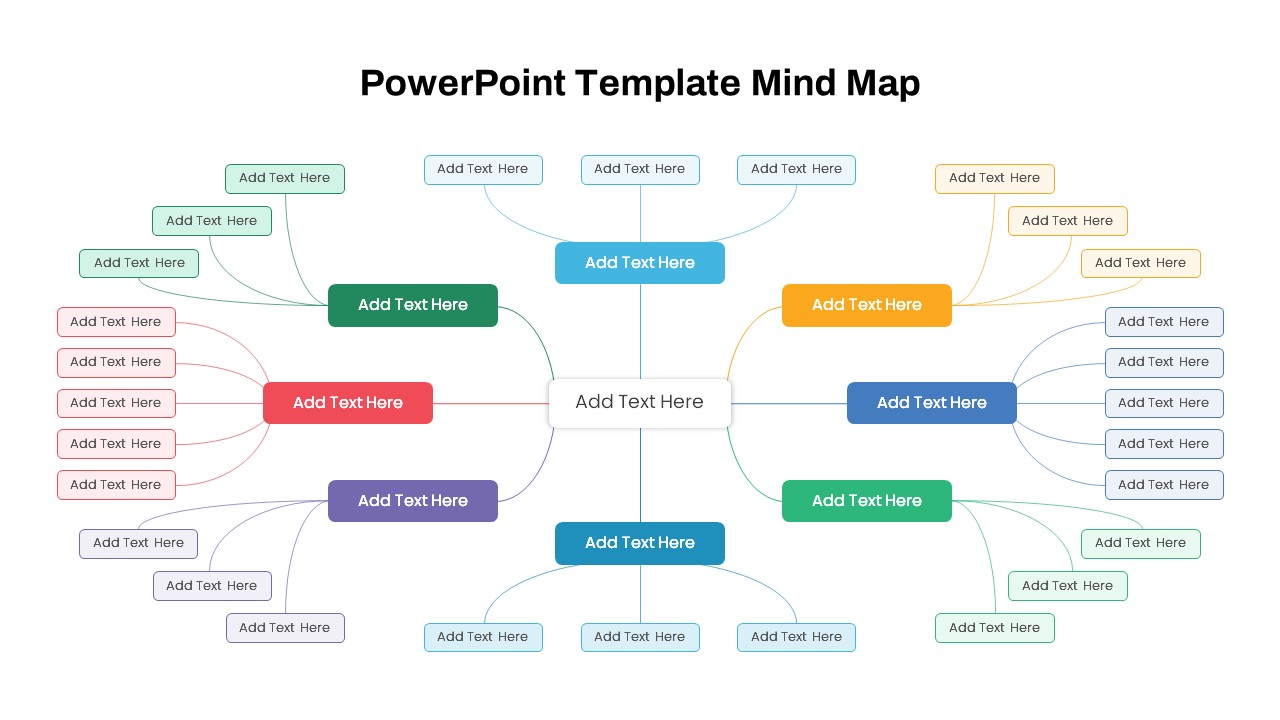
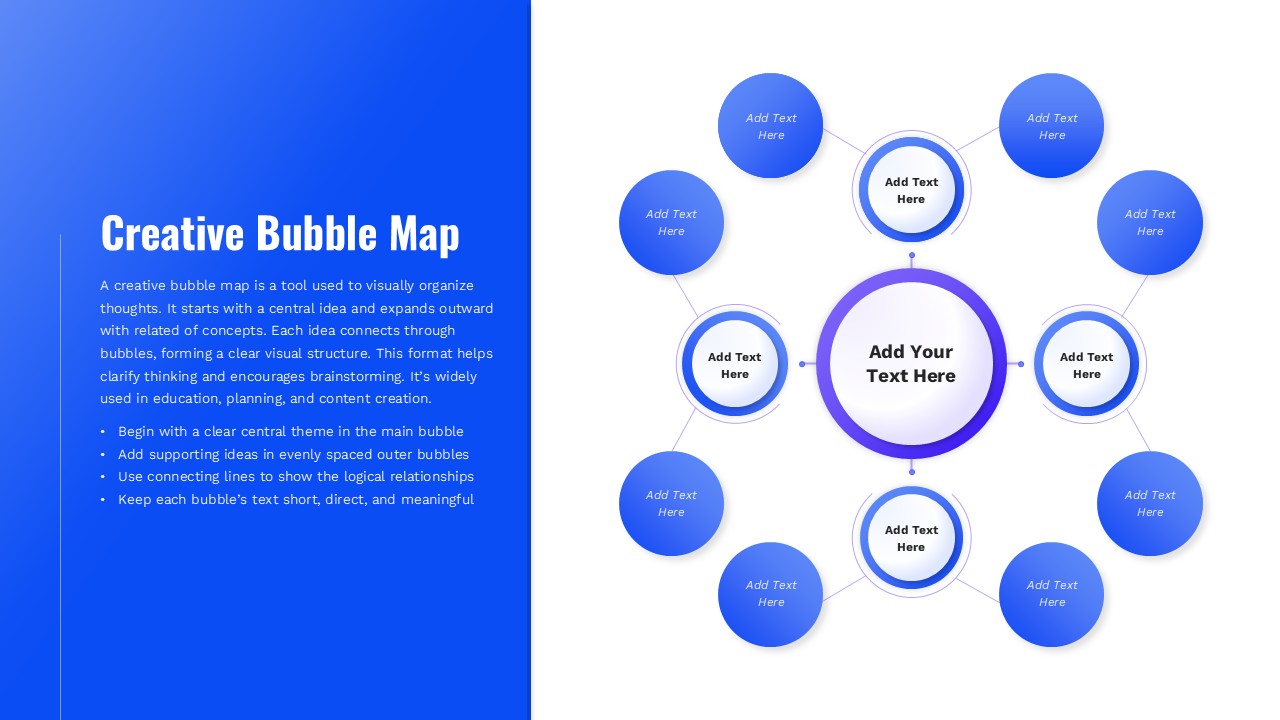
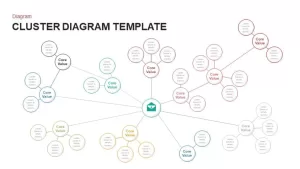
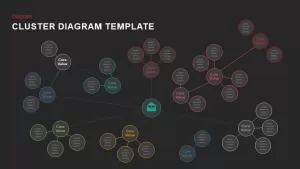
Use this editable multi-cluster mind map infographic to visualize core values, ideas, or thematic groupings in a clear, professional layout. A central envelope icon anchors eight radiating clusters, each with a “Core Value” node surrounded by three sub-nodes. Fine connector lines and color-coded outlines distinguish each cluster, while a clean white canvas and minimalist typography ensure maximum readability. Built on master slides for both PowerPoint and Google Slides, all elements are vector-based—swap icons, adjust border colors, or relabel nodes in seconds without any quality loss. Apply sequential fade-in animations to each cluster to guide your audience through your narrative step by step. High-resolution vectors guarantee crisp rendering on large screens, printed handouts, or PDF exports, making this template equally suited for executive briefings, strategy workshops, and stakeholder presentations.
Who is it for
Leadership teams, brand strategists, and workshop facilitators will leverage this mind map to surface core values, brainstorm solutions, or map strategic pillars. Product managers, UX designers, and marketing planners can also use it to capture feature sets, customer personas, or campaign themes.
Other Uses
Repurpose this cluster layout for SWOT analyses, opportunity maps, or project kick-offs by customizing the central icon and node labels. With simple color and text swaps, you can adapt it to illustrate organizational structures, product ecosystems, or knowledge frameworks—making it a versatile asset across any collaborative session.
Login to download this file

Item ID
SB00970
Related Templates

Tri-Cluster Mind Map Infographic Template for PowerPoint & Google Slides
Mind Maps
Animated Multi-Gear Cluster Infographic Template for PowerPoint & Google Slides
Process

Simple Multi-Branch Mind Map Template for PowerPoint & Google Slides
Mind Maps
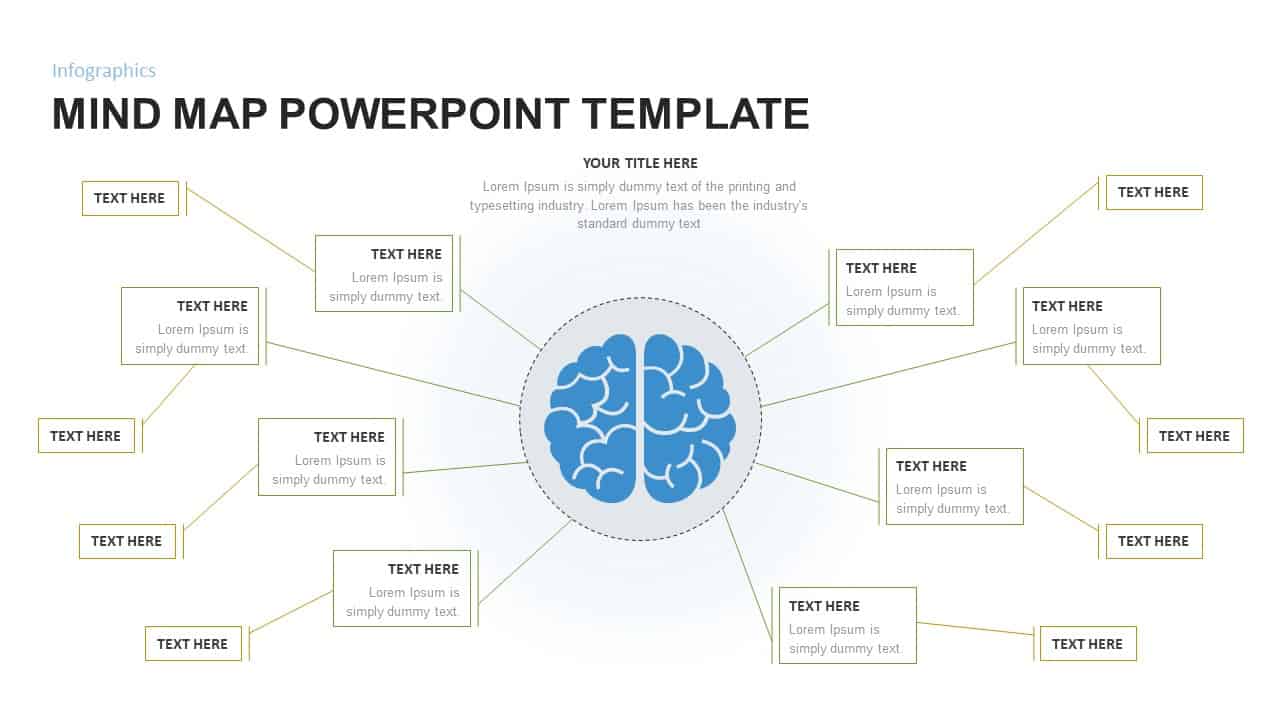
Mind Map Slide PowerPoint Template
Mind Maps
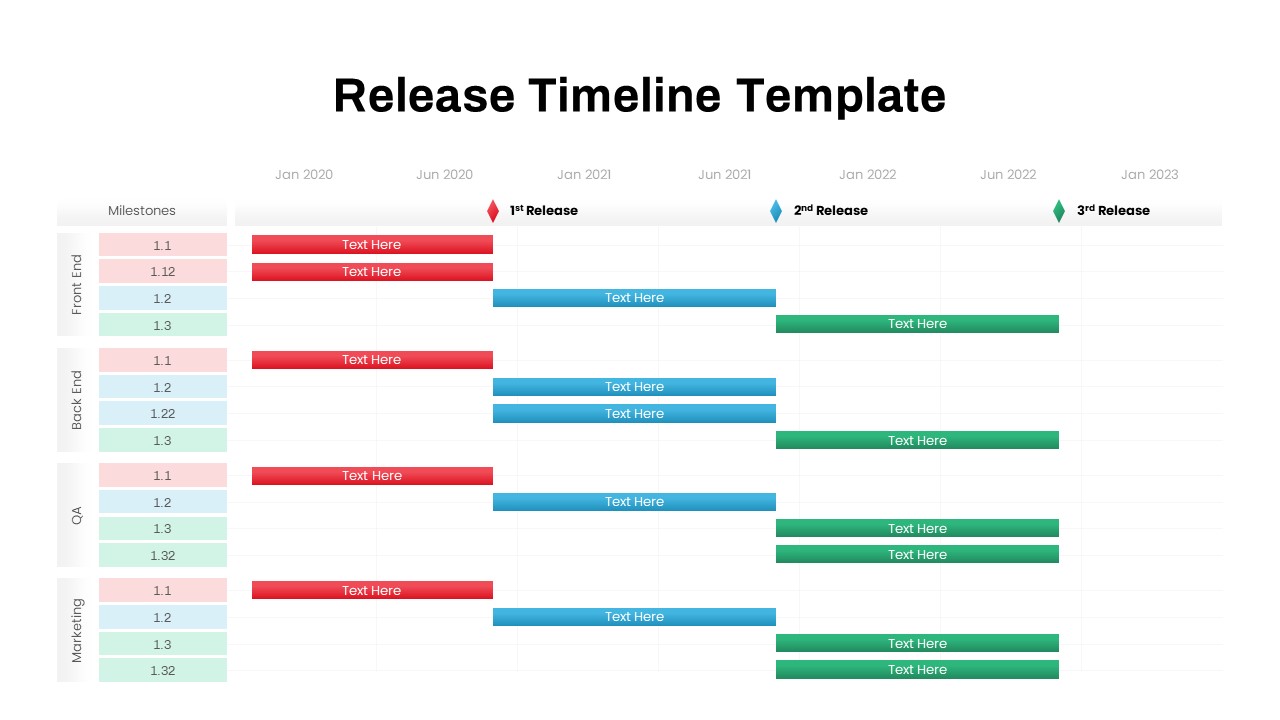
Multi-Team Multi-Phase Release Timeline Template for PowerPoint & Google Slides
Timeline
Cluster Analysis Infographic Diagram Template for PowerPoint & Google Slides
Business
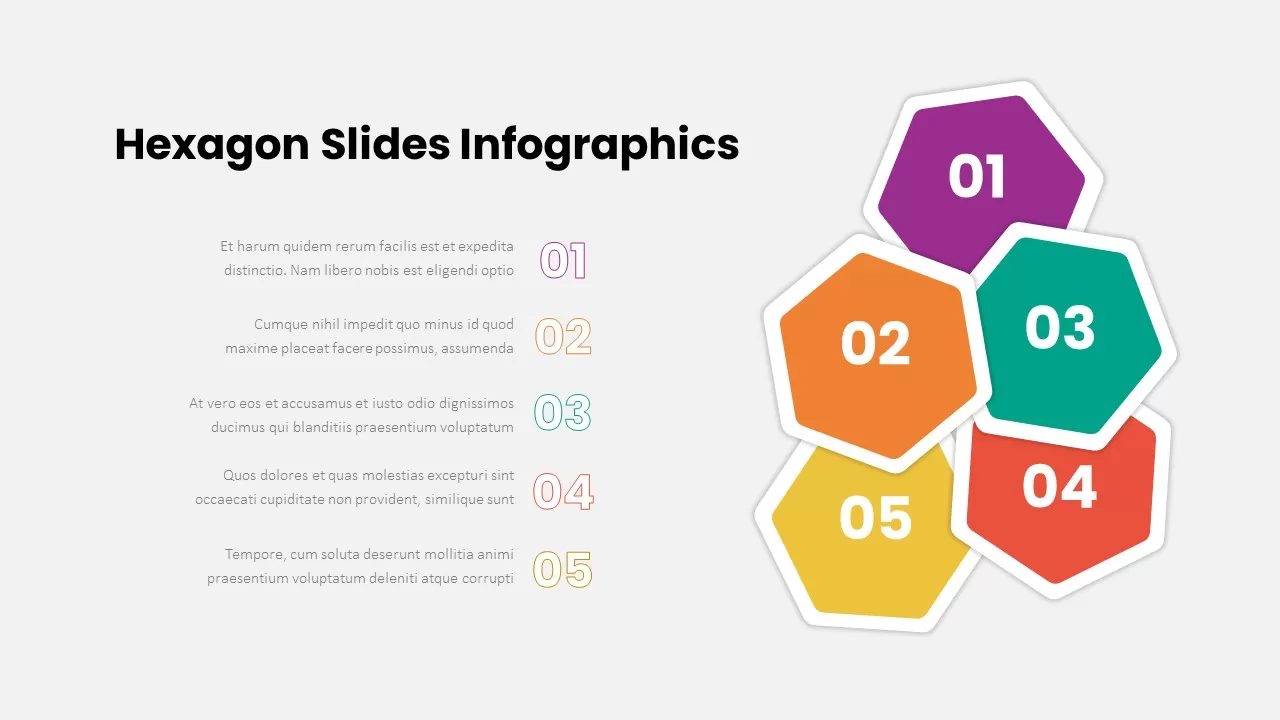
Free Hexagon Slide Infographics Template
Infographics
Free
Mind Map PowerPoint Template and Google Slides
Mind Maps
Colorful Mind Map Infographic Template for PowerPoint & Google Slides
Mind Maps
Mind Map Infographic Slide Template for PowerPoint & Google Slides
Mind Maps

Eight-Node Mind Map Infographic Diagram Template for PowerPoint & Google Slides
Mind Maps
Versatile Mind Map Infographic Template for PowerPoint & Google Slides
Mind Maps
Structured Mind Map Infographic Diagram Template for PowerPoint & Google Slides
Mind Maps
Dual Topic Mind Map Infographic Template for PowerPoint & Google Slides
Mind Maps
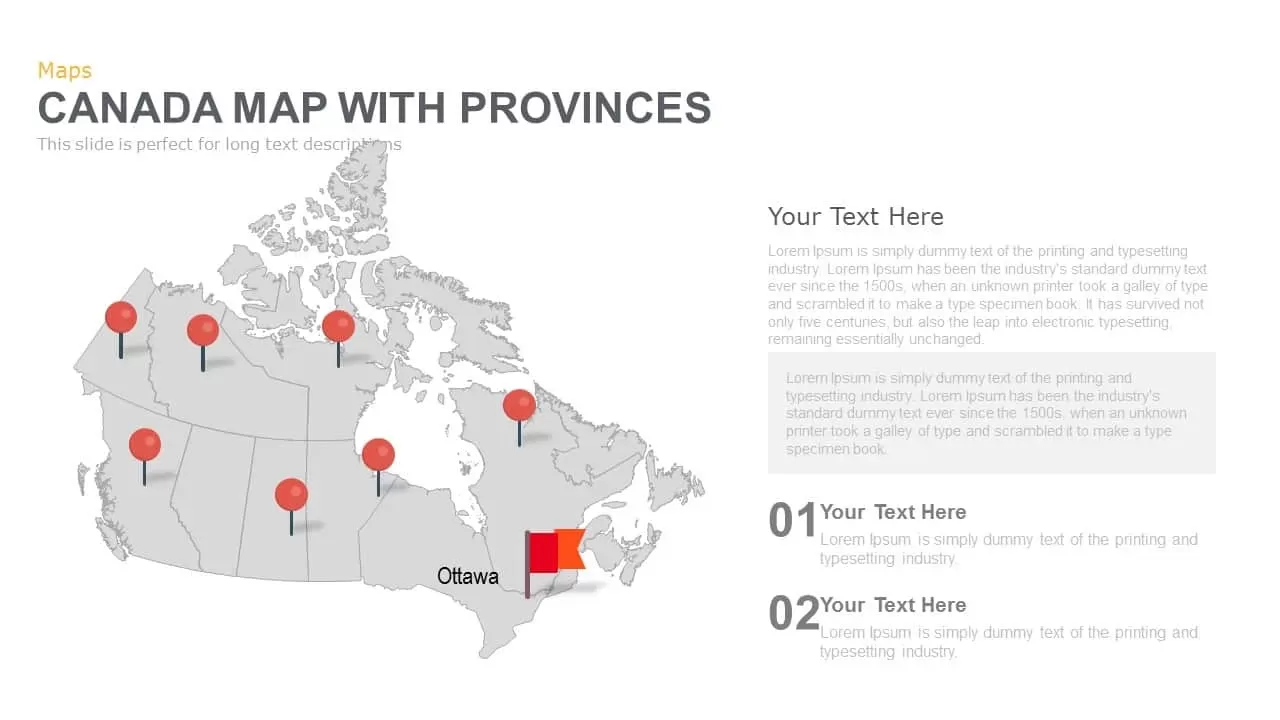
Canada Provinces Map Multi-Layout Template for PowerPoint & Google Slides
World Maps
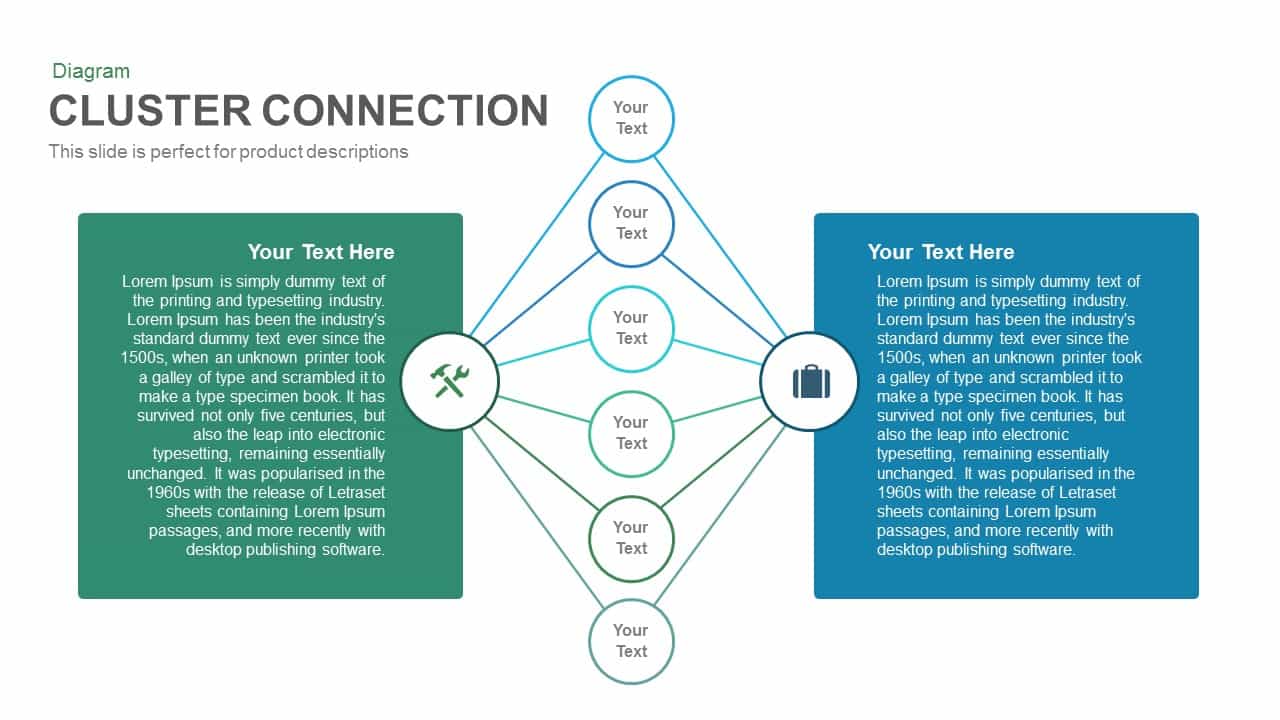
Cluster Connection PowerPoint Template
Process
Three-Branch Cluster Diagram Presentation Template for PowerPoint & Google Slides
Mind Maps
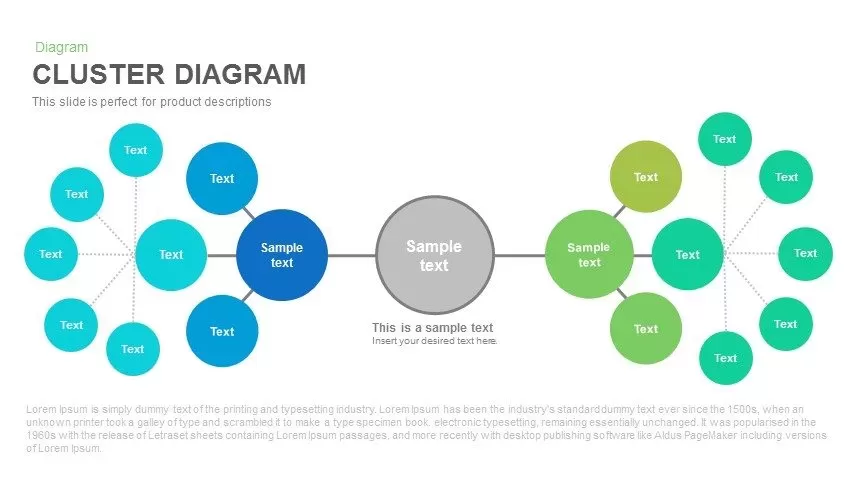
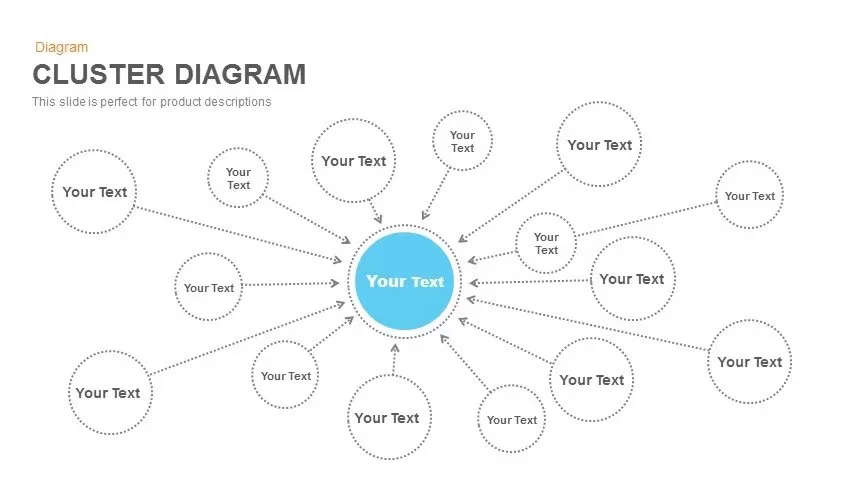
Cluster Diagram for PowerPoint & Google Slides
Process
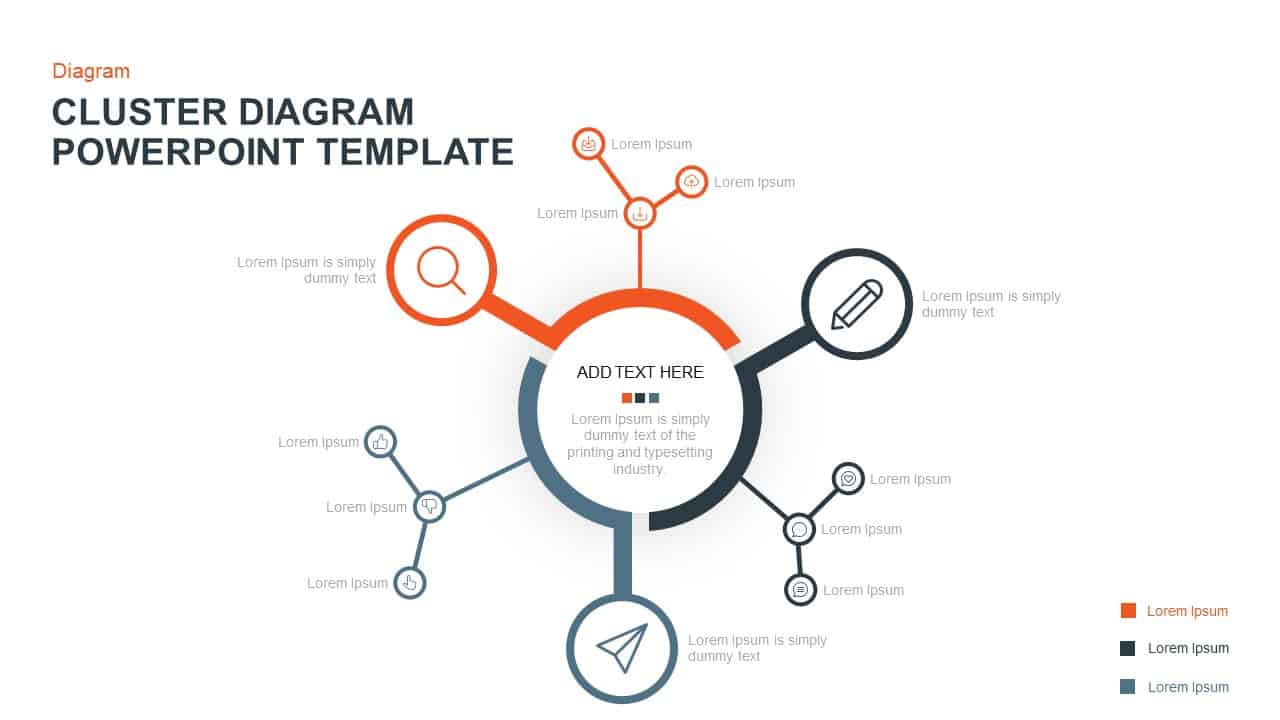
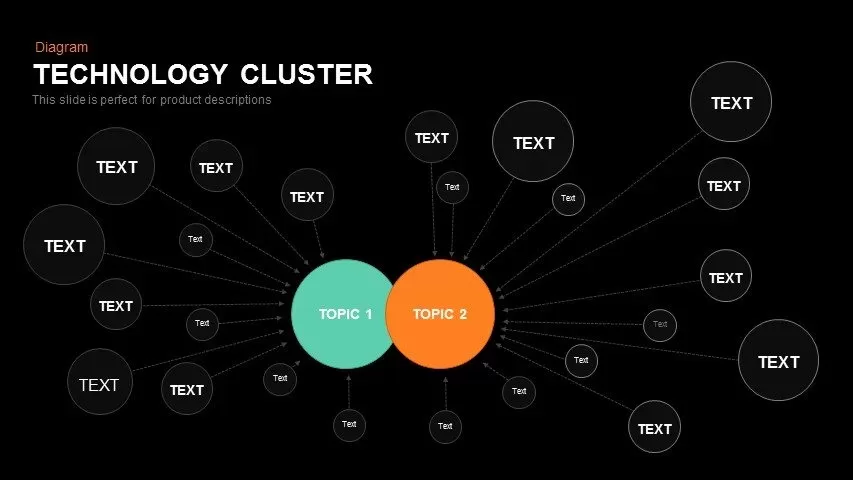
Technology Cluster Diagram for PowerPoint & Google Slides
Infographics
Cluster Diagram for PowerPoint & Google Slides
Mind Maps
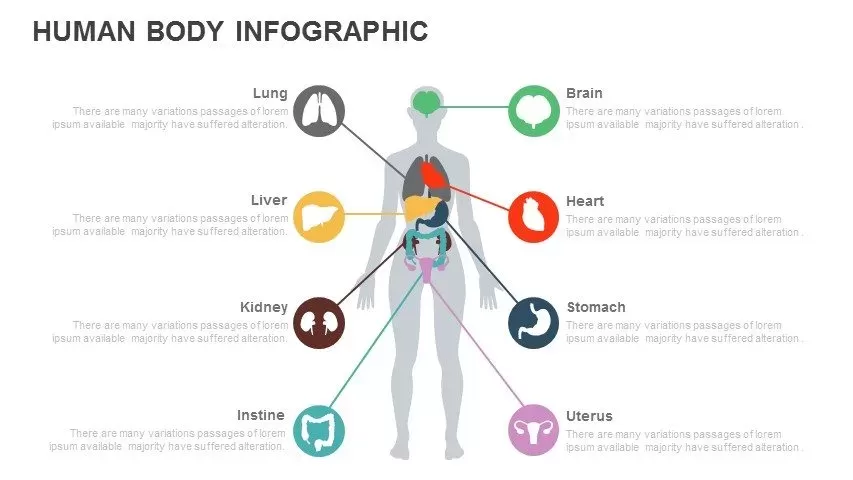
Multi-Organ Human Body Infographic Template for PowerPoint & Google Slides
Comparison
Multi-Year Timeline Infographic Template for PowerPoint & Google Slides
Timeline
Multi-Purpose Corporate Infographic Template for PowerPoint & Google Slides
Company Profile
Free

Free Timeline Infographic Template
Timeline
Free
Free Multi-Level Roadmap Infographic Template for PowerPoint & Google Slides
Roadmap
Free
Multi-Step Infographic Process Layout Template for PowerPoint & Google Slides
Process
Multi-Style Flow Infographic Slide template for PowerPoint & Google Slides
Process
Automotive Infographic Multi-Layout Template for PowerPoint & Google Slides
Comparison
Multi-Phase Research Roadmap Infographic Template for PowerPoint & Google Slides
Roadmap
Free Multi-Step Funnel Infographic Slide Pack Template for PowerPoint & Google Slides
Funnel
Free
Mind Map PowerPoint template for PowerPoint & Google Slides
Mind Maps
Diamond Mind Map Diagram Four Branches Template for PowerPoint & Google Slides
Mind Maps
Risk Management Mind Map Radial Diagram template for PowerPoint & Google Slides
Mind Maps
Creative Mind Map PowerPoint Template
Mind Maps
Mind Map Infographics template for PowerPoint & Google Slides
Mind Maps
Mind Map Diagram Template for PowerPoint & Google Slides
Mind Maps
Mind Map Template for PowerPoint & Google Slides
Mind Maps
Mind Map Template for PowerPoint & Google Slides
Mind Maps
Colorful Mind Map Template for PowerPoint & Google Slides
Mind Maps
Colorful Mind Map Template for PowerPoint & Google Slides
Mind Maps
Circular Mind Map Template for PowerPoint & Google Slides
Mind Maps
Colorful Mind Map with Icons Template for PowerPoint & Google Slides
Mind Maps
Colorful Mind Map Template for PowerPoint & Google Slides
Mind Maps
Mind Map Template for Presentation
Mind Maps
Connect the Dots Mind Map template for PowerPoint & Google Slides
Mind Maps
Connect the Dots Mind Map Diagram Template for PowerPoint & Google Slides
Mind Maps
Modern Custom Eight-Branch Mind Map Template for PowerPoint & Google Slides
Mind Maps
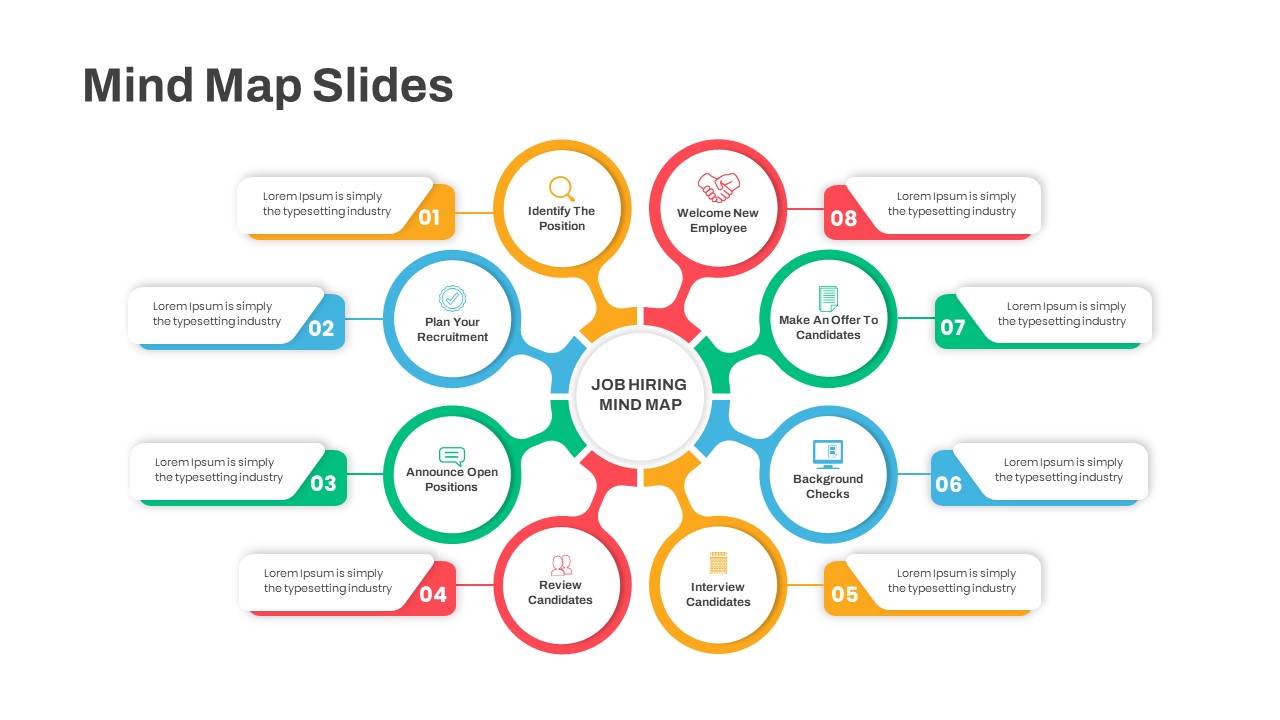
Eight-Step Job Hiring Mind Map Template for PowerPoint & Google Slides
Mind Maps
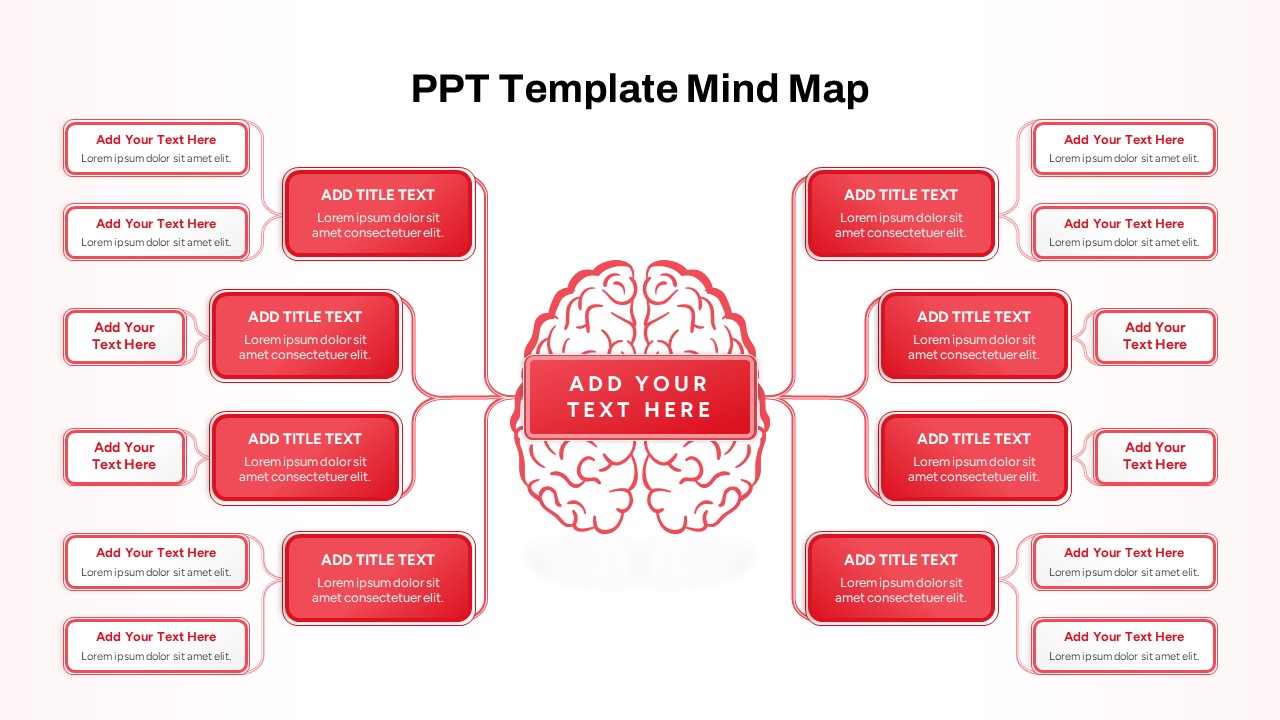
PPT Template Mind Map
Mind Maps
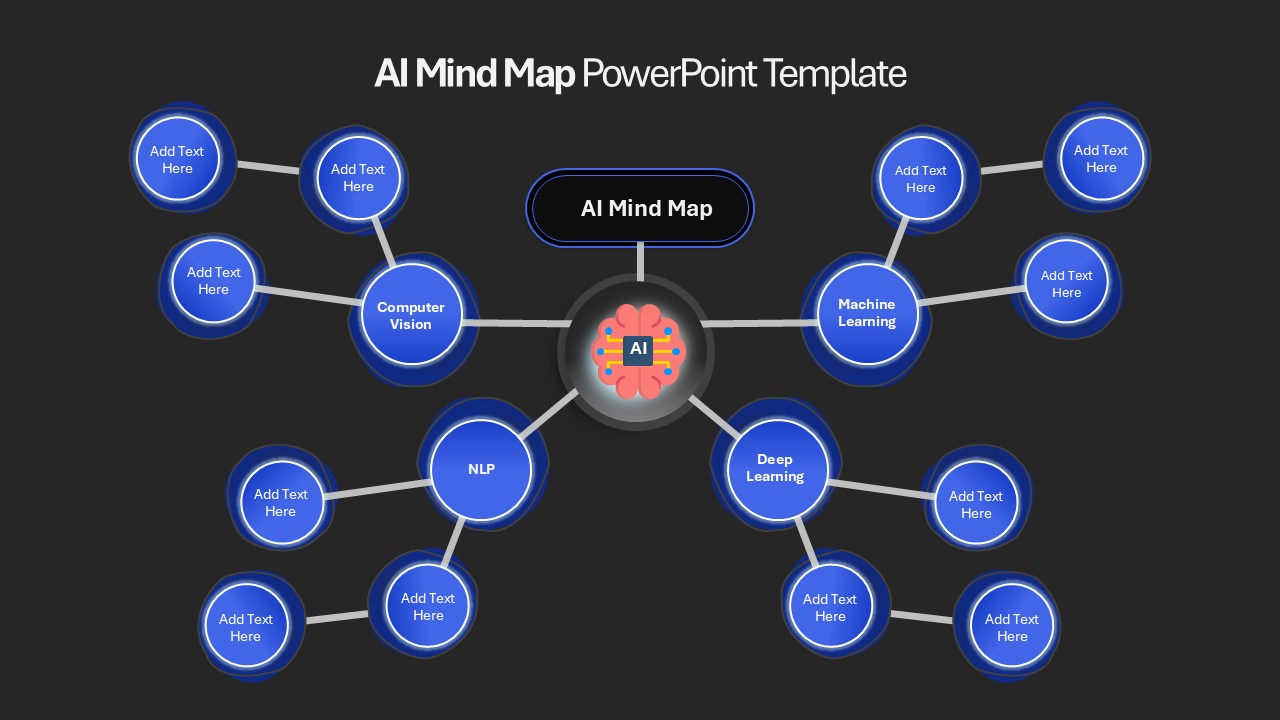
AI Mind Map & Hub-and-Spoke Diagram Template for PowerPoint & Google Slides
Mind Maps
Creative Bubble Mind Map Template for PowerPoint & Google Slides
Mind Maps
Social Media Mind Network Infographic Template for PowerPoint & Google Slides
Digital Marketing
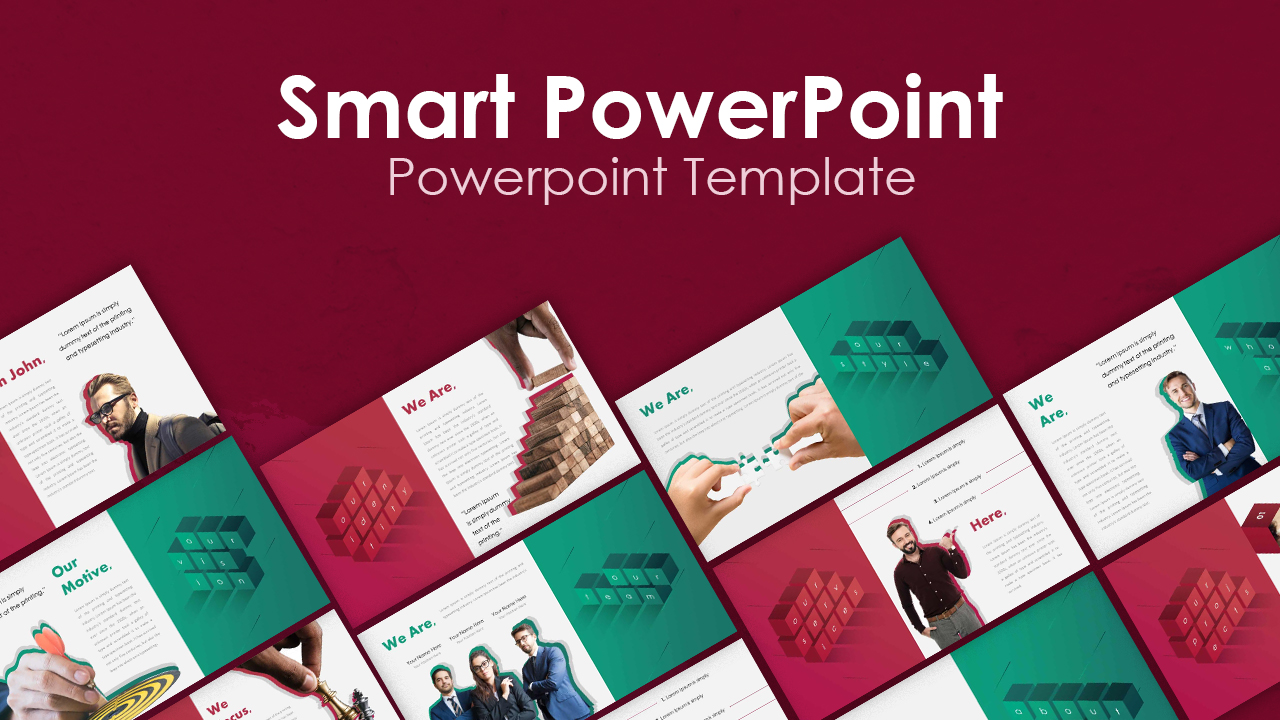
Smart PowerPoint Deck Template
Company Profile
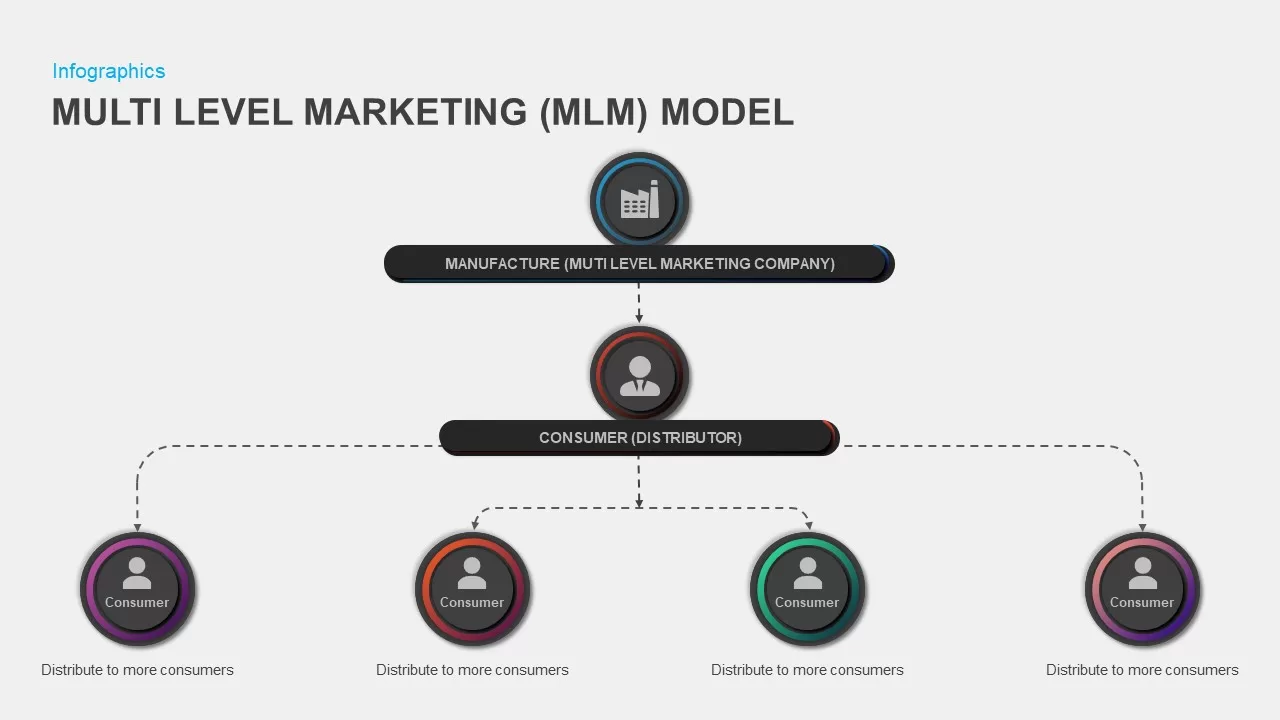
Multi-Level Marketing PowerPoint Template for PowerPoint & Google Slides
Business Models
Multi-Series Curved Line Graph Analytics Template for PowerPoint & Google Slides
Comparison Chart
Multi-Segment Circle Split Diagram template for PowerPoint & Google Slides
Circular
Horizontal Multi-Level Hierarchy Chart template for PowerPoint & Google Slides
Org Chart
Multi-layout Circle Spoke Diagram Template for PowerPoint & Google Slides
Circular
Multi-Stage Timeline Infographics Template for PowerPoint & Google Slides
Timeline
Modern Multi-Section Circle Diagram Template for PowerPoint & Google Slides
Circular
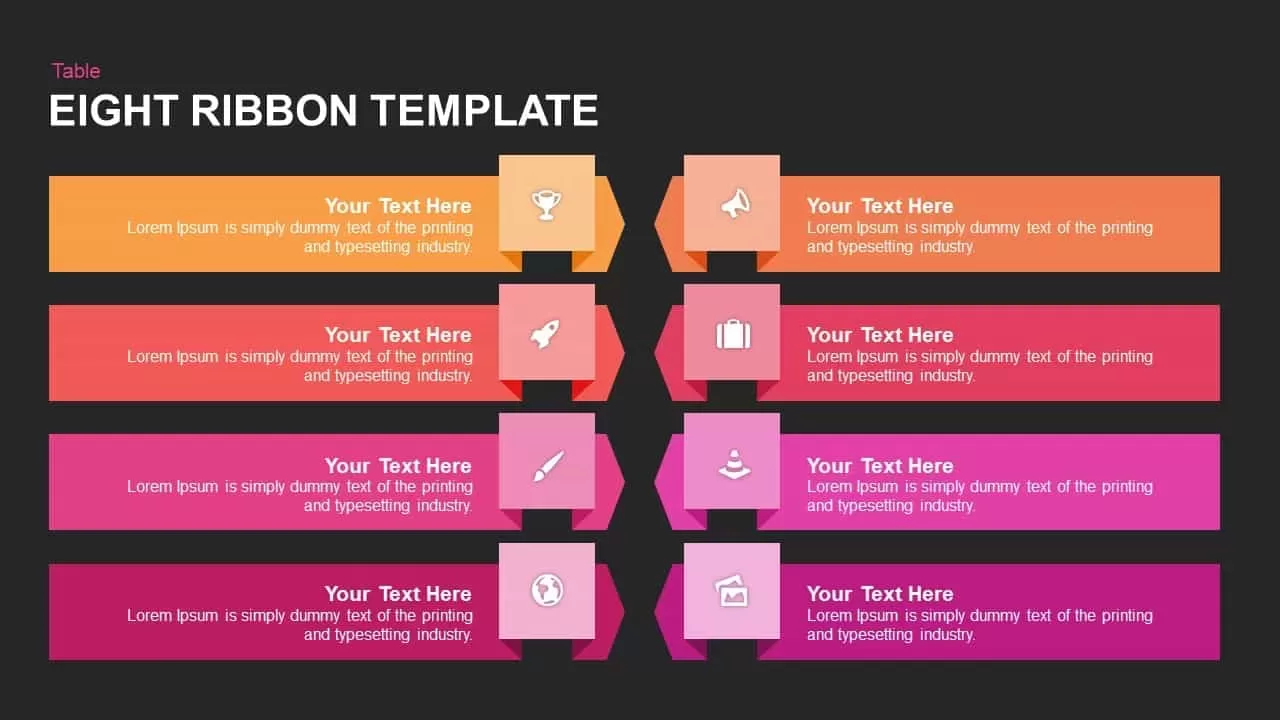
Multi-Color Eight-Step Ribbon Diagram Template for PowerPoint & Google Slides
Process
Multi-Style Presentation Agenda Template for PowerPoint & Google Slides
Agenda
Project Life Cycle Diagram Template
Process
Zalya PowerPoint Template
Pitch Deck
Multi-Color Enneagram Circular Diagram Template for PowerPoint & Google Slides
Circular
Multi-Item Agenda Hub-and-Spoke Diagram Template for PowerPoint & Google Slides
Agenda
Doodle Multi Presentation Template for PowerPoint & Google Slides
Company Profile
Free Circular Multi-Step Flow Chart Diagram Template for PowerPoint & Google Slides
Flow Charts
Free
Multi-Color Five-Step Curved Arrow Template for PowerPoint & Google Slides
Process
Multi-Series Stacked Bar Chart Template for PowerPoint & Google Slides
Bar/Column
January to December 12 Month Timeline PowerPoint Template
Timeline
Minimal Multi-Year Column Chart Template for PowerPoint & Google Slides
Bar/Column
Editable Multi-Series Peak Line Chart Template for PowerPoint & Google Slides
Comparison Chart
Multi-Color Milestone Timeline Layout Template for PowerPoint & Google Slides
Timeline
Event Timeline Template for PowerPoint & Google Slides
Timeline
Multi-Series Line Chart with Icons Template for PowerPoint & Google Slides
Comparison Chart
Multi-Series Vertical Dot Chart Template for PowerPoint & Google Slides
Comparison Chart
Delivery Timeline PowerPoint Template
Timeline
Multi-Variation Thermometer Chart Template for PowerPoint & Google Slides
Bar/Column
Cost Comparison PowerPoint Template
Comparison
Multi-Style Clock Chart Diagram Template for PowerPoint & Google Slides
Circular
Multi-Variation Circular Chart Diagram Template for PowerPoint & Google Slides
Circular
Free Ribbon Agenda PowerPoint Template
Agenda
Free
Technology Roadmap PowerPoint Template
Roadmap
Modern Multi-Color Polar Chart Diagram Template for PowerPoint & Google Slides
Charts
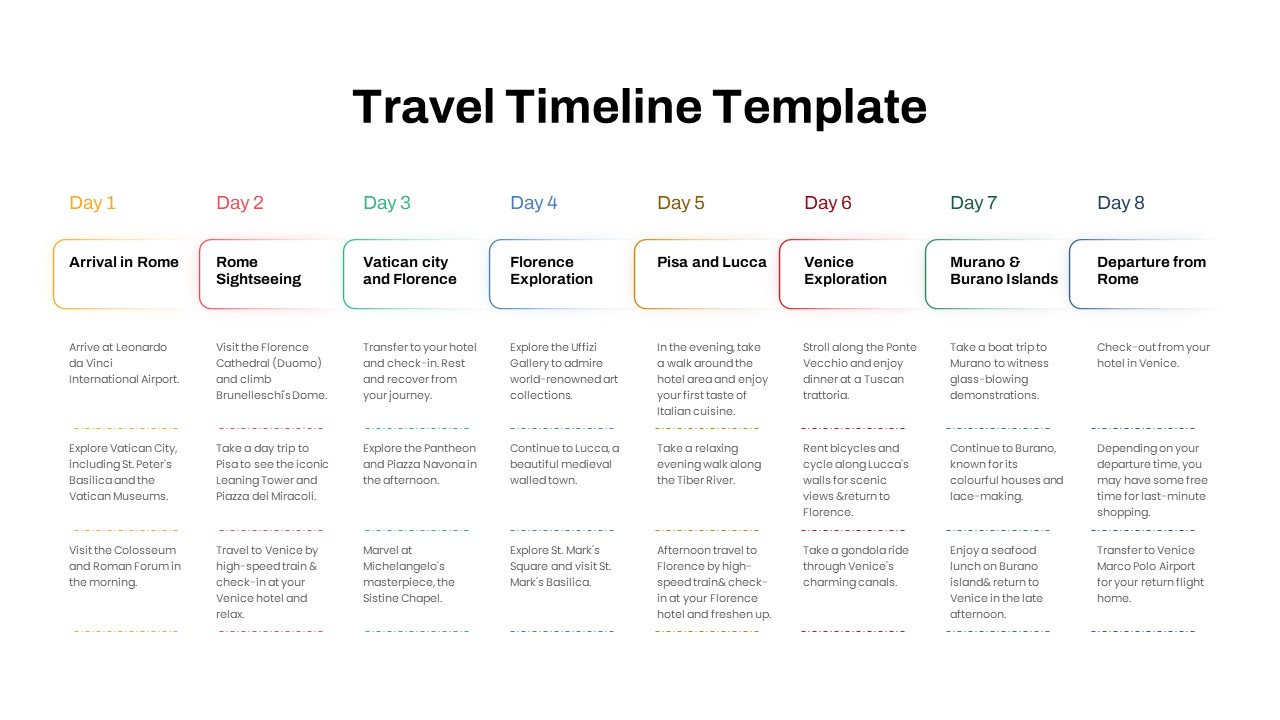
Free Elegant Multi-Day Travel Timeline Template for PowerPoint & Google Slides
Timeline
Free
Wheel Chart PowerPoint Templates
Pie/Donut
Multi-Level Colorful Pyramid Chart Template for PowerPoint & Google Slides
Pyramid
Free Table Of Contents PowerPoint Slides Template
Agenda
Free
Multi-color Curved Timeline Roadmap Template for PowerPoint & Google Slides
Timeline
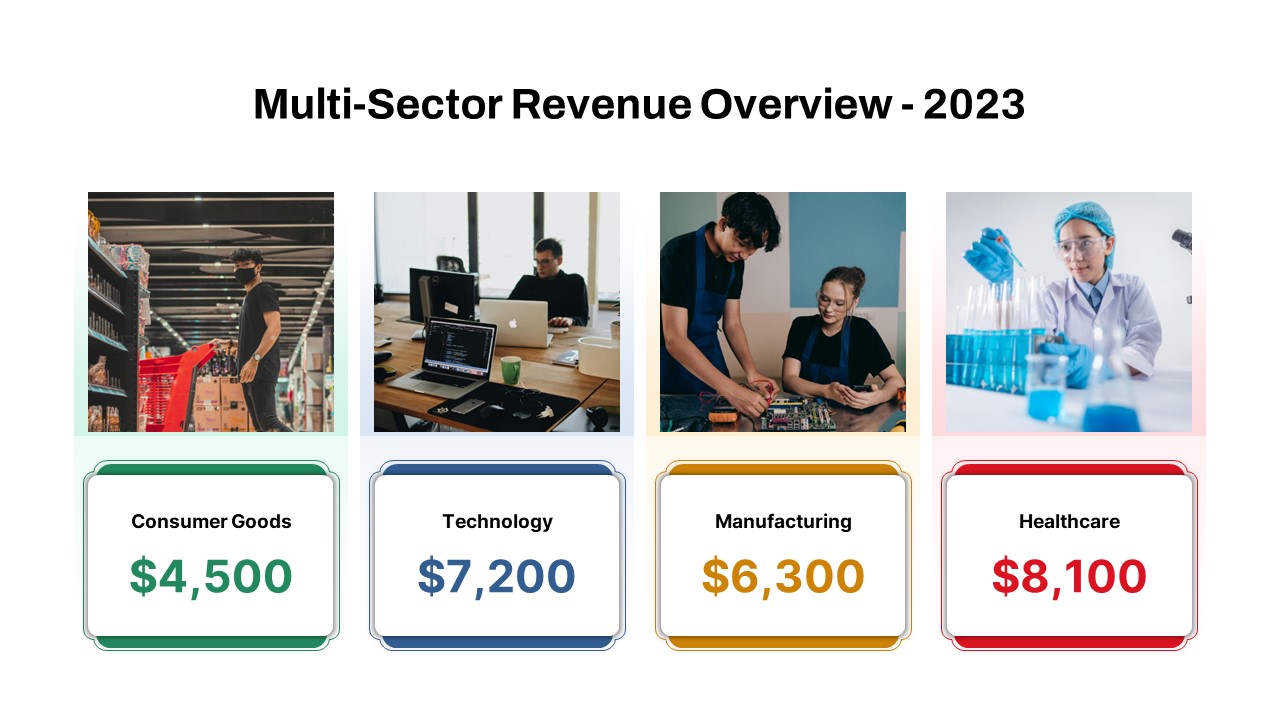
Multi-Sector Revenue Breakdown Cards Template for PowerPoint & Google Slides
Comparison
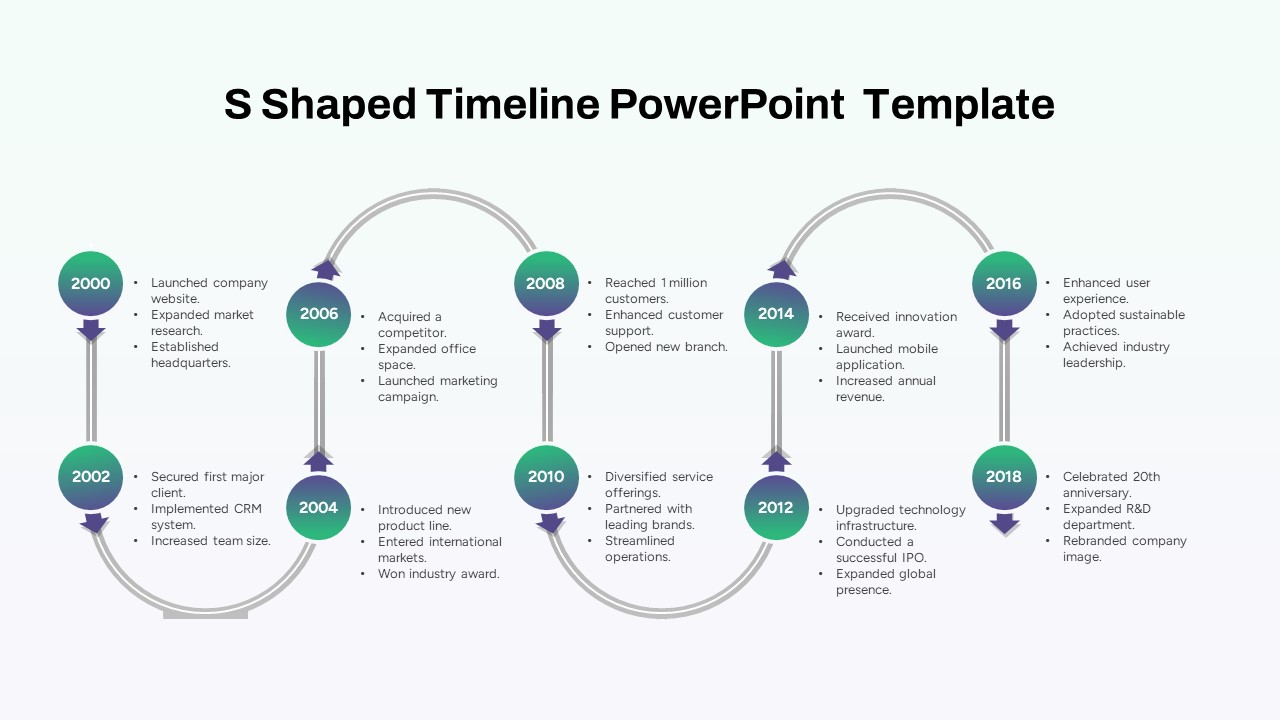
Multi-Year S-Shaped Roadmap Timeline Template for PowerPoint & Google Slides
Timeline
Multi-Style Board of Directors Profile Template for PowerPoint & Google Slides
Our Team
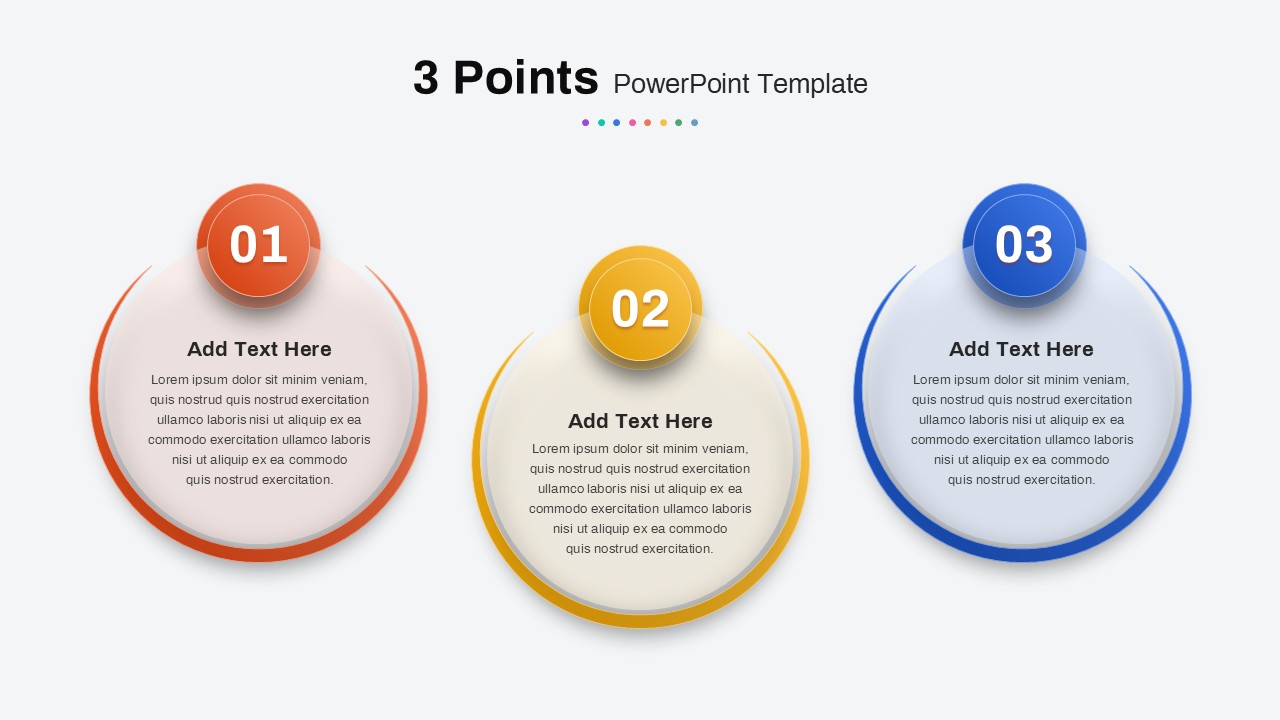
Multi-Point Diagram Presentation Template for PowerPoint & Google Slides
Process
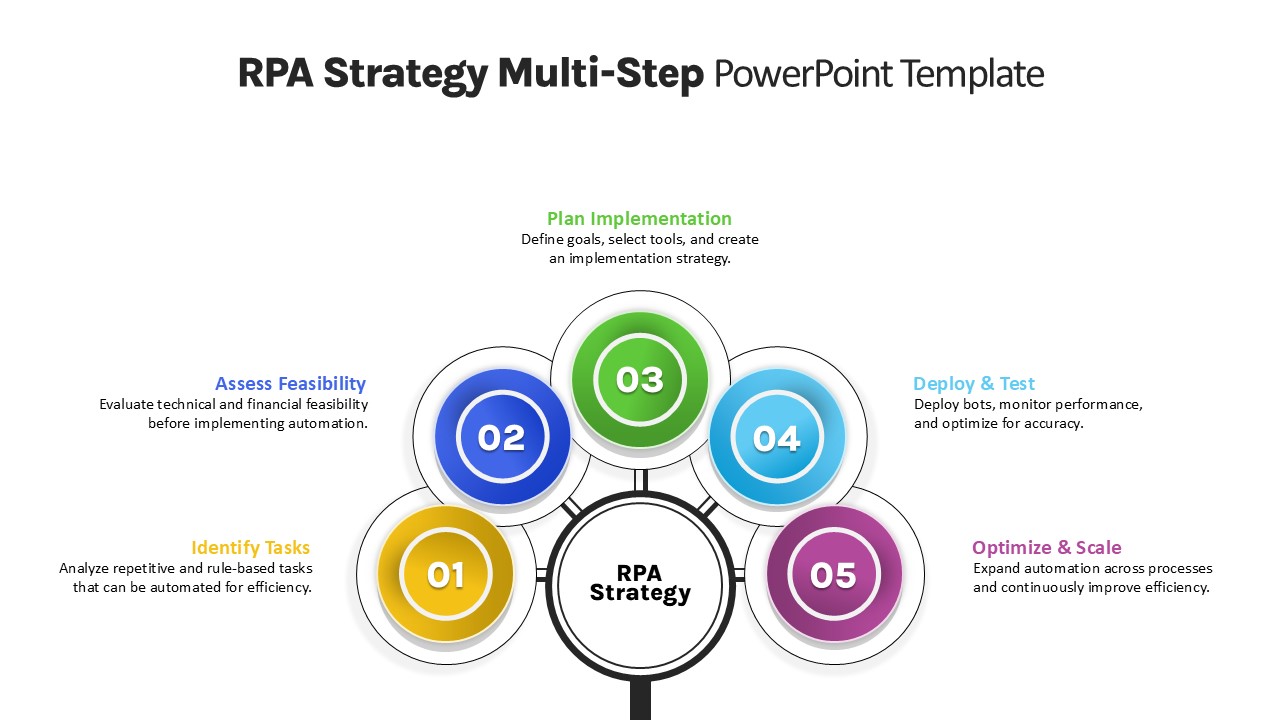
RPA Strategy Multi-Step Diagram Template for PowerPoint & Google Slides
Process
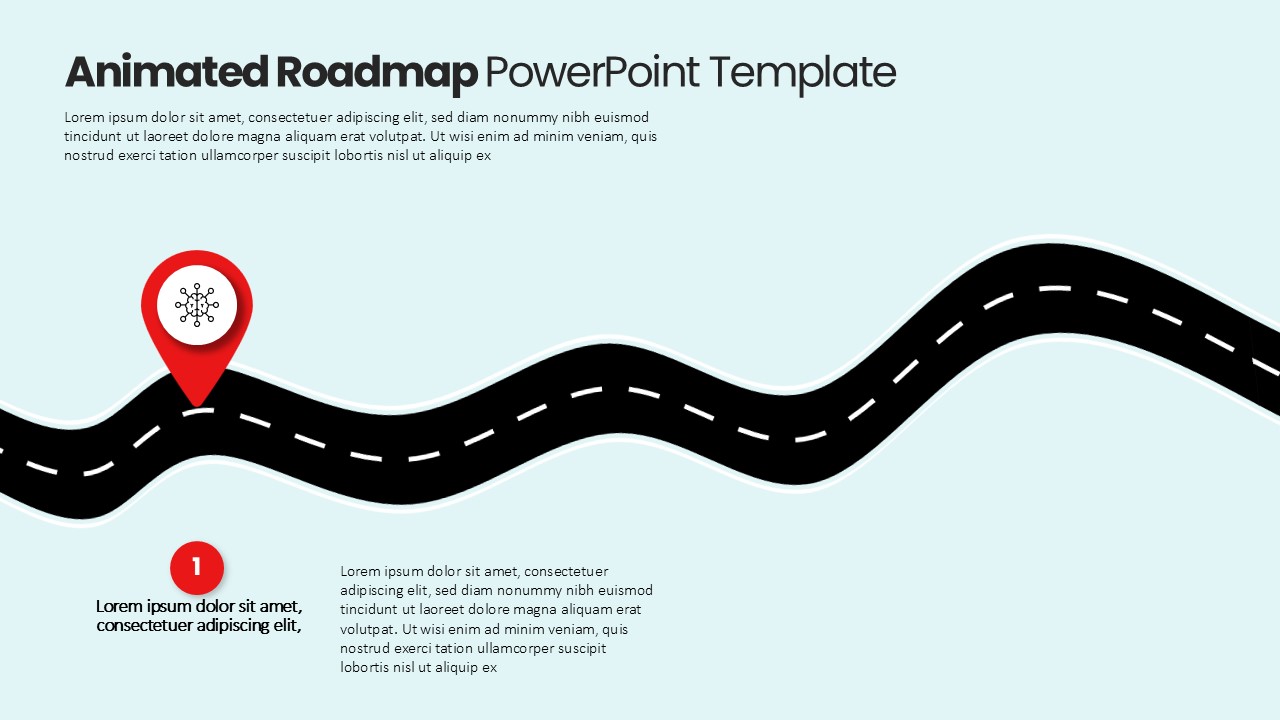
Animated Multi-Milestone Roadmap Template for PowerPoint & Google Slides
Roadmap
Multi-Column Table Presentation Template for PowerPoint & Google Slides
Table
Six-Row Multi-Column Table Presentation Template for PowerPoint & Google Slides
Table
Multi Color SWOT Analysis Quadrant Template for PowerPoint & Google Slides
SWOT
Mind Mapping Hub and Spoke Diagram Template for PowerPoint & Google Slides
Mind Maps