5S Lean Process Improvement Infographic Template for PowerPoint & Google Slides

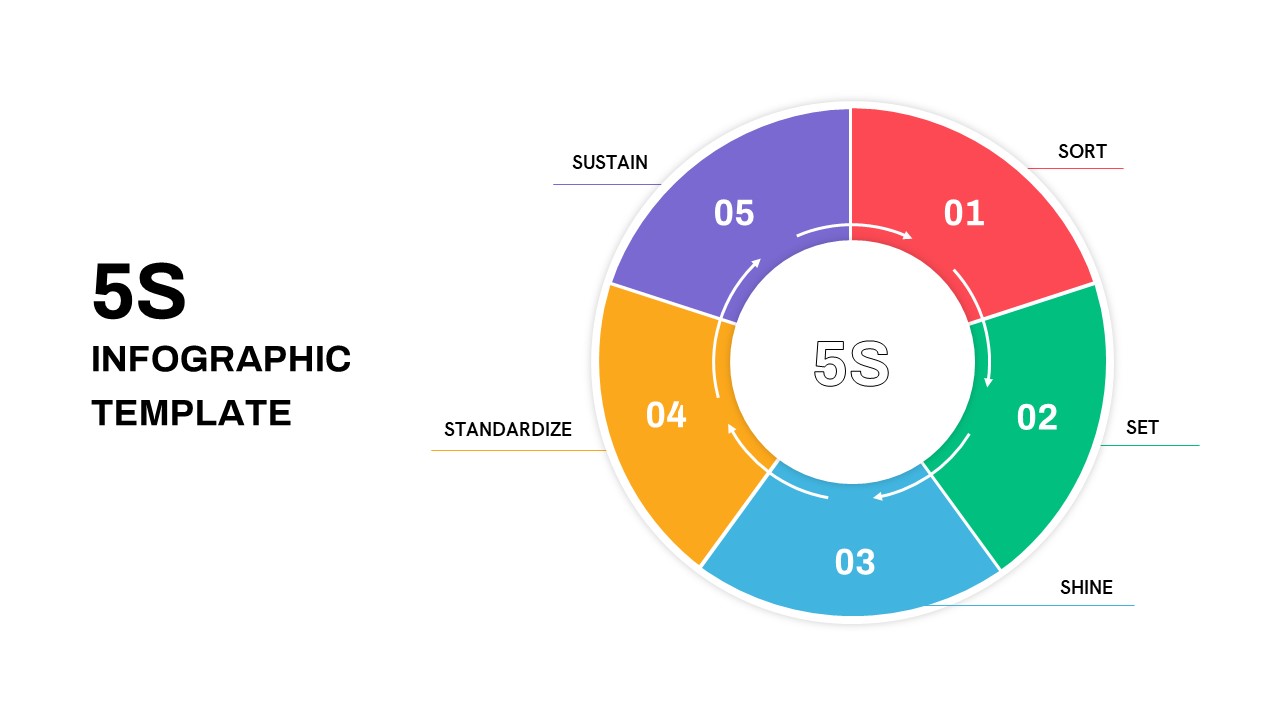

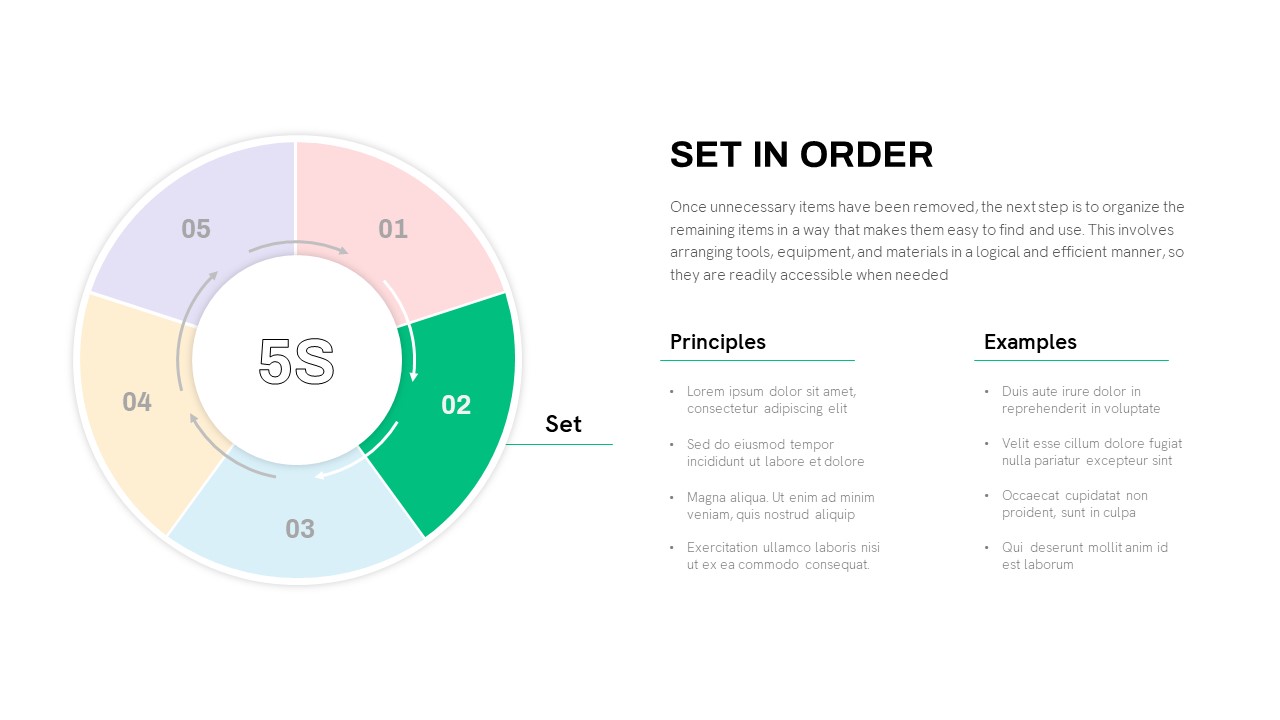
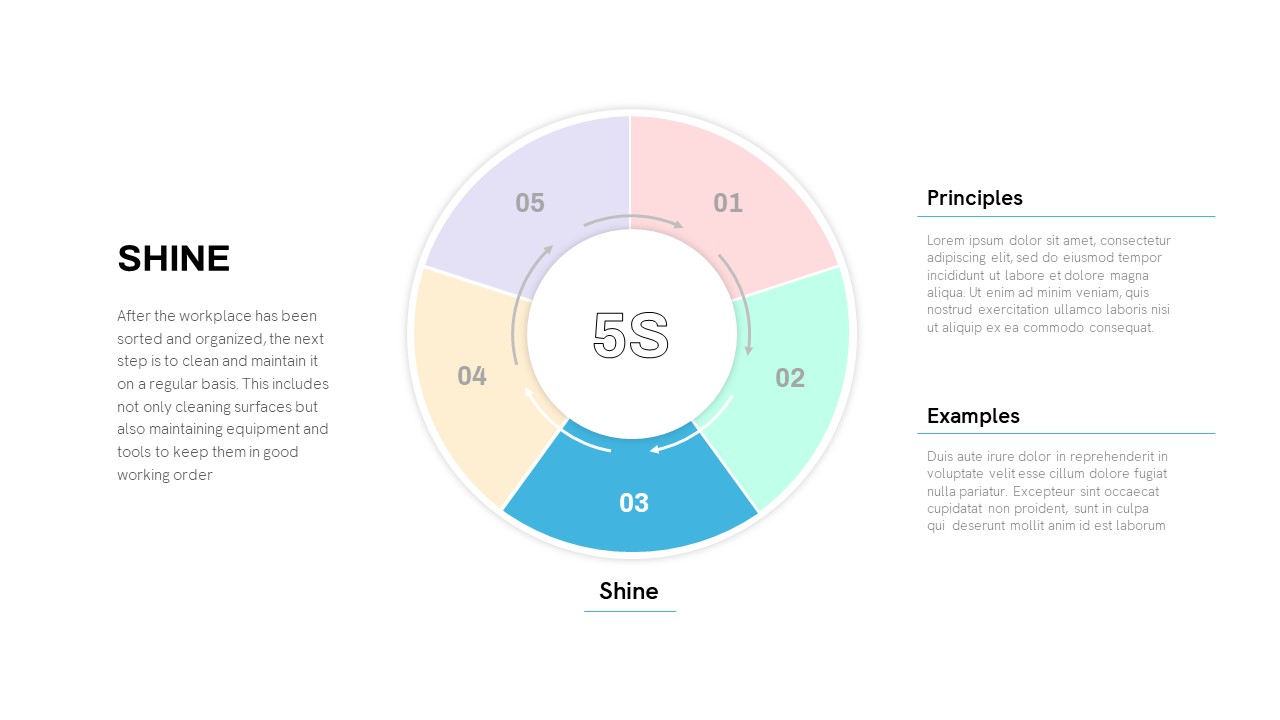
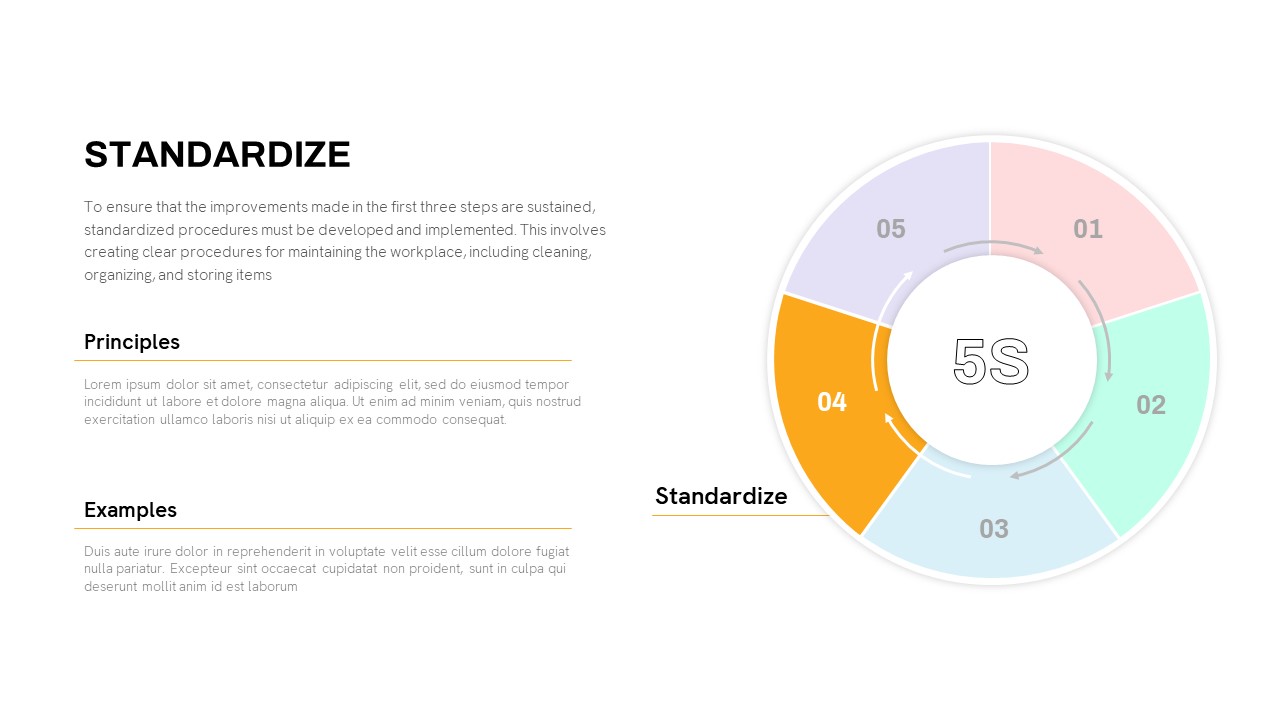
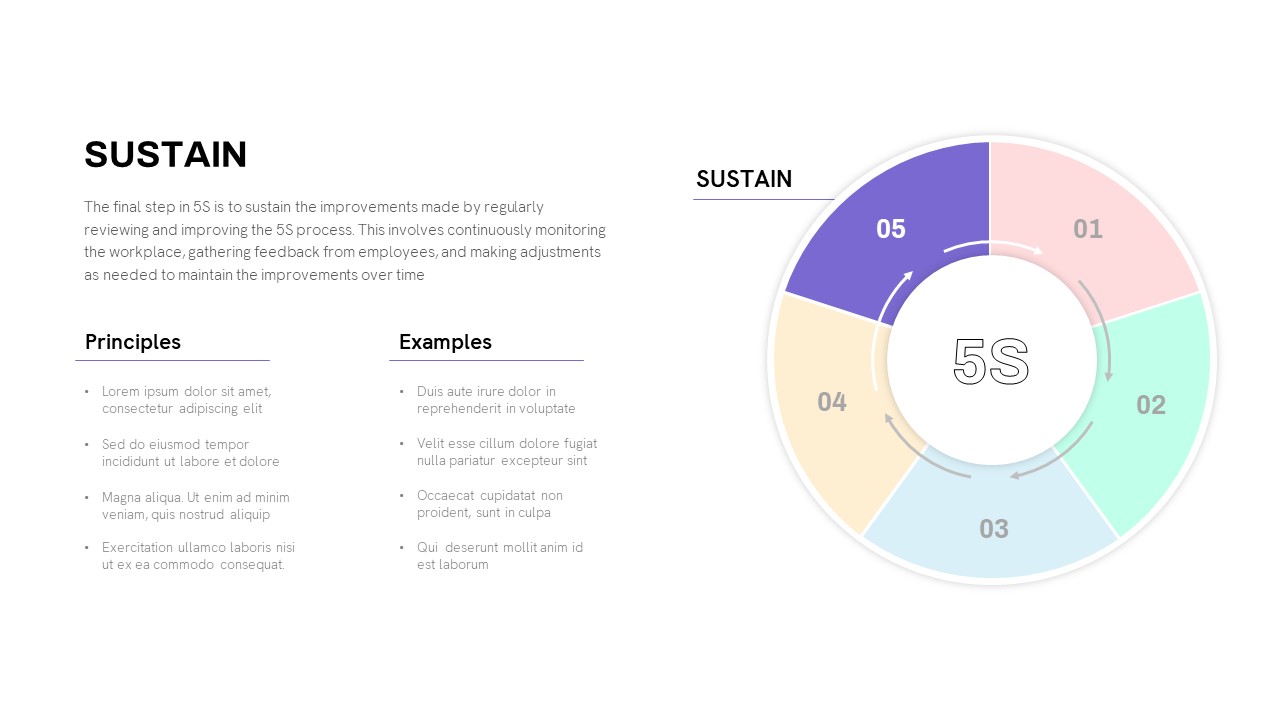
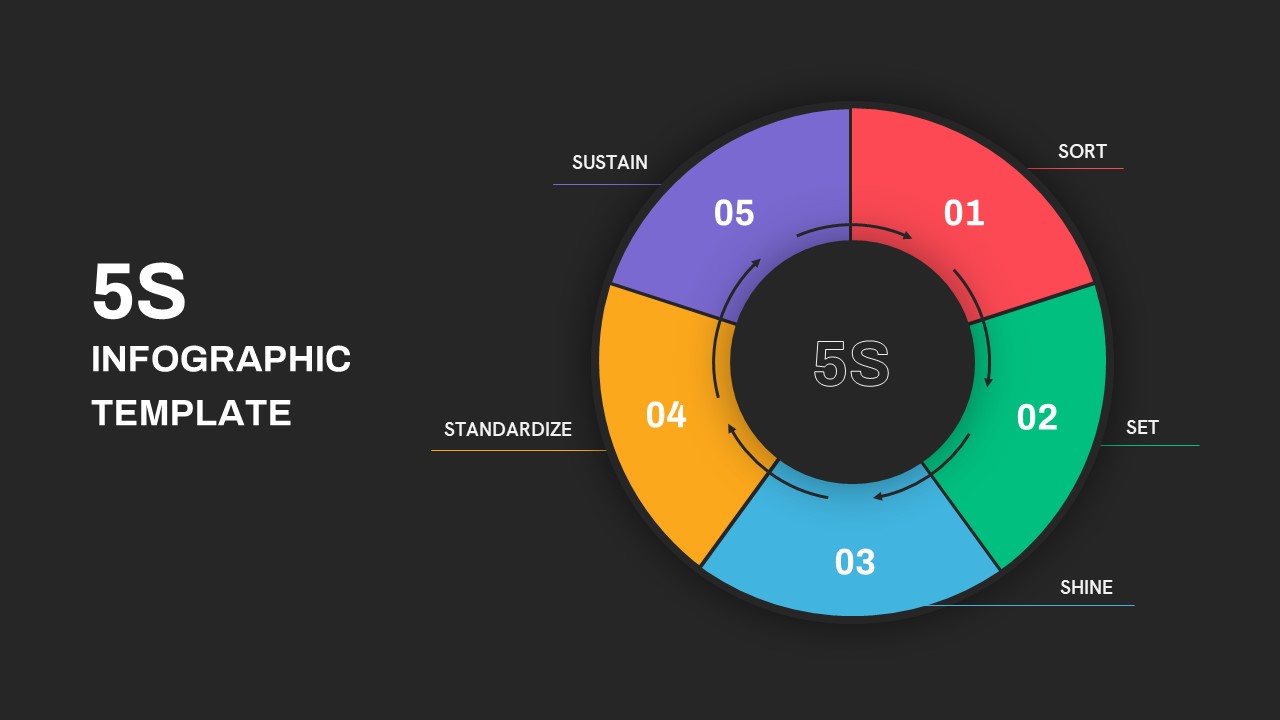


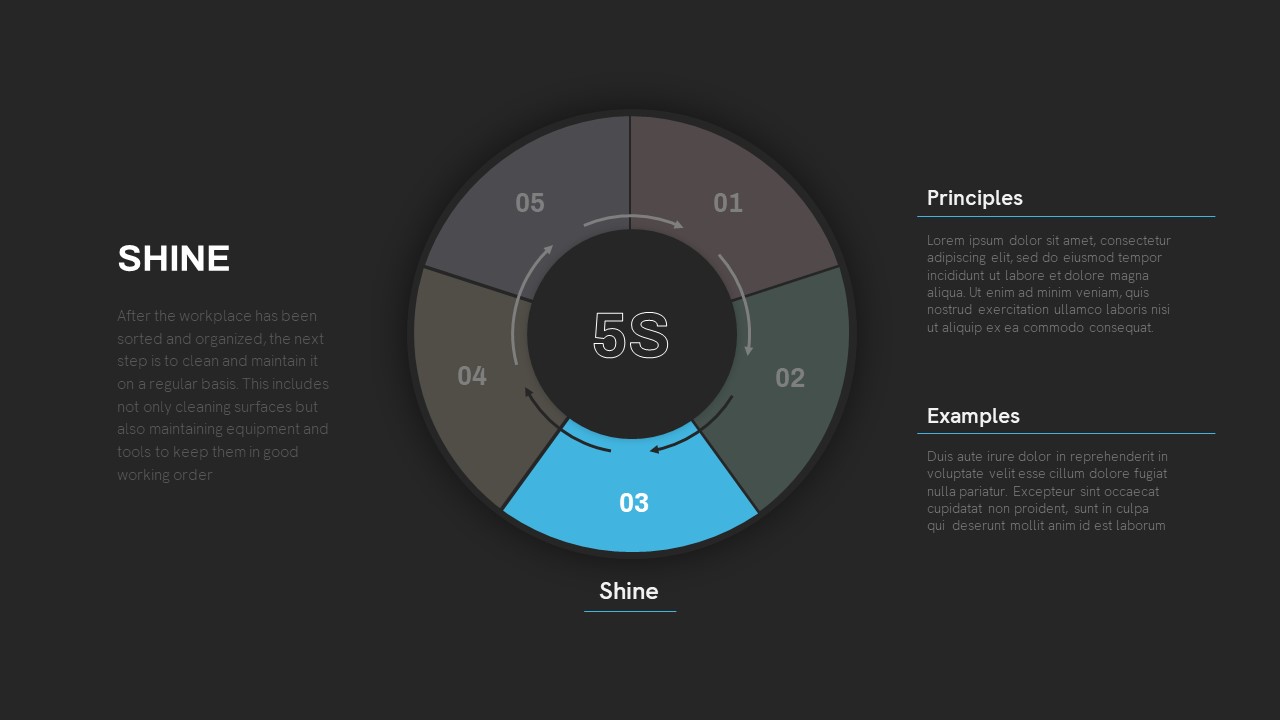
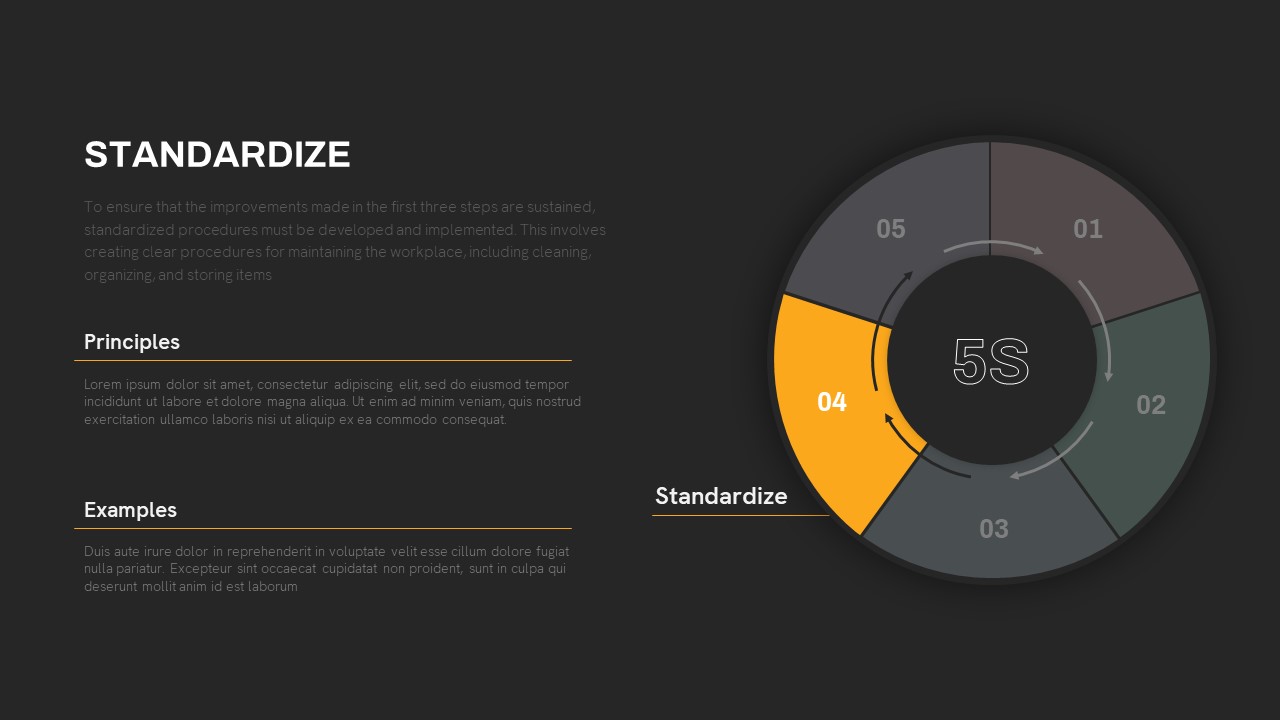
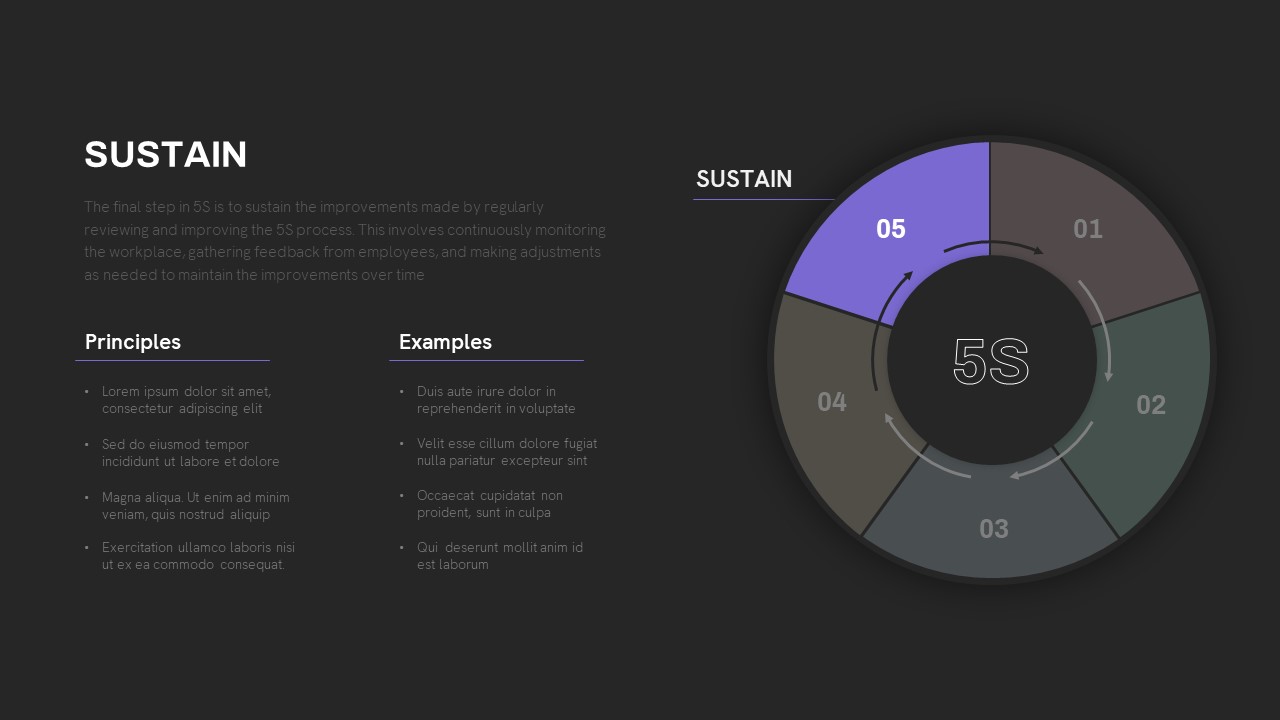
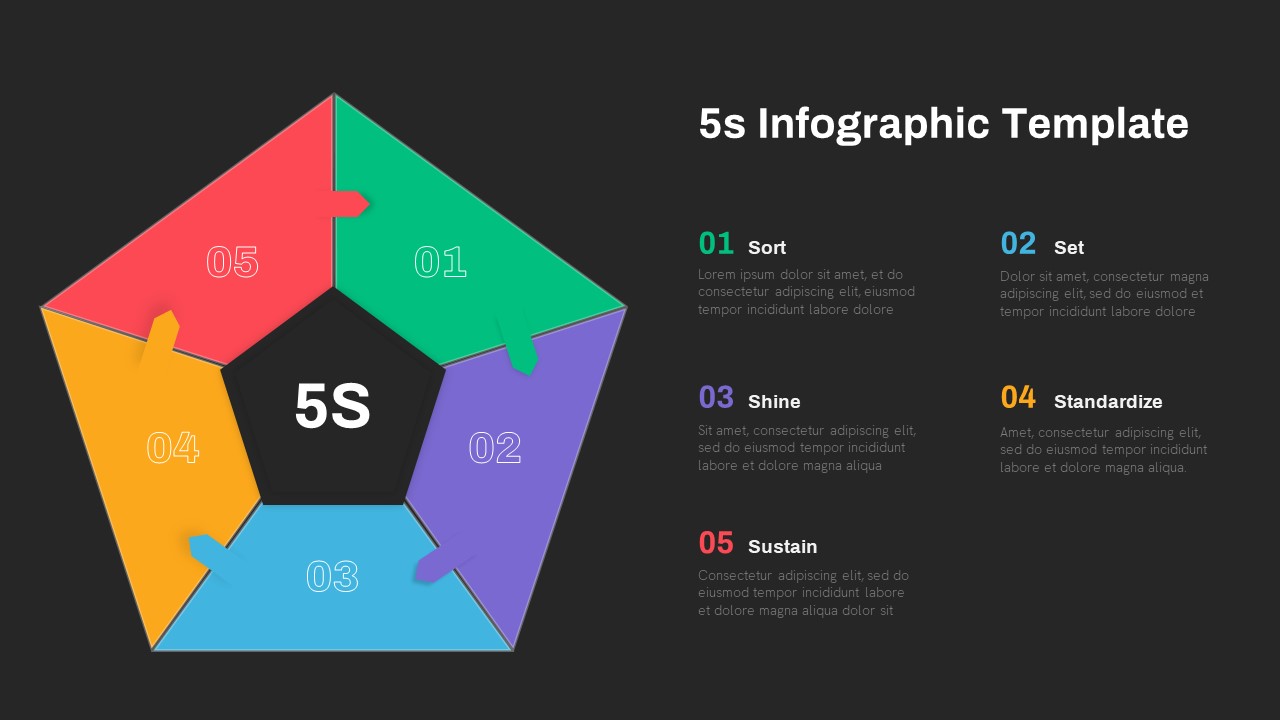
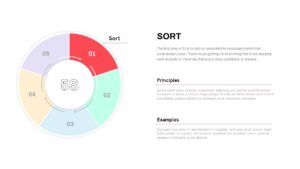


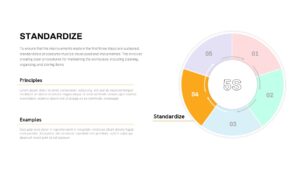


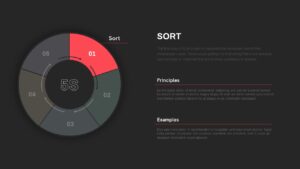
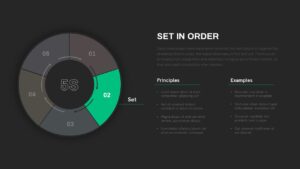
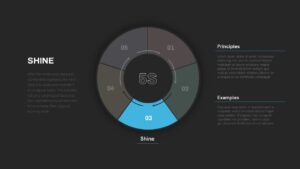
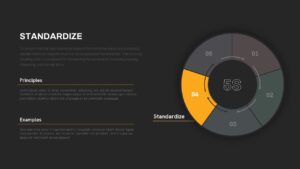


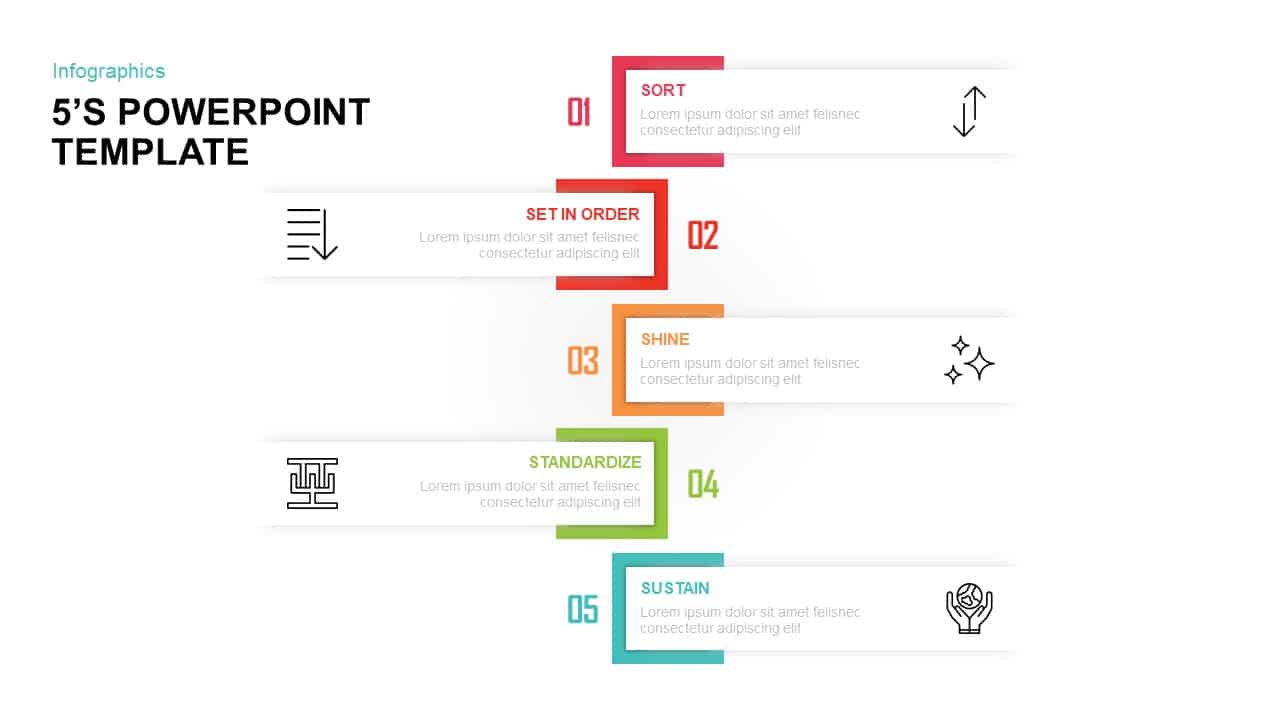
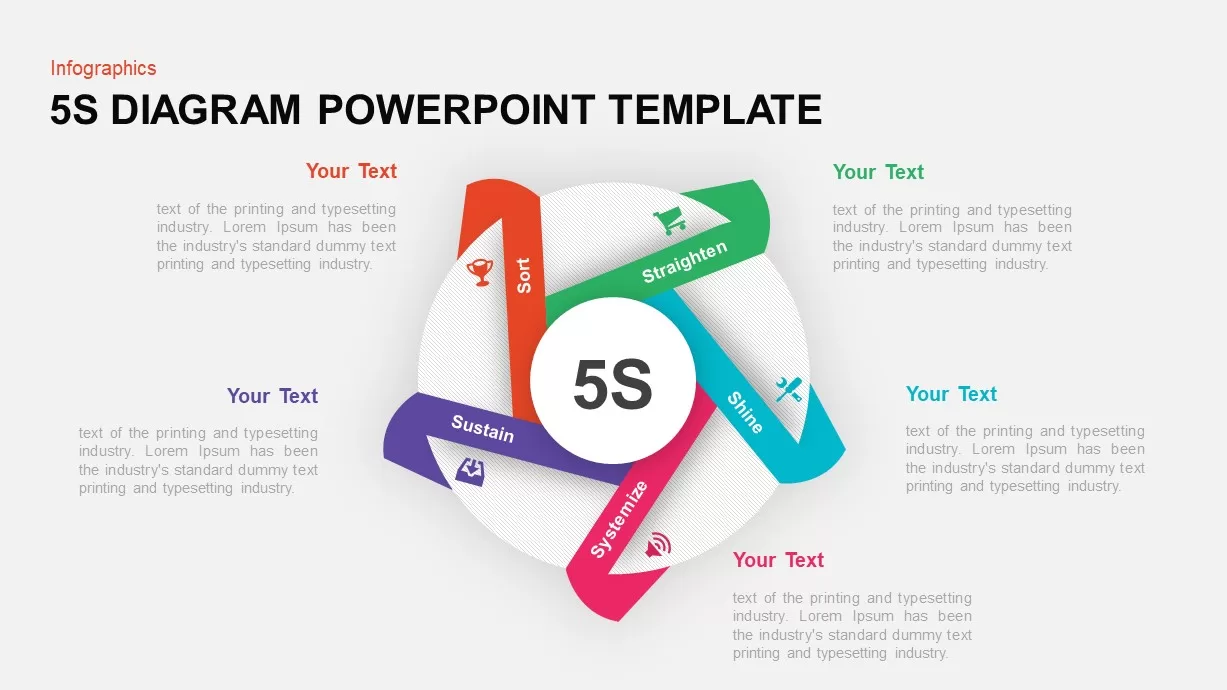
This 5S Lean Process Improvement infographic template offers two distinct layouts to effectively communicate the five pillars of workplace organization: Sort, Set, Shine, Standardize, and Sustain. The first slide features a dynamic pentagon graphic composed of five interlocking, color-coded segments encircling a central “5S” hub. Each segment is fully editable in color, shape, and orientation, allowing you to align diagrams with brand guidelines and highlight specific activities. The second slide transforms the 5S cycle into a circular donut chart, complete with directional arrows and peripheral callouts for step-by-step explanations. Both layouts use vector shapes for flawless scaling and reside on master slides in PowerPoint and Google Slides for consistent styling across your deck.
Designed for speed and simplicity, this template lets non-designers update content without sacrificing visual quality. Swap segment hues, modify text labels, and reposition leader lines with intuitive drag-and-drop controls. The pentagon layout is ideal for illustrating interdependent processes during lean training sessions or audit reviews, while the donut version emphasizes continuous flow and cyclical improvement in executive briefings. Ample white space, clear numbering, and modern sans-serif typography ensure readability—even when projecting to large audiences.
Perfect for lean practitioners, operations managers, quality engineers, and process improvement consultants, this 5S infographic accelerates workshops, audit presentations, and operational strategy meetings. Add icons to each step to denote safety checkpoints, performance metrics, or team responsibilities. Use the built-in annotation panels to incorporate brief narratives, KPI callouts, or implementation timelines. No prior design experience is needed—these master slides ensure professional-looking visuals in seconds.
Who is it for
Lean practitioners, operations managers, quality engineers, process improvement consultants, and training facilitators who need a polished visual format to teach or report on 5S implementation steps.
Other Uses
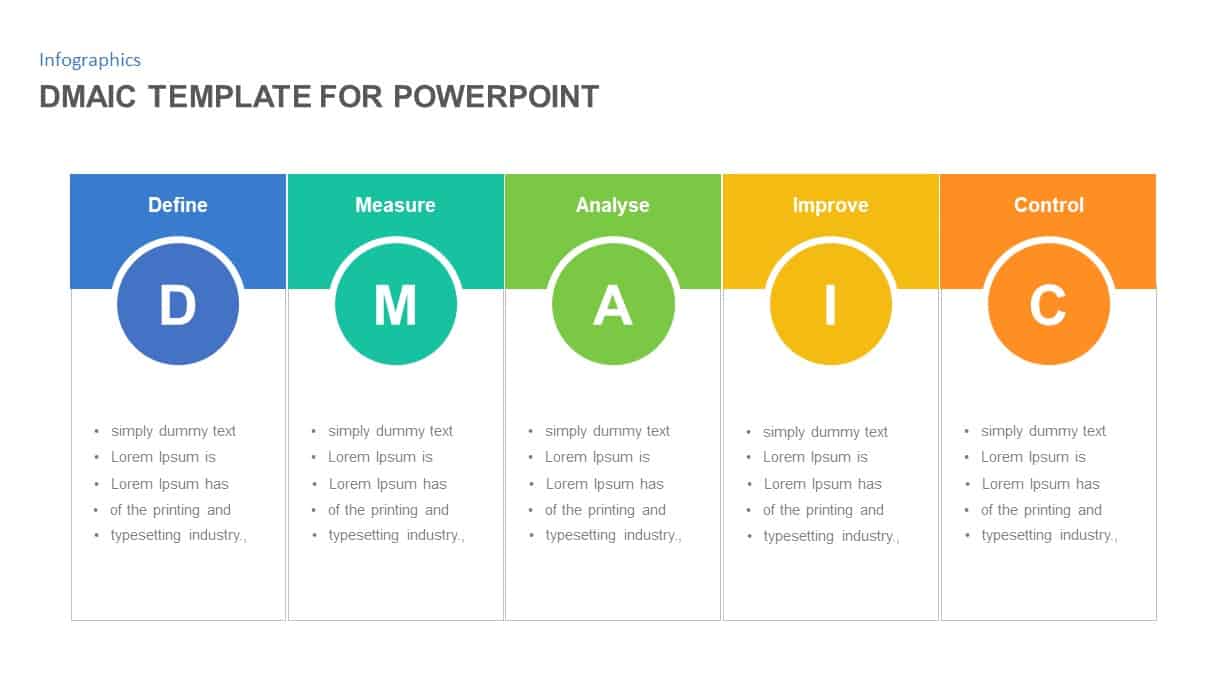
Repurpose these slides for other five-step frameworks—such as DMAIC phases in Six Sigma, project rollout stages, or product development cycles—by updating labels and colors to suit any structured process.
Login to download this file

Item ID
SB03594
Related Templates

5S Lean Methodology Infographic Template for PowerPoint & Google Slides
Process
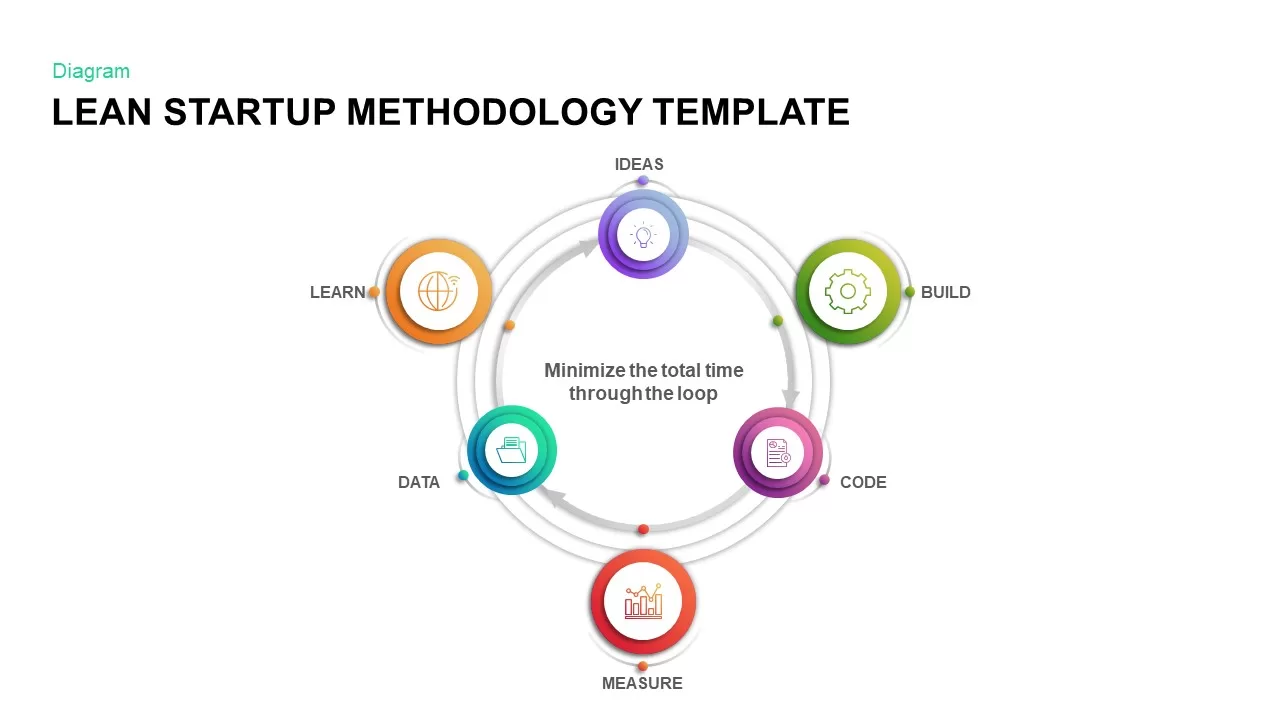
Lean Startup Methodology Infographic Template for PowerPoint & Google Slides
Circular
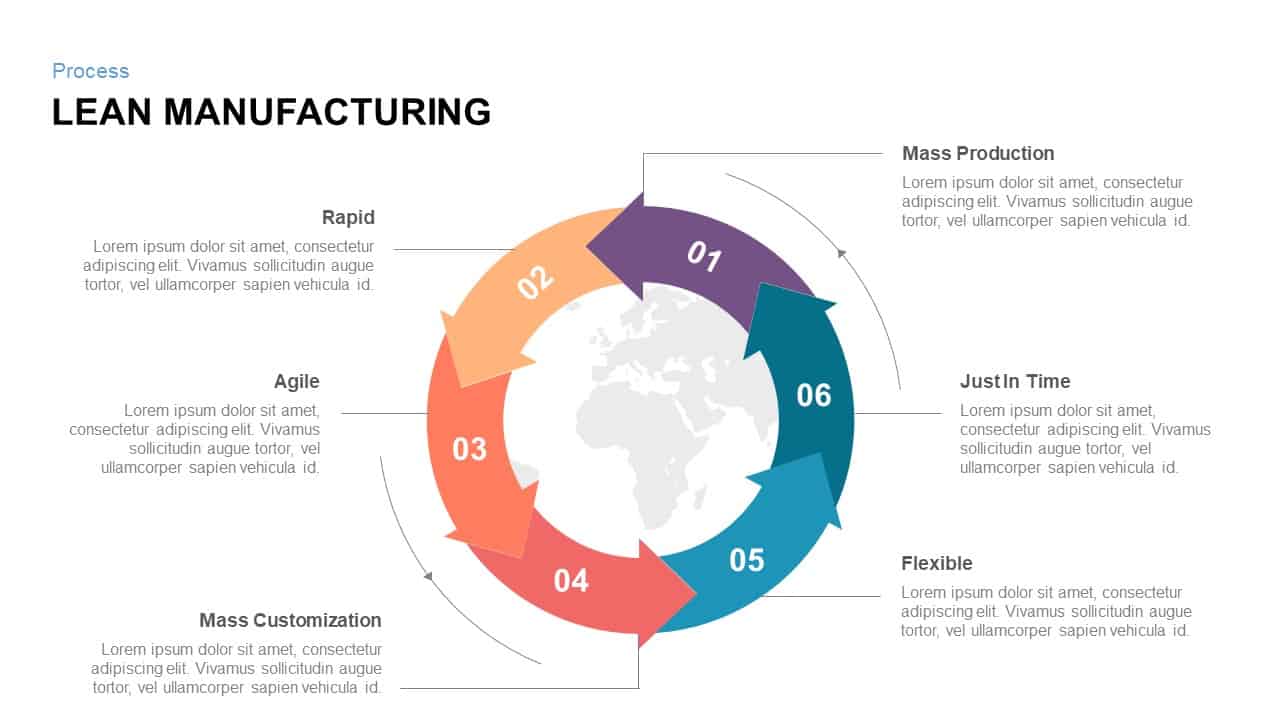
Six-Step Lean Manufacturing Process Template for PowerPoint & Google Slides
Process
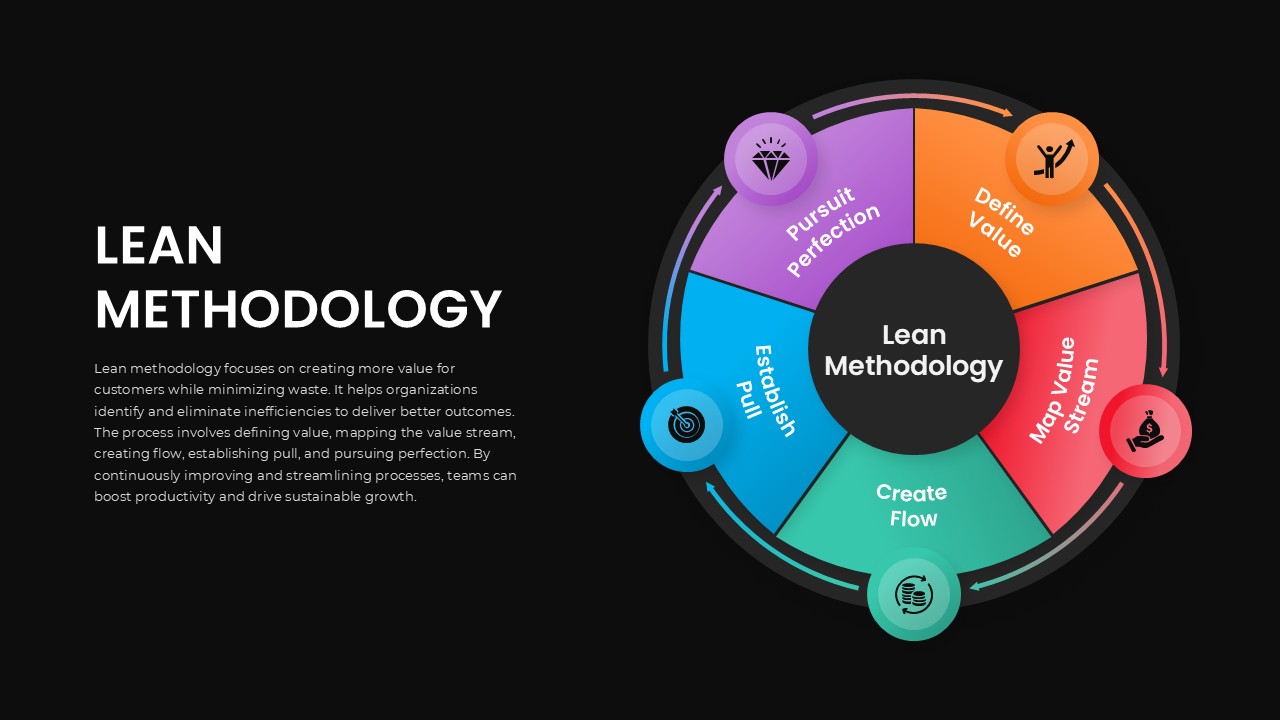
Lean Methodology Circular Process Template for PowerPoint & Google Slides
Process
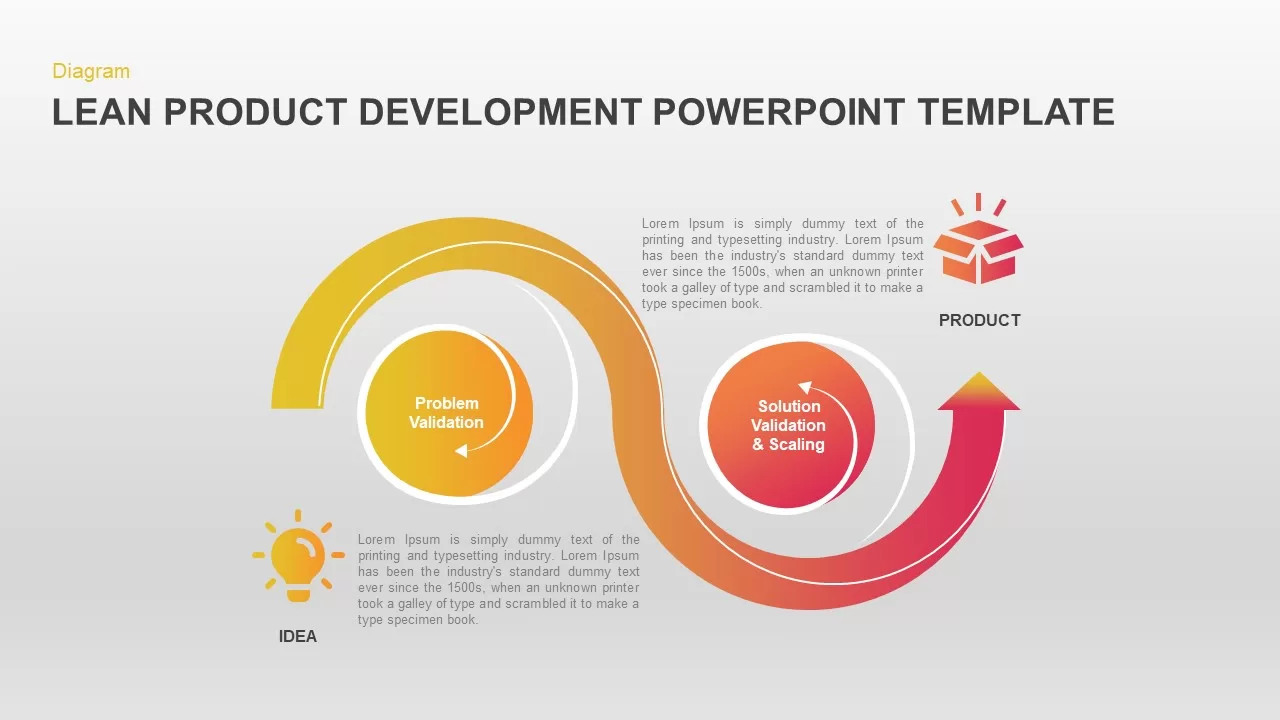
Lean Product Development Process diagram for PowerPoint & Google Slides
Business

DMAIC Process Improvement Infographic Template for PowerPoint & Google Slides
Process
5S Lean Methodology Circular Diagram Template for PowerPoint & Google Slides
Process
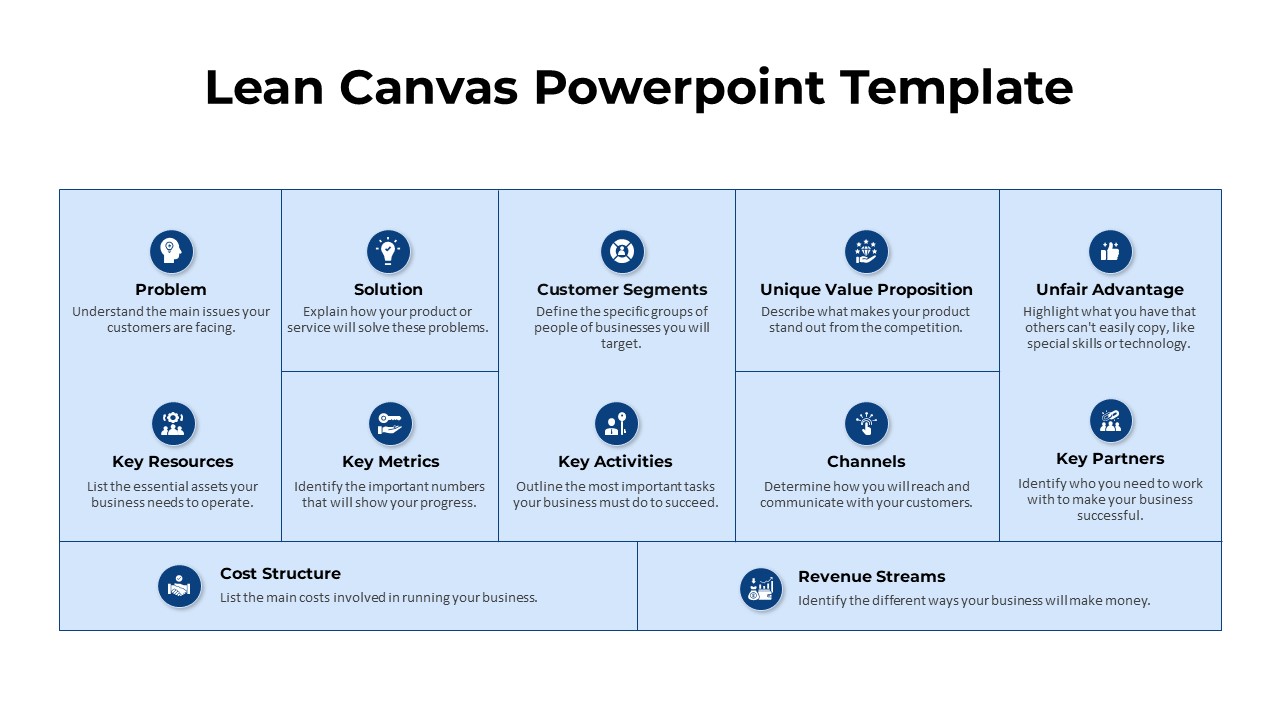
Strategic Lean Canvas Business Model Template for PowerPoint & Google Slides
Business Models

Process Improvement Metaphor Diagram Template for PowerPoint & Google Slides
Process

Continual Improvement Process Template for PowerPoint
Process
Process Improvement template for PowerPoint & Google Slides
Process
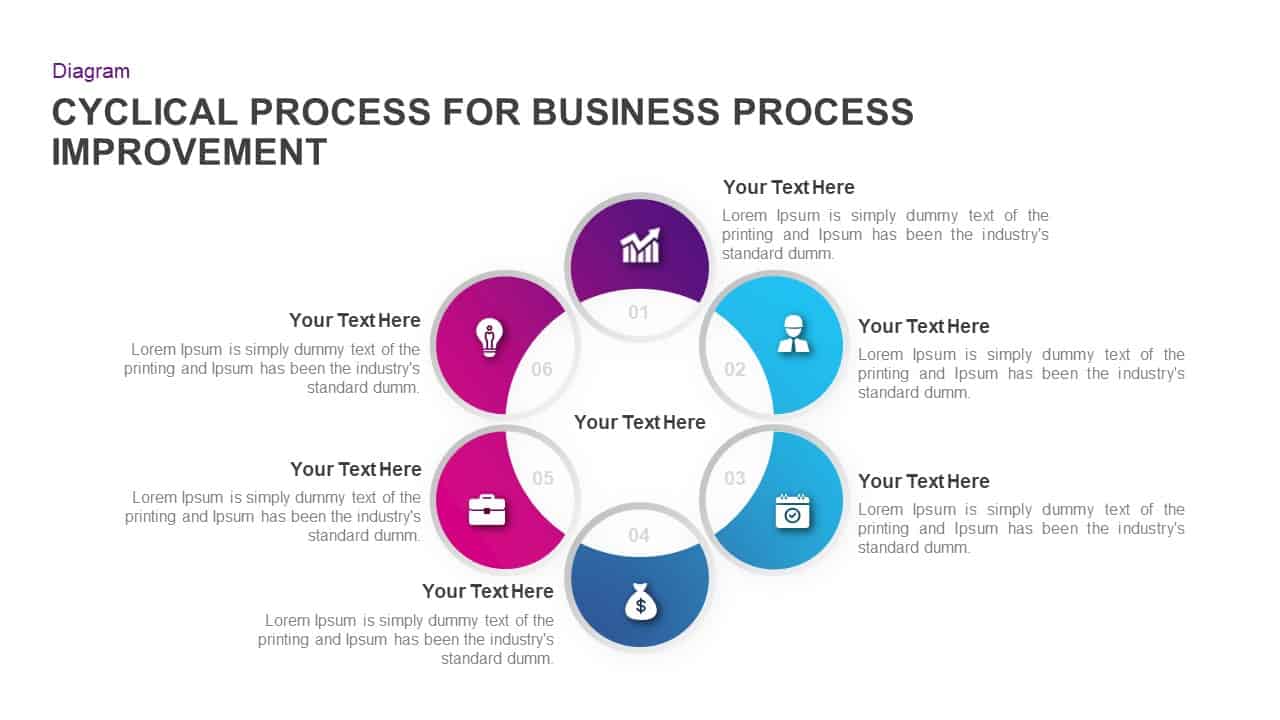
Business Process Improvement Cycle Template for PowerPoint & Google Slides
Process
Business Process Improvement Cycle Template for PowerPoint & Google Slides
Circular
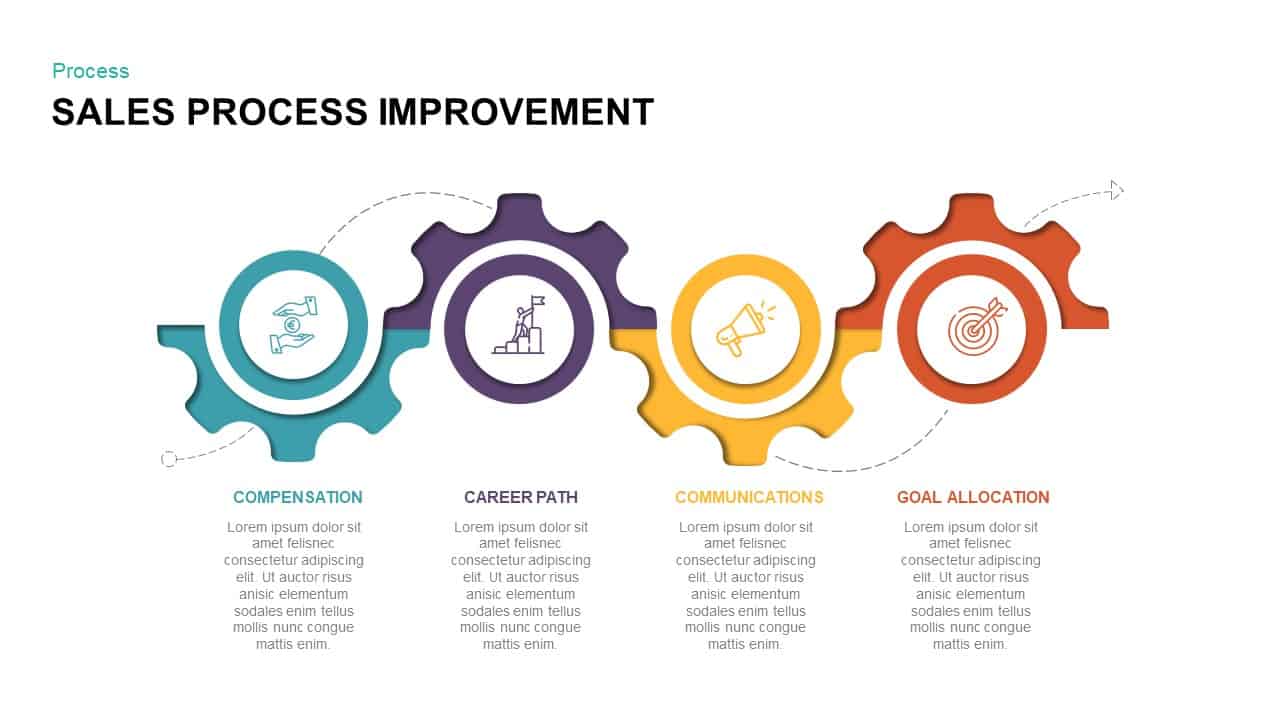
Sales Process Improvement Gear Diagram Template for PowerPoint & Google Slides
Process
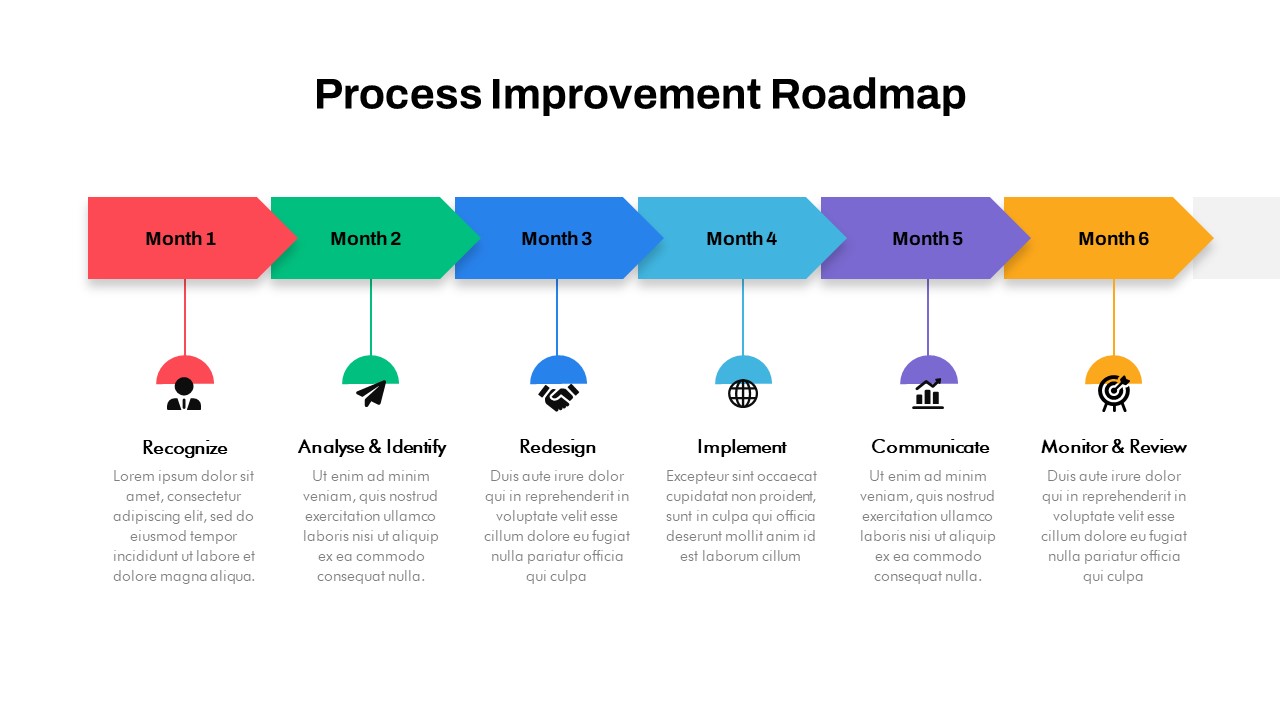
Process improvement roadmap template for PowerPoint & Google Slides
Process
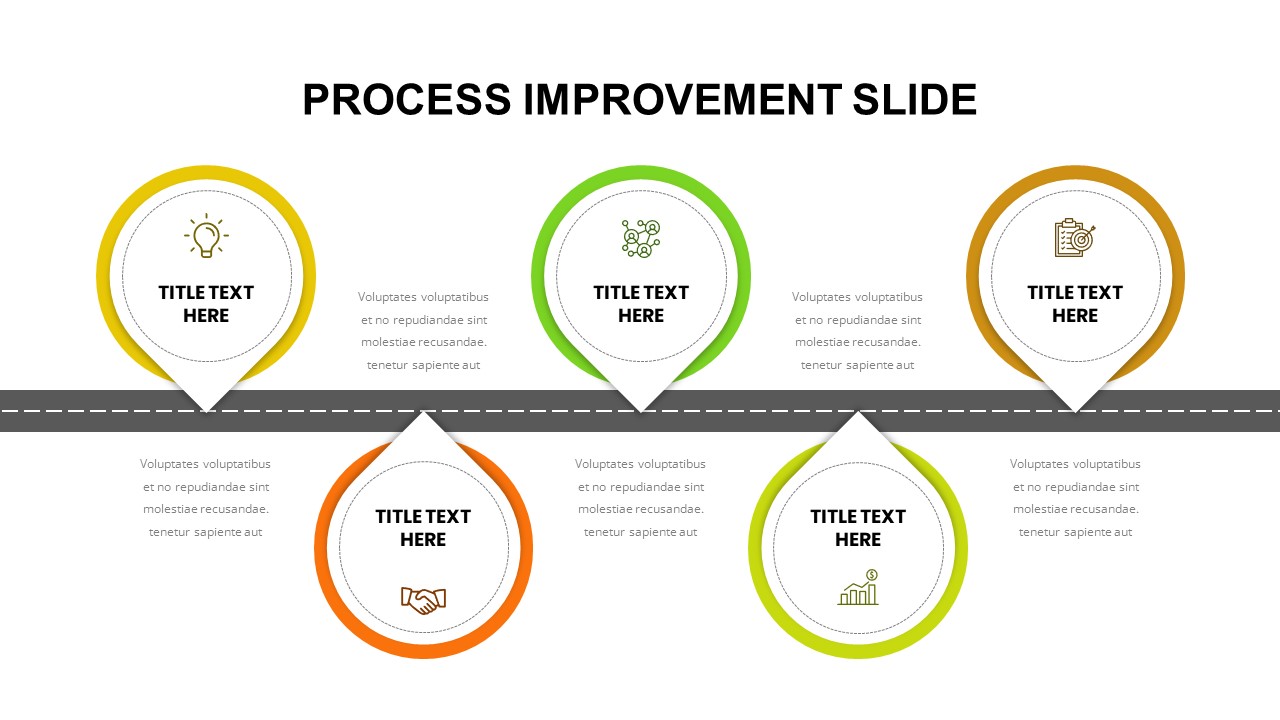
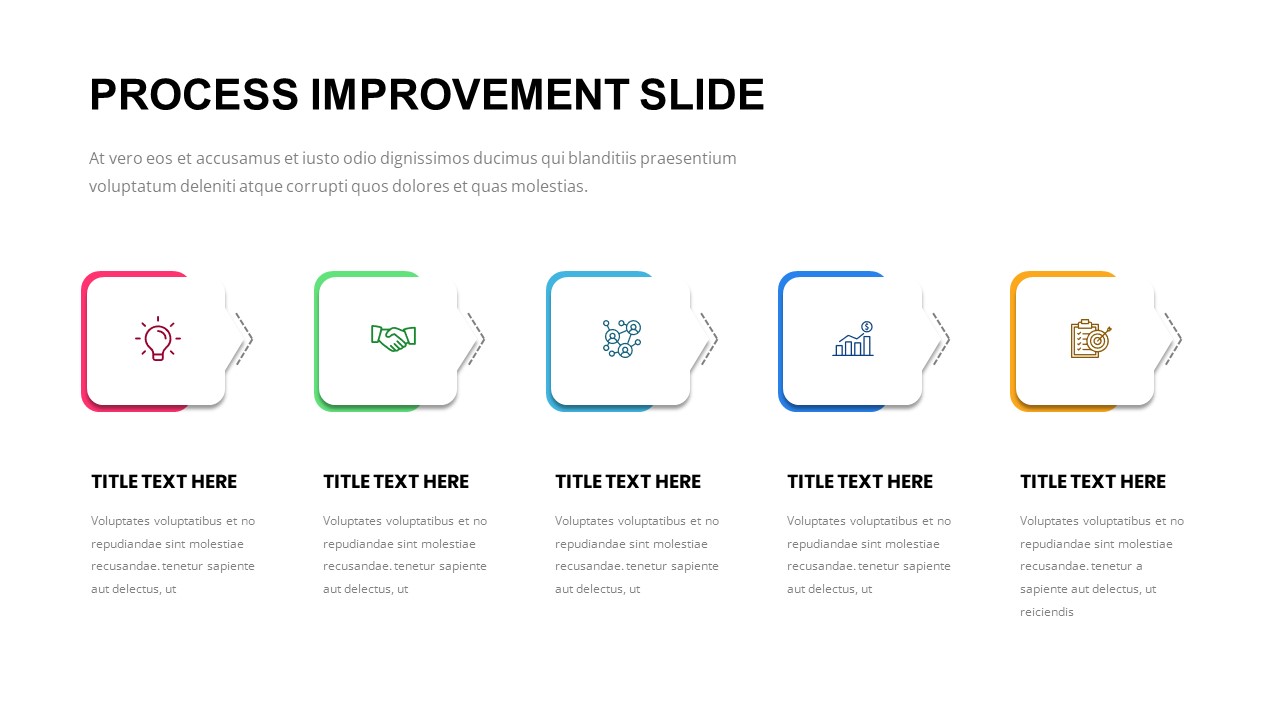
Process Improvement Slide for PowerPoint & Google Slides
Business Proposal
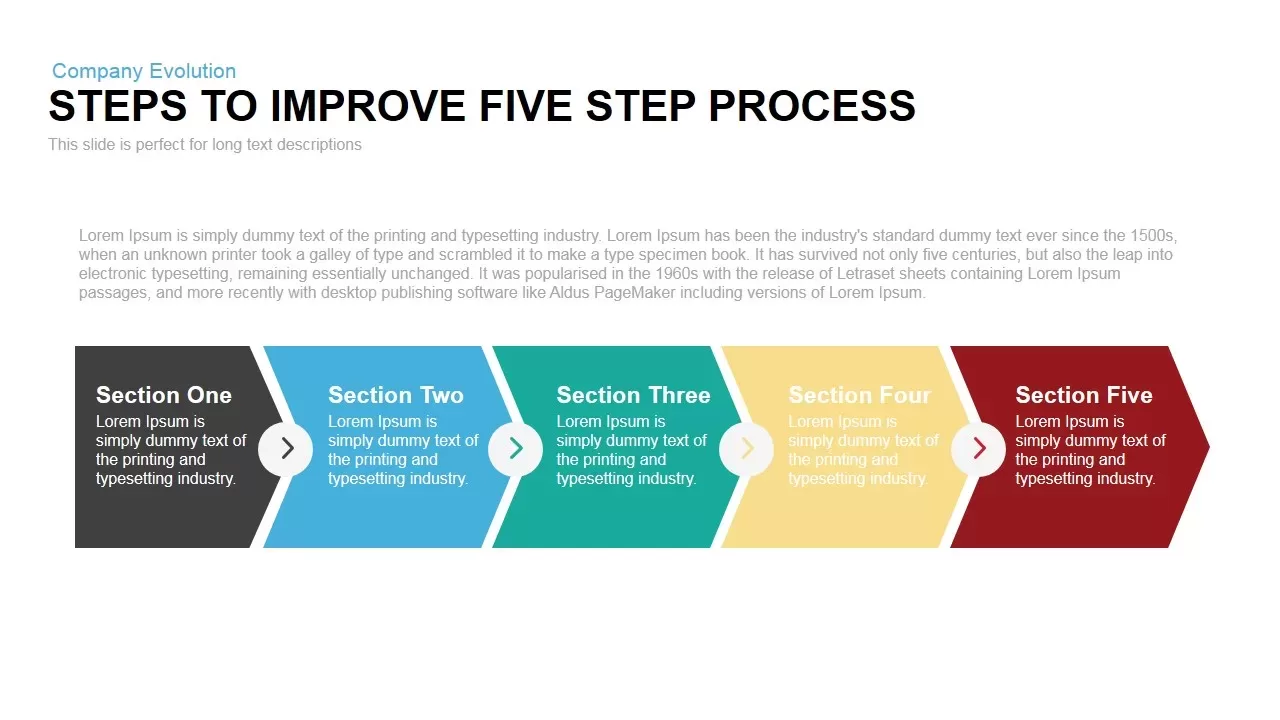
Steps to Improvement Process PowerPoint Template
Process
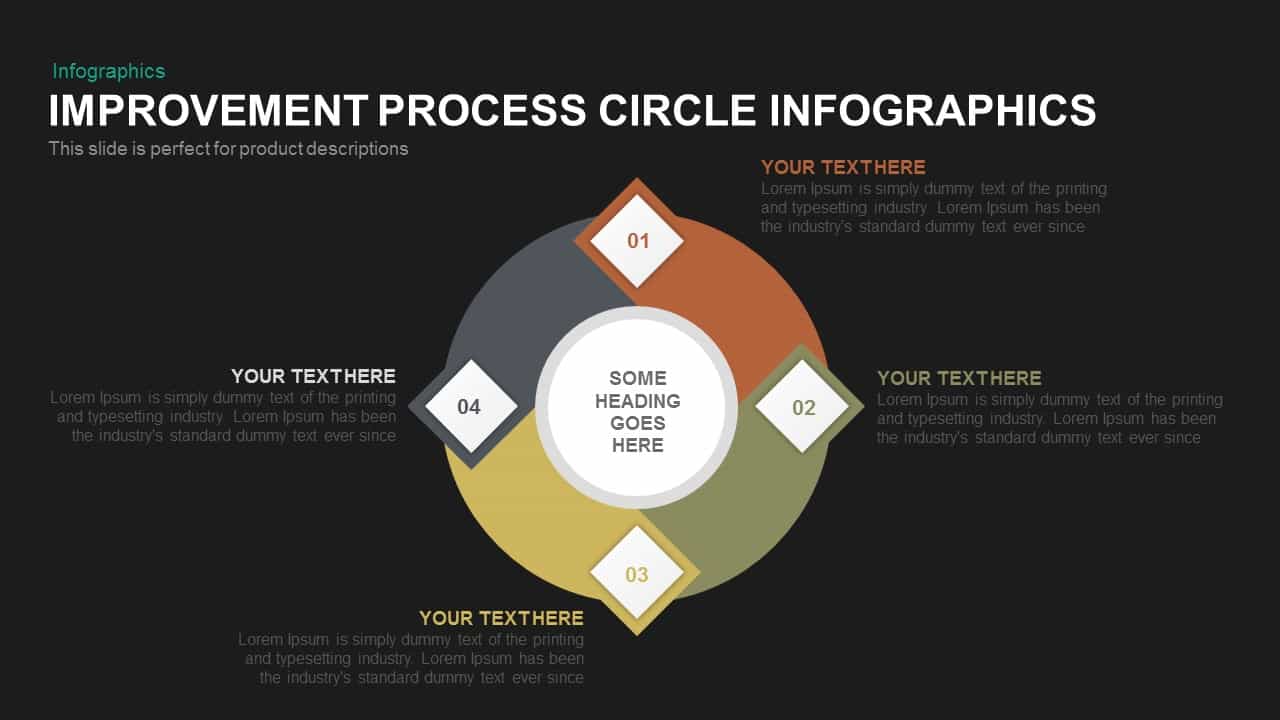
Process Improvement Circle Infographics Template for PowerPoint
Process
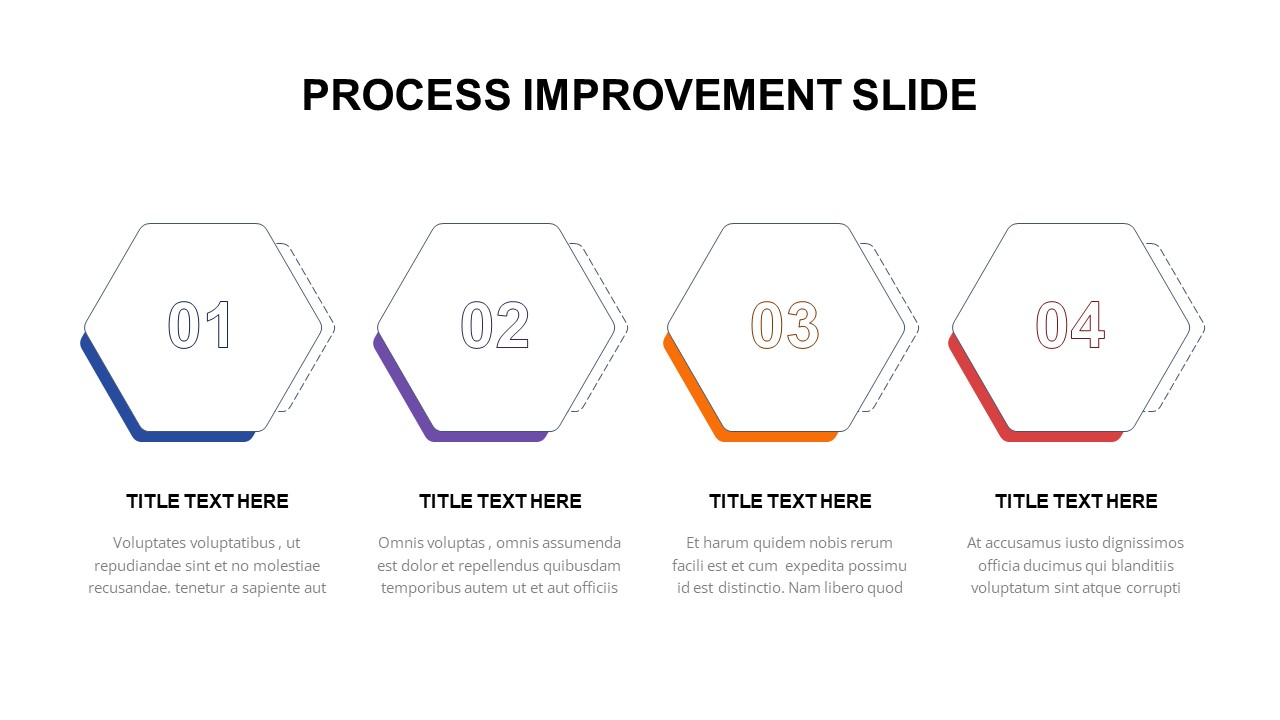
4 Step Process Improvement PowerPoint Template
Process
Process Improvement Roadmap PowerPoint Template
Infographics