6 Circle Venn Diagram PowerPoint Template

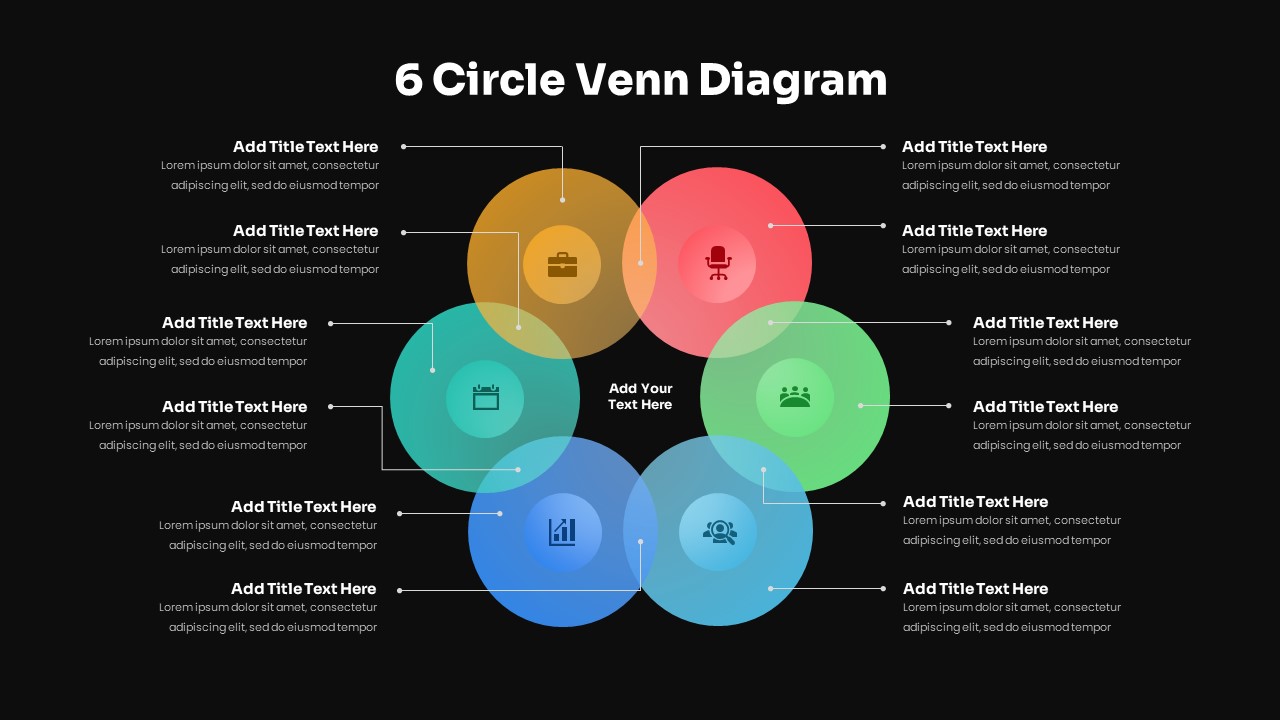
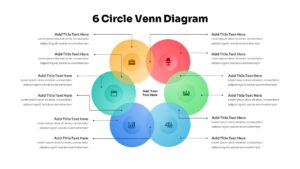

6 circle Venn Diagram PowerPoint Template is a multi-step comparison diagram illustrating intersecting circle shapes to show the relationship among six groups. Usually, a Venn diagram presents logical relationships or dissimilarities between two or more items. This Venn also allows users to produce engaging presentations by comparing complex data sets. Each PPT circle in the diagram overlaps with one another. There is countless use for Venn diagram powerpoint templates, from research purposes to teach elementary set theory. Venn diagrams are the perfect option for statistics presentations and math presentations. These editable diagrams in colorful PowerPoint design include text and graphics in the six-circle Venn diagram template.
6 circle Venn diagram template for PowerPoint is an educational template for learning purposes. So, teachers, researchers, business managers, and any professionals can use the PowerPoint Venn diagram for multiple purposes. This Venn diagram allows users to present similarities and differences between items. Each PPT circle is colored red, light green, light blue, blue, green, and yellow. In addition, all the rings or circles have three text areas that enable you to create similarities and differences.
Further, the circles have infographic clipart icons that help distinguish the topic. Additionally, text placeholders are indicated by thin lines, making you understand the subject impeccably. Like other PowerPoint templates, this Venn diagram PPT allows feature changes. Use complex Venn diagrams for displaying multiple data sets. Alternatively consider exploring 5 circle Venn diagram powerpoint template.
Login to download this file

Item ID
SB03445
Related Templates

Creative Three-Circle Venn Diagram Template for PowerPoint & Google Slides
Comparison
Five Circle Venn Diagram for Template for PowerPoint & Google Slides
Circular
8 Circle Venn Diagram PowerPoint Template
Circular
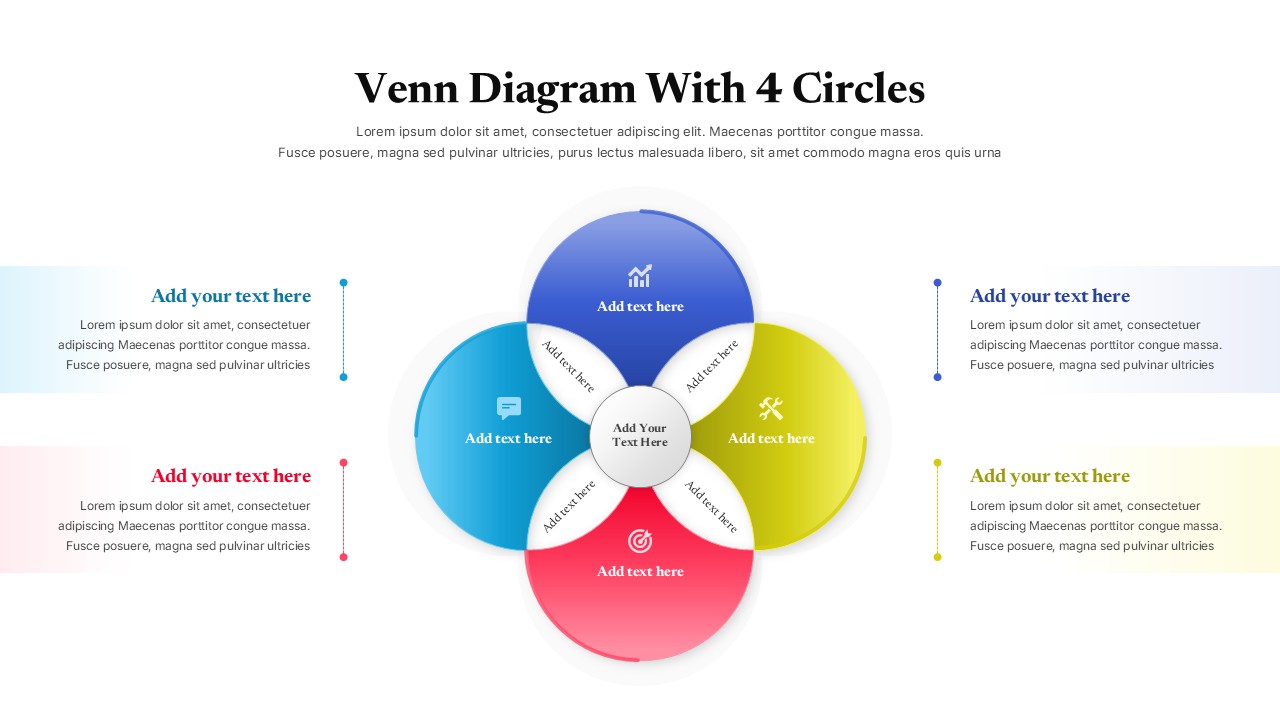
Colorful Venn Diagram with 4 Circle for PowerPoint & Google Slides
Circular

Venn Diagram Process PowerPoint Template
Process
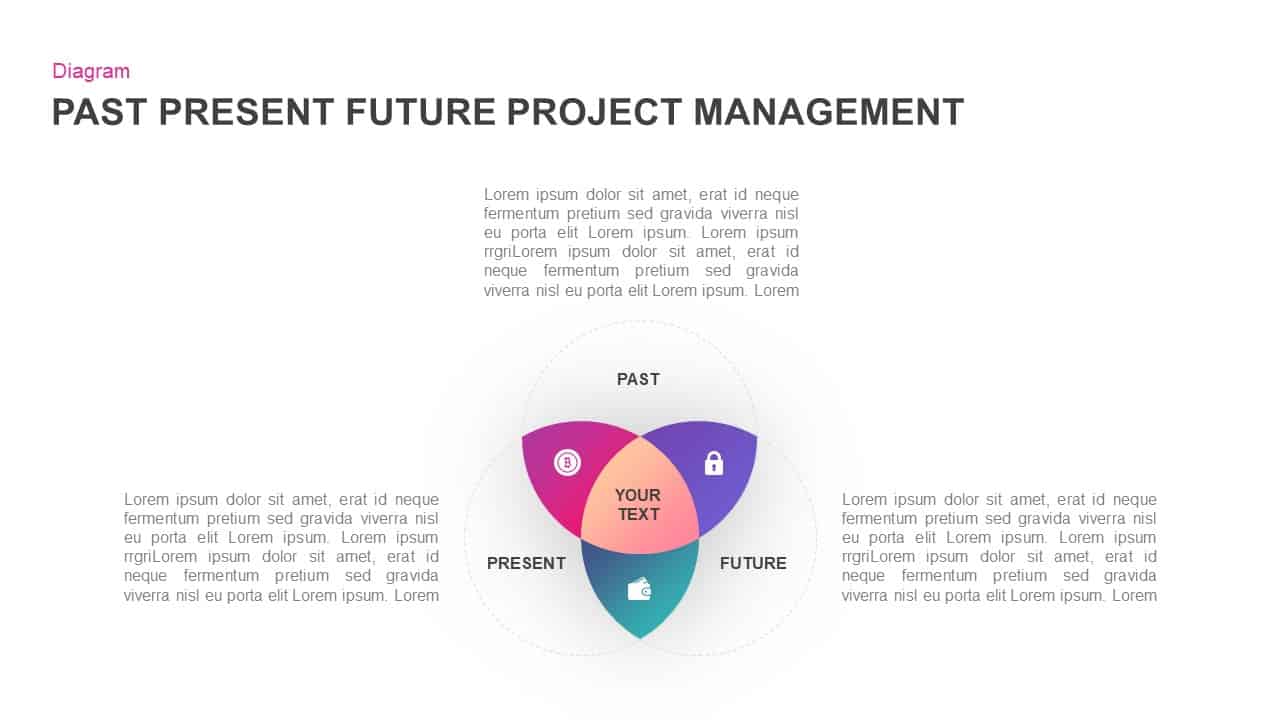
Past, Present & Future Venn Diagram Template for PowerPoint & Google Slides
Comparison
Colorful Venn Diagram Infographics Template for PowerPoint & Google Slides
Circular
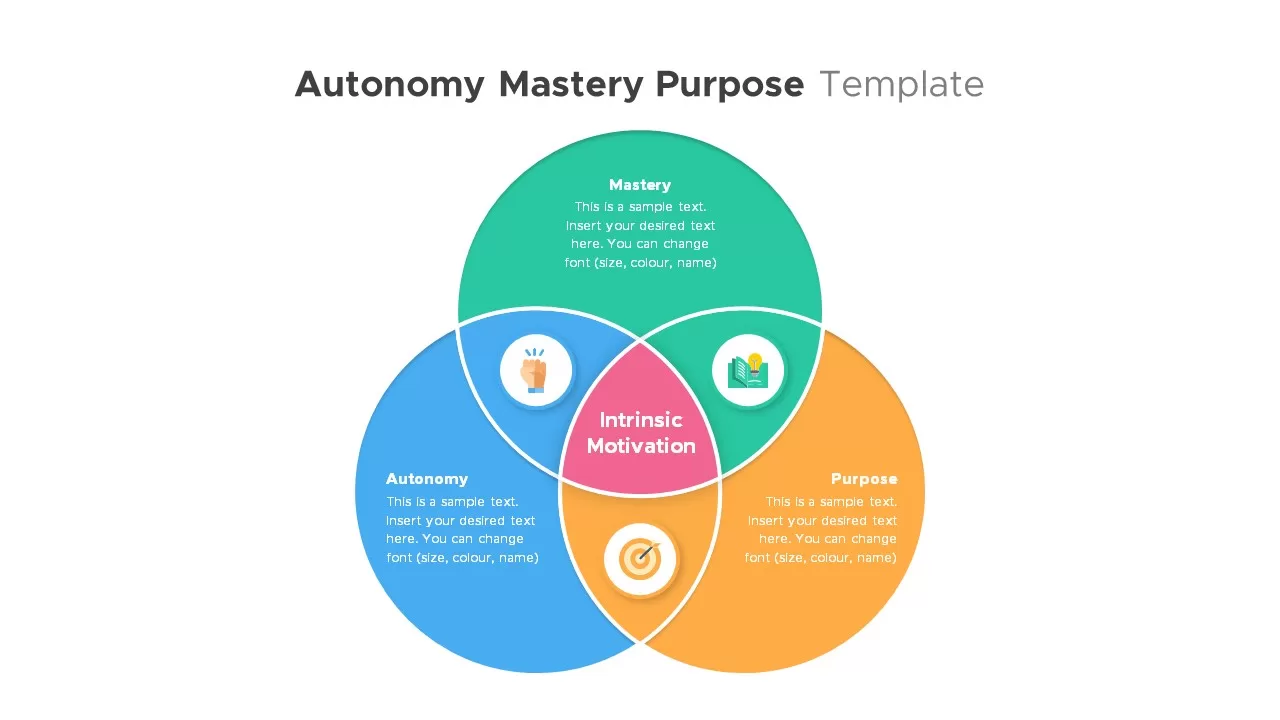
Autonomy, Mastery & Purpose Venn Diagram Template for PowerPoint & Google Slides
Circular
Free Simple Venn Diagram Overview template for PowerPoint & Google Slides
Comparison Chart
Free
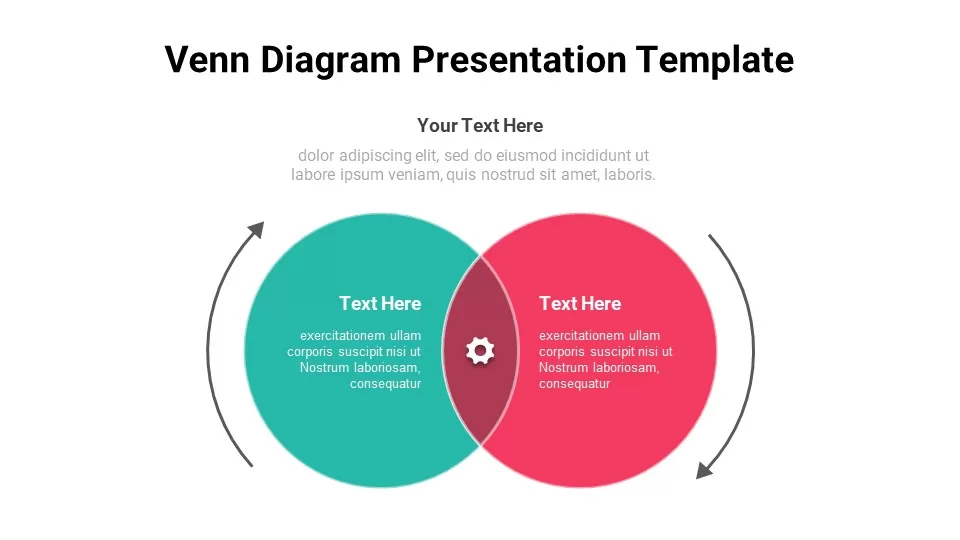
Free Venn Diagram template for PowerPoint & Google Slides
Charts
Free
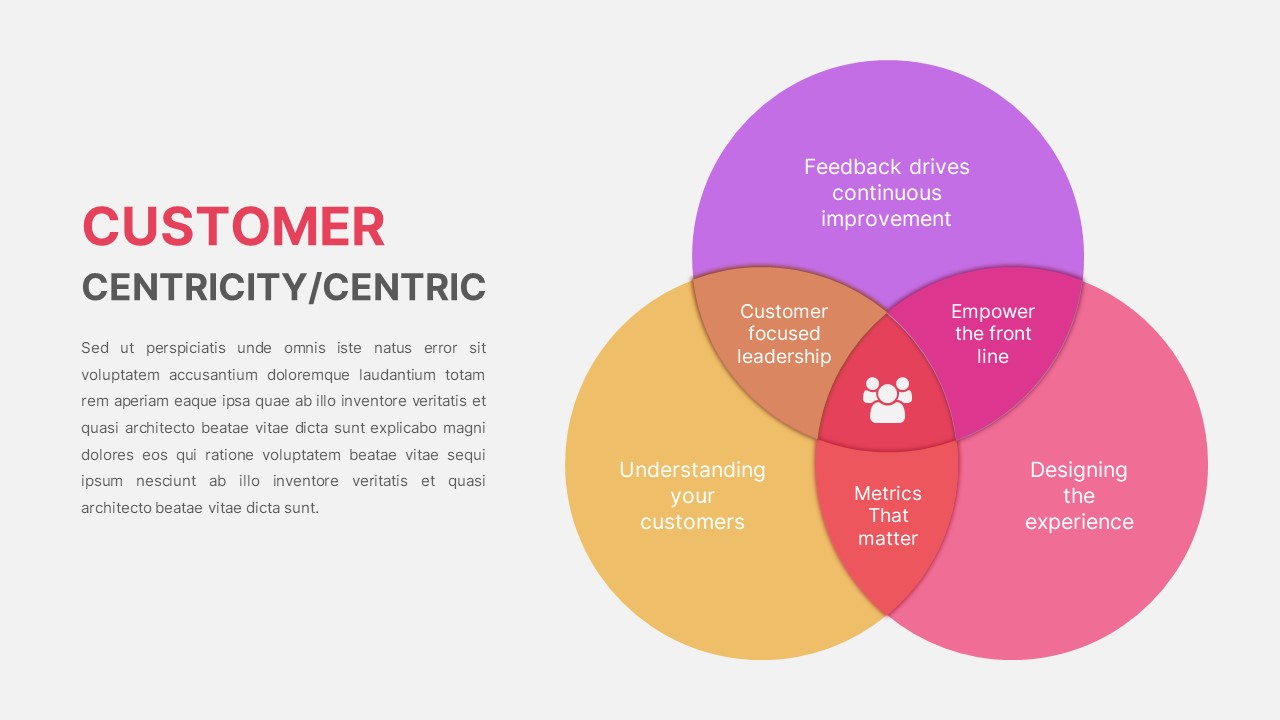
Customer Centricity Venn Diagram template for PowerPoint & Google Slides
Infographics
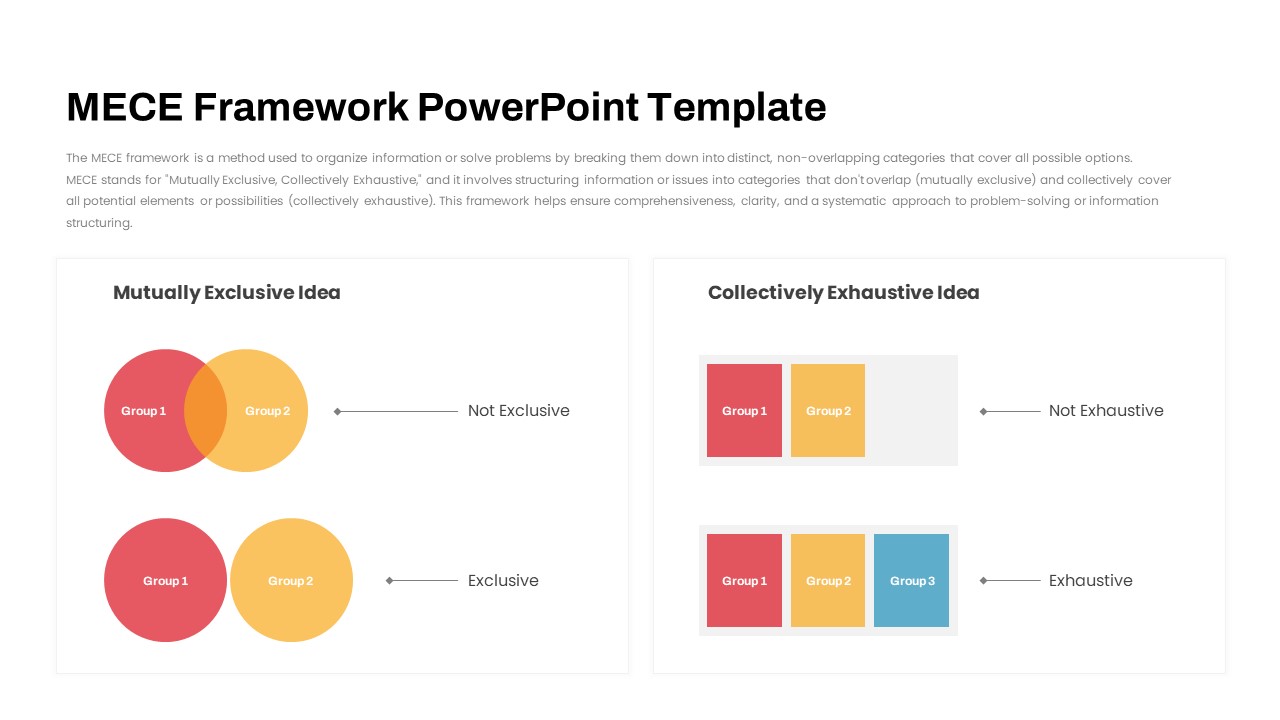
MECE Framework Venn & Block Diagram Template for PowerPoint & Google Slides
Comparison
Salience Model Venn Diagram Infographic Template for PowerPoint & Google Slides
Circular
Modern Growth Hacking Venn Diagram Template for PowerPoint & Google Slides
Circular
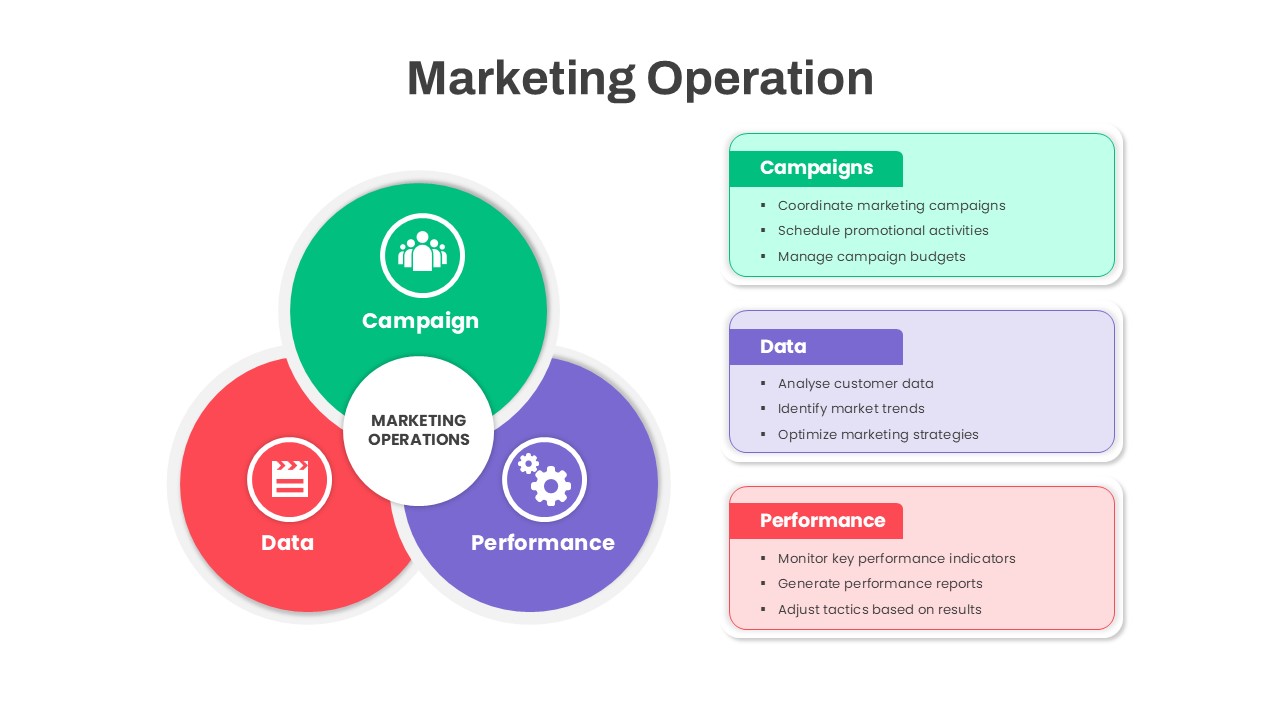
Marketing Operations Venn Diagram Template for PowerPoint & Google Slides
Circular
3Ps Triple Bottom Line Venn Diagram Template for PowerPoint & Google Slides
Circular
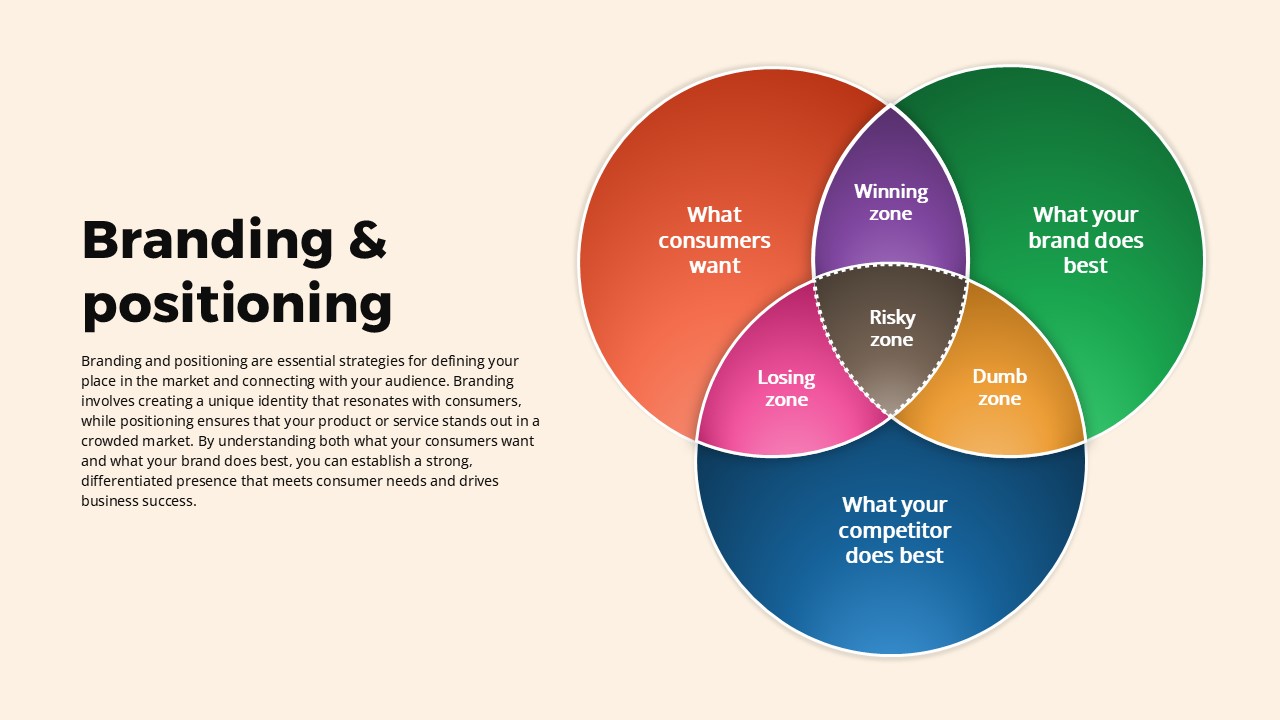
Branding and Positioning Venn Diagram Template for PowerPoint & Google Slides
Comparison
Quadruple Venn Diagram Template for PowerPoint & Google Slides
Circular
Triangle Venn Diagram Infographic Template for PowerPoint & Google Slides
Comparison
4 Set Venn Diagram Comparison Template for PowerPoint & Google Slides
Comparison