Dynamic Bar-of-Pie Chart Comparison Template for PowerPoint & Google Slides


Use Bar of Pie Chart PowerPoint Template to Visualize Business Statistics
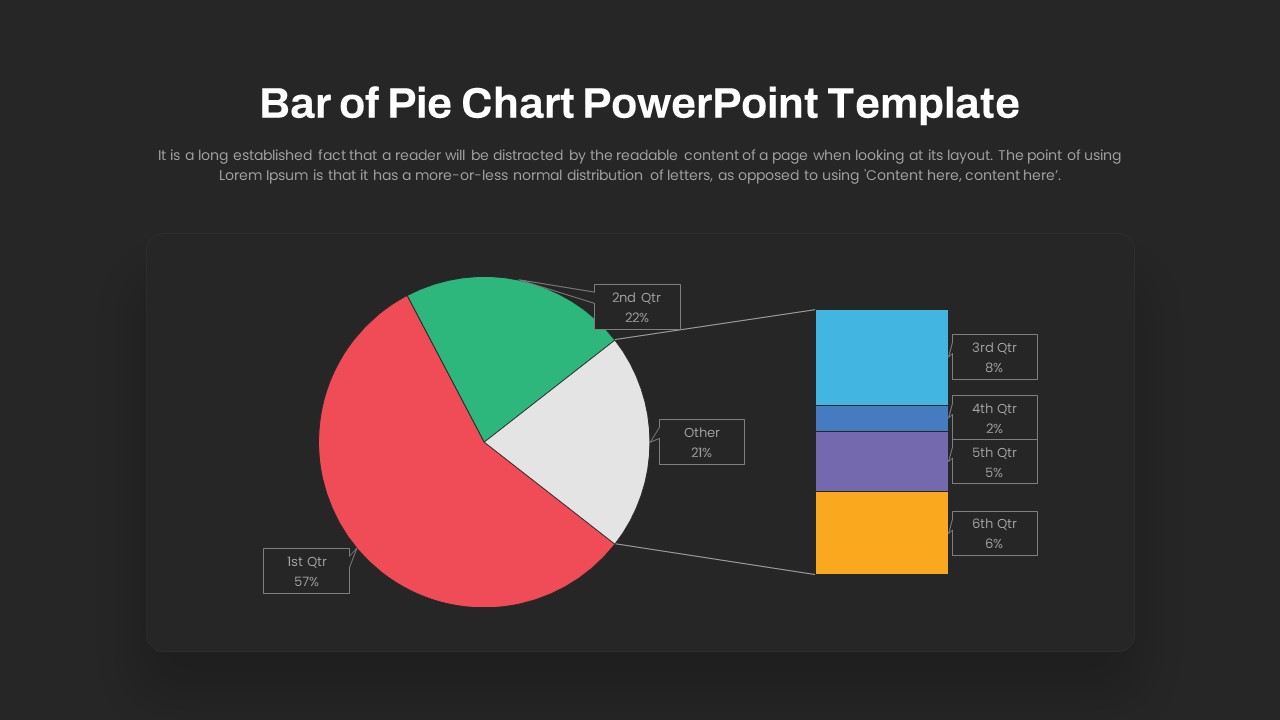
Bar of Pie Chart PowerPoint template offers dual visualization of data for easy comprehension. This innovative chart type condenses smaller segments of the pie into a single slice, which is then exploded into a corresponding bar chart for enhanced visualization. By spotlighting the smallest slices, this unique chart offers a clearer representation of data distribution, ensuring that even subtle nuances are effectively communicated to your audience. Experience the power of simplified data visualization with our template today!
How to make a bar of pie chart in PowerPoint?
Creating a Bar of Pie Chart in PowerPoint is a simple process that allows you to effectively represent data with precision and clarity. Start by inserting a standard pie chart into your slide. Then, select the pie chart, right-click, and choose “Format Data Series.” In the Format Data Series pane, navigate to the “Series Options” tab and find the “Pie Explosion” slider. Adjust the slider to explode the smaller segments of the pie. Once you’ve exploded the segments, right-click on the exploded portion and choose “Change Chart Type.” Select the “Bar Chart” option to transform the exploded portion into a bar chart.
Bar of Pie Chart Presentation Slides have a variety of use cases. It helps business professionals deliver sales data, market trends, financial performance, and more. It is also useful for educational purposes to convey statistical information in an easy-to-understand format. Besides, the presenters can showcase market share, customer demographics, and product performance with an eye-catching bar of pie charts that grab attention and communicate key insights. Statistical analysis is essential to create research inferences, so, researchers can use this diagram to showcase percentages and distributions of their research variables.
The bar of pie chart template for PowerPoint presentation looks neat and clean in both black and white background options. The PowerPoint pie chart is sliced into three sections even though the white slice can be divided into more thin slices and that could be exploded into the bar chart. The bar chart ppt colored differently for easy understanding. You can adjust all these features and create more slices using the PowerPoint edit menu. Download it now!
Login to download this file

Item ID
SB04161
Related Templates

Dynamic Benchmarking Comparison Chart Template for PowerPoint & Google Slides
Comparison Chart
Quarterly Comparison Pie Chart Template for PowerPoint & Google Slides
Pie/Donut
Comparison Bar Chart template for PowerPoint & Google Slides
Comparison Chart
Interactive Product Comparison Bar Chart Template for PowerPoint & Google Slides
Bar/Column
Clustered Bar Chart Comparison Template for PowerPoint & Google Slides
Bar/Column
Mirror Bar Chart Comparison Template for PowerPoint & Google Slides
Bar/Column
Two-Option Bar Chart Comparison Table Template for PowerPoint & Google Slides
Comparison
Creative Dynamic Gantt Chart Timeline Template for PowerPoint & Google Slides
Timeline
Capital Structure Dynamic Split Chart Template for PowerPoint & Google Slides
Comparison Chart

Dynamic Marketing Radar Chart Analytics Template for PowerPoint & Google Slides
Comparison
Dynamic Three-Series Stacked Area Chart Template for PowerPoint & Google Slides
Comparison Chart
Dynamic Sunburst Chart Visualization Template for PowerPoint & Google Slides
Charts
Dynamic Financial Analysis Line Chart Template for PowerPoint & Google Slides
Finance
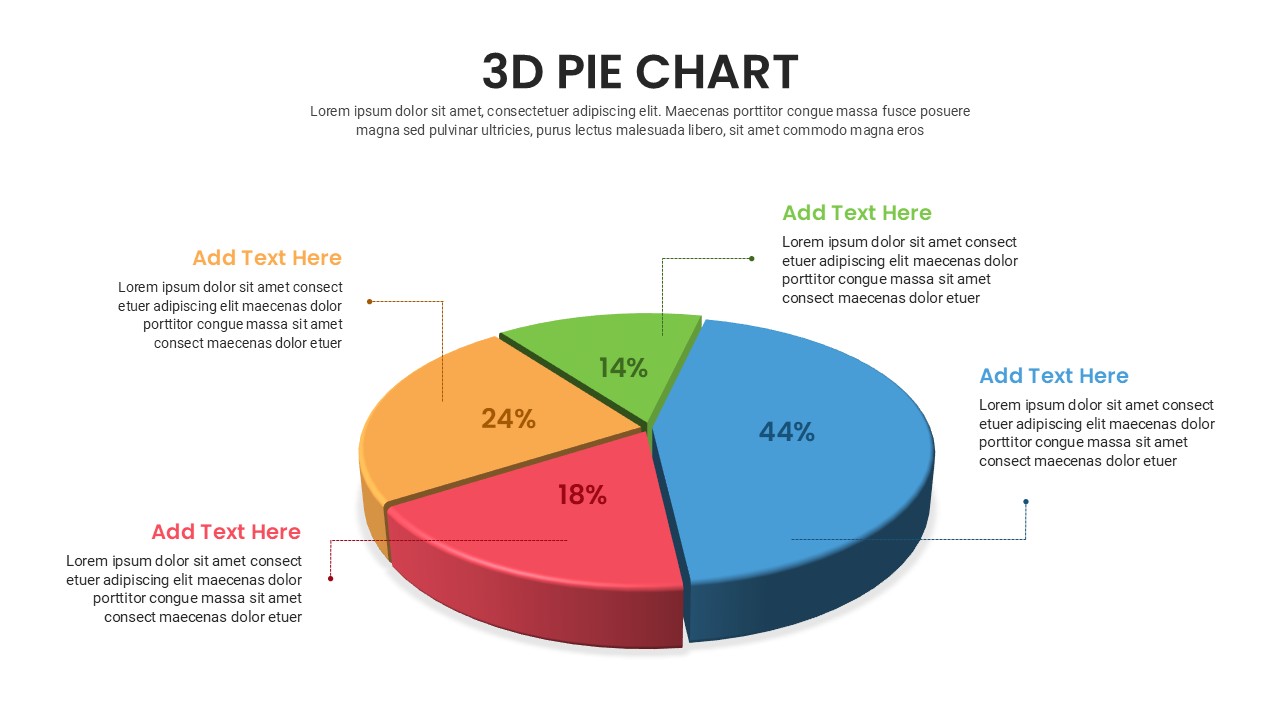
Free 3D Pie Chart PowerPoint Template & Google Slides
Pie/Donut
Free
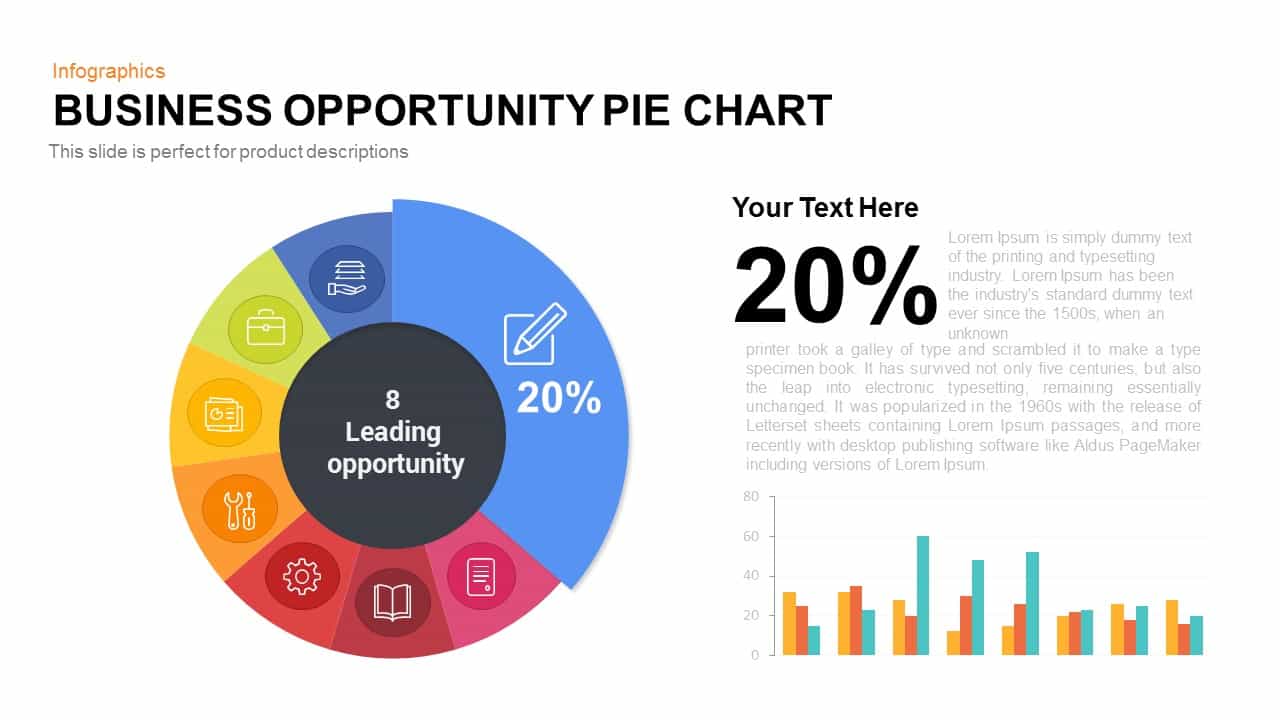
Business Opportunity Pie Chart Template for PowerPoint & Google Slides
Pie/Donut
Car Sales Market Share Pie Chart Template for PowerPoint & Google Slides
BCG
3D pie chart infographic template for PowerPoint & Google Slides
Pie/Donut
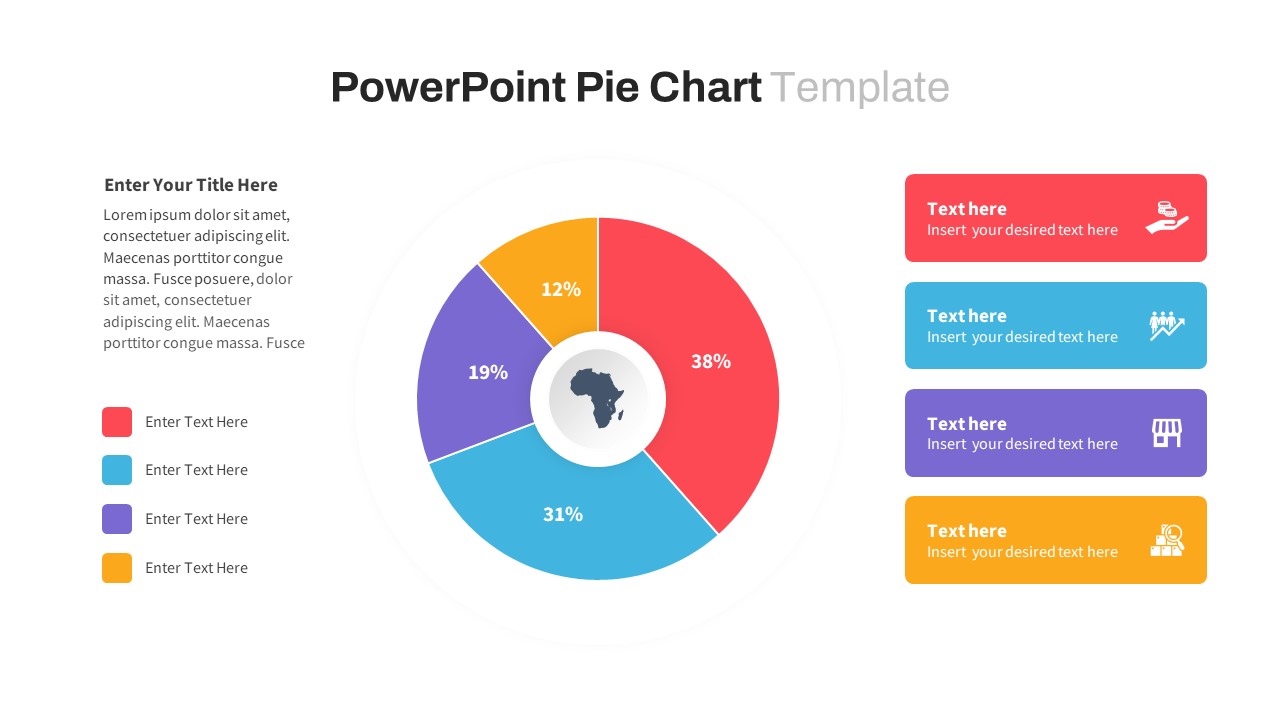
Segmented Pie Chart Infographic with Icons for PowerPoint & Google Slides
Pie/Donut
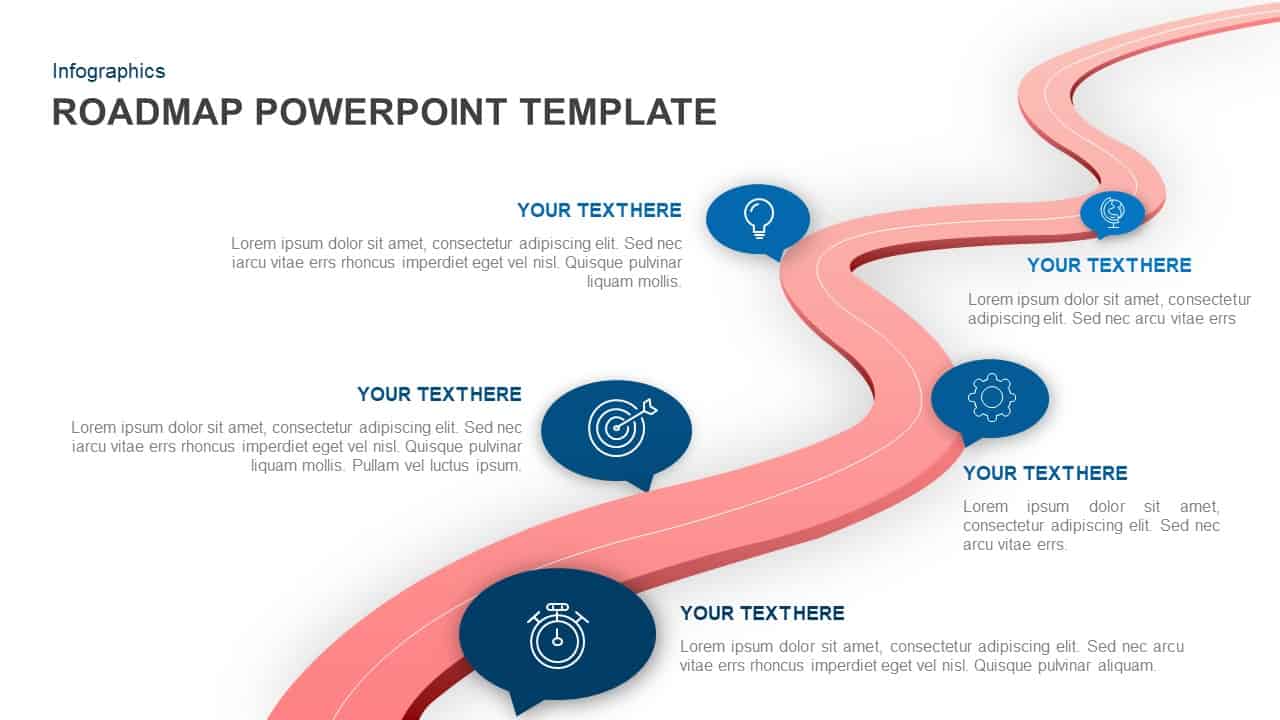
Dynamic Winding Roadmap Infographic Template for PowerPoint & Google Slides
Roadmap
Dynamic Curved Arrow Process Roadmap Template for PowerPoint & Google Slides
Process