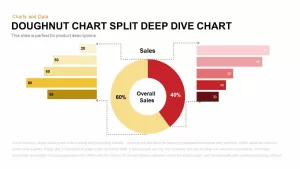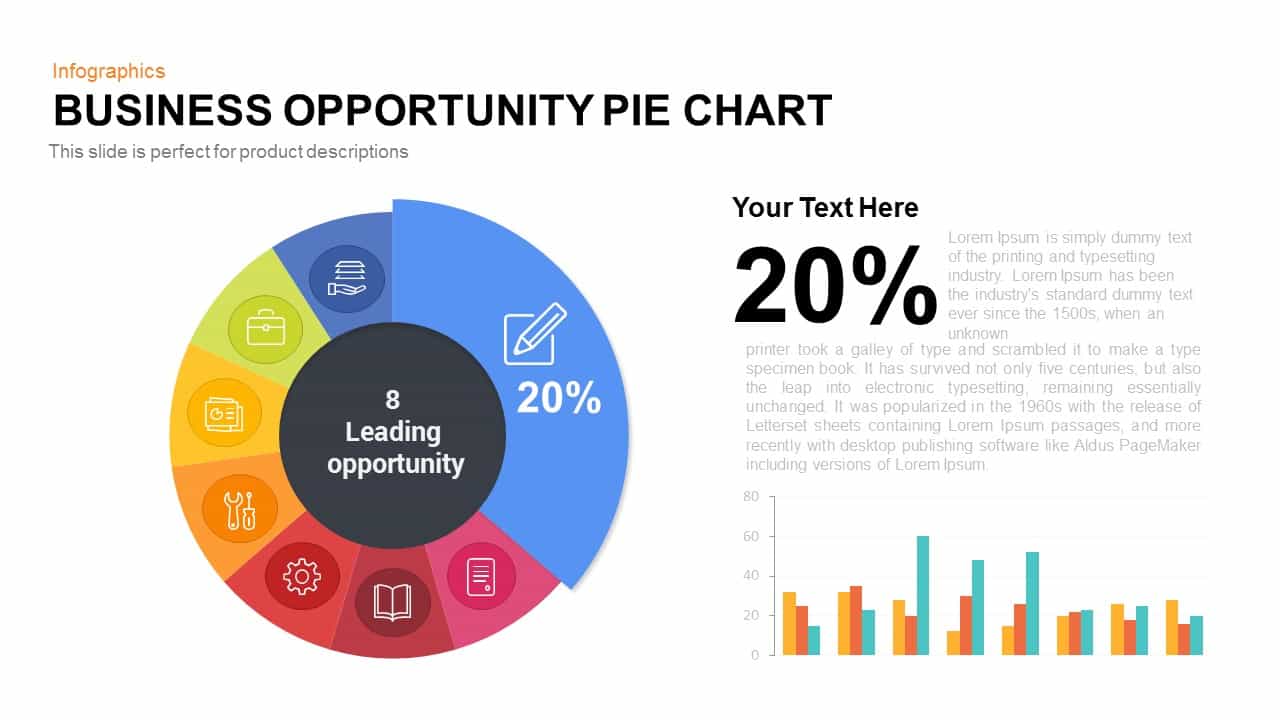

Business Opportunity Pie-Chart PowerPoint Template
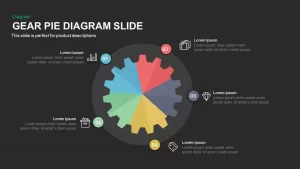
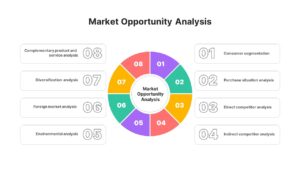
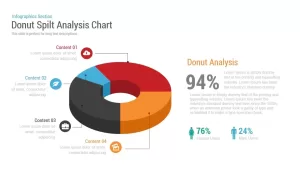
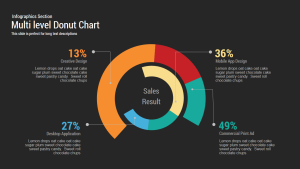
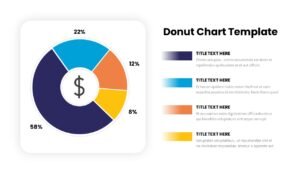
The business opportunity pie chart PowerPoint template is created for the graphical illustration of statistical data. Pie diagrams have a long history in the arena of statistics and research. Still, it remains as the easy method of depict numerical data. The segmented ring has an immense influence on handling information. This business opportunity diagram pie chart powerpoint template contains eight segments. Therefore, the presenter can display eight inferential statistics to the audience. The pie diagram created with the charming formation and the color mixture make an aesthetic appearance to the PowerPoint. The business consultants may use this template to show eight modern business ideas or business opportunity. This PowerPoint slide is used to present multiple topics. Both quantitative and qualitative presentation can be done with this simple pie chart.
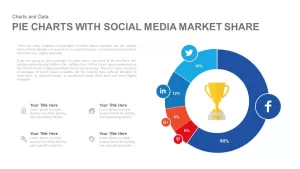
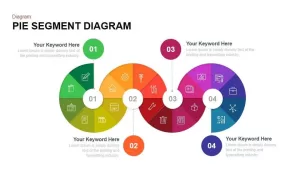
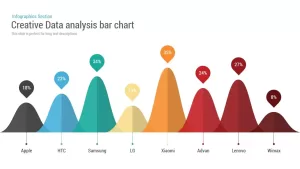
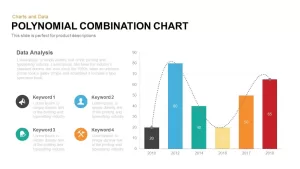
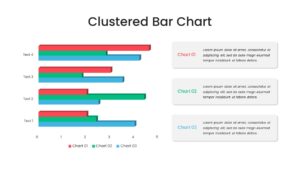
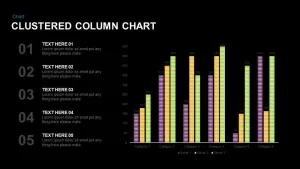
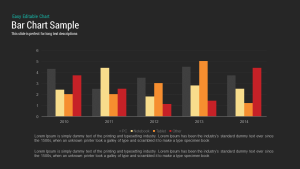
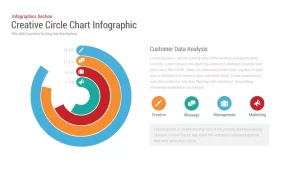
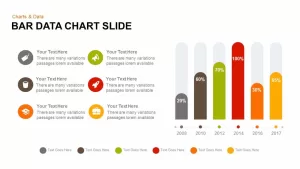
The pie chart diagram for PowerPoint presentation contains infographic icons and a clustered bar chart. If the presenters use it for report analytical studies, they can utilize it as a valuable statistical tool. Hence, they can use the possibilities of the clustered bar diagram in the corner. Otherwise, they can use it as a generic circular diagram with rotation process.
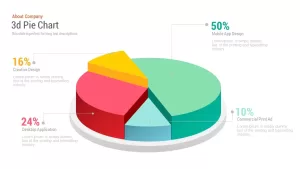
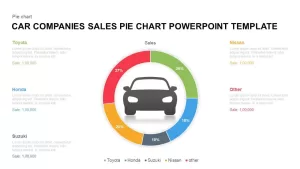
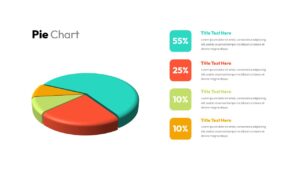
Business Opportunity Pie-Chart PowerPoint template is simple pie chart design that is focused on a particular section of the pie which is enlarged and the percentage written on it. It consists of fully editable shapes and the percentage definitions can be altered as per requirement. It is a formation of pie segments in beautifully arranged colors. The textual content alongside gives it a better placement in business presentation explaining various aspects of the business. These circular shapes are high definition PowerPoint shapes that can be edited in size, color and placement in the template. Business Opportunity Pie-Chart PowerPoint template also comes with a small cluster bar graph at the right side corner to support the percentage distribution of values showcased in the pie chart. Each section of the pie is also supported with relevant icons inside small circular shapes. It is available in PowerPoint and Keynote templates.