Quarterly Gross Profit Rate Chart Template for PowerPoint & Google Slides

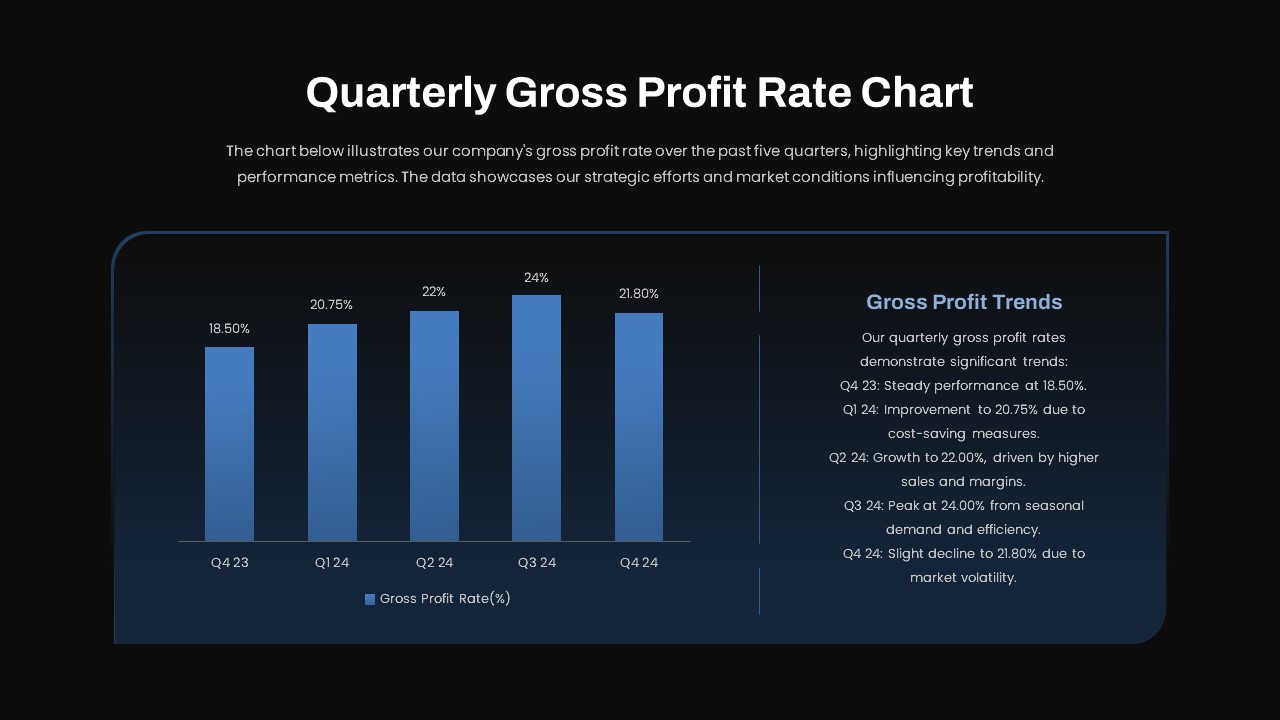
This quarterly gross profit rate slide features a bold bar chart set against a soft blue gradient background with subtle rounded-corner borders and data-driven design accents. Crisp white gridlines and high-contrast blue columns highlight performance metrics for Q4 23 through Q4 24, while percentage labels sit above each bar for instant readability. On the right, a dedicated “Gross Profit Trends” panel provides a concise narrative, pairing numerical insights with contextual annotations. The clean sans-serif typography and spacious layout ensure audience focus remains on key performance indicators.
Built on fully editable master slides, this template offers preconfigured layouts including title pages, content sections, summary charts, and a break slide. Users can swap bar colors, adjust gradient stops, and update text placeholders effortlessly via theme settings in PowerPoint or Google Slides. The chart axis labels, data values, and annotation text can be refreshed in seconds, preserving overall formatting and alignment. Additional layouts allow insertion of tables, icons, or supporting images to complement financial narratives and reinforce key messages.
Optimized for corporate financial reviews, investor presentations, and internal strategy sessions, this slide accelerates deck creation by combining impactful visuals with structured storytelling elements. Its responsive design prevents formatting issues across devices, while built-in placeholders and consistent styling reduce manual tweaks. Use the summary panel to highlight period-over-period shifts and the narrative box to explain underlying drivers such as cost savings, sales growth, or market fluctuations. With a focus on clarity and data accuracy, this bar chart slide empowers analysts and executives to communicate quarterly profit trends with confidence and visual polish.
Who is it for
Financial analysts, CFOs, business managers, and investor-relations teams will benefit from this template when presenting quarterly performance reviews, board meetings, and budget-planning sessions.
Other Uses
Also suitable for sales performance summaries, cost analysis reviews, margin optimization workshops, budget-forecasting presentations, and KPI dashboard slides requiring a clear visual representation of percentage-based metrics.
Login to download this file

Item ID
SB04288
Related Templates

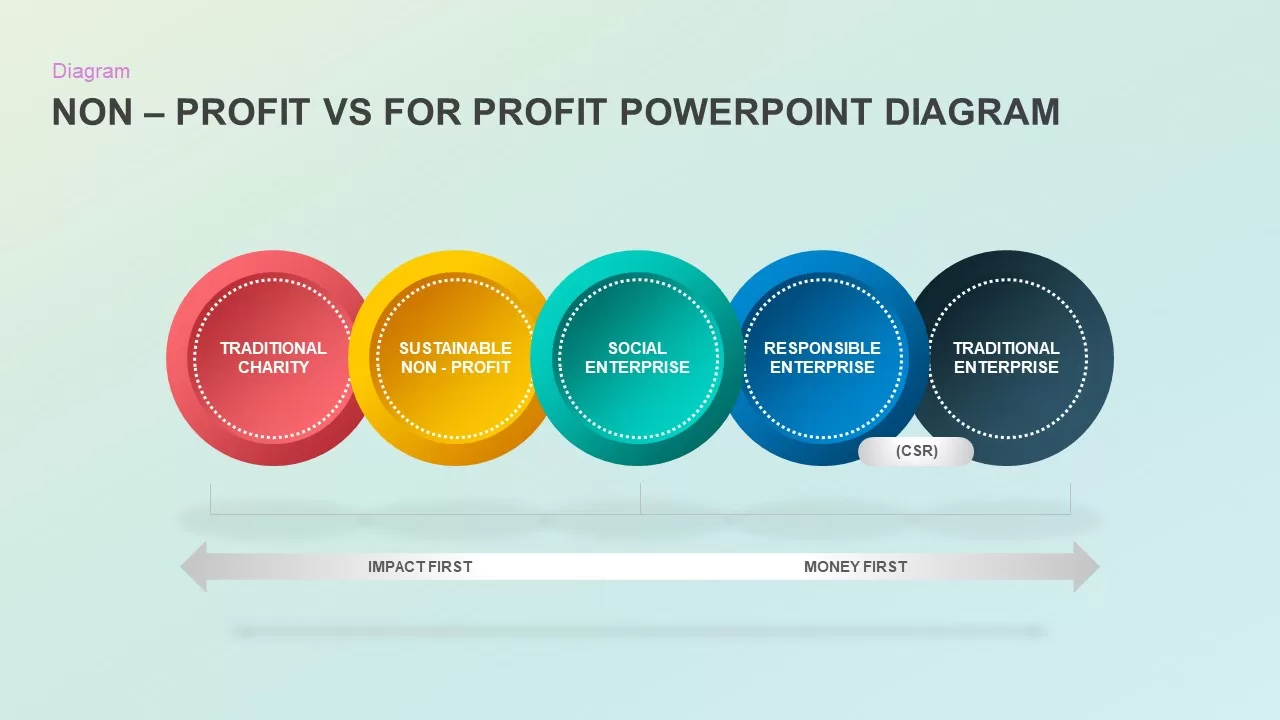
Non-Profit vs For-Profit Diagram template for PowerPoint & Google Slides
Business Models
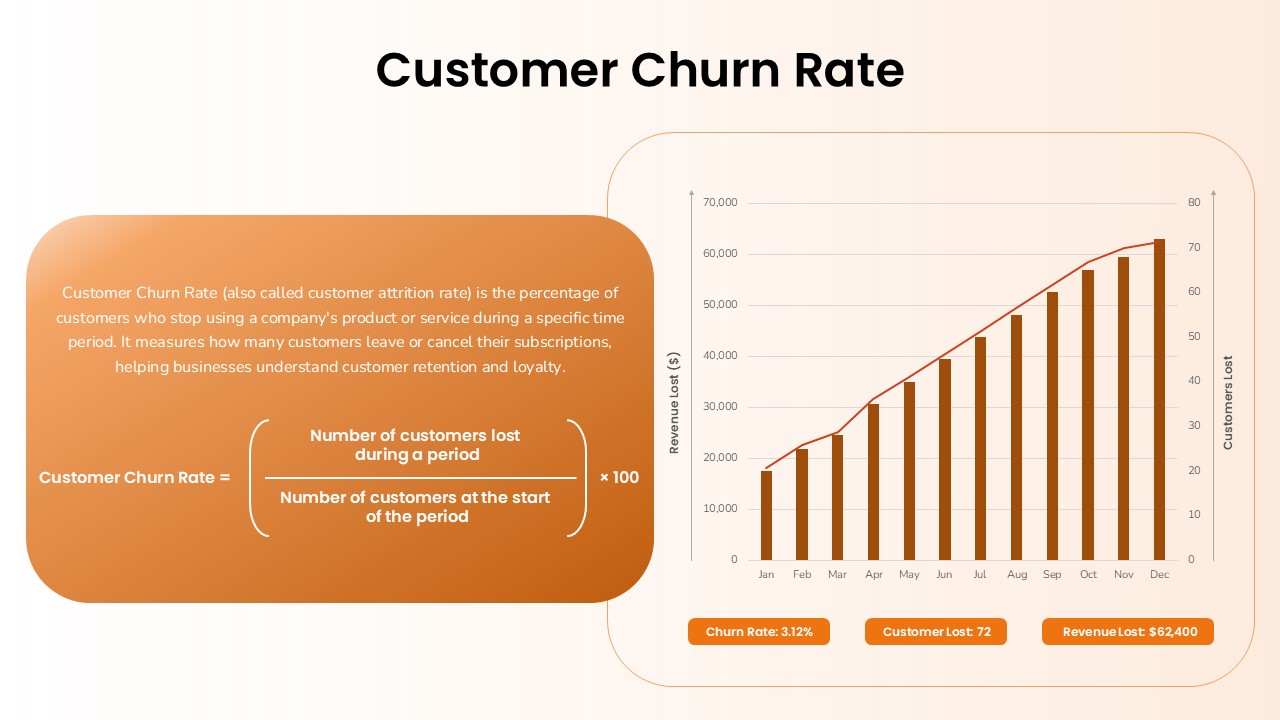
Customer Churn Rate Analysis template for PowerPoint & Google Slides
Business Report
Offer Acceptance Rate template for PowerPoint & Google Slides
Business
Task Completion Rate Dashboard Template for PowerPoint & Google Slides
Business
Profit Performance Trend Chart Template for PowerPoint & Google Slides
Finance
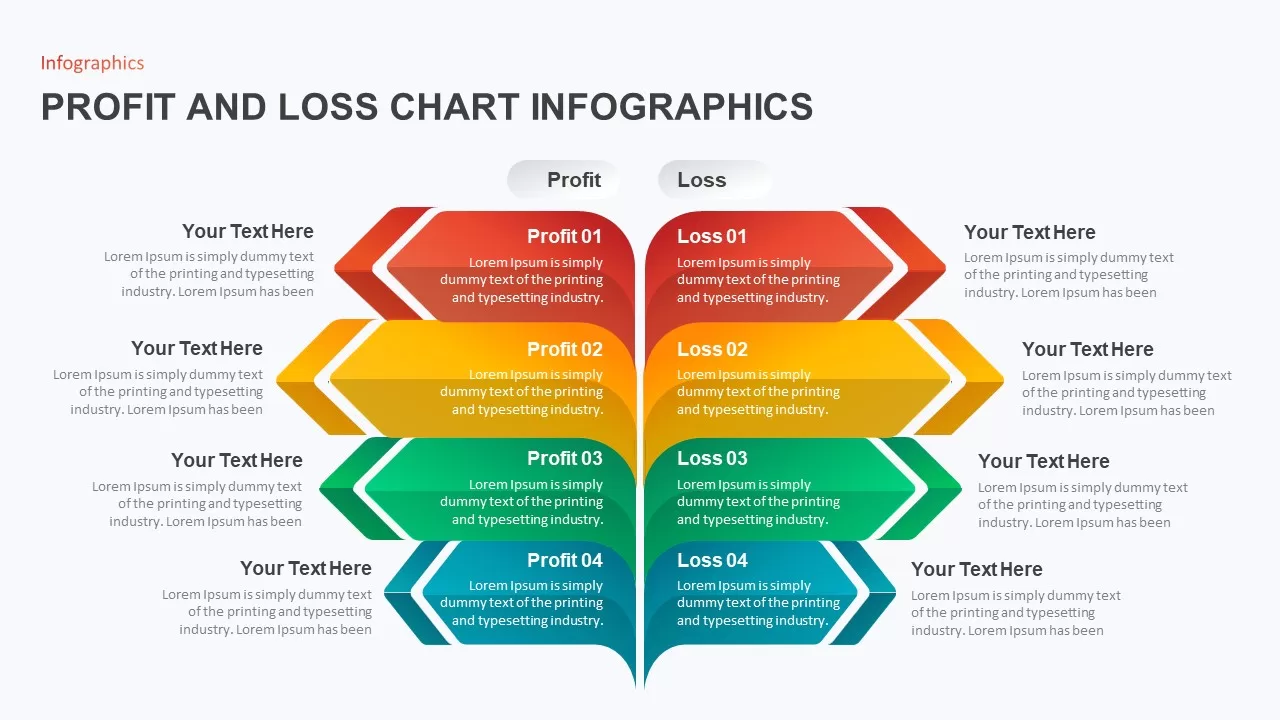
Profit and Loss Chart Infographics for PowerPoint & Google Slides
Business Report
Quarterly Credit Loss Provisions Chart Template for PowerPoint & Google Slides
Bar/Column
Quarterly Revenue Comparison Bar Chart Template for PowerPoint & Google Slides
Bar/Column
Quarterly Sales Review Bar Chart Template for PowerPoint & Google Slides
Bar/Column
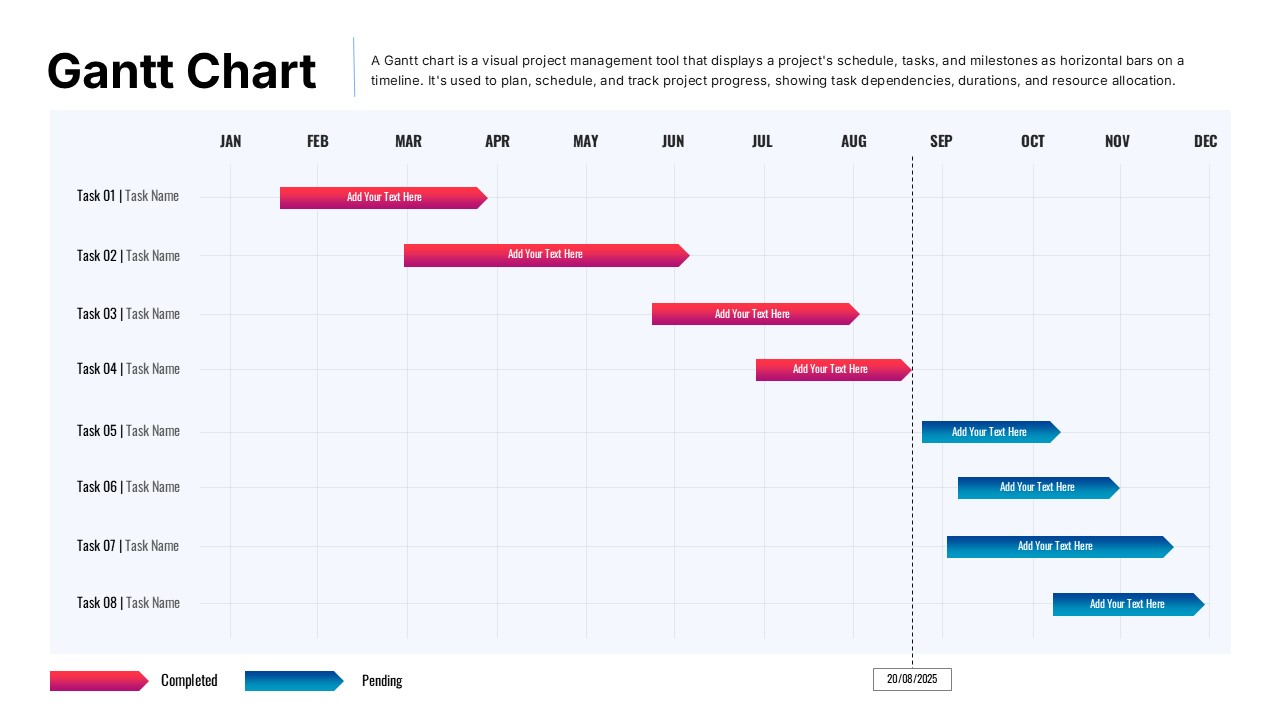
Quarterly Gantt Chart with Today Marker Template for PowerPoint & Google Slides
Gantt Chart
Quarterly Comparison Pie Chart Template for PowerPoint & Google Slides
Pie/Donut
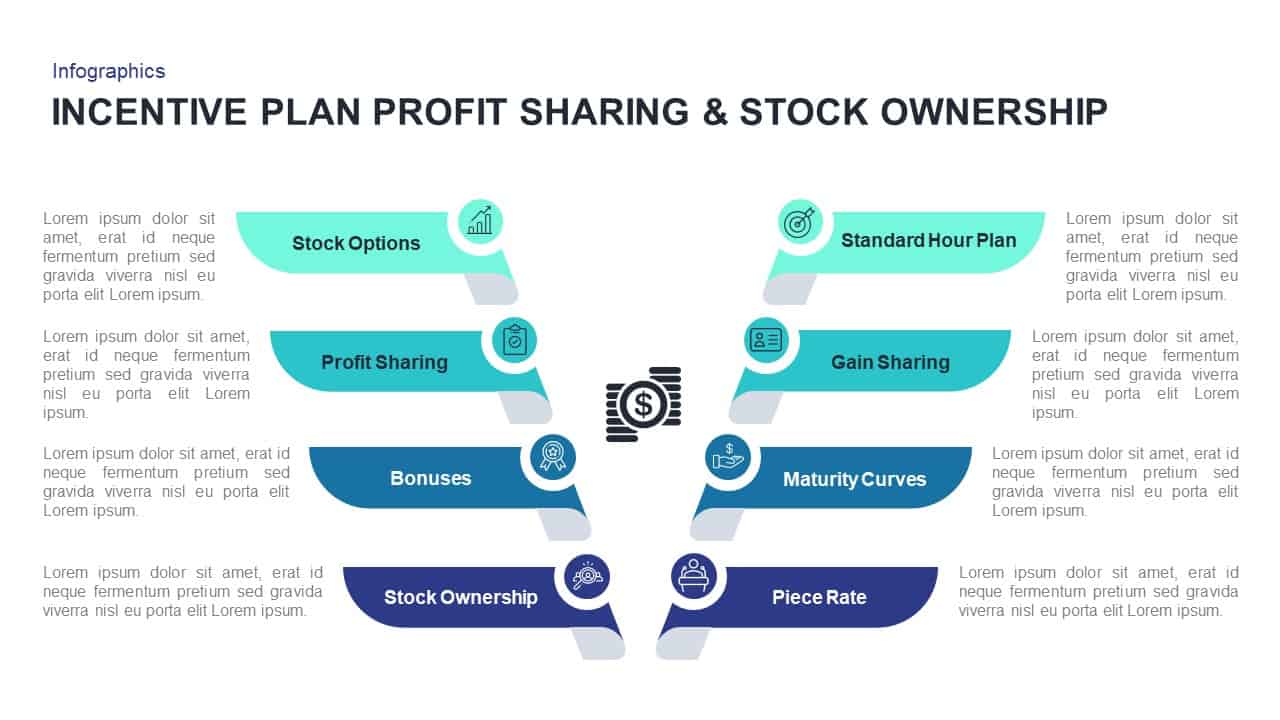
Profit Sharing & Stock Ownership Template for PowerPoint & Google Slides
Process

Non-Profit Organization Profile Deck Template for PowerPoint & Google Slides
Pitch Deck
Cost-Volume-Profit Analysis Diagram Template for PowerPoint & Google Slides
Finance
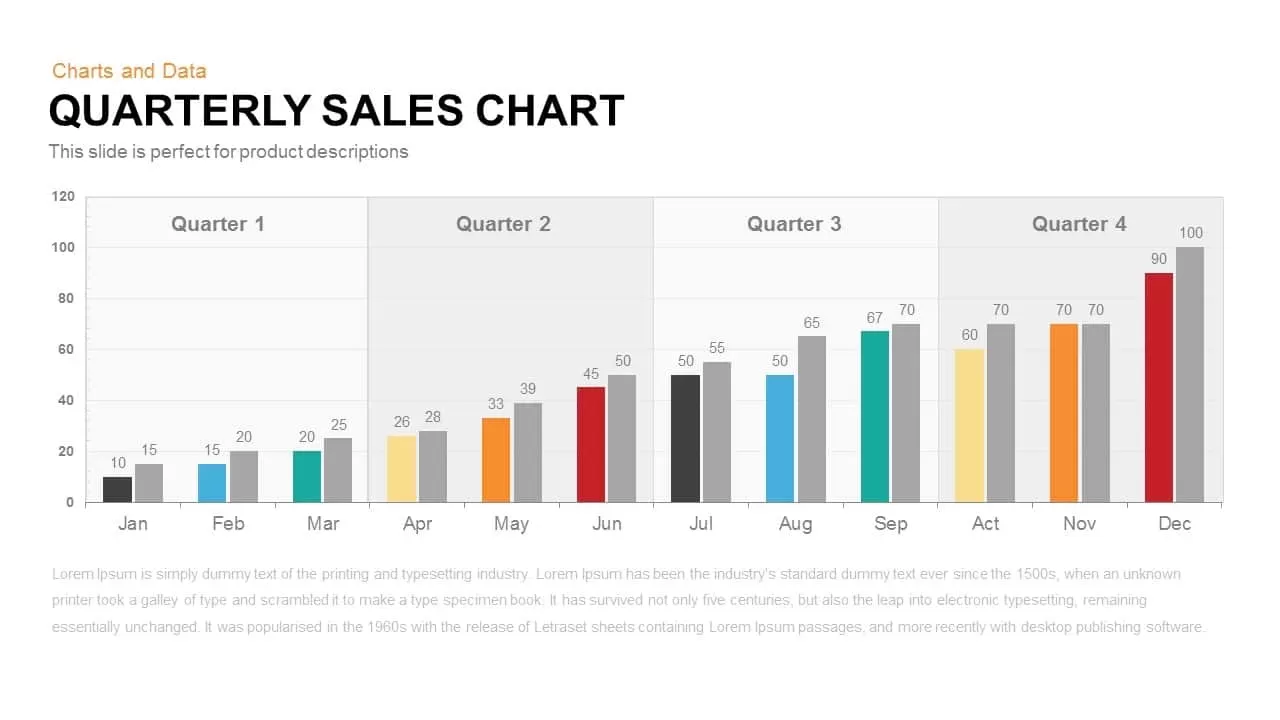
Quarterly Sales template for PowerPoint & Google Slides
Bar/Column
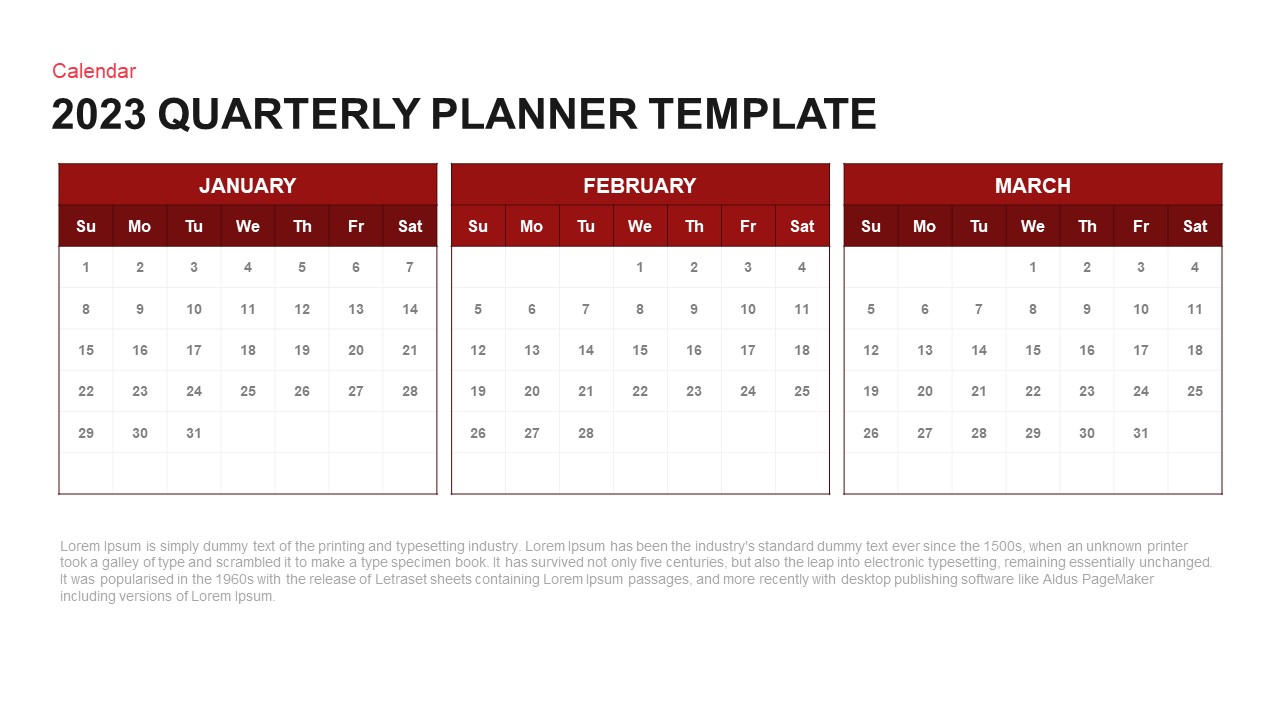
Quarterly Planner Calendar Layout Template for PowerPoint & Google Slides
Project
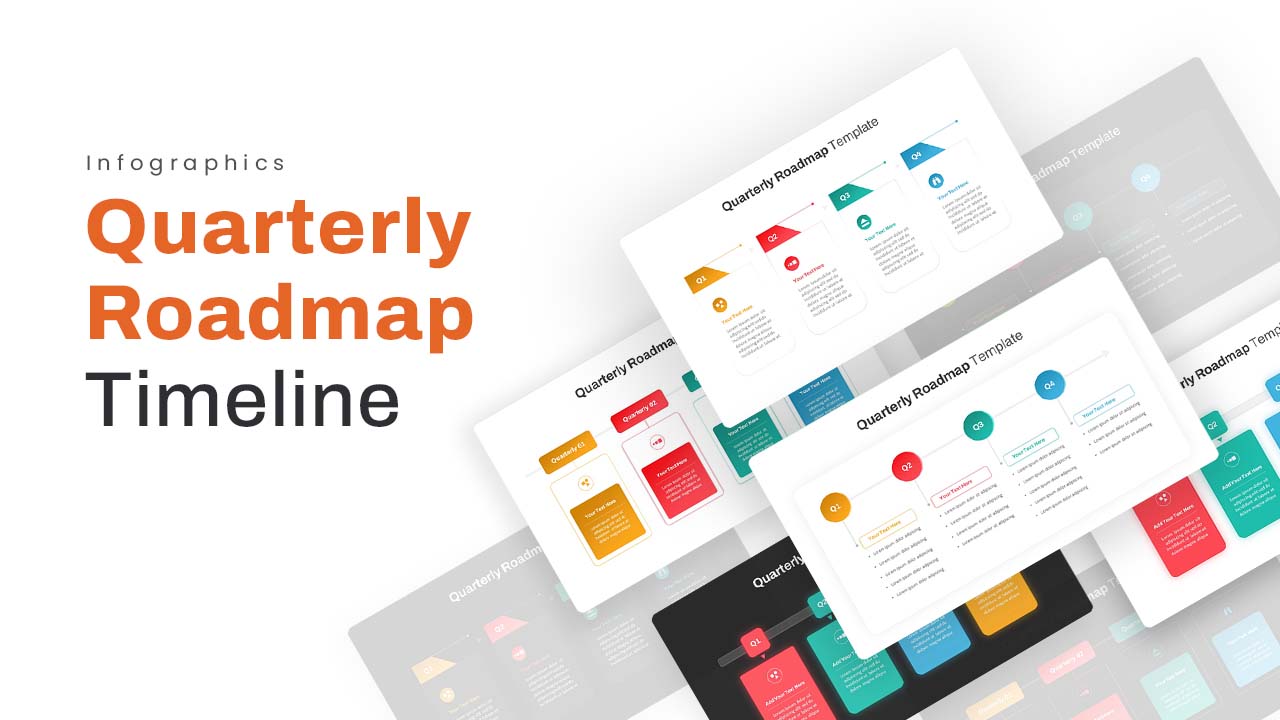
Quarterly Roadmap Timeline Infographic Template for PowerPoint & Google Slides
Timeline
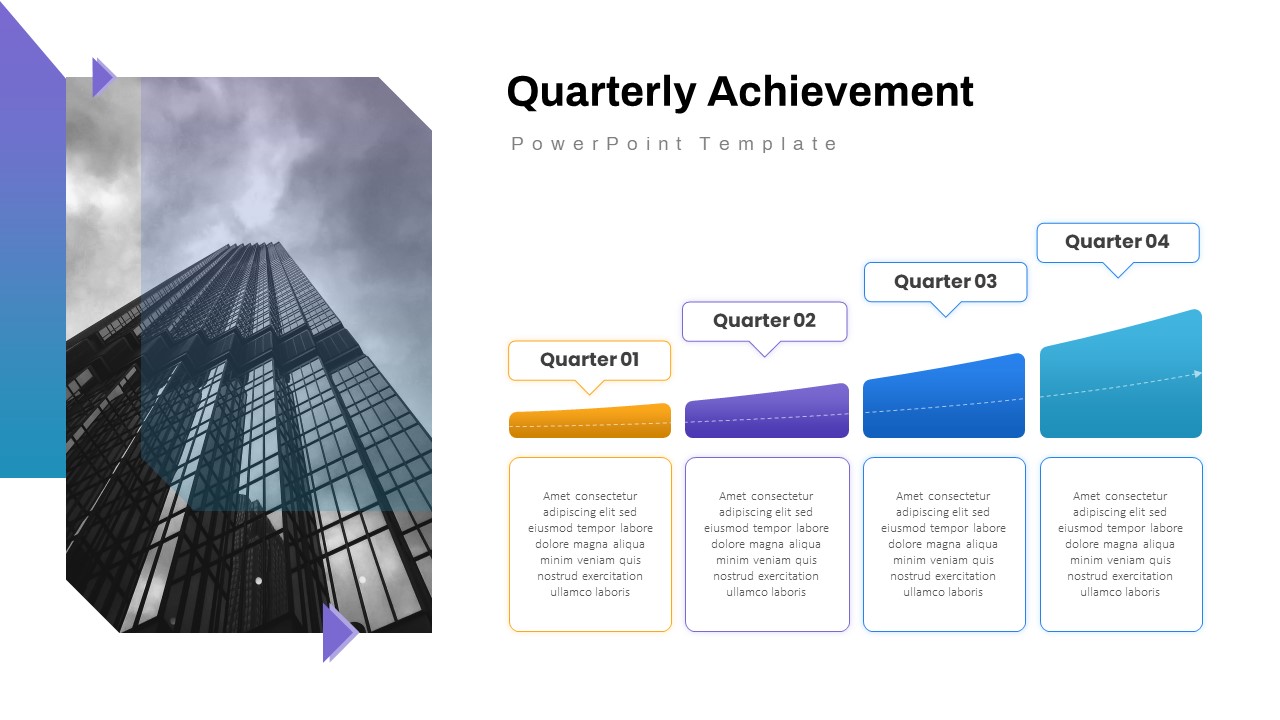
Quarterly Achievement Progress Template for PowerPoint & Google Slides
Accomplishment
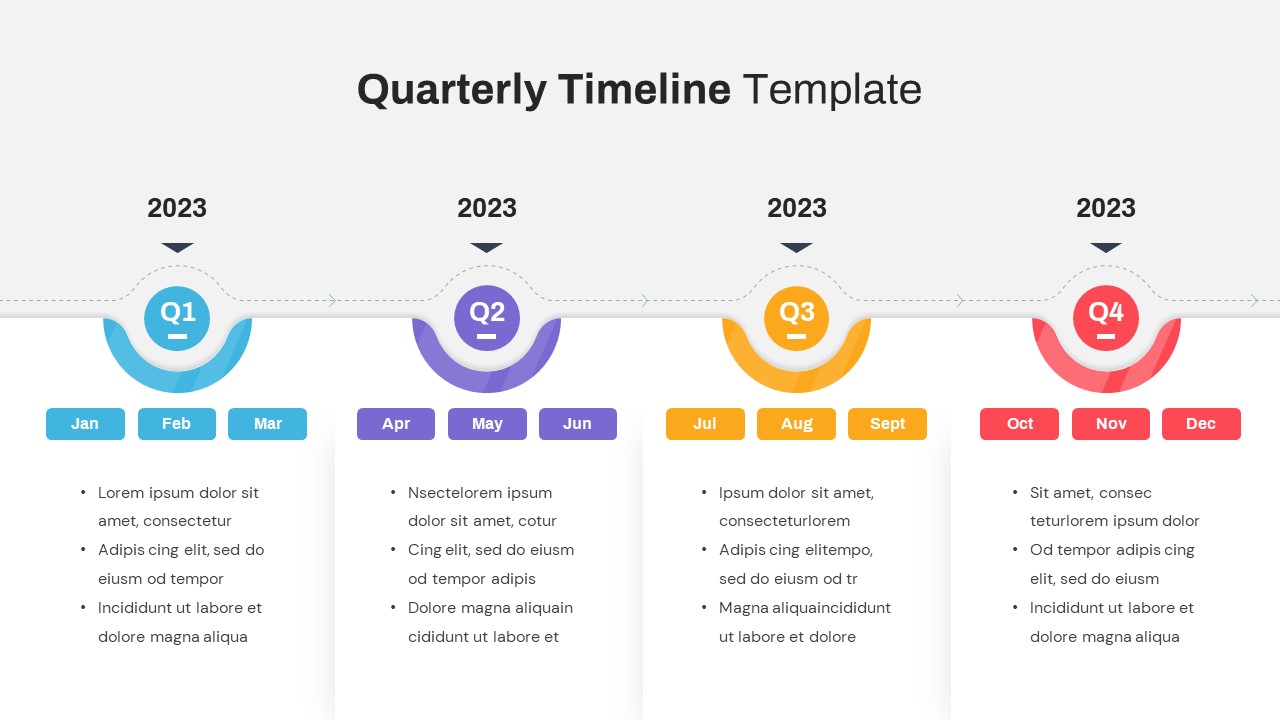
Quarterly Timeline Infographic Template for PowerPoint & Google Slides
Timeline
Free Quarterly Business Review Dashboard Template for PowerPoint & Google Slides
Business
Free
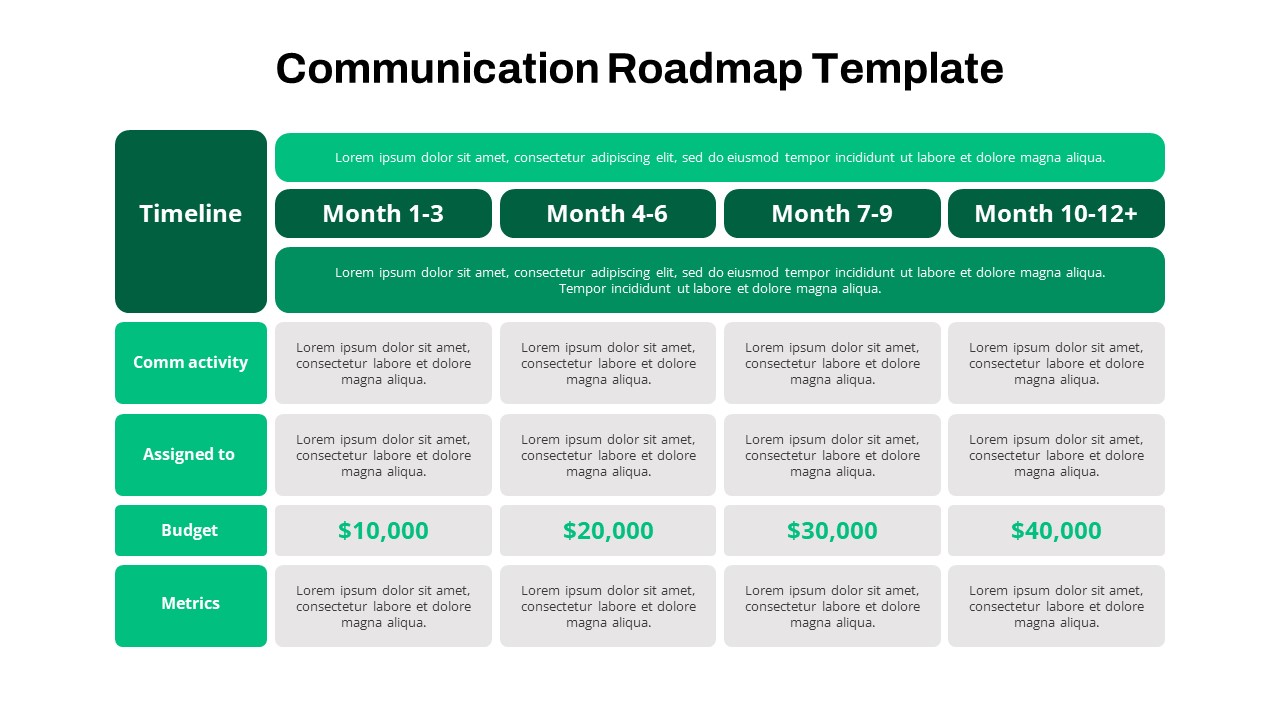
Quarterly Communication Roadmap Grid Template for PowerPoint & Google Slides
Marketing
Quarterly Financial Summary Dashboard Template for PowerPoint & Google Slides
Business Report
Quarterly Network Volume Analysis Template for PowerPoint & Google Slides
Business Report
Quarterly Business Review Dashboard Template for PowerPoint & Google Slides
Pitch Deck

Quarterly Net Interest Income Growth Template for PowerPoint & Google Slides
Bar/Column
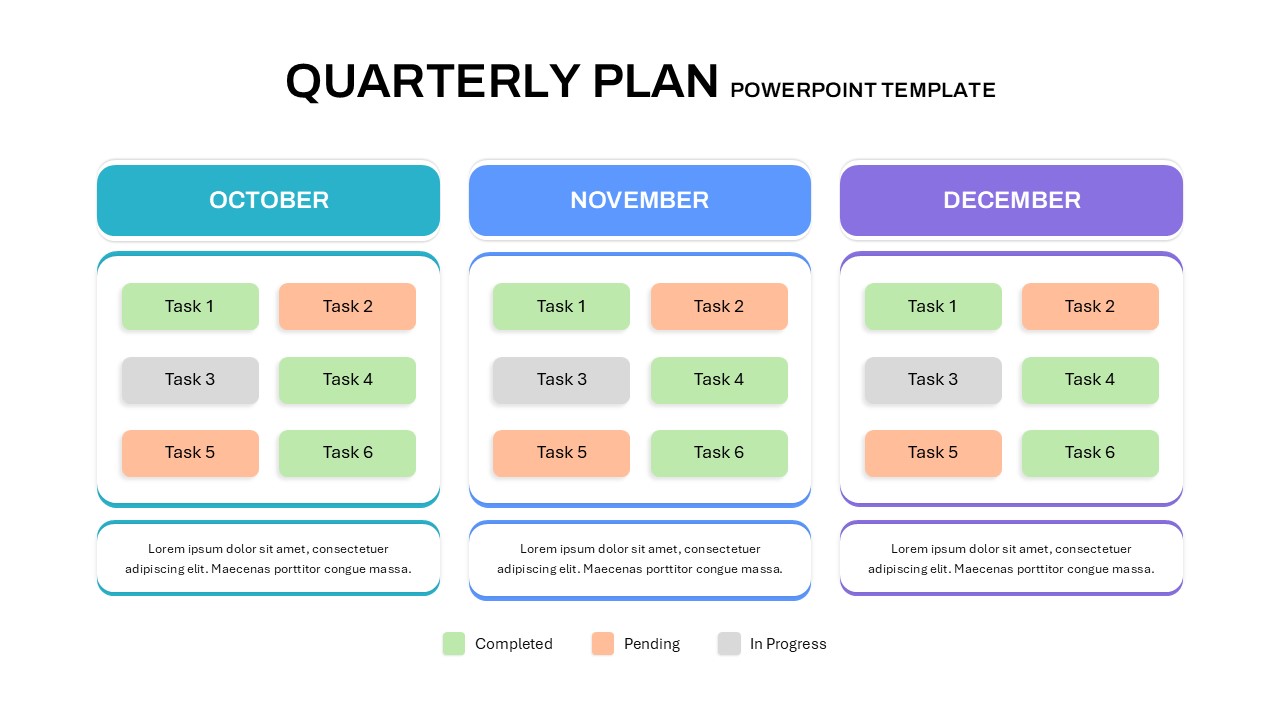
Quarterly Plan Template for PowerPoint & Google Slides
Project Status
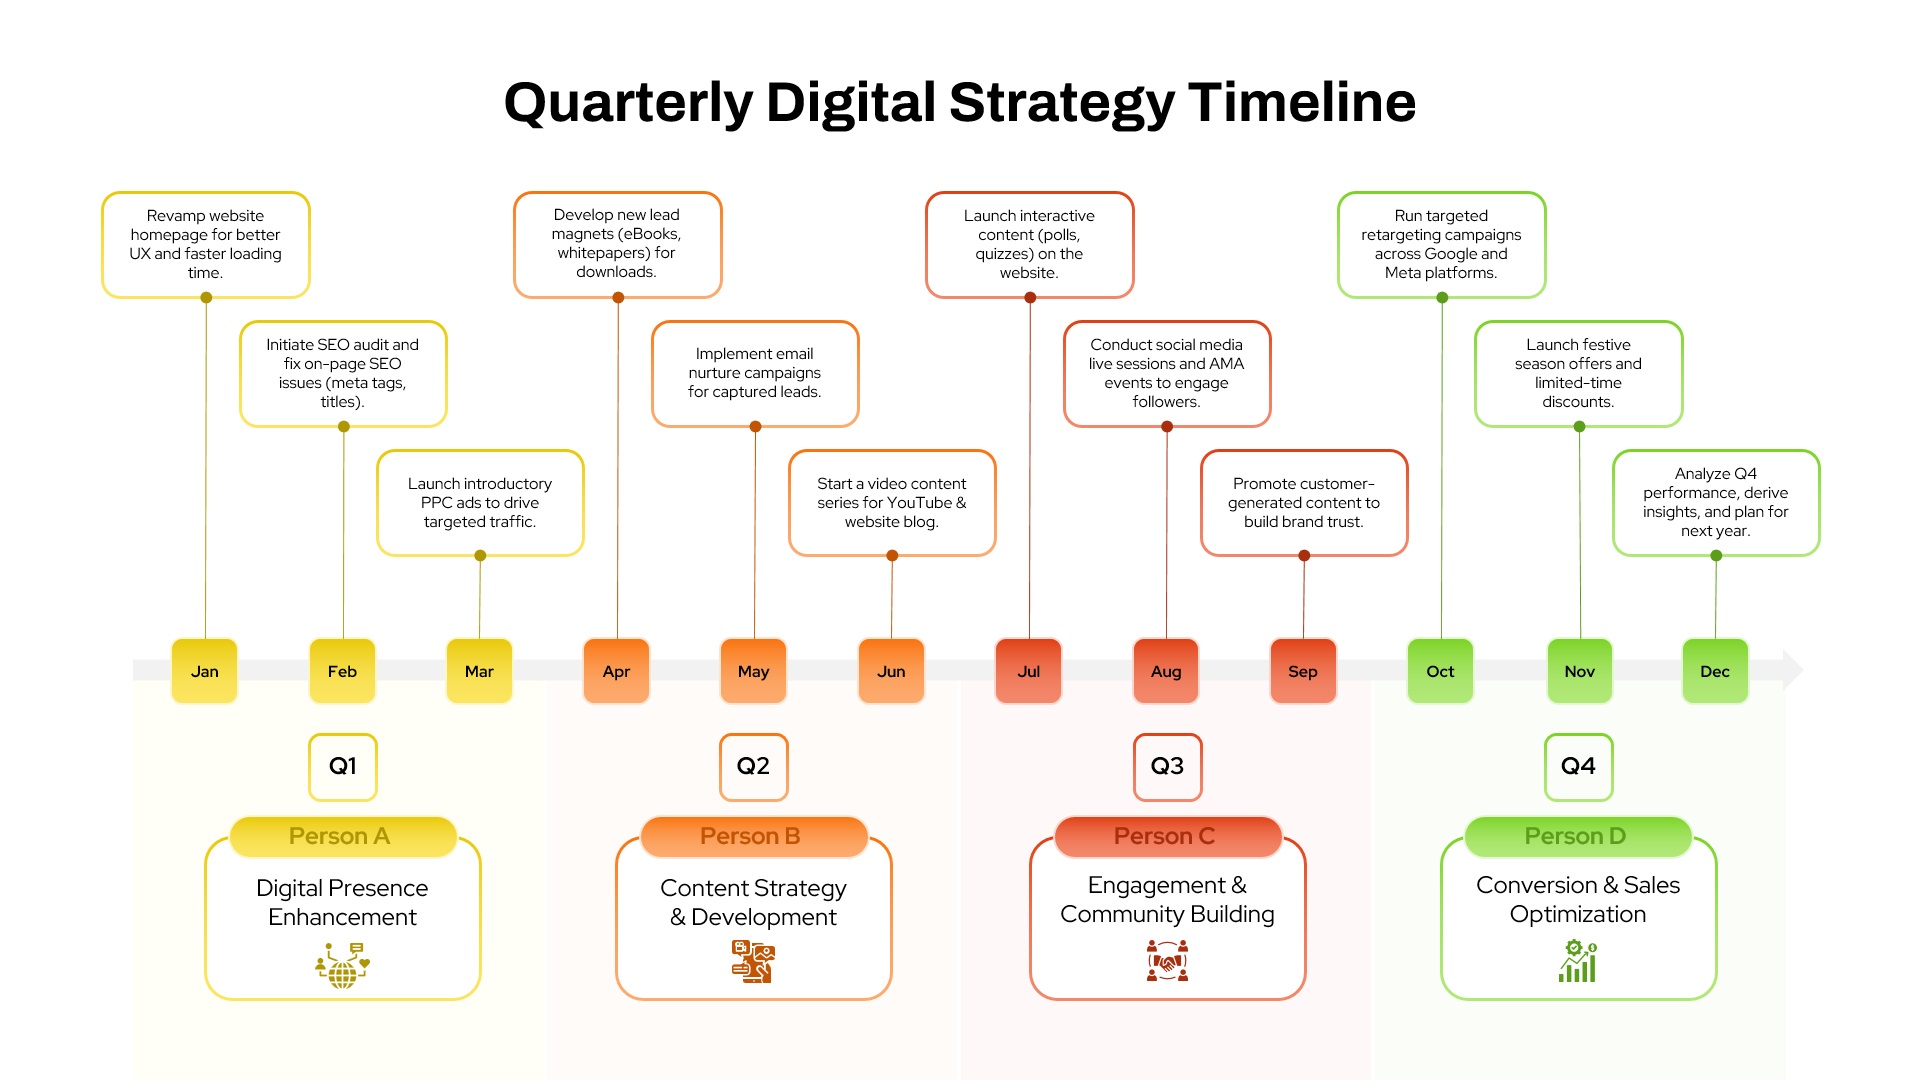
Quarterly Digital Strategy Timeline template for PowerPoint & Google Slides
Digital Marketing
Quad Chart Infographic Pack of 8 Slides Template for PowerPoint & Google Slides
Comparison Chart
Free Professional Gantt Chart Pack – 4 Slides Template for PowerPoint & Google Slides
Gantt Chart
Free
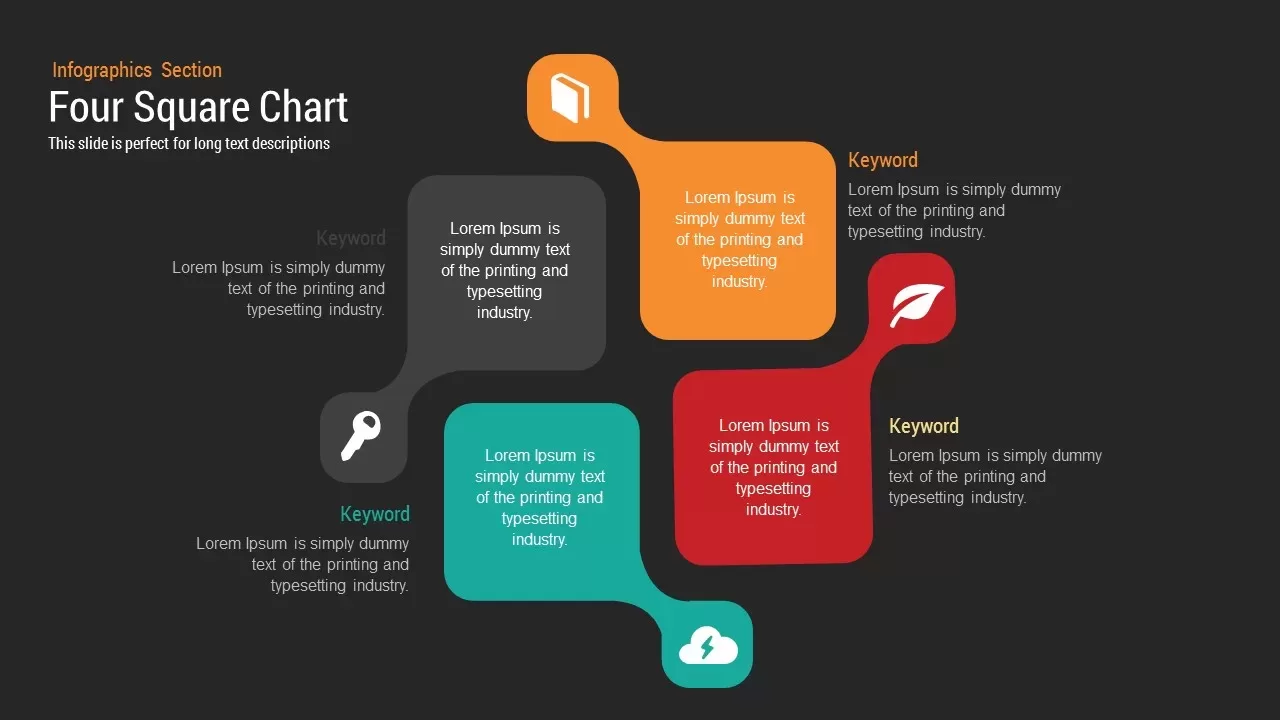
Four Square Chart template for PowerPoint & Google Slides
Charts
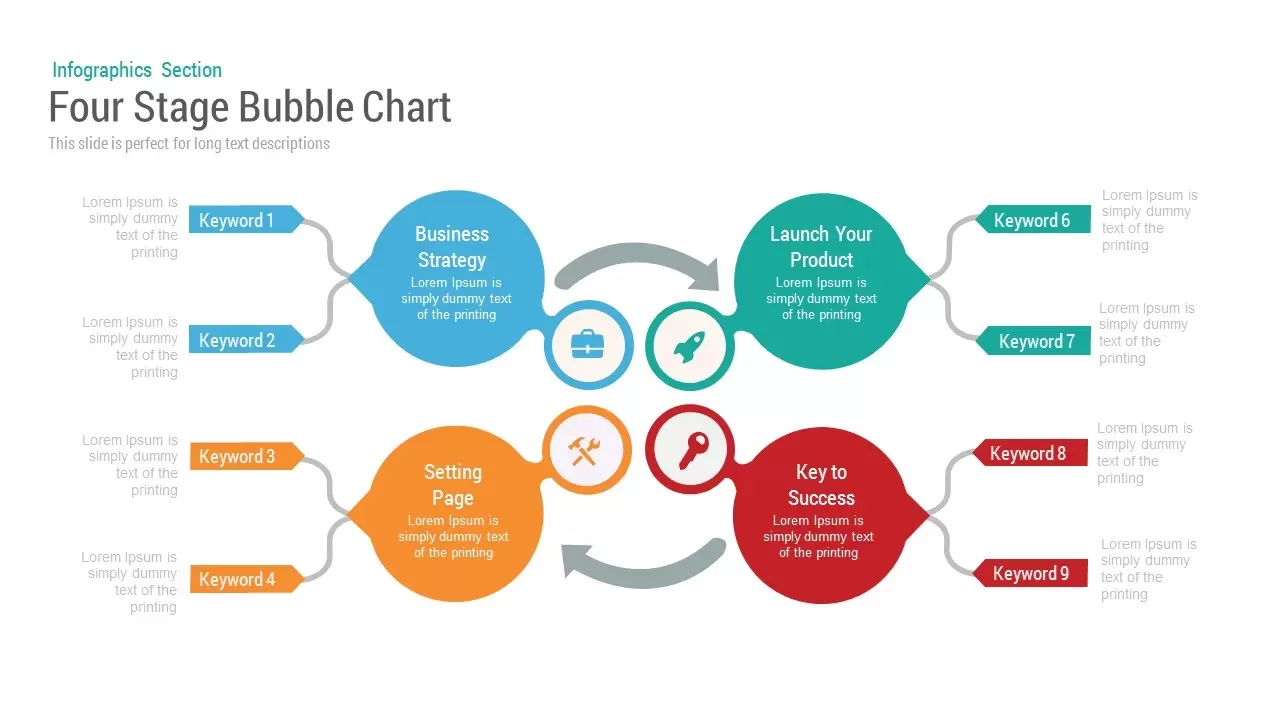
Bubble Chart template for PowerPoint & Google Slides
Charts
Circle Chart Data template for PowerPoint & Google Slides
Pie/Donut

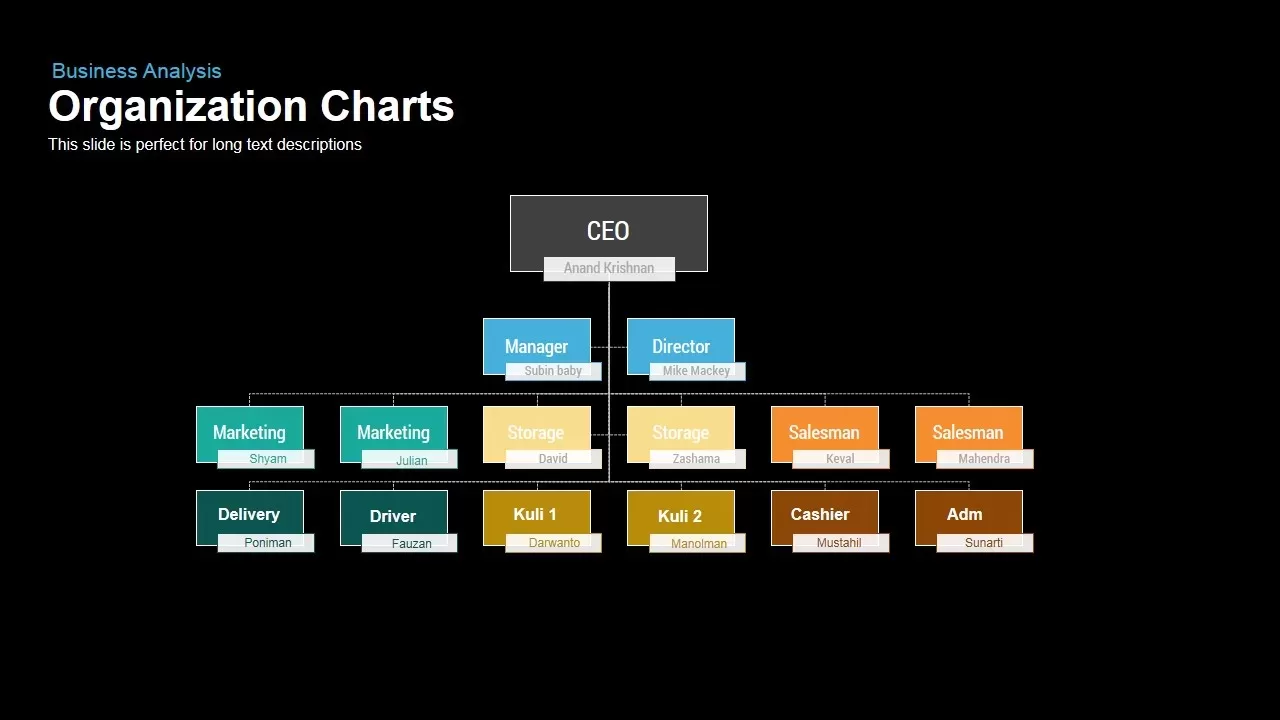
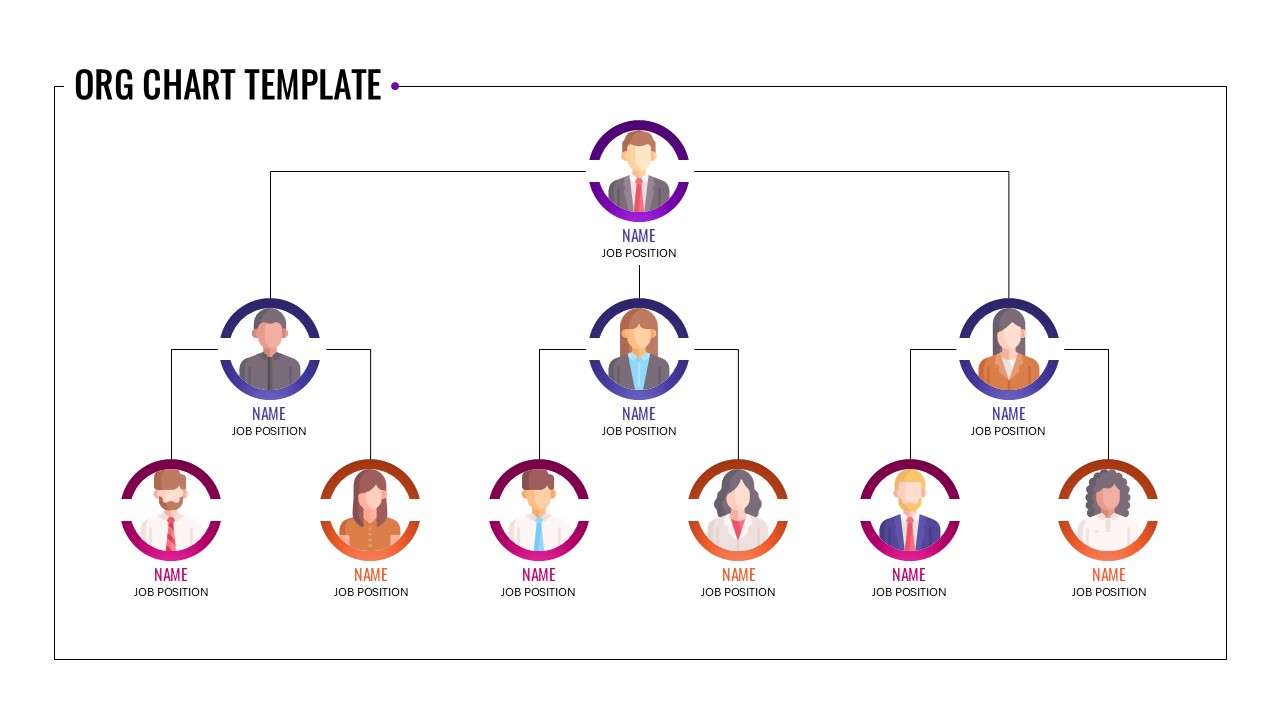
Corporate Organization Chart template for PowerPoint & Google Slides
Org Chart
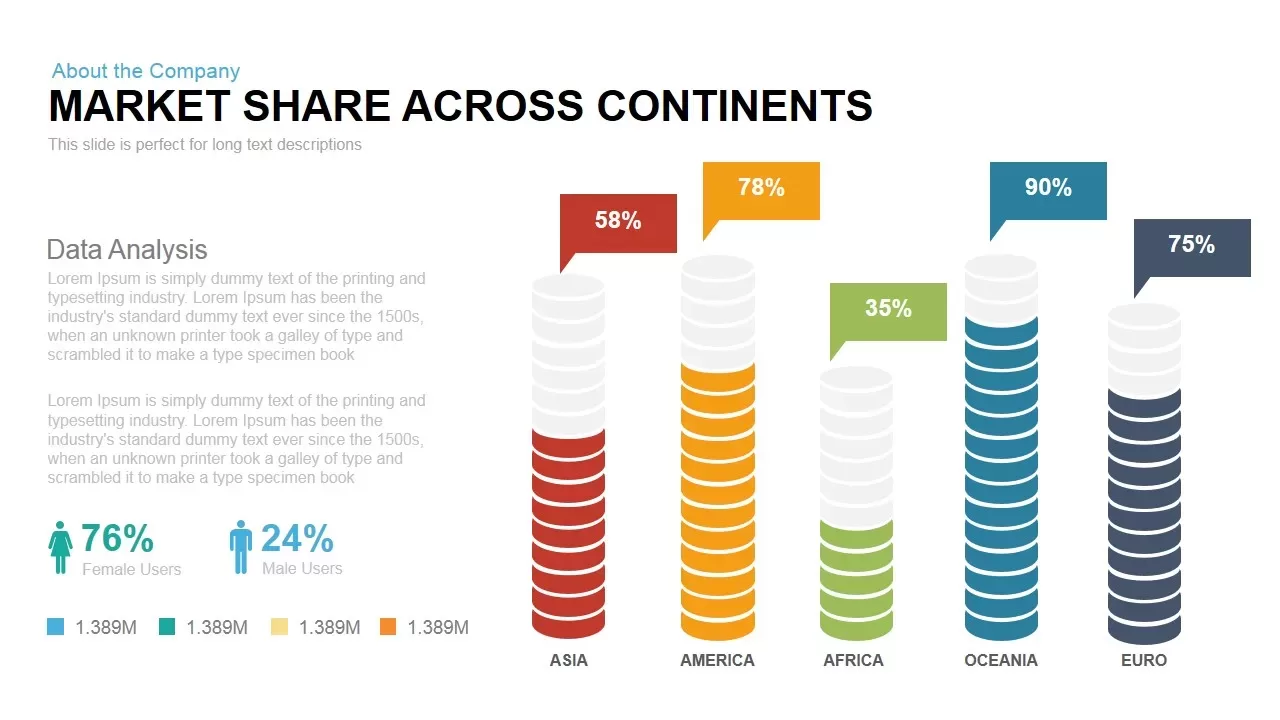
Global Market Share Cylinder Chart Template for PowerPoint & Google Slides
Bar/Column
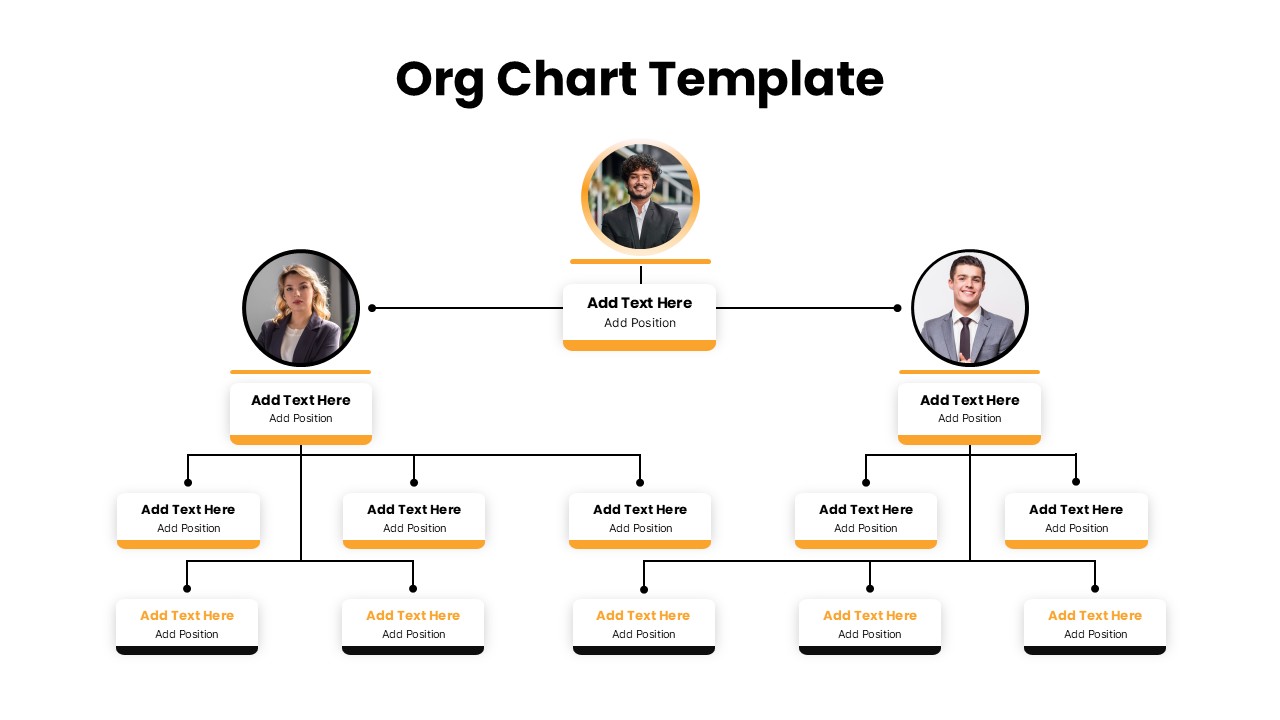
Business Organization Chart Hierarchy Template for PowerPoint & Google Slides
Org Chart
3D Bar Chart Data Infographics Template for PowerPoint & Google Slides
Bar/Column
Creative Dynamic Gantt Chart Timeline Template for PowerPoint & Google Slides
Timeline
Creative Bar Chart template for PowerPoint & Google Slides
Charts
Simple Organizational Chart Infographic Template for PowerPoint & Google Slides
Org Chart
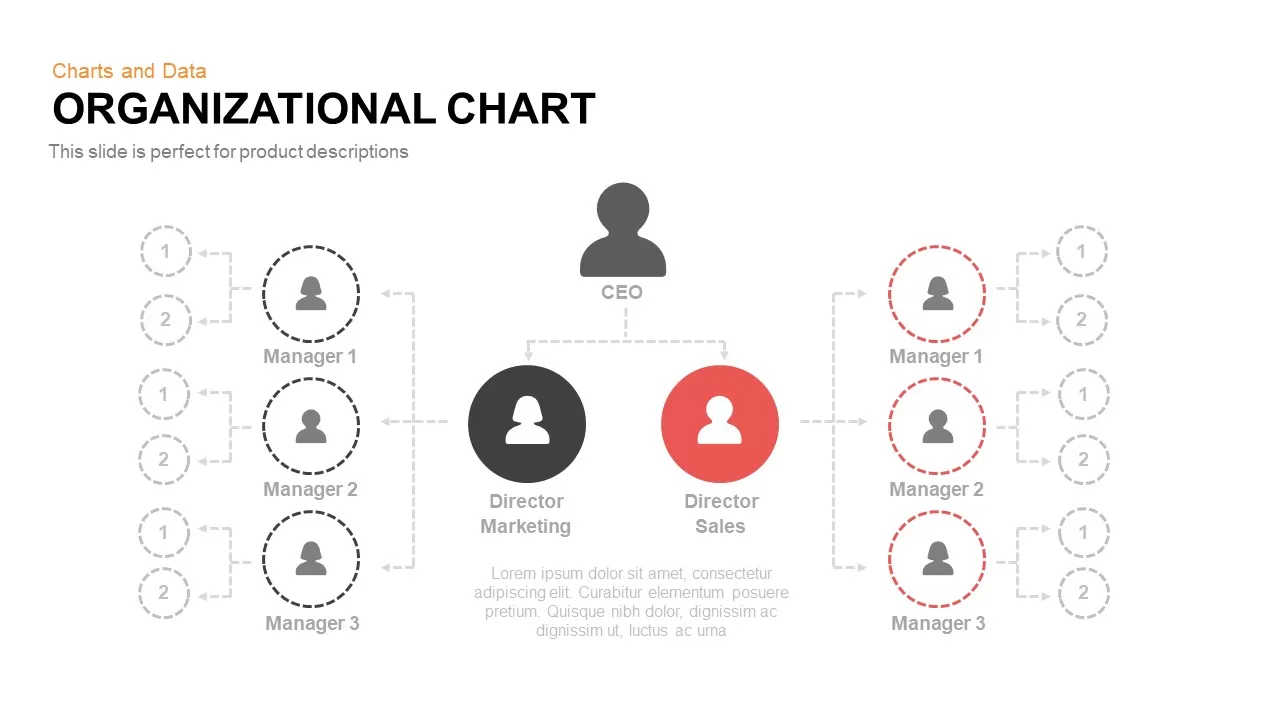
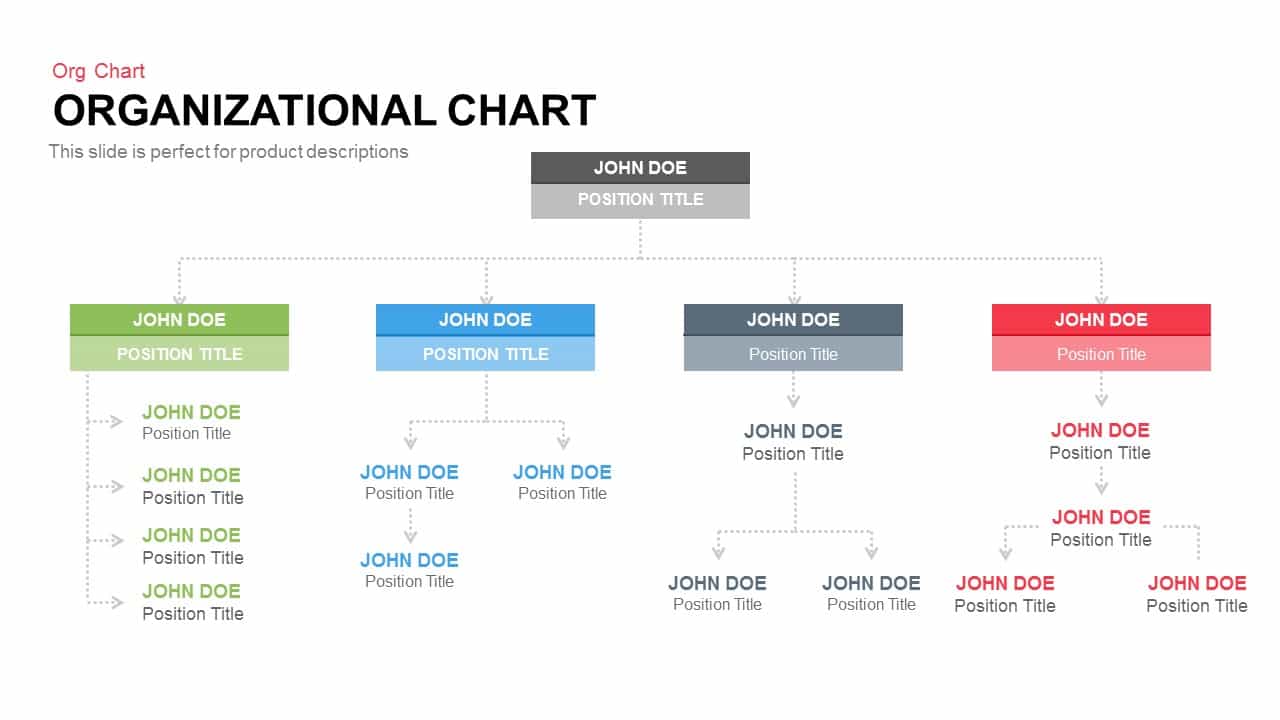
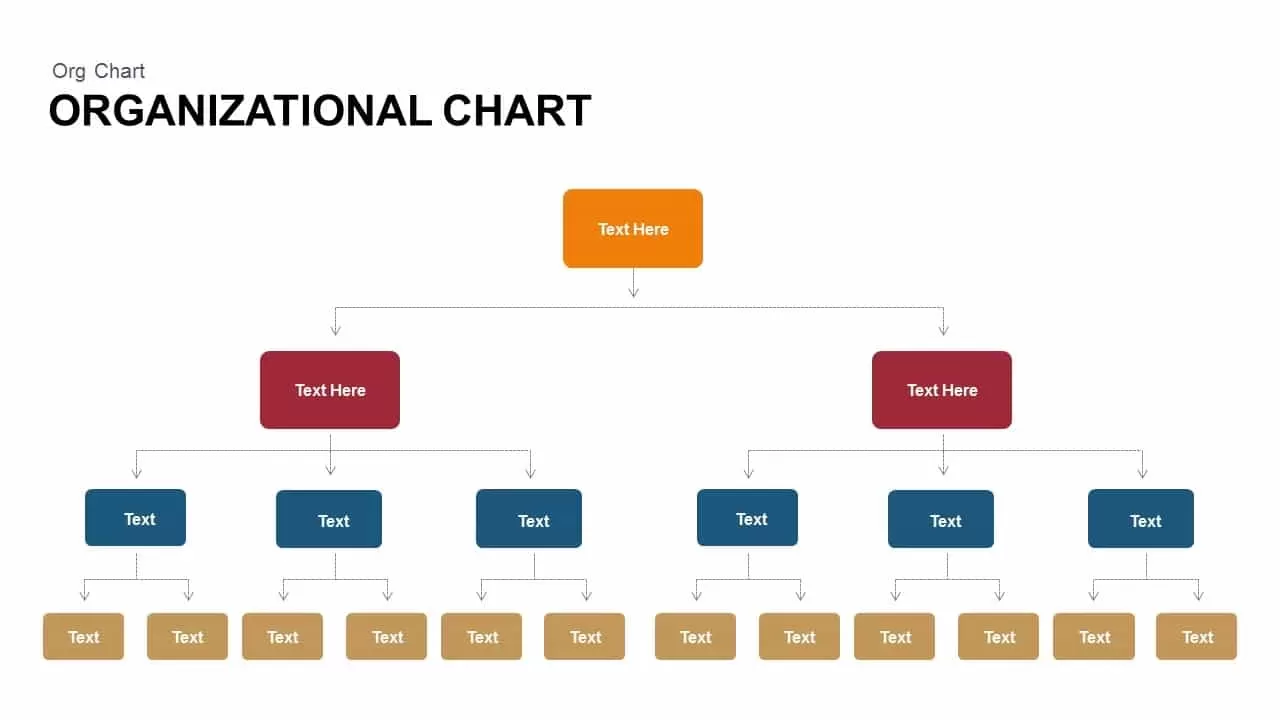
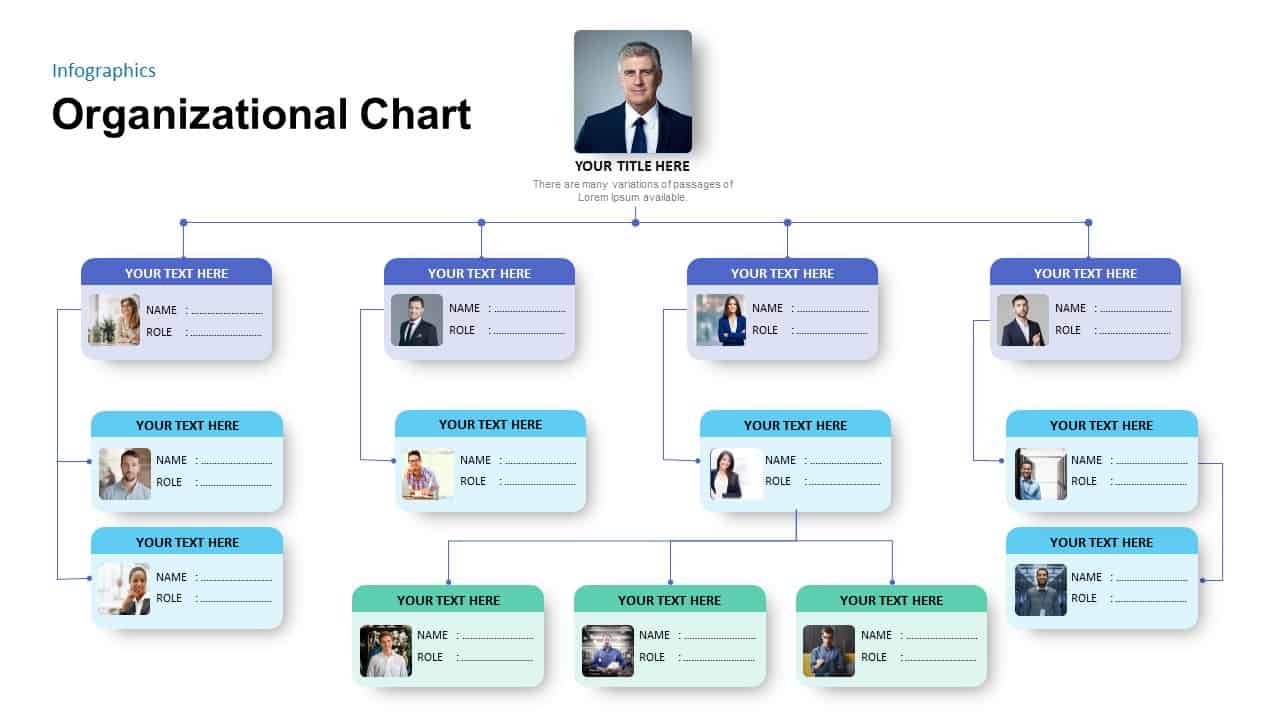
Organizational Chart Template for PowerPoint & Google Slides
Org Chart
Pencil Bar Chart Data Analysis Template for PowerPoint & Google Slides
Bar/Column
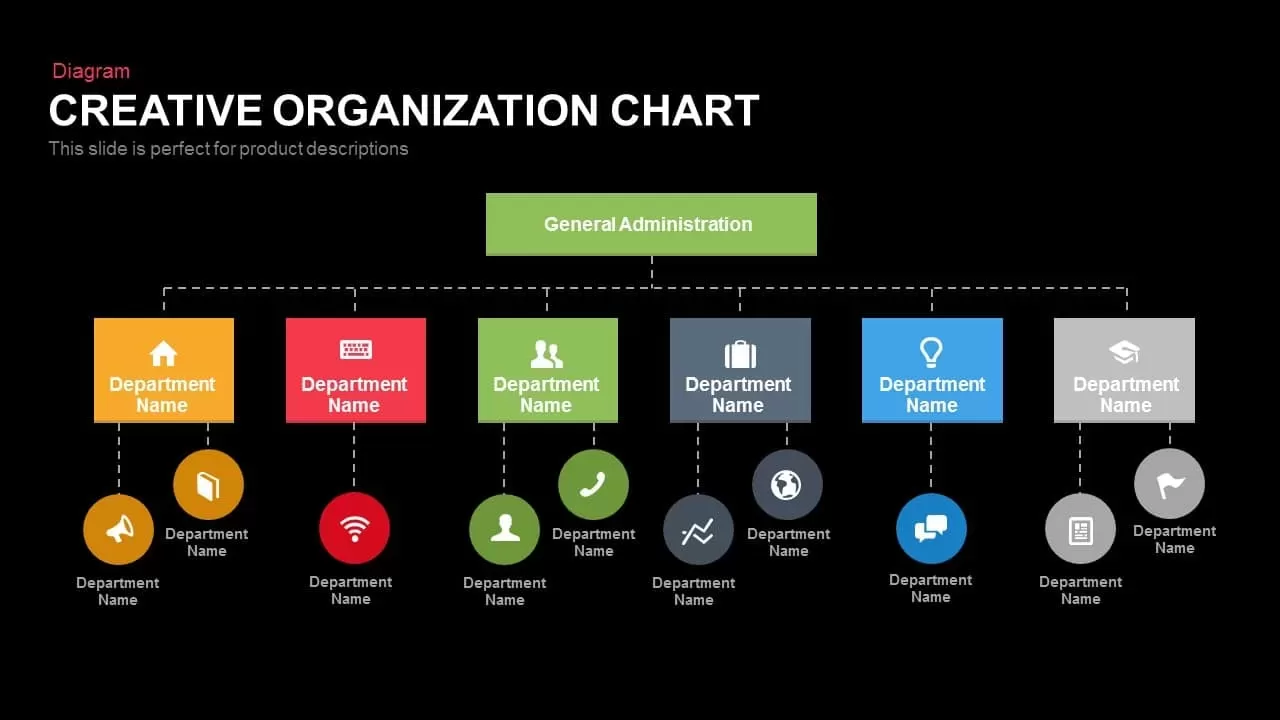
Creative Organization Chart Diagram Template for PowerPoint & Google Slides
Org Chart
Corporate Org Chart template for PowerPoint & Google Slides
Org Chart

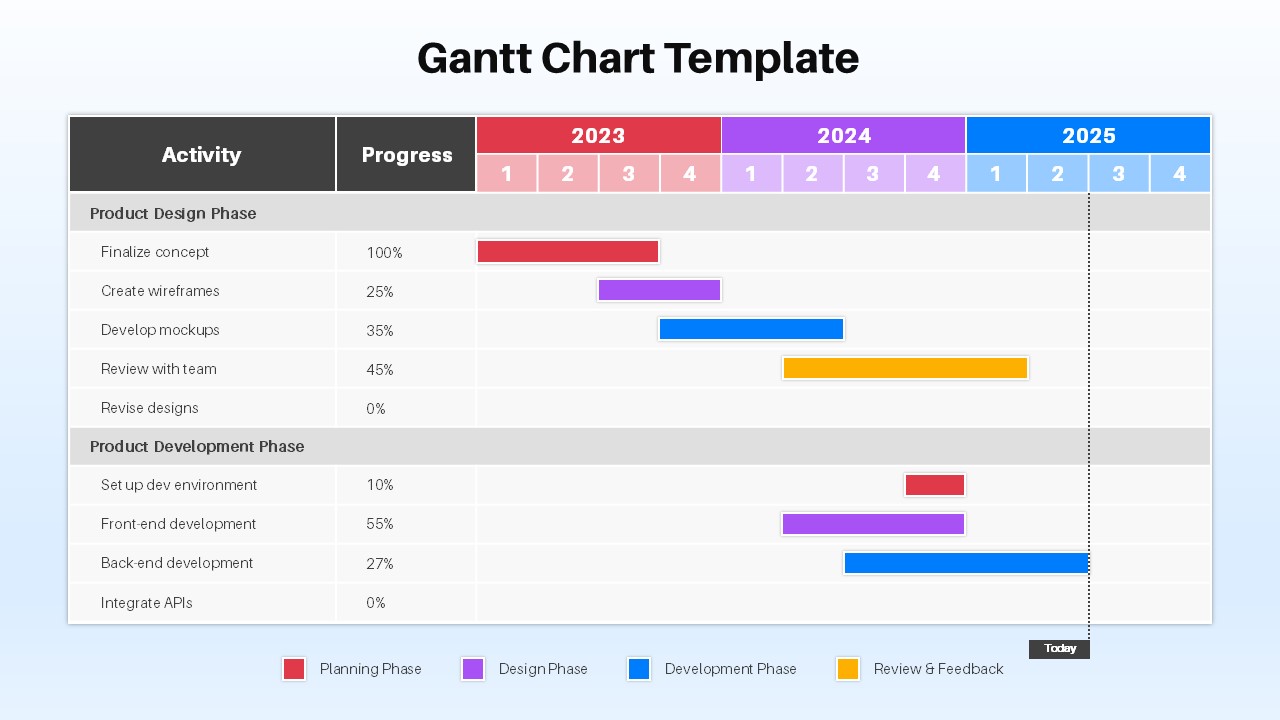
Fully Editable Gantt Chart Timeline template for PowerPoint & Google Slides
Gantt Chart
Modern Ten-Block Section Title Chart template for PowerPoint & Google Slides
Comparison

Colorful Radial Bar Chart Template for PowerPoint & Google Slides
Bar/Column
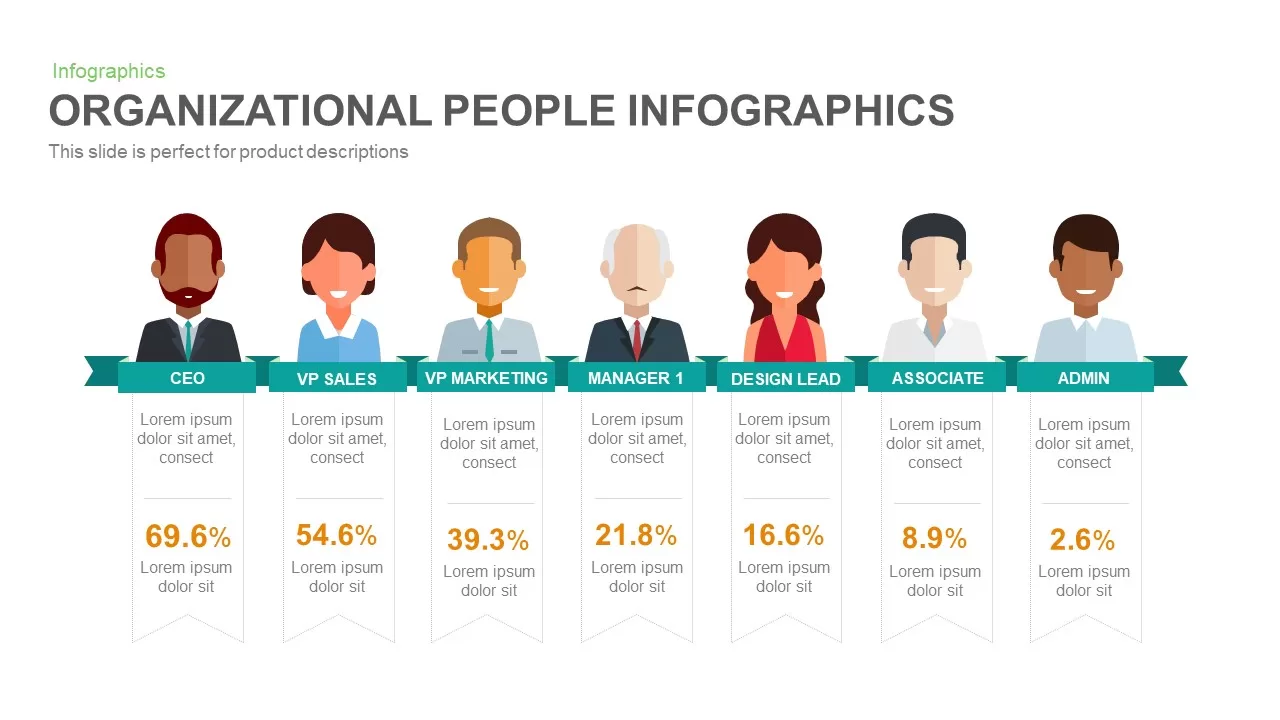
Organizational People Percentage Chart template for PowerPoint & Google Slides
Org Chart
Five-Stage People Infographic Chart template for PowerPoint & Google Slides
Process
Three-Stage Circular Options Chart Template for PowerPoint & Google Slides
Comparison
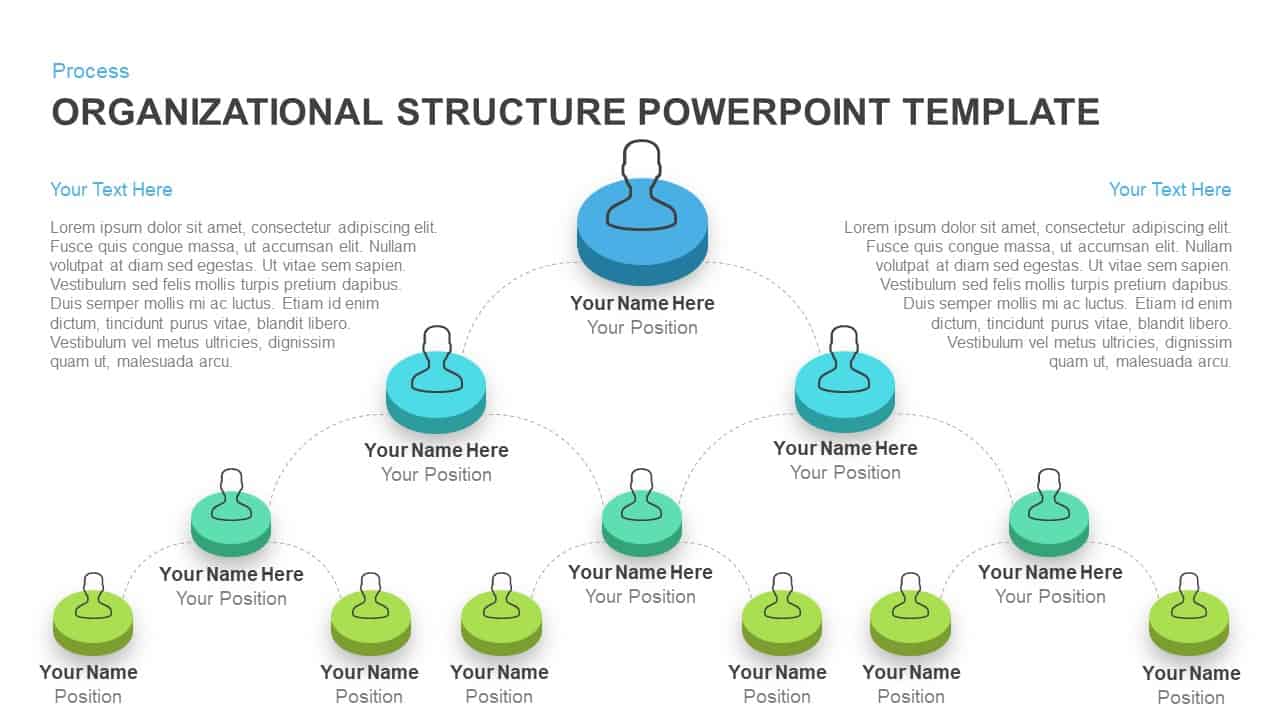
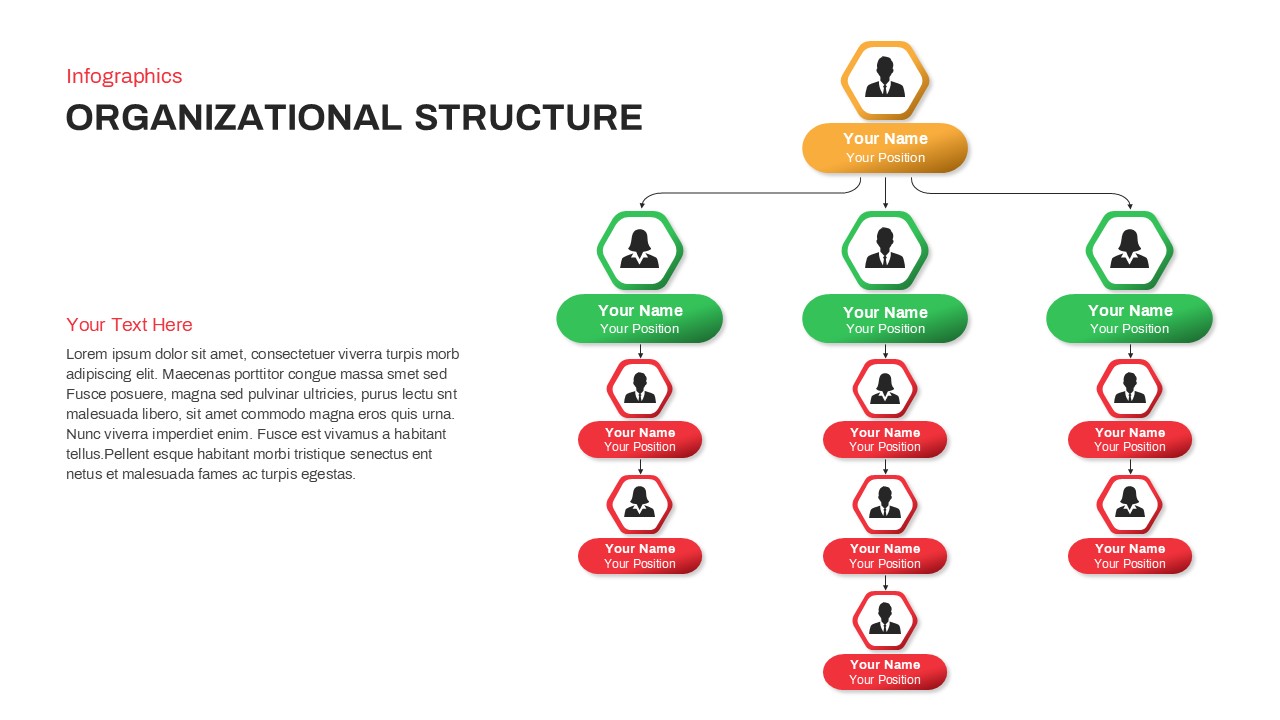
Organizational Chart Structure template for PowerPoint & Google Slides
Org Chart

Application Revenue Line Chart KPI Template for PowerPoint & Google Slides
Revenue
Tornado Chart Data Comparison Slide Template for PowerPoint & Google Slides
Bar/Column
Modern Colorful Circular Org Chart Template for PowerPoint & Google Slides
Org Chart
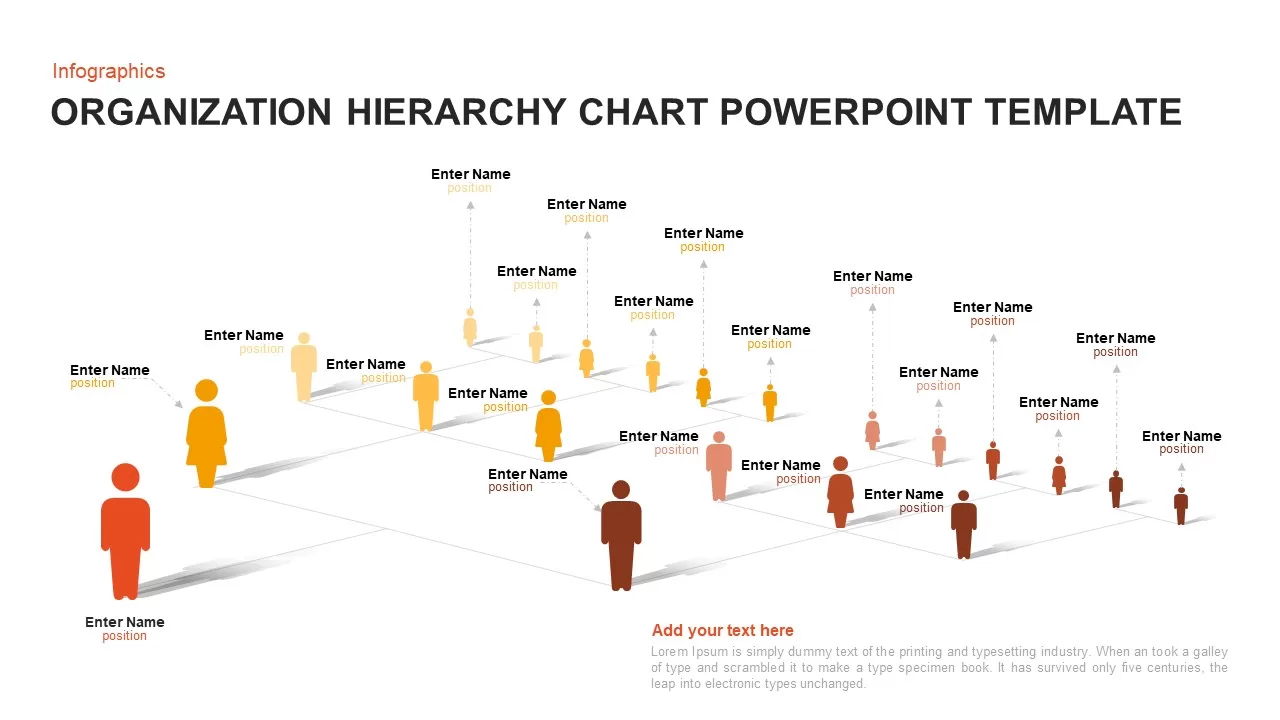
3D Organization Hierarchy Chart Template for PowerPoint & Google Slides
Org Chart
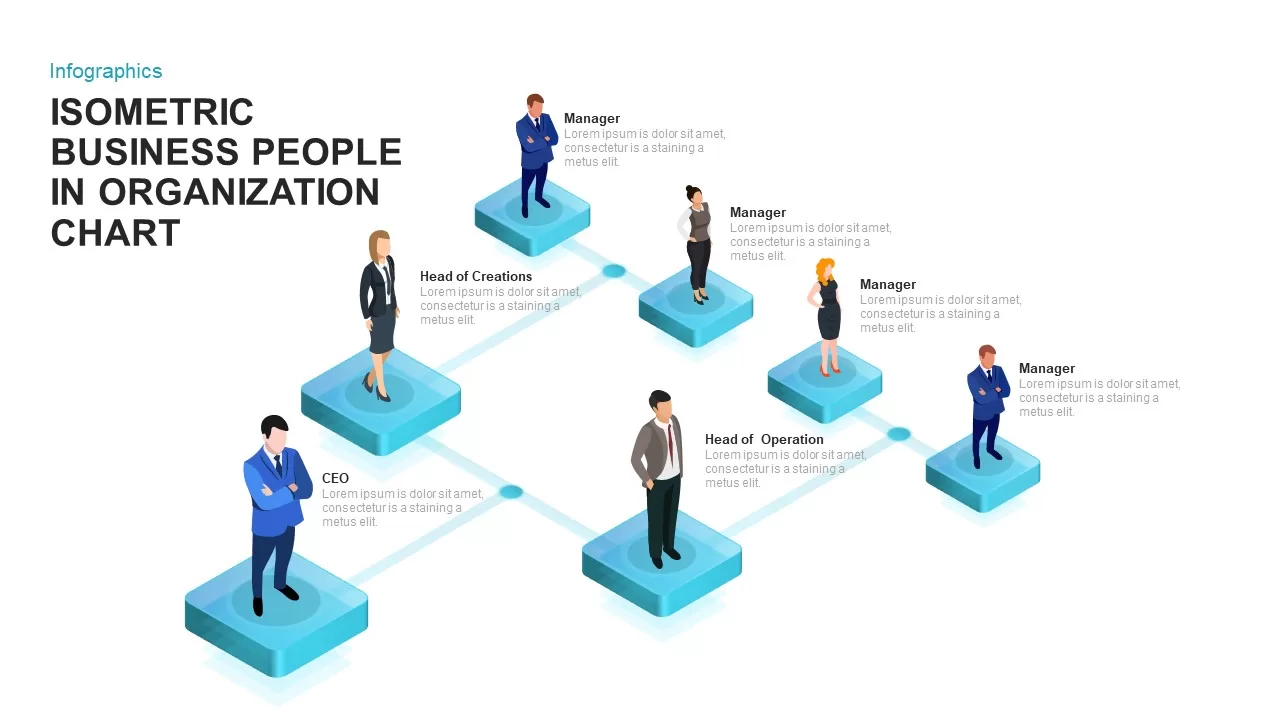
Isometric Business Organization Chart Template for PowerPoint & Google Slides
Org Chart
Isometric Organizational Structure Chart Template for PowerPoint & Google Slides
Org Chart
Radar Chart Product Comparison Template for PowerPoint & Google Slides
Comparison Chart
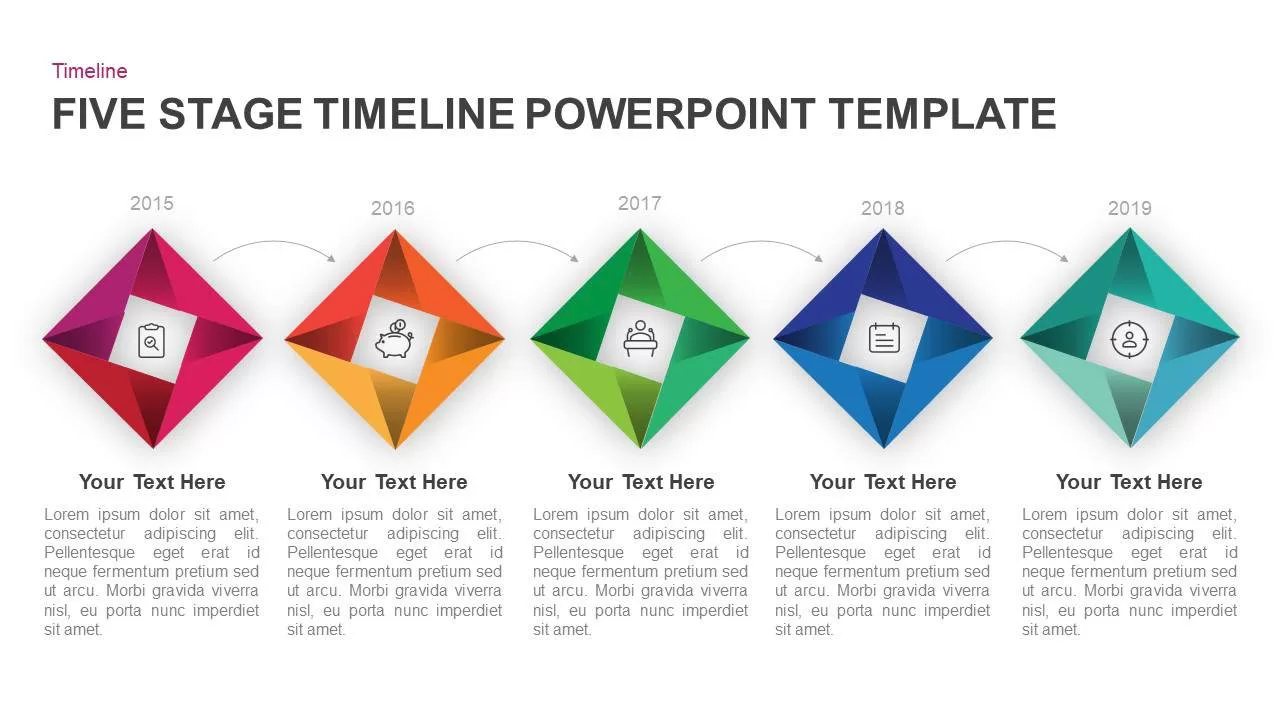
Five-Stage Diamond Timeline Chart Template for PowerPoint & Google Slides
Timeline
Distracting Factors at Work Bar Chart Template for PowerPoint & Google Slides
Bar/Column
Organizational Structure Hierarchy Chart Template for PowerPoint & Google Slides
Org Chart
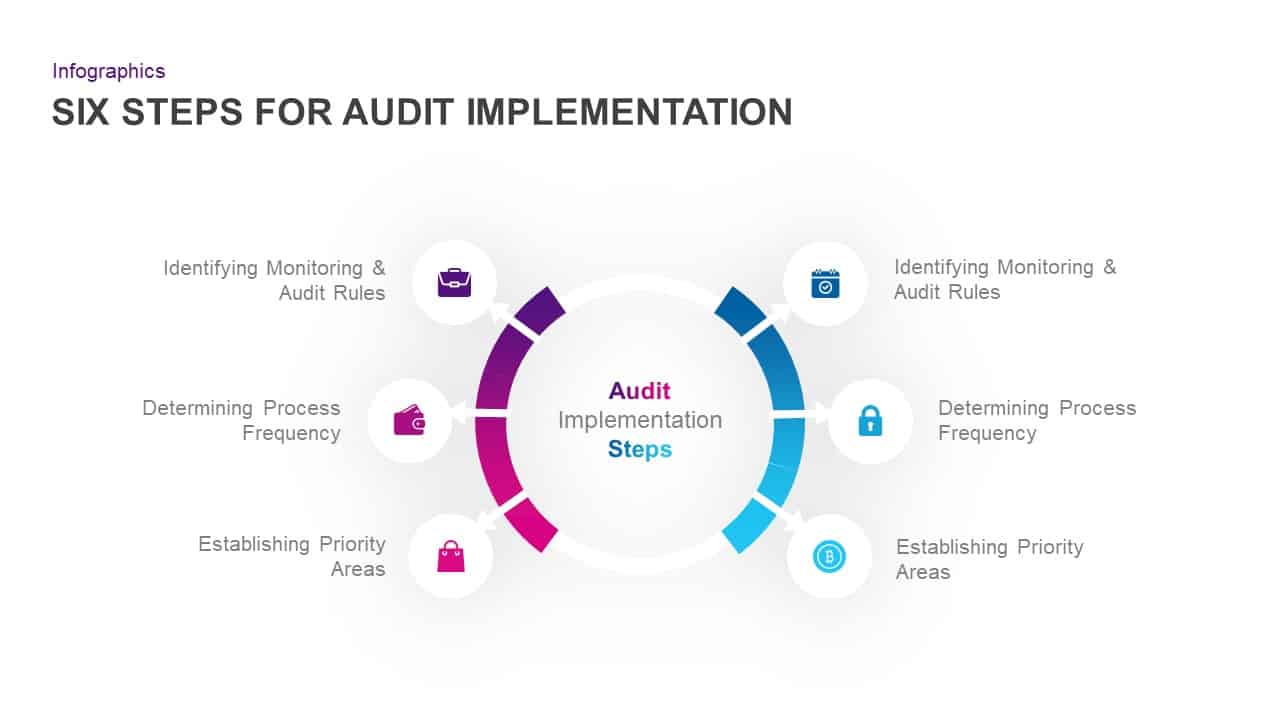
Six-Step Audit Implementation Chart Template for PowerPoint & Google Slides
Circular
Modern Organizational Chart Hierarchy Template for PowerPoint & Google Slides
Org Chart

Dynamic Marketing Radar Chart Analytics Template for PowerPoint & Google Slides
Comparison
Business Growth Metaphor Chart Template for PowerPoint & Google Slides
Business
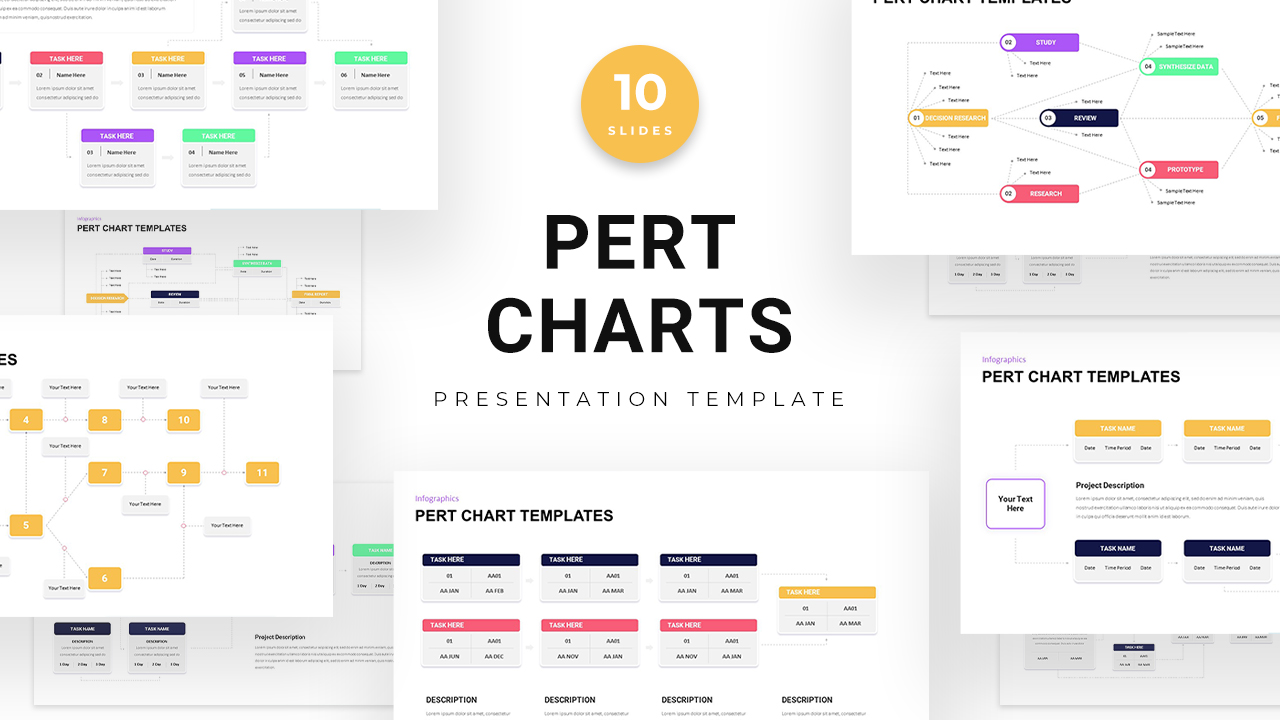
PERT Chart Project Management template for PowerPoint & Google Slides
Project Status
Professional Organizational Chart Diagram Template for PowerPoint & Google Slides
Org Chart
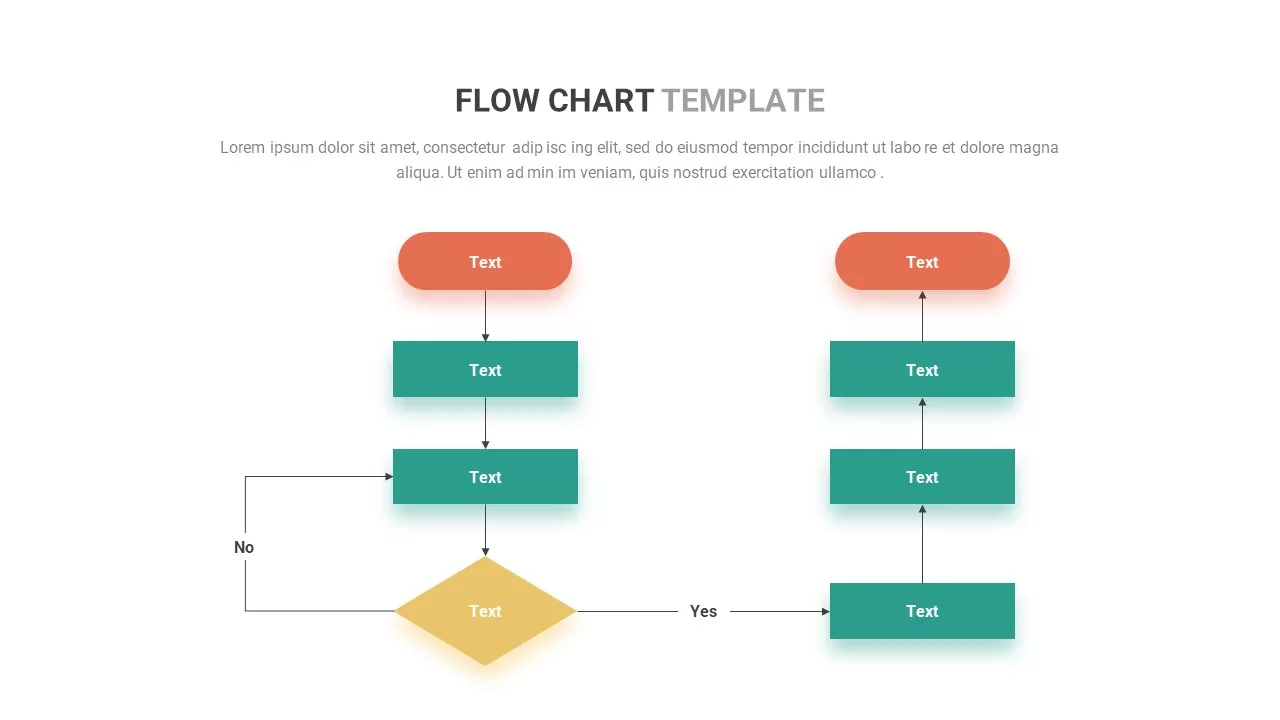
Flow Chart Template for PowerPoint & Google Slides
Flow Charts
Flow Chart template for PowerPoint & Google Slides
Flow Charts
Cost Reduction Strategy Donut Chart Template for PowerPoint & Google Slides
Pie/Donut
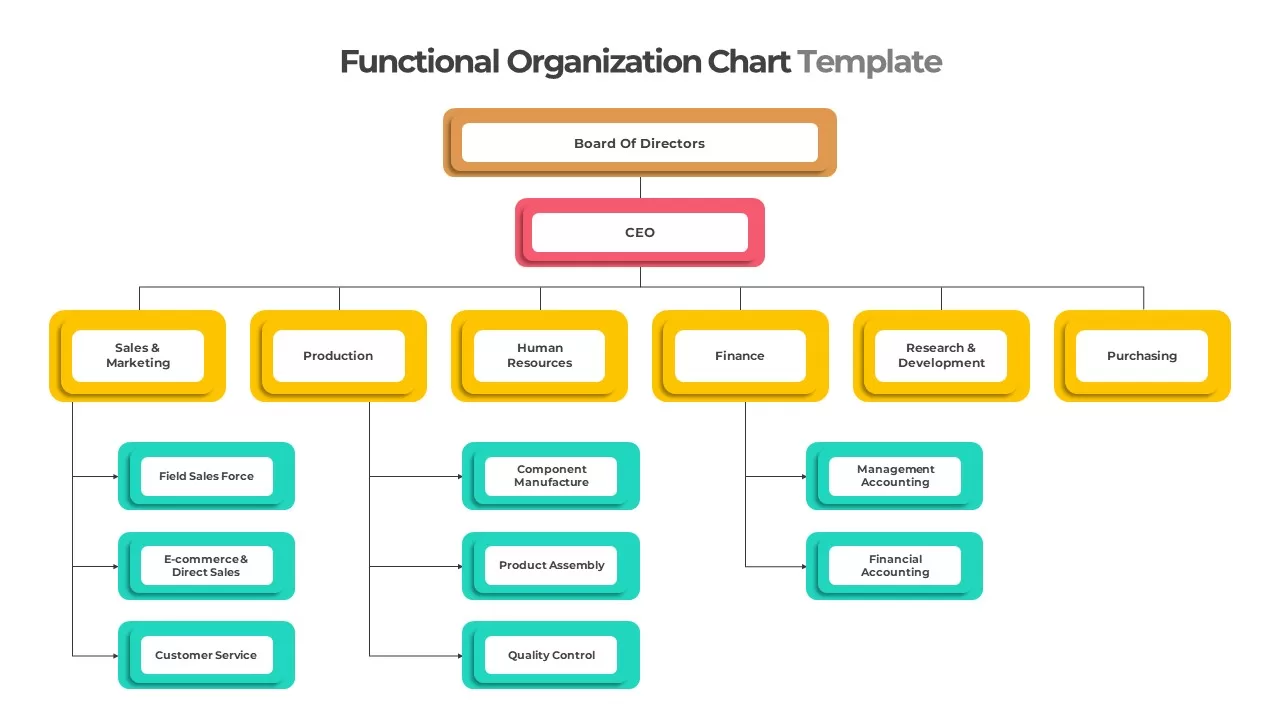
Colorful Functional Organization Chart Template for PowerPoint & Google Slides
Org Chart
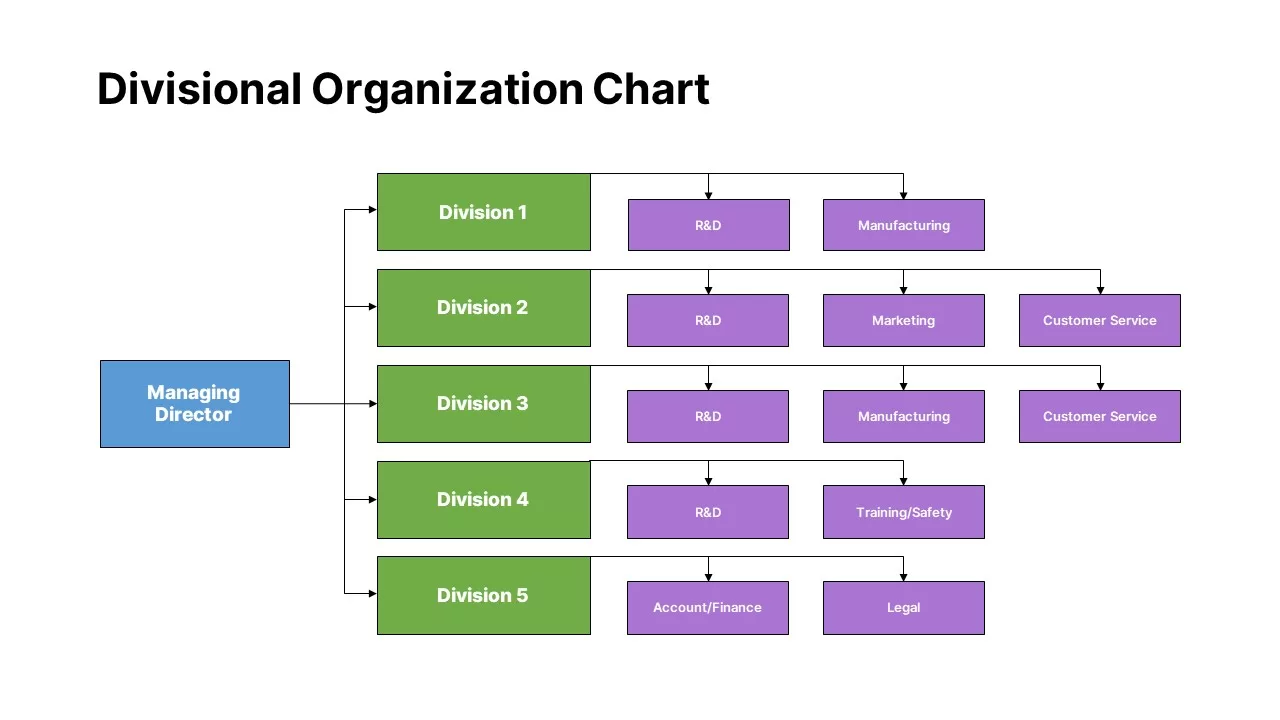
Divisional Organization Chart Template for PowerPoint & Google Slides
Org Chart
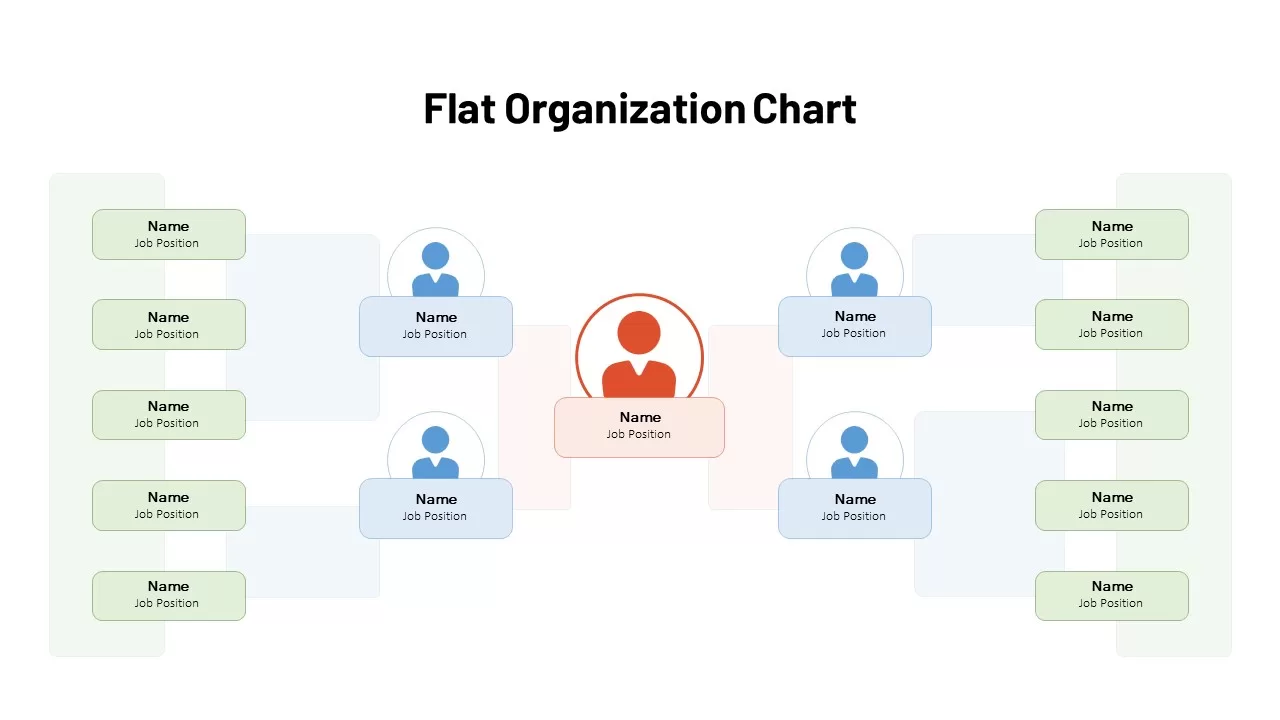
Flat Organization Chart Diagram Template for PowerPoint & Google Slides
Org Chart
Multi-Series Stacked Bar Chart Template for PowerPoint & Google Slides
Bar/Column
Editable Multi-Series Peak Line Chart Template for PowerPoint & Google Slides
Comparison Chart
Professional 100% Stacked Column Chart Template for PowerPoint & Google Slides
Bar/Column
Professional Quad Chart Layout Template for PowerPoint & Google Slides
Pie/Donut
Grouped Column Chart Comparison Template for PowerPoint & Google Slides
Bar/Column
Five-Phase and Three-Phase Phases Chart Template for PowerPoint & Google Slides
Charts
Excel-Driven Gradient Timeline Chart Template for PowerPoint & Google Slides
Multi-Series Vertical Dot Chart Template for PowerPoint & Google Slides
Comparison Chart
Multi-Style Clock Chart Diagram Template for PowerPoint & Google Slides
Circular
Multipurpose Spline Chart Data Trend Template for PowerPoint & Google Slides
Bar/Column
Multi-Variation Circular Chart Diagram Template for PowerPoint & Google Slides
Circular
Professional HR Organization Chart Template for PowerPoint & Google Slides
Org Chart
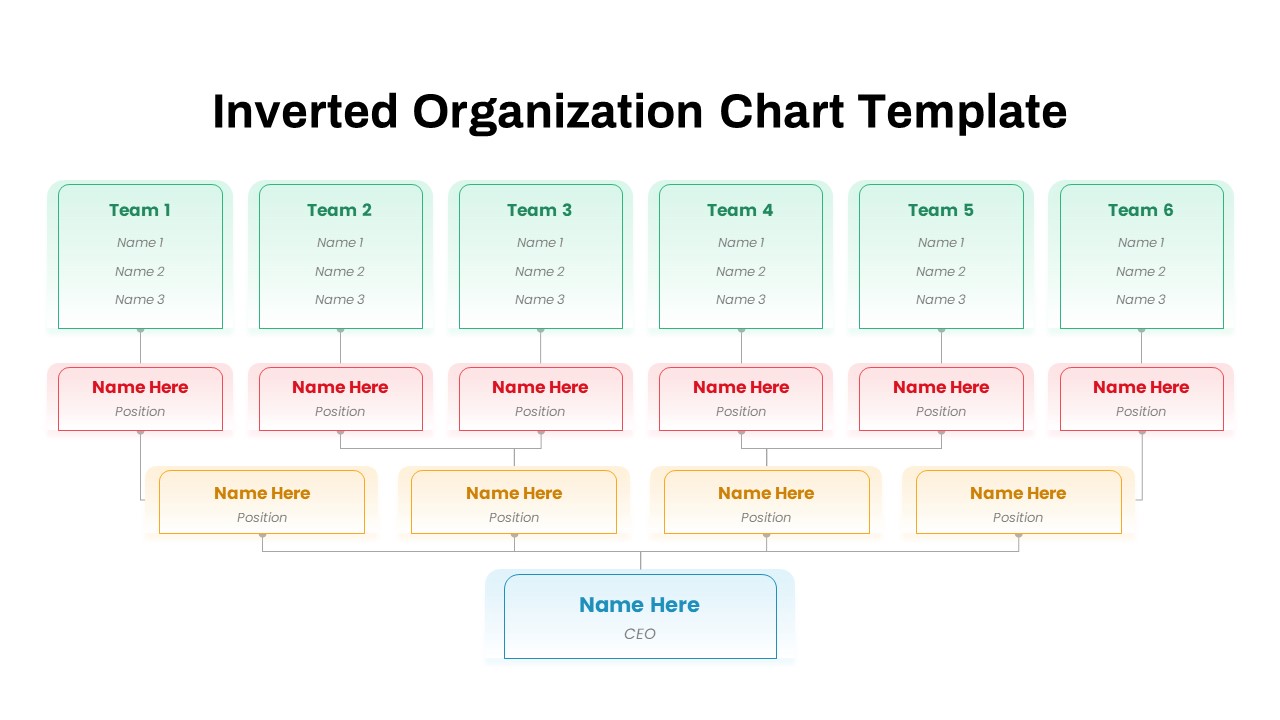
Inverted Organization Chart Diagram Template for PowerPoint & Google Slides
Org Chart
Multi-Level Colorful Pyramid Chart Template for PowerPoint & Google Slides
Pyramid
Free Versatile Product Comparison Chart Template for PowerPoint & Google Slides
Charts
Free
Bubble Chart Scatter, Diagram & Matrix Template for PowerPoint & Google Slides
Comparison Chart
Data Analysis Bar Chart with Insights Template for PowerPoint & Google Slides
Bar/Column
Free
Horizontal Bar Chart Slide with Icons Template for PowerPoint & Google Slides
Bar/Column
Project Tracker Timeline Gantt Chart Template for PowerPoint & Google Slides
Project Status
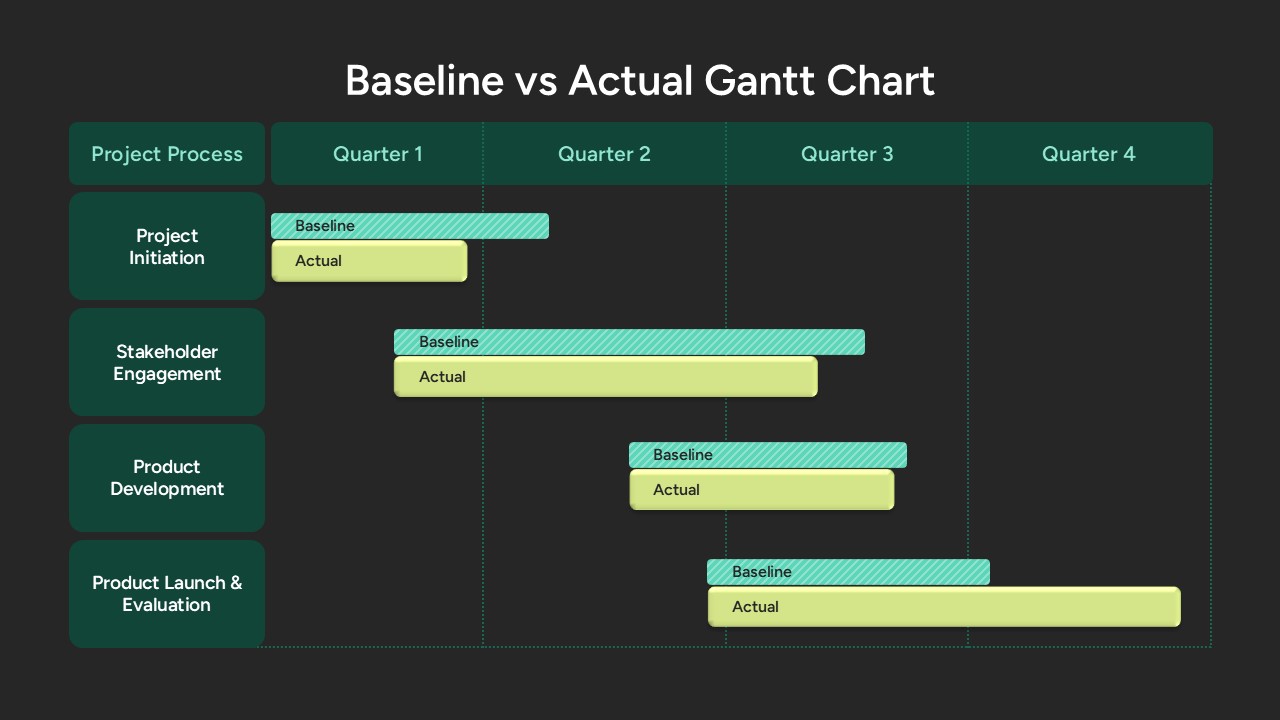
Baseline vs Actual Gantt Chart Template for PowerPoint & Google Slides
Gantt Chart
Weekly Gantt Chart Project Timeline Template for PowerPoint & Google Slides
Gantt Chart
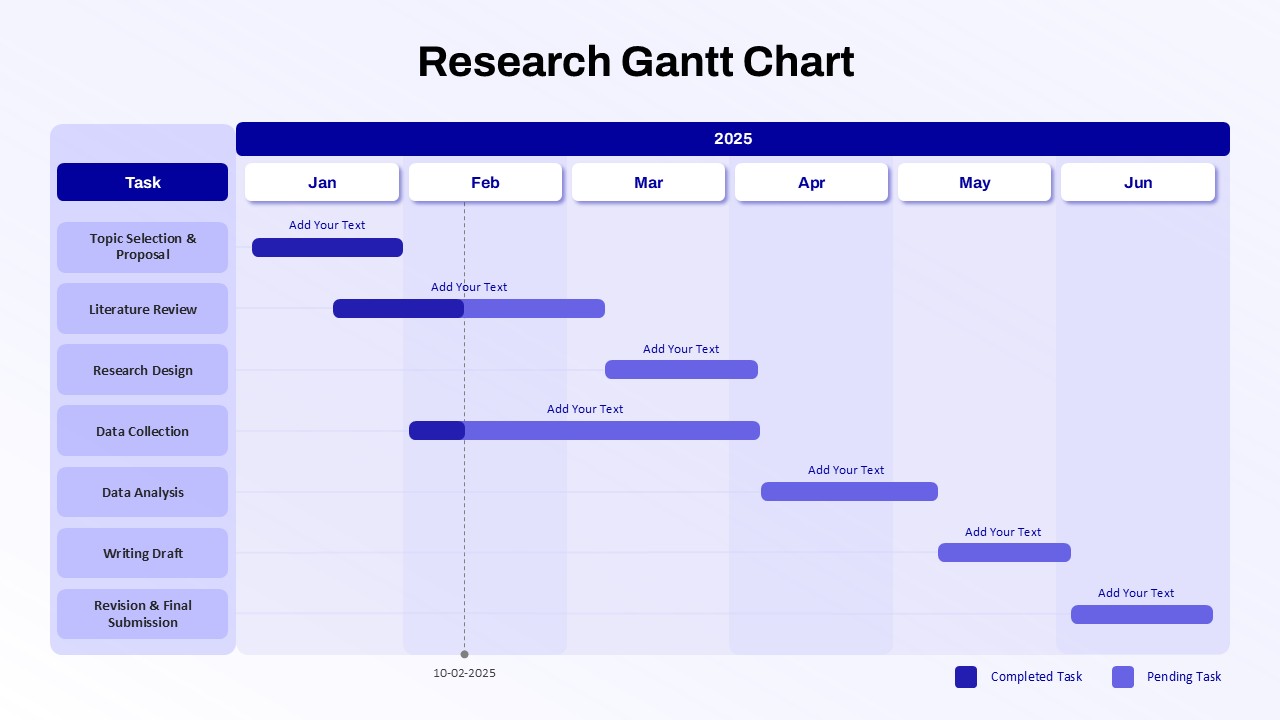
Research Gantt Chart template for PowerPoint & Google Slides
Project
Project Gantt Chart Template for PowerPoint & Google Slides
Gantt Chart
Circular Sample Org Chart Template for PowerPoint & Google Slides
Org Chart
Project Timeline Gantt Chart Template for PowerPoint & Google Slides
Gantt Chart
Horizontal Organizational Chart Template for PowerPoint & Google Slides
Org Chart
Colorful Annual Gantt Chart Timeline Template for PowerPoint & Google Slides
Gantt Chart
Corporate Hierarchy Org Chart Template for PowerPoint & Google Slides
Org Chart