Quarterly Revenue Comparison Bar Chart Template for PowerPoint & Google Slides


Description
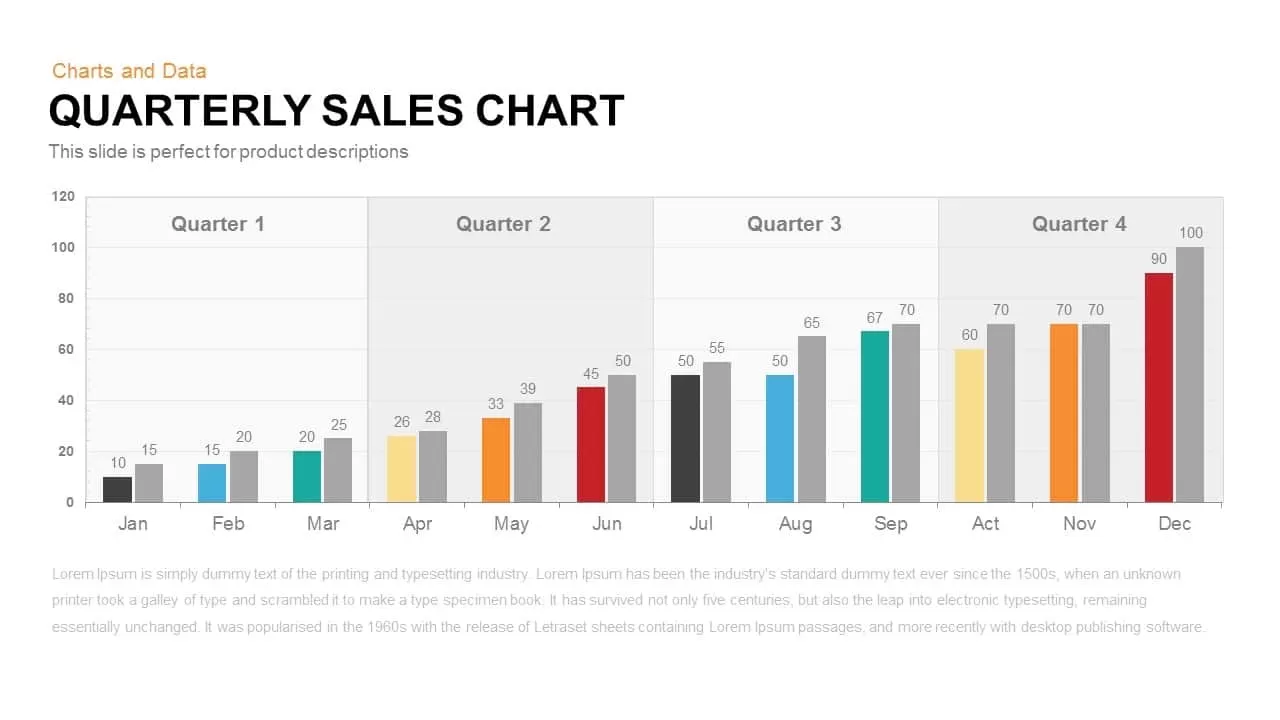
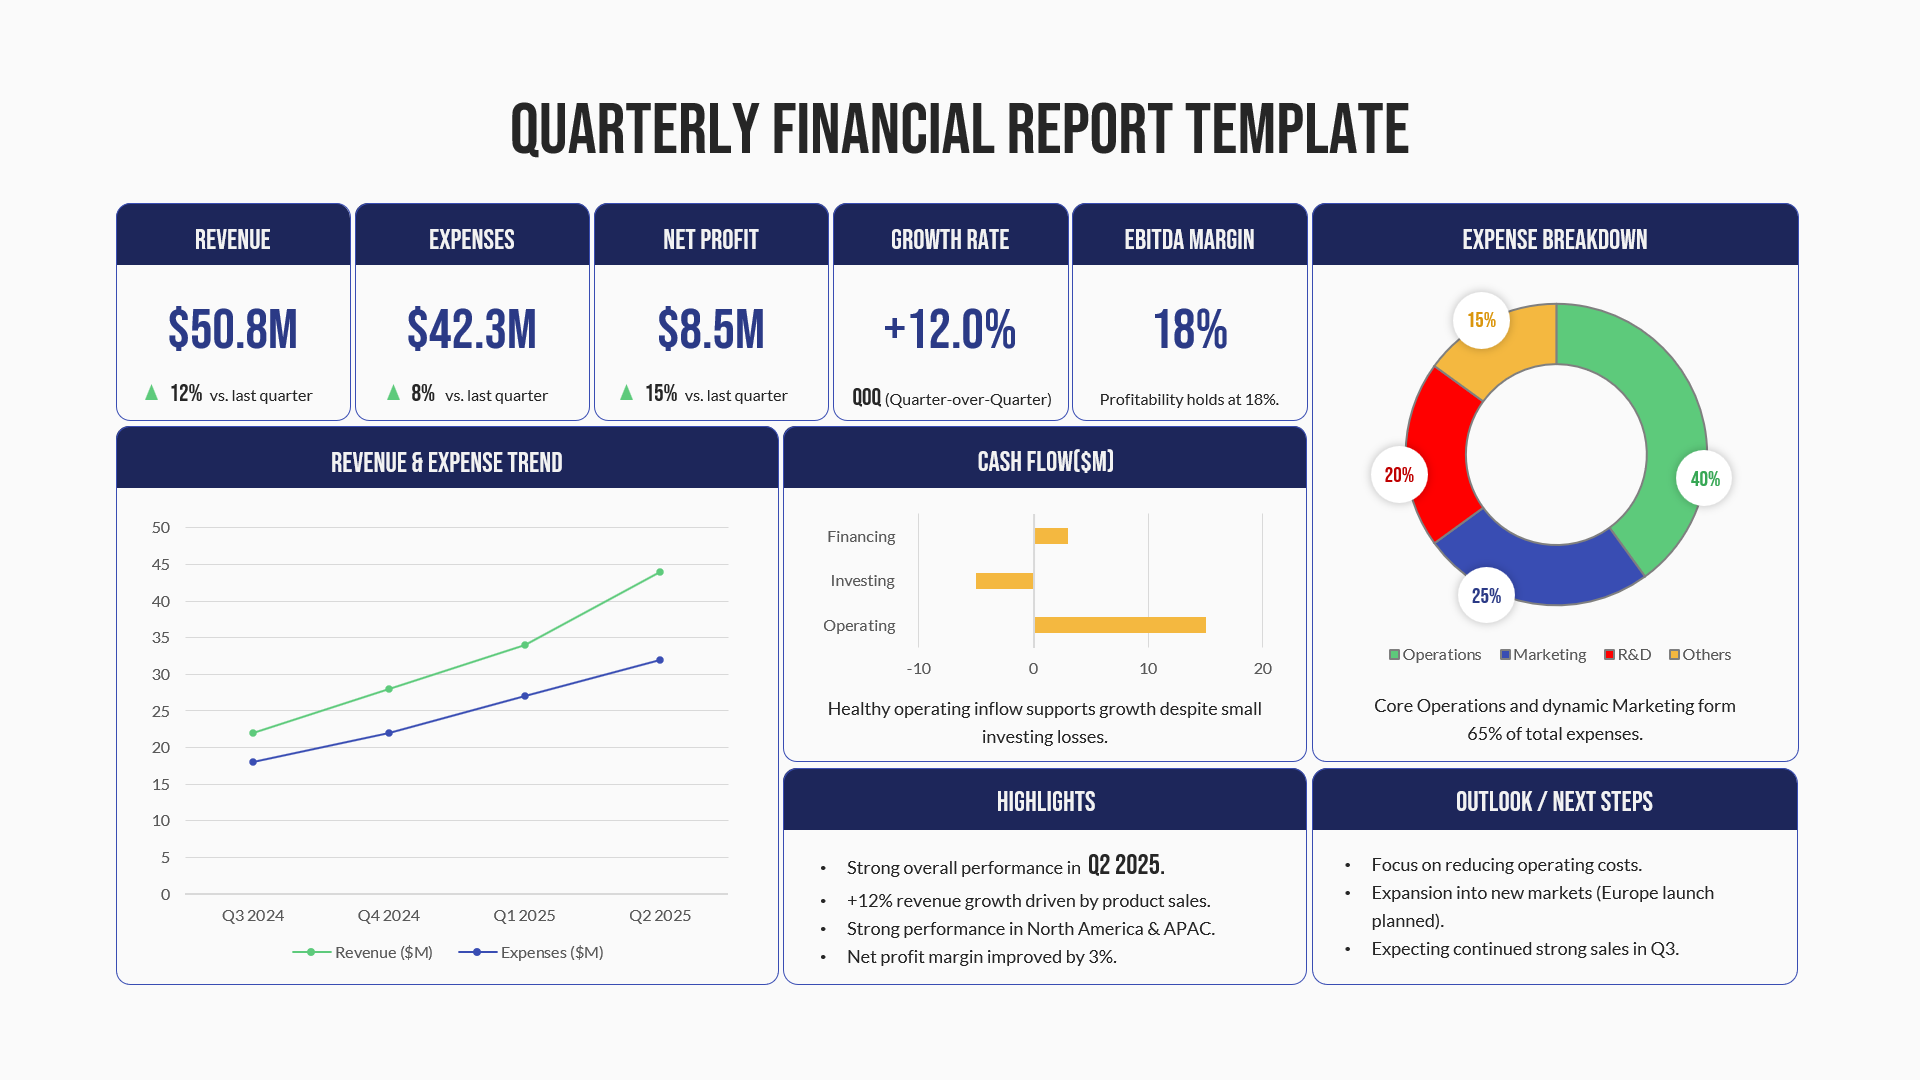
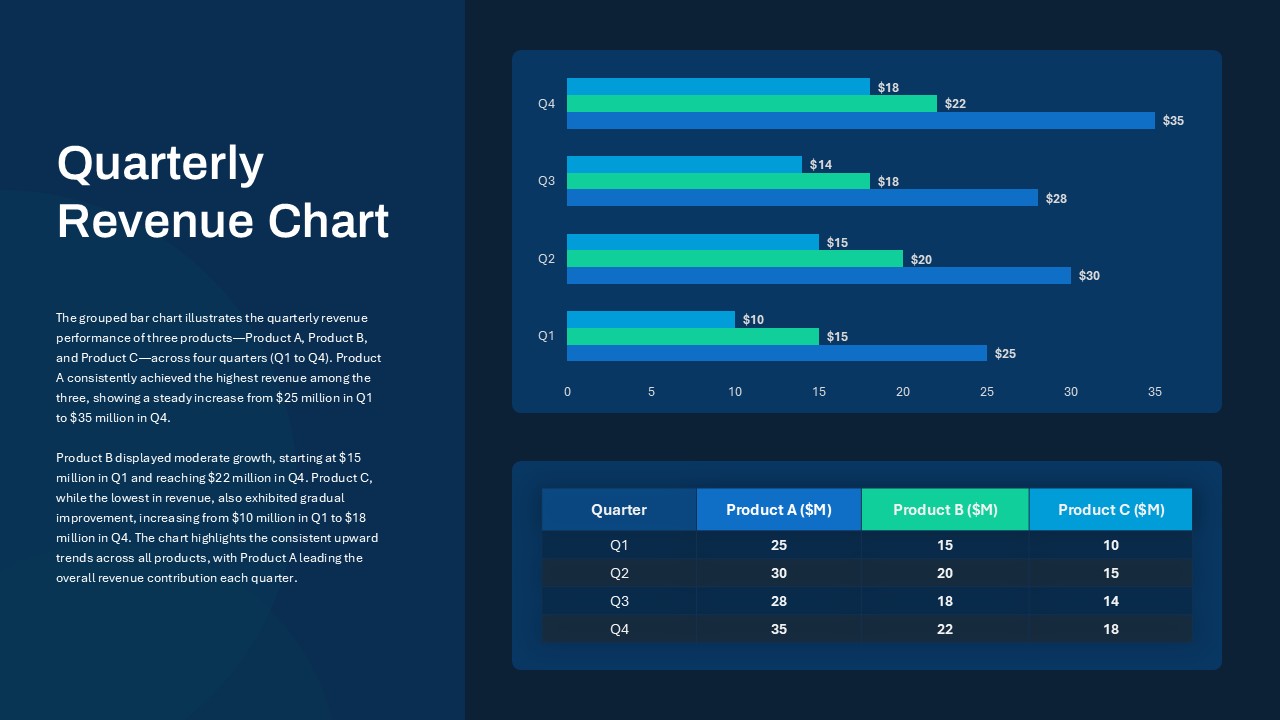
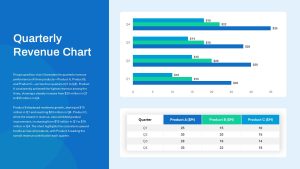
Leverage this dynamic grouped bar chart slide to present quarterly revenue performance for Product A, B, and C across four fiscal periods (Q1 to Q4). The chart features horizontally oriented bars in distinct hues—dark blue for Product A, teal for Product B, and cyan for Product C—enabling clear visual comparisons of revenue growth trajectories. Accompanied by a concise data table below, stakeholders can quickly scan numerical values while benefiting from the slide’s clean layout and consistent typography.
Designed for maximum usability, this template incorporates editable chart elements, master slide integration, and customizable color palettes. Swap in your own product names, adjust data values, and restyle fonts or backgrounds in seconds. Whether you’re preparing a quarterly business review, financial report, or executive briefing, this slide streamlines your workflow and ensures brand consistency across presentations.
Optimized for both PowerPoint and Google Slides, the slide maintains full-resolution clarity across platforms and devices, eliminating formatting hiccups and version-control issues. Its balanced composition—juxtaposing a bold title panel with a chart-and-table layout—ensures your audience remains focused on key performance indicators and revenue trends. Subtle drop shadows and modern flat design elements deliver a professional aesthetic that adapts effortlessly to corporate or startup branding.
Who is it for
This revenue chart slide is ideal for finance teams, business analysts, and product managers tasked with demonstrating sales performance and growth trends. Executives and board members will appreciate the clear visual articulation of quarterly results, while consultants and sales directors can leverage the format to showcase client performance metrics.
Other Uses
Beyond product revenue analysis, repurpose this template for budget tracking, expense comparisons, market share evaluations, or resource allocation reviews. The grouped bar chart layout also works effectively for academic research presentations, startup pitch decks, and investor updates requiring precise data visualization.
Login to download this file

Item ID
SB04314
Related Templates

Entertainment Industry Revenue Bar Chart Template for PowerPoint & Google Slides
Bar/Column
Monthly Recurring Revenue KPI Bar Chart Template for PowerPoint & Google Slides
Bar/Column
Quarterly Sales Review Bar Chart Template for PowerPoint & Google Slides
Bar/Column
Quarterly Comparison Pie Chart Template for PowerPoint & Google Slides
Pie/Donut
Comparison Bar Chart template for PowerPoint & Google Slides
Comparison Chart
Interactive Product Comparison Bar Chart Template for PowerPoint & Google Slides
Bar/Column
Clustered Bar Chart Comparison Template for PowerPoint & Google Slides
Bar/Column
Business Timeline Comparison Bar Chart Template for PowerPoint & Google Slides
Comparison Chart
Mirror Bar Chart Comparison Template for PowerPoint & Google Slides
Bar/Column
Dynamic Bar-of-Pie Chart Comparison Template for PowerPoint & Google Slides
Pie/Donut
Two-Option Bar Chart Comparison Table Template for PowerPoint & Google Slides
Comparison
Regional Revenue Comparison Overview Template for PowerPoint & Google Slides
Comparison

Application Revenue Line Chart KPI Template for PowerPoint & Google Slides
Revenue

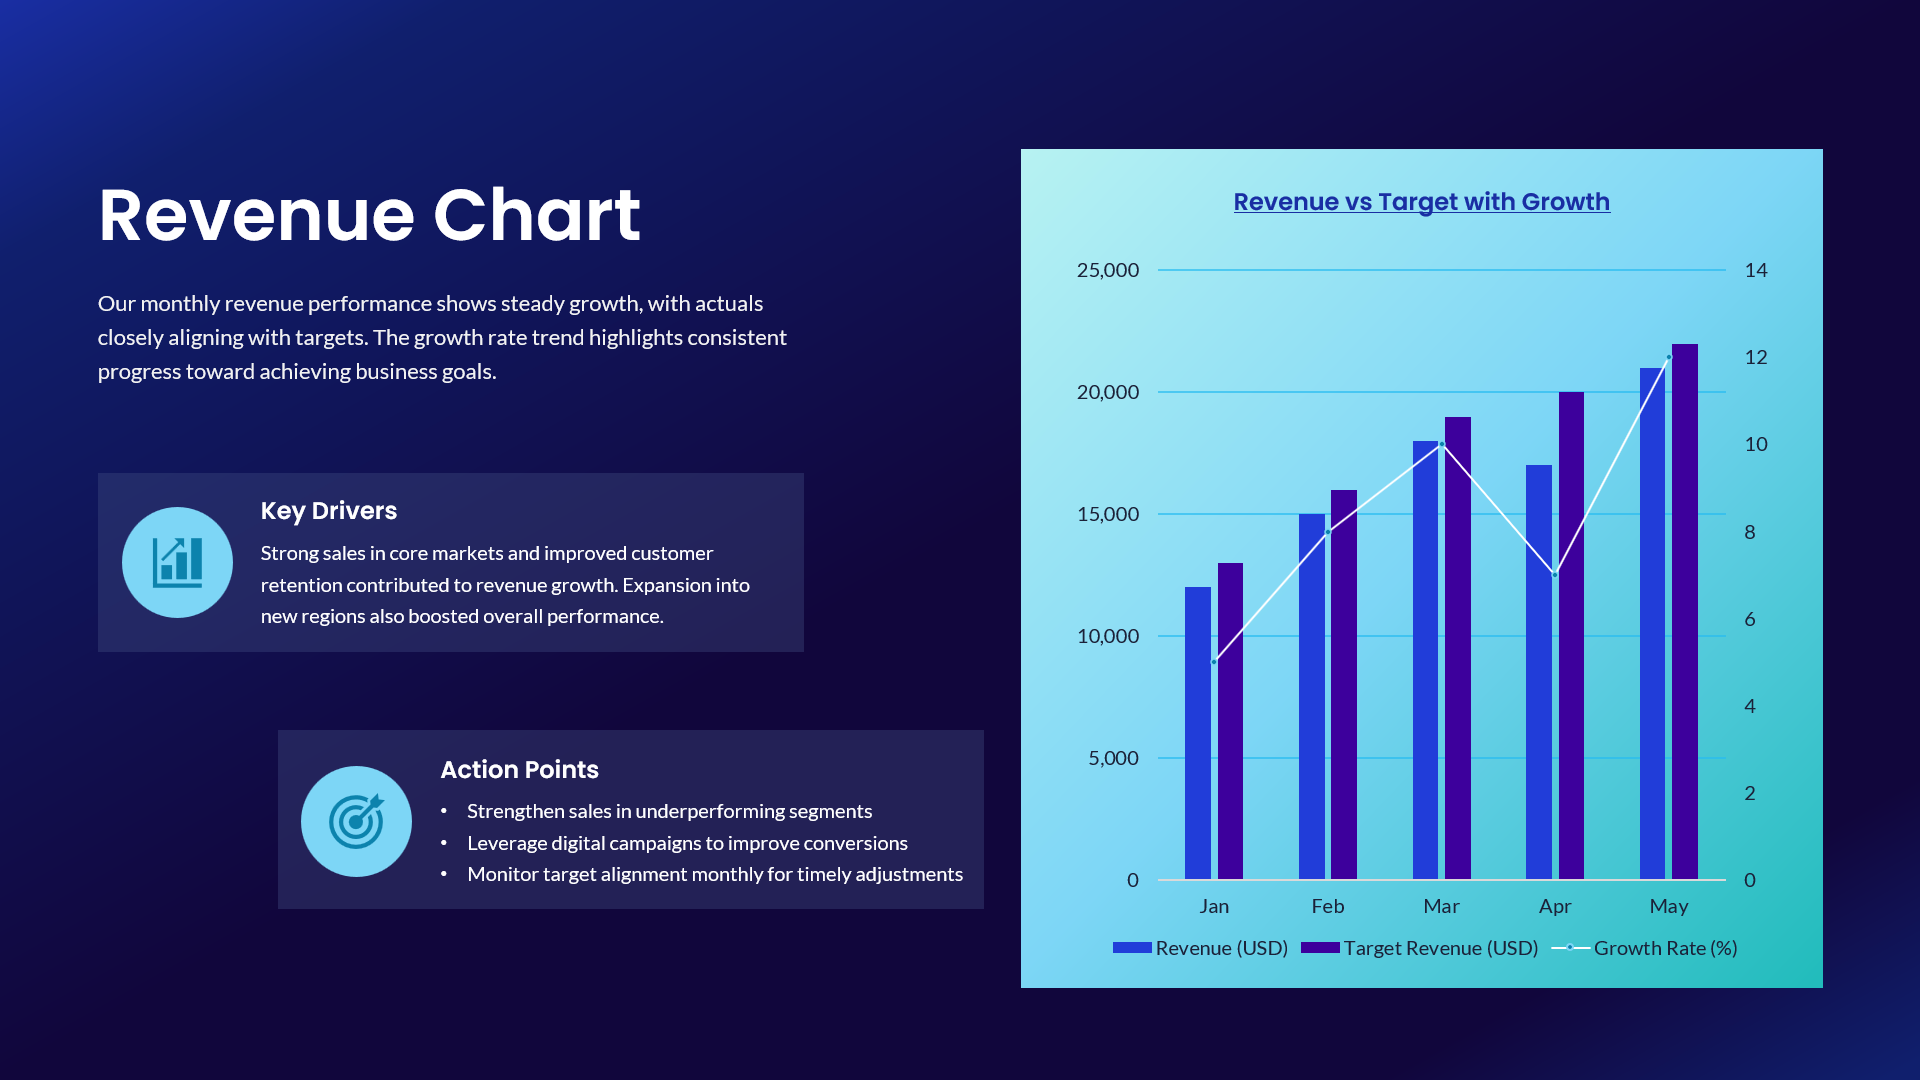
Revenue vs Target Growth Chart Template for PowerPoint & Google Slides
Revenue
Quarterly Credit Loss Provisions Chart Template for PowerPoint & Google Slides
Bar/Column
Quarterly Gross Profit Rate Chart Template for PowerPoint & Google Slides
Revenue
Quarterly Gantt Chart with Today Marker Template for PowerPoint & Google Slides
Gantt Chart
Bar Chart Sample template for PowerPoint & Google Slides
Bar/Column
Creative Data Analysis Bar Chart template for PowerPoint & Google Slides
Bar/Column
3D Bar Chart Data Infographics Template for PowerPoint & Google Slides
Bar/Column
Creative Bar Chart template for PowerPoint & Google Slides
Charts
Three-Year Bar Chart template for PowerPoint & Google Slides
Charts
3D Cylinder Bar Chart Template for PowerPoint & Google Slides
Bar/Column
Pencil Bar Chart Data Analysis Template for PowerPoint & Google Slides
Bar/Column

Monthly Reports Bar Chart template for PowerPoint & Google Slides
Bar/Column

Colorful Radial Bar Chart Template for PowerPoint & Google Slides
Bar/Column
For and Against Vote Count Bar Chart Template for PowerPoint & Google Slides
Bar/Column
Distracting Factors at Work Bar Chart Template for PowerPoint & Google Slides
Bar/Column
Statistics Infographic & KPI Bar Chart Template for PowerPoint & Google Slides
Bar/Column
Multi-Series Stacked Bar Chart Template for PowerPoint & Google Slides
Bar/Column
Combination Bar and Line Chart Template for PowerPoint & Google Slides
Bar/Column
Animated Clustered Bar Chart Template for PowerPoint & Google Slides
Bar/Column
Animated Stacked Bar Chart Template for PowerPoint & Google Slides
Bar/Column
Simple Bar Chart Data Visualization Template for PowerPoint & Google Slides
Bar/Column
Waterfall Bar Chart Analysis Template for PowerPoint & Google Slides
Bar/Column
Year-over-Year Stacked Gender Bar Chart Template for PowerPoint & Google Slides
Bar/Column
Expanding Margins Analysis Bar Chart Template for PowerPoint & Google Slides
Charts
Data Analysis Bar Chart with Insights Template for PowerPoint & Google Slides
Bar/Column
Free
Horizontal Bar Chart Slide with Icons Template for PowerPoint & Google Slides
Bar/Column
Bar Gantt Chart Template for PowerPoint & Google Slides
Gantt Chart
USA Map with Bar Chart Template for PowerPoint & Google Slides
World Maps
Sales Bar Chart for PowerPoint & Google Slides
Bar/Column
Bar Data Chart Slide for PowerPoint & Google Slides
Bar/Column

Radial Bar Chart Diagram for PowerPoint & Google Slides
Bar/Column
Stacked Bar Chart for PowerPoint & Google Slides
Bar/Column
100% Stacked Bar Chart for PowerPoint & Google Slides
Bar/Column
4 Step Revenue Growth Flow Diagram Template for PowerPoint & Google Slides
Process
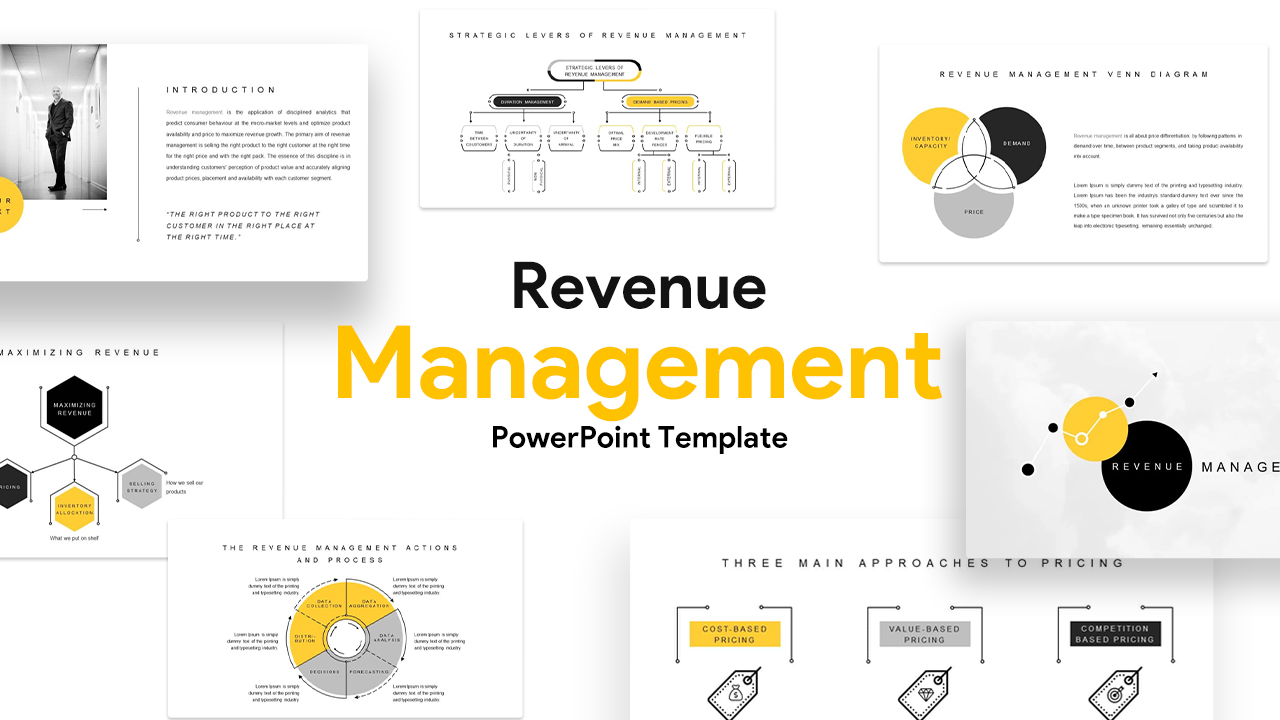
Revenue Management Business Strategy Template for PowerPoint & Google Slides
Revenue
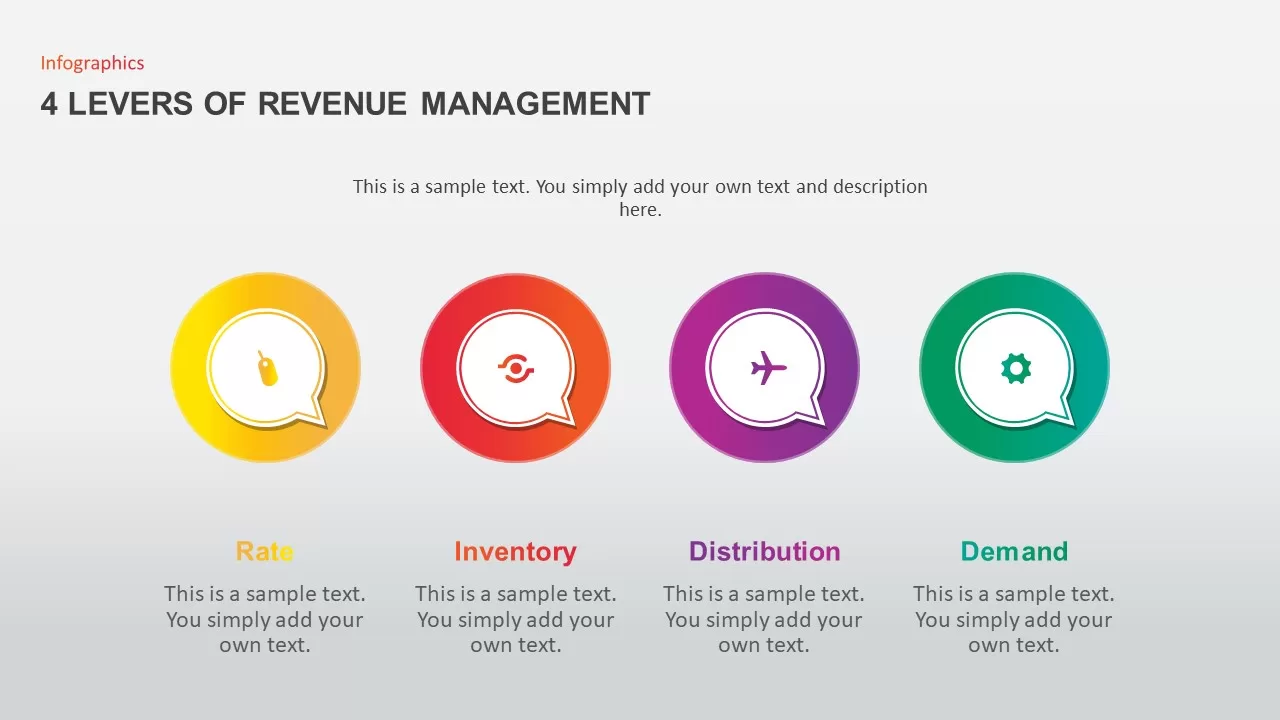
4 Levers of Revenue Management Infographic Template for PowerPoint & Google Slides
Infographics
Annual Recurring Revenue Metrics Template for PowerPoint & Google Slides
Bar/Column
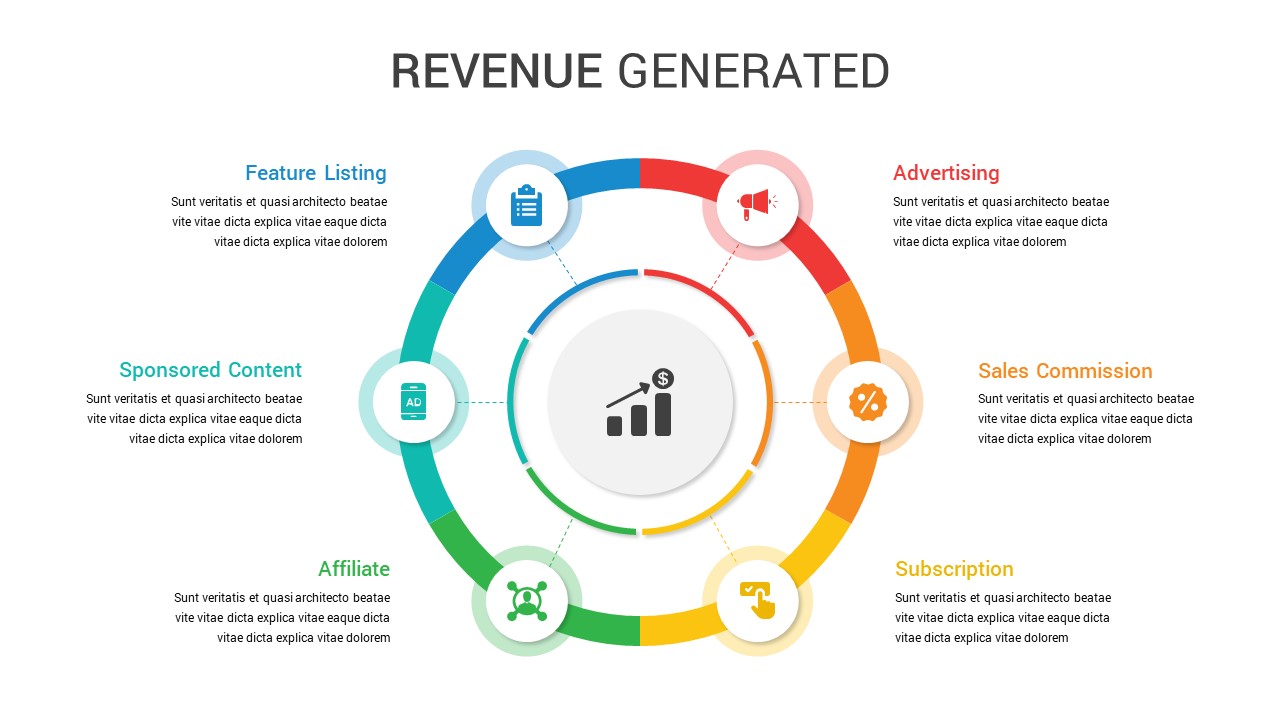
Circular Revenue Generation Diagram Template for PowerPoint & Google Slides
Revenue
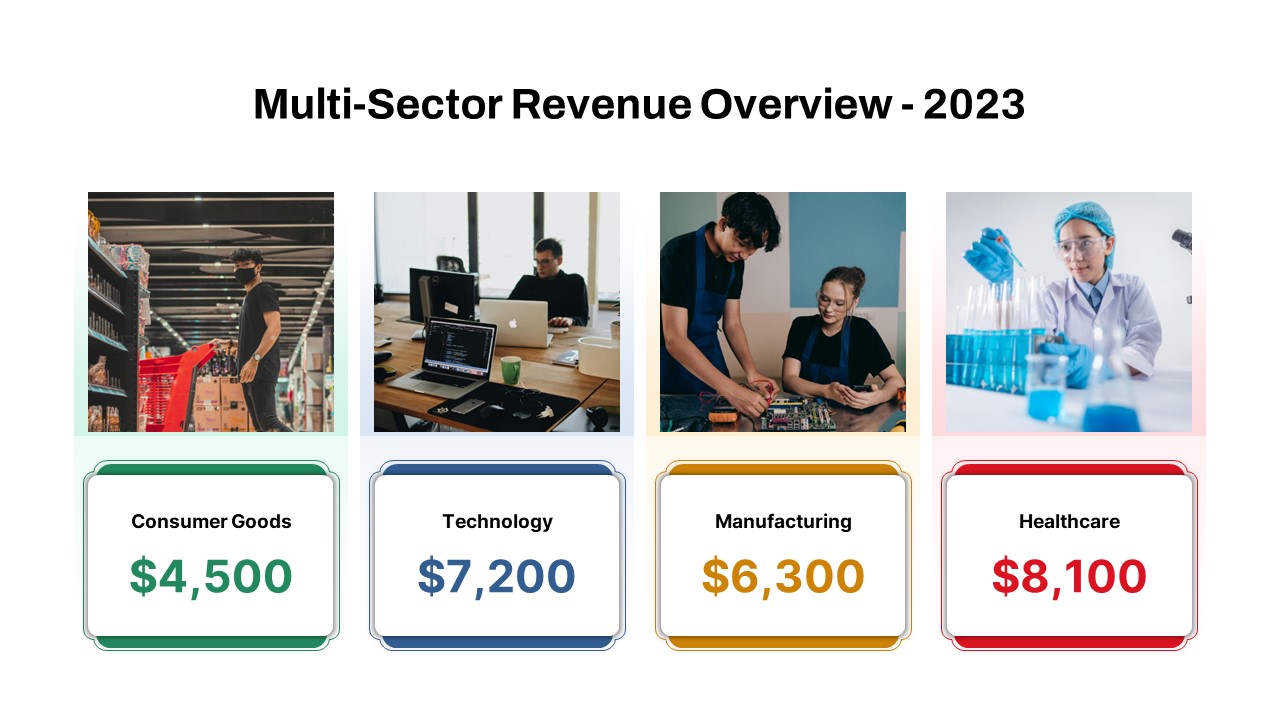
Multi-Sector Revenue Breakdown Cards Template for PowerPoint & Google Slides
Comparison
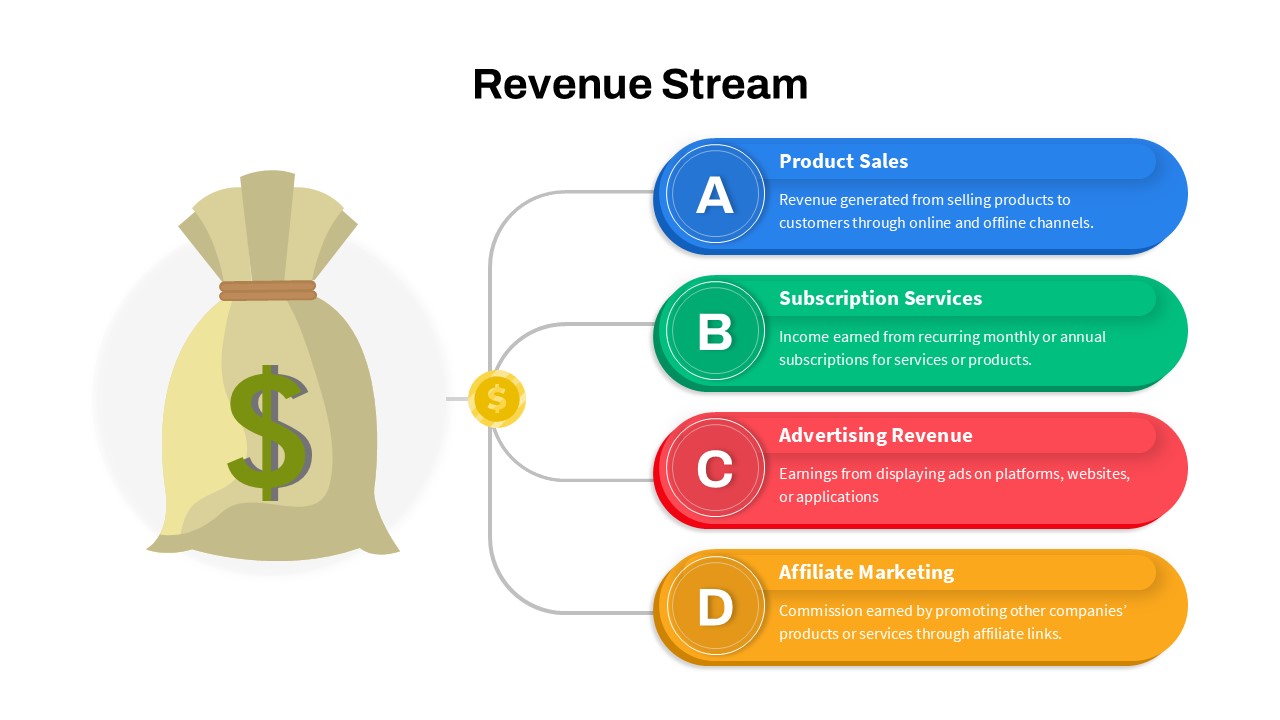
Revenue Streams: Four Channels Diagram Template for PowerPoint & Google Slides
Business Models
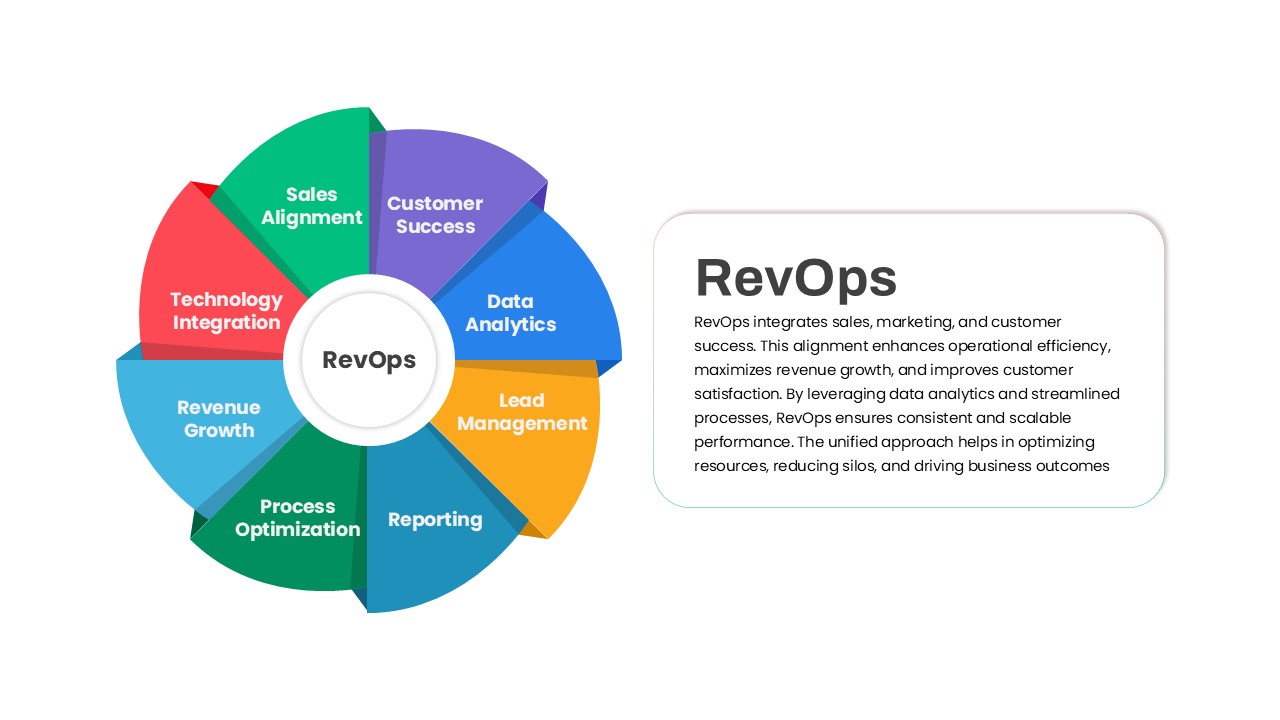
RevOps Revenue Operations Diagram Template for PowerPoint & Google Slides
Revenue
Six Revenue Stream Model Infographic Template for PowerPoint & Google Slides
Circular
Quarterly Sales template for PowerPoint & Google Slides
Bar/Column
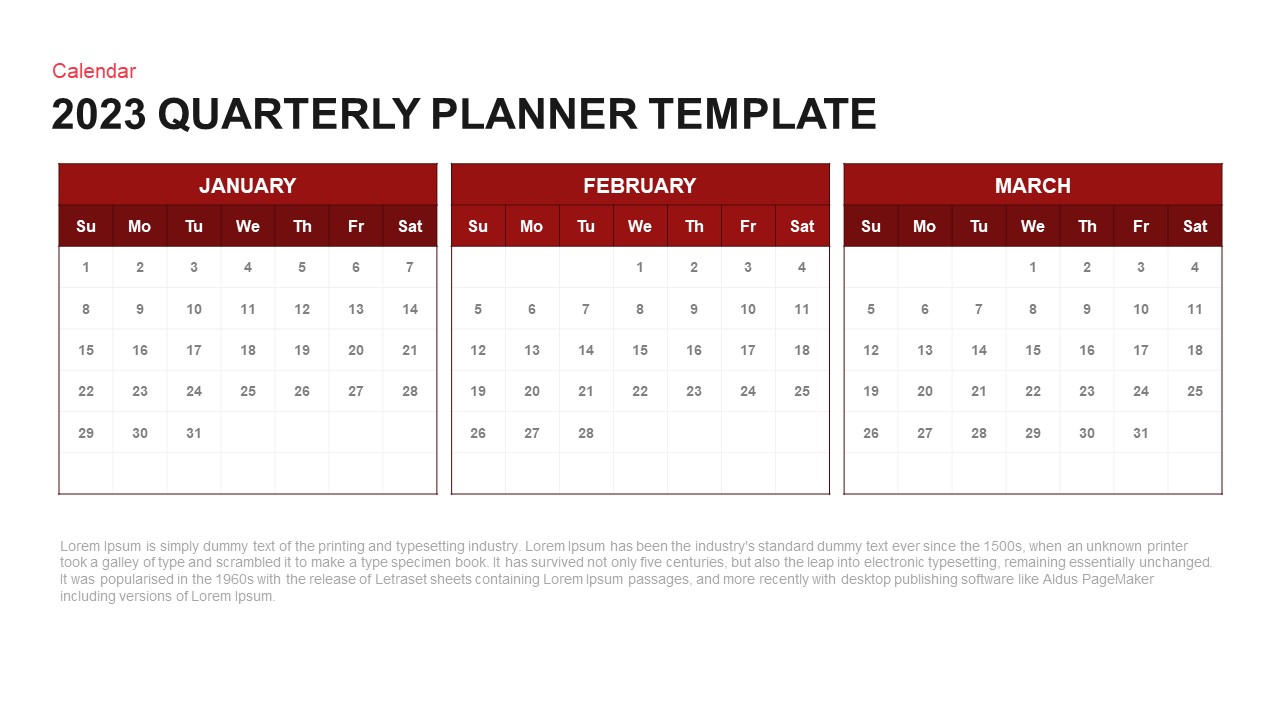
Quarterly Planner Calendar Layout Template for PowerPoint & Google Slides
Project
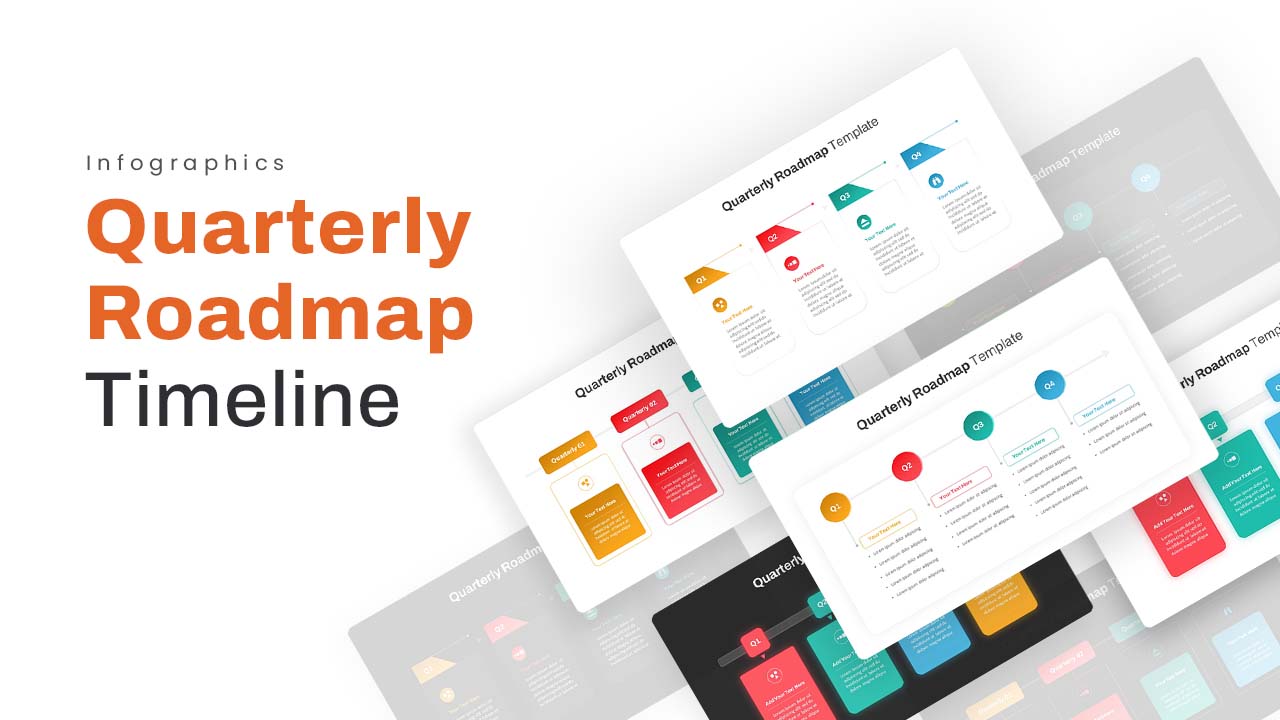
Quarterly Roadmap Timeline Infographic Template for PowerPoint & Google Slides
Timeline
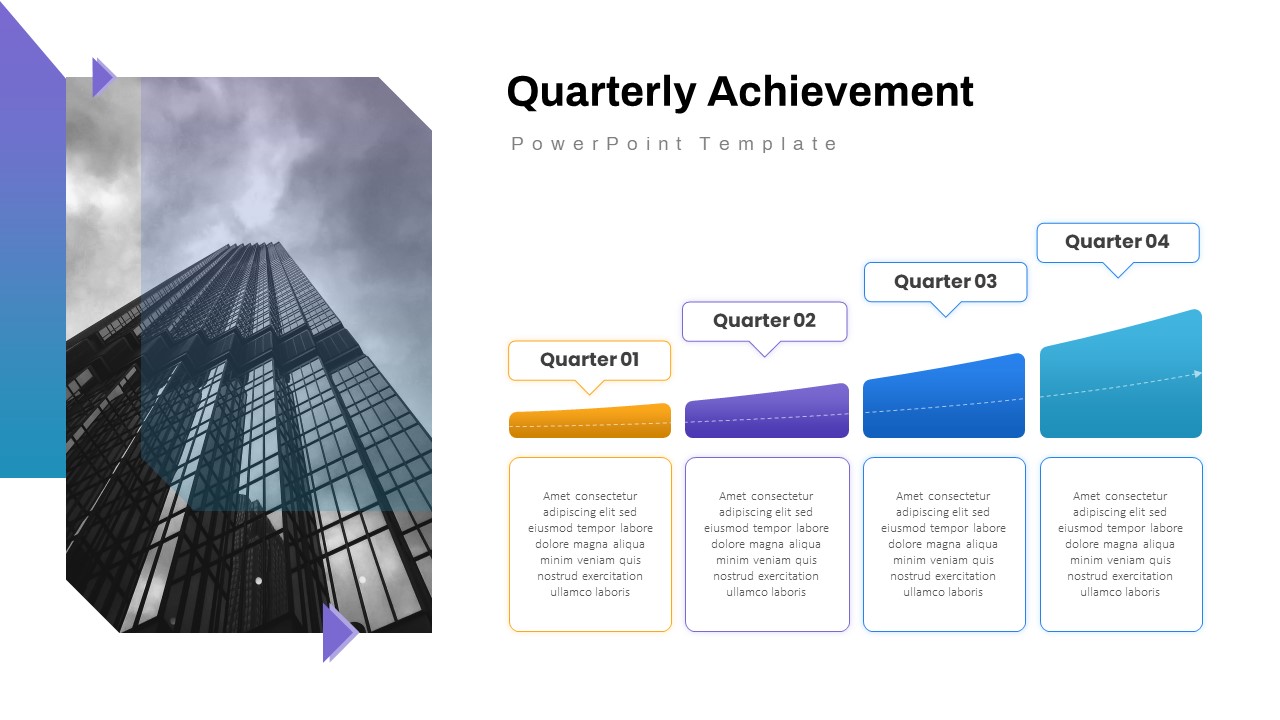
Quarterly Achievement Progress Template for PowerPoint & Google Slides
Accomplishment
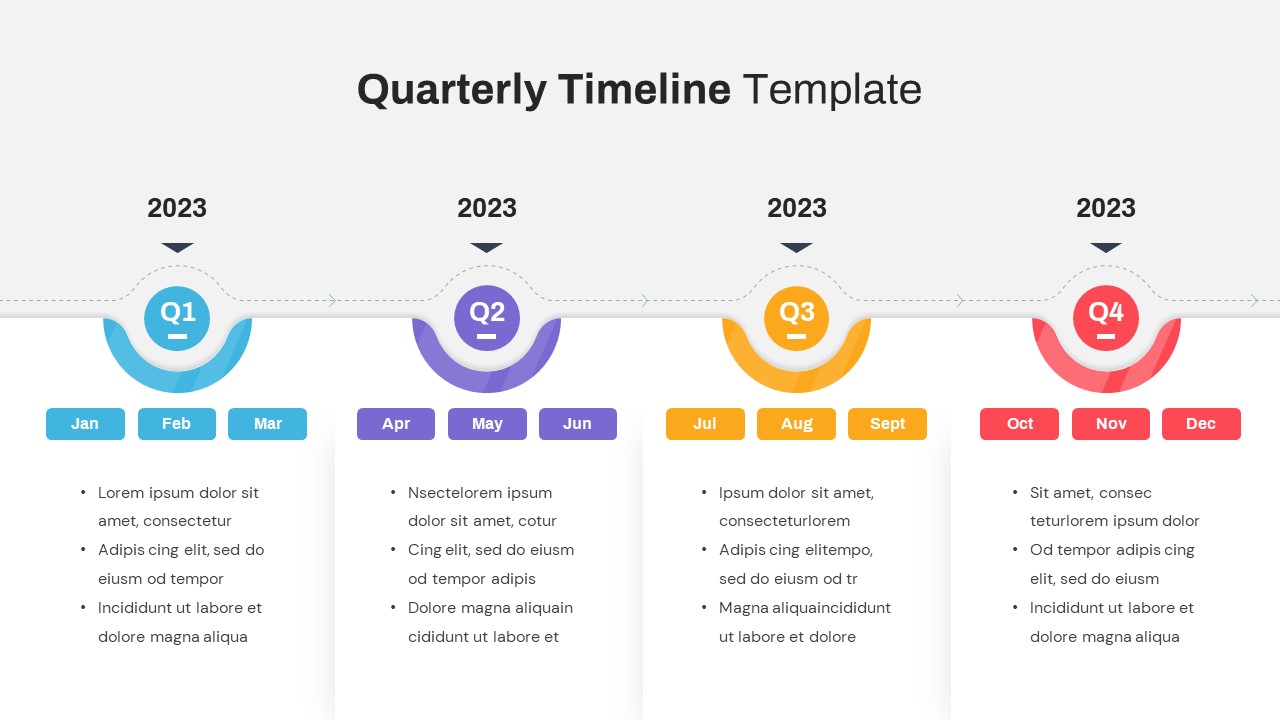
Quarterly Timeline Infographic Template for PowerPoint & Google Slides
Timeline
Free Quarterly Business Review Dashboard Template for PowerPoint & Google Slides
Business
Free
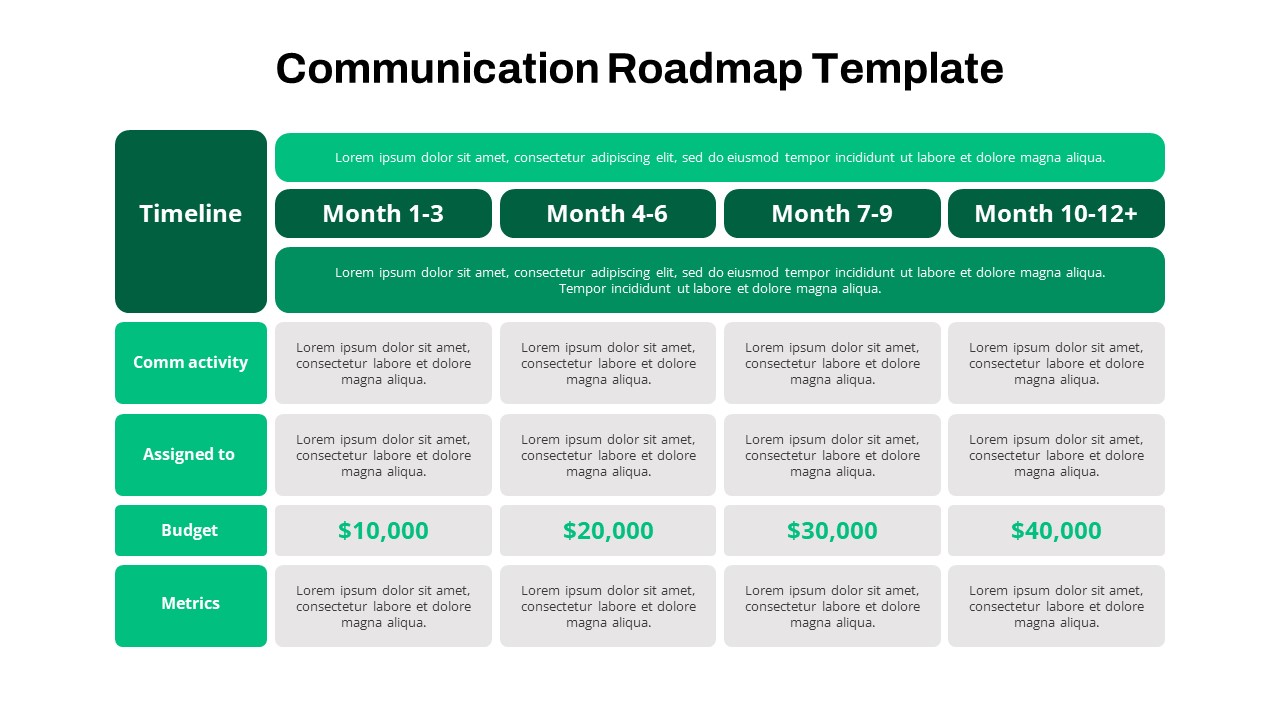
Quarterly Communication Roadmap Grid Template for PowerPoint & Google Slides
Marketing
Quarterly Financial Summary Dashboard Template for PowerPoint & Google Slides
Business Report
Quarterly Network Volume Analysis Template for PowerPoint & Google Slides
Business Report
Quarterly Business Review Dashboard Template for PowerPoint & Google Slides
Pitch Deck

Quarterly Net Interest Income Growth Template for PowerPoint & Google Slides
Bar/Column
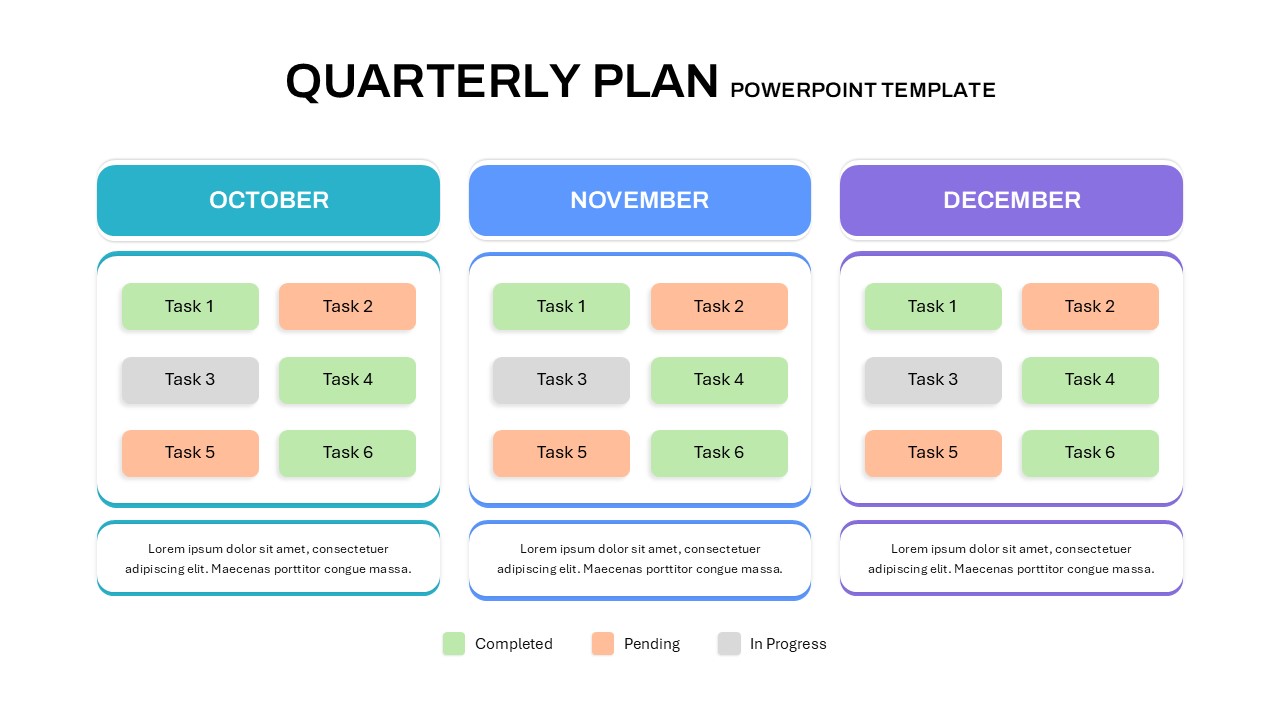
Quarterly Plan Template for PowerPoint & Google Slides
Project Status
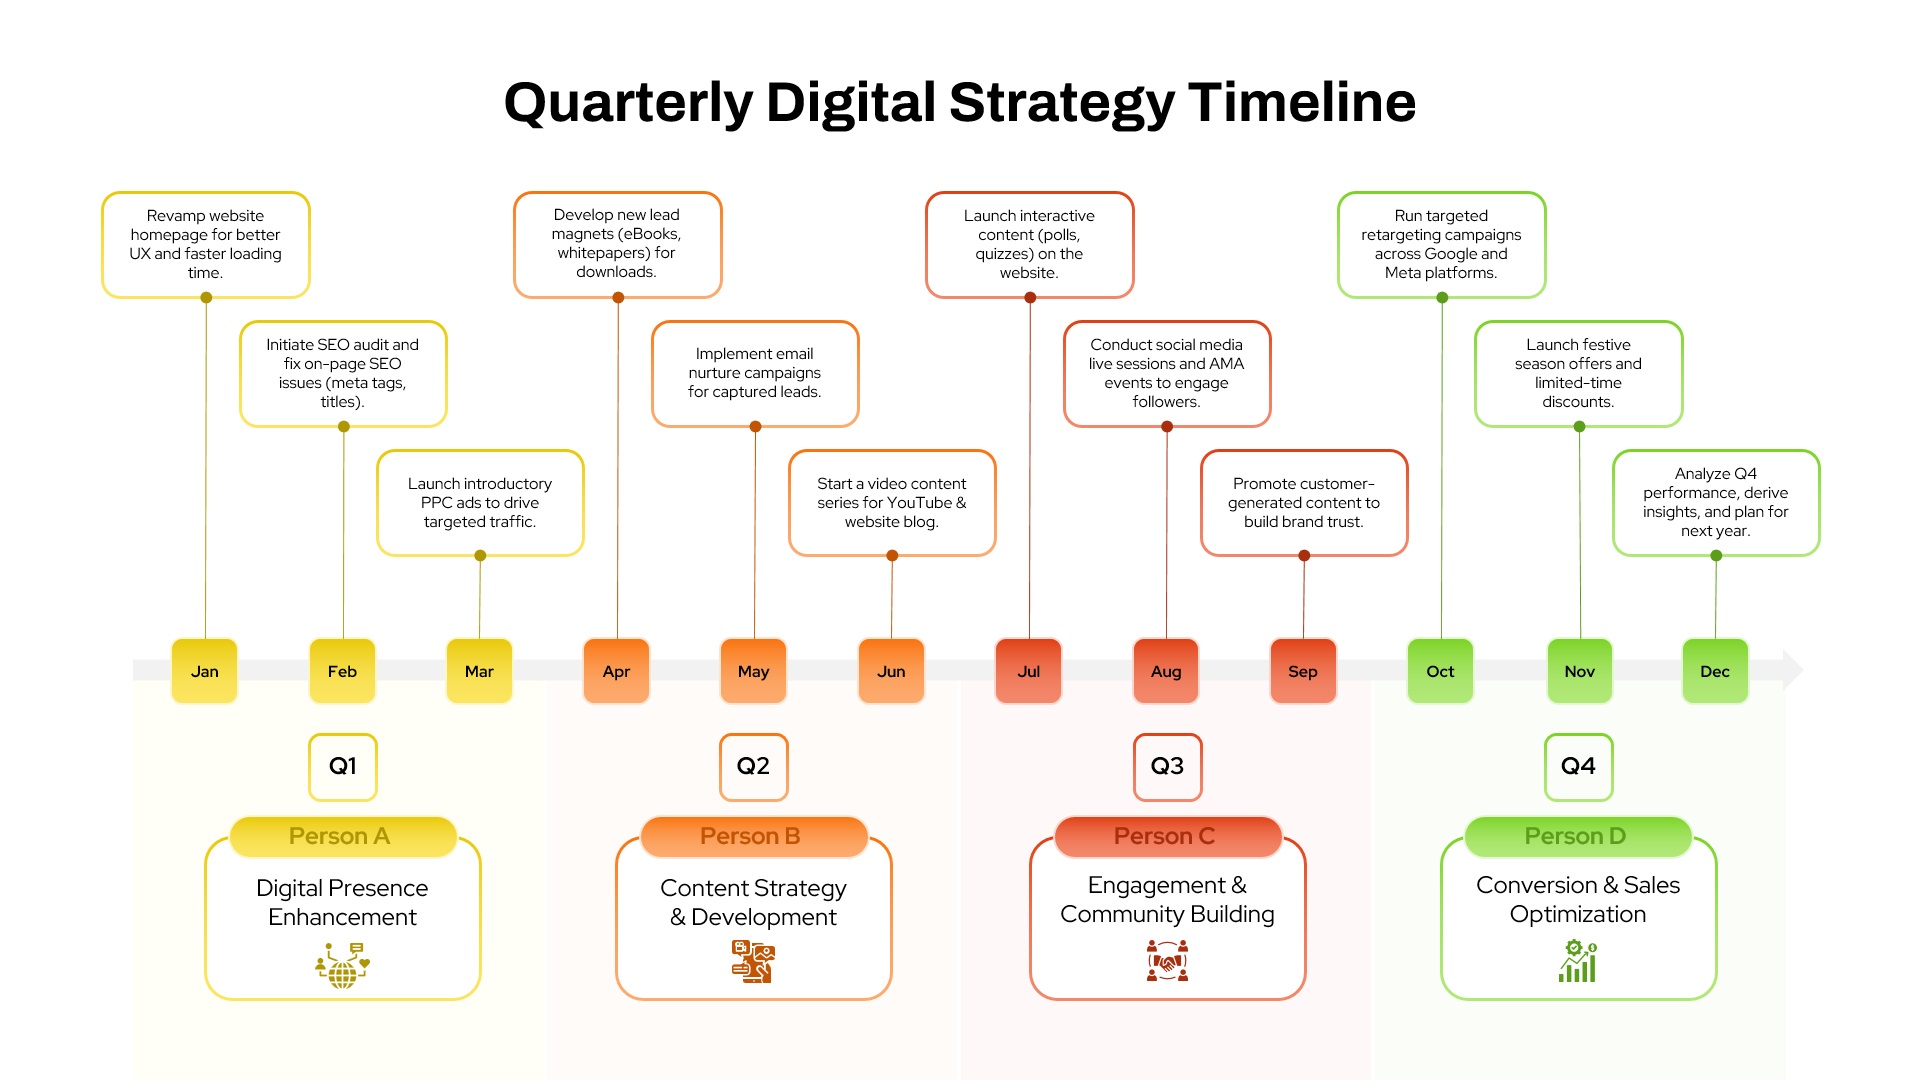
Quarterly Digital Strategy Timeline template for PowerPoint & Google Slides
Digital Marketing
Quarterly Financial Report Dashboard Template for PowerPoint & Google Slides
Finance
3D Cylinder Bar Chart Visualization Template for PowerPoint
Bar/Column
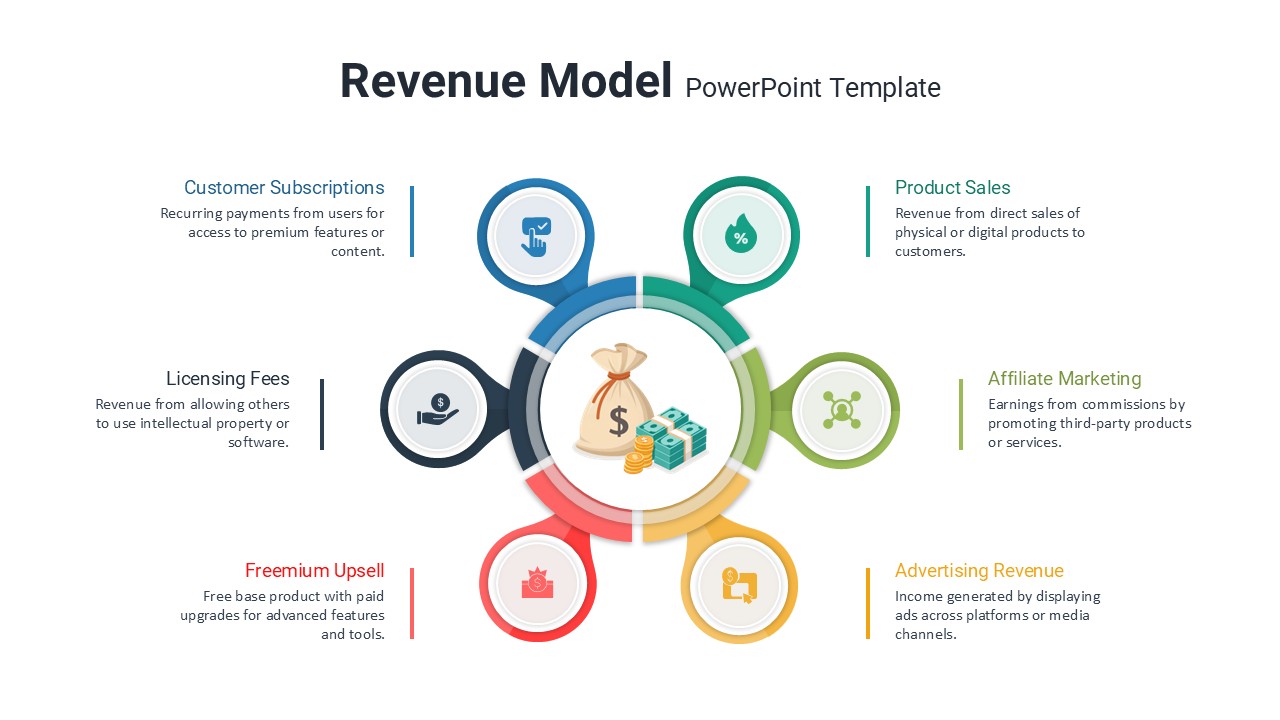
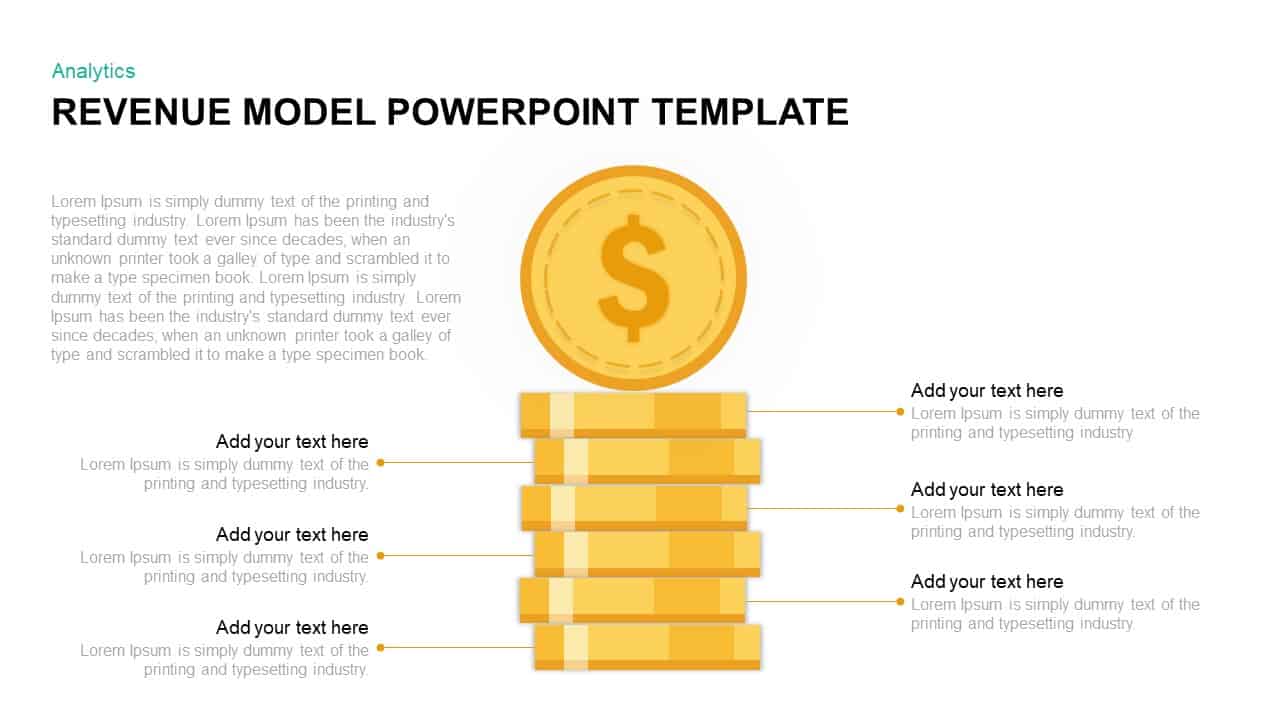
Revenue Model PowerPoint Template
Finance
Four Section Comparison Chart Diagram Template for PowerPoint & Google Slides
Infographics
Comparison Chart Overview template for PowerPoint & Google Slides
Comparison Chart
Tornado Chart Data Comparison Slide Template for PowerPoint & Google Slides
Bar/Column
Radar Chart Product Comparison Template for PowerPoint & Google Slides
Comparison Chart

BMI Category Comparison Chart Template for PowerPoint & Google Slides
Comparison
Circular Product Comparison Chart Template for PowerPoint & Google Slides
Comparison Chart
Pugh Matrix Decision Comparison Chart Template for PowerPoint & Google Slides
Comparison Chart
Dynamic Benchmarking Comparison Chart Template for PowerPoint & Google Slides
Comparison Chart
People Demographic Comparison Chart Template for PowerPoint & Google Slides
Comparison
Grouped Column Chart Comparison Template for PowerPoint & Google Slides
Bar/Column
Multiple Line Chart Comparison Template for PowerPoint & Google Slides
Comparison Chart
Free Versatile Product Comparison Chart Template for PowerPoint & Google Slides
Charts
Free
ESG Initiatives Comparison Chart Template for PowerPoint & Google Slides
Business
Competitor Comparison Chart Design Template for PowerPoint & Google Slides
Comparison
Profile Comparison Chart template for PowerPoint & Google Slides
Comparison Chart
Sales Growth Comparison Chart & Table Template for PowerPoint & Google Slides
Bar/Column
Skills Gap Analysis Comparison Chart Template for PowerPoint & Google Slides
Gap
Feasibility Matrix Comparison Chart Template for PowerPoint & Google Slides
Comparison Chart
Blank Comparison Chart Template for PowerPoint & Google Slides
Comparison Chart
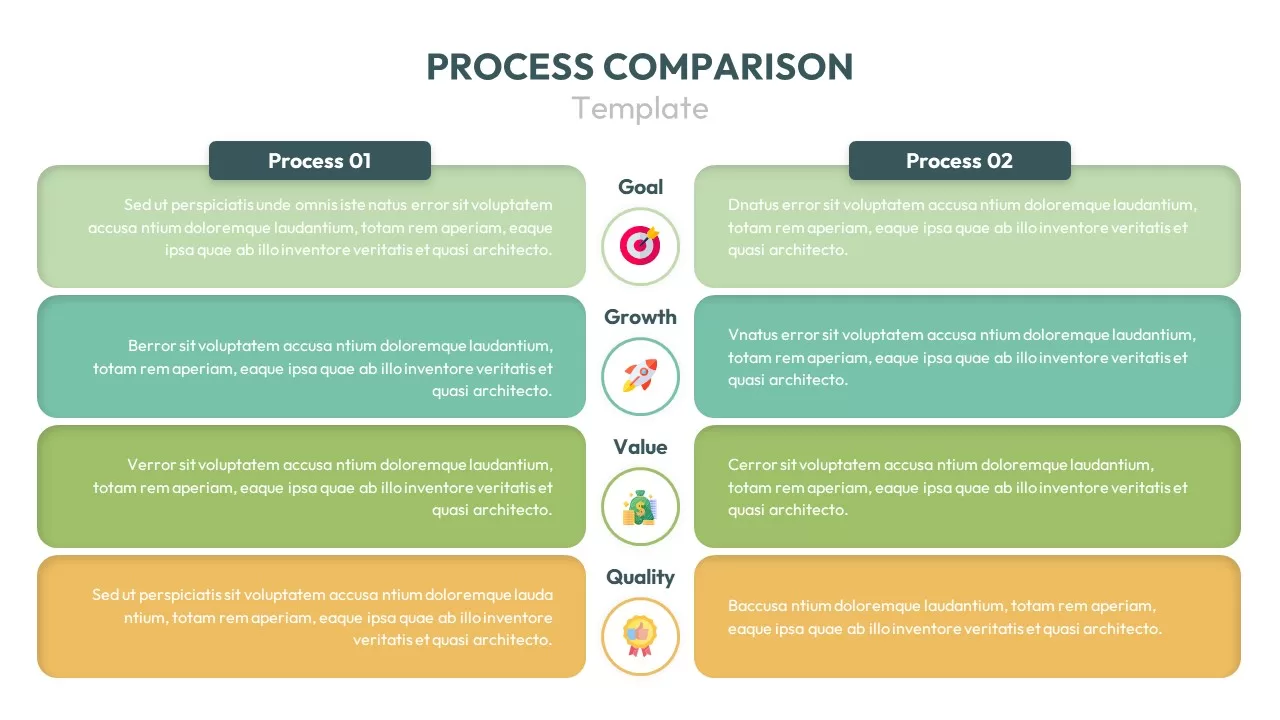
Process Comparison Chart for PowerPoint & Google Slides
Infographics
3D Bar Graph Infographic Template for PowerPoint & Google Slides
Bar/Column
Five-Stage Vertical Bar Process Template for PowerPoint & Google Slides
Process
Timeline Roadmap with Progress Bar Template for PowerPoint & Google Slides
Timeline
Progress Bar and Milestone Visualization Template for PowerPoint & Google Slides
Timeline
Blank Bar Graph Template for PowerPoint & Google Slides
Bar/Column
Progress Bar Graph Layout Design for PowerPoint & Google Slides
Charts
Progress Bar Infographic for PowerPoint & Google Slides
Business
Progress Bar infographic pack for PowerPoint & Google Slides
Business
Five Options Business Bar Graph for PowerPoint & Google Slides
Business Report