Population Pyramid Chart PowerPoint Template

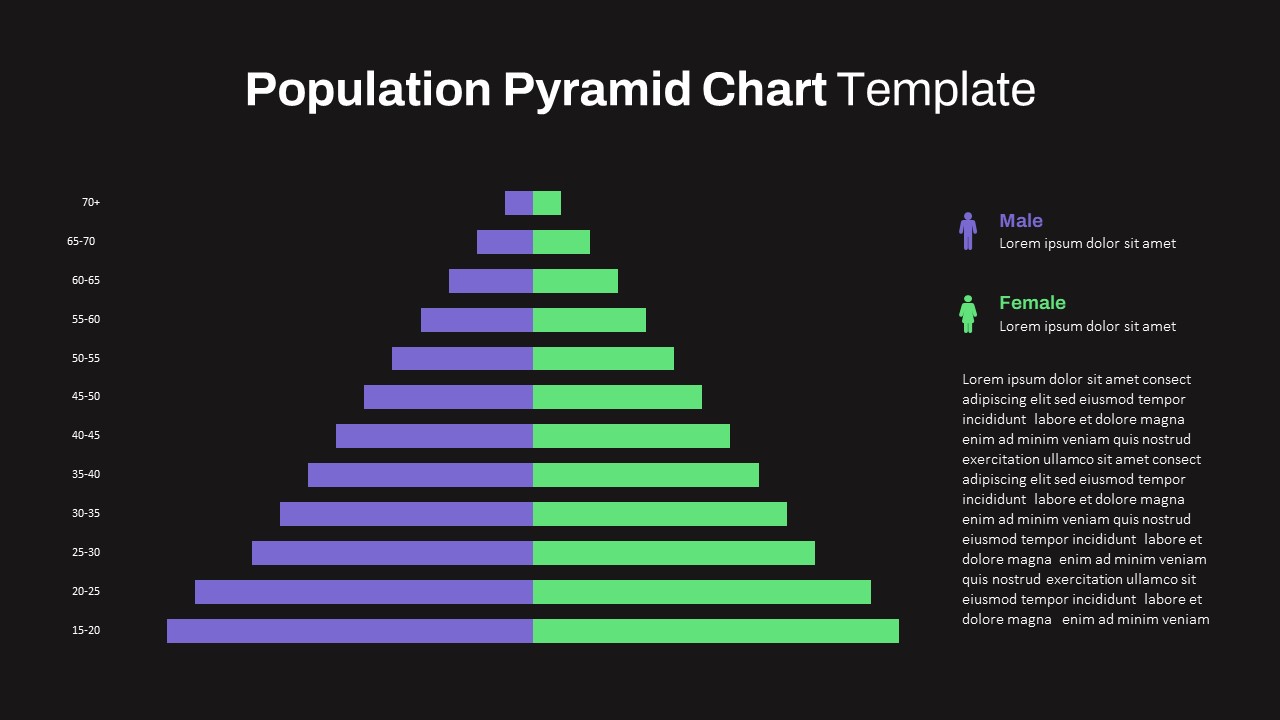
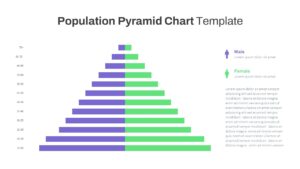
Editable Population Chart PowerPoint
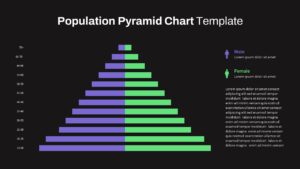
The population pyramid chart PowerPoint Template is an effective tool to emphasize the critical variables of age and gender, allowing audiences to glean valuable insights into the demographic makeup of the country. Employing this chart simplifies the process of comprehending and analysing population age and gender distribution, making it engaging and informative.
What is a population pyramid chart?
A population pyramid chart, often referred to simply as a population pyramid, is a graphical representation that displays the age and gender distribution of a given population. It typically takes the shape of a pyramid, with the horizontal axis representing age groups and the vertical axis representing the percentage or number of individuals in each age group. The chart is divided into two sides, one for males and the other for females, allowing for a clear comparison of gender-specific population trends. Population pyramids are valuable tools for demographers, sociologists, and policymakers as they provide insights into a population’s age structure, birth rates, and potential implications for social and economic planning.
The Population Pyramid Chart for PowerPoint presentations is an exemplary model for visualizing demographic data. It strategically positions the larger section at the bottom of the pyramid, representing the productive and younger population, while the upper segments, which are relatively smaller, depict the dependent population. This deliberate arrangement not only makes the chart highly effective in conveying population dynamics but also aids in highlighting the demographic balance or imbalances within a given region. It serves as an invaluable tool for educators, researchers, and policymakers seeking to communicate essential insights about a population’s age distribution and its socioeconomic implications.
This population chart template enables you to visualize distribution by age and gender. Social studies and geography can enhance their lessons with this infographic population pyramid. Besides, it allows the identification of consumer demographics for targeted marketing. Policy and planning makers can use it to communicate essential data for nation-building. So educators, students, researchers & demographers, business professionals, Government and NGOs can use the template for different purposes. Use editable population chart PowerPoint.
The population pyramid chart has two background options to depict your data precisely. You can customize the color and text zones if needed. Explore our cutting-edge collection of PowerPoint graphs and charts today!
Login to download this file

Item ID
SB03793
Related Templates

Population Chart PowerPoint Template
PowerPoint Templates
Premium
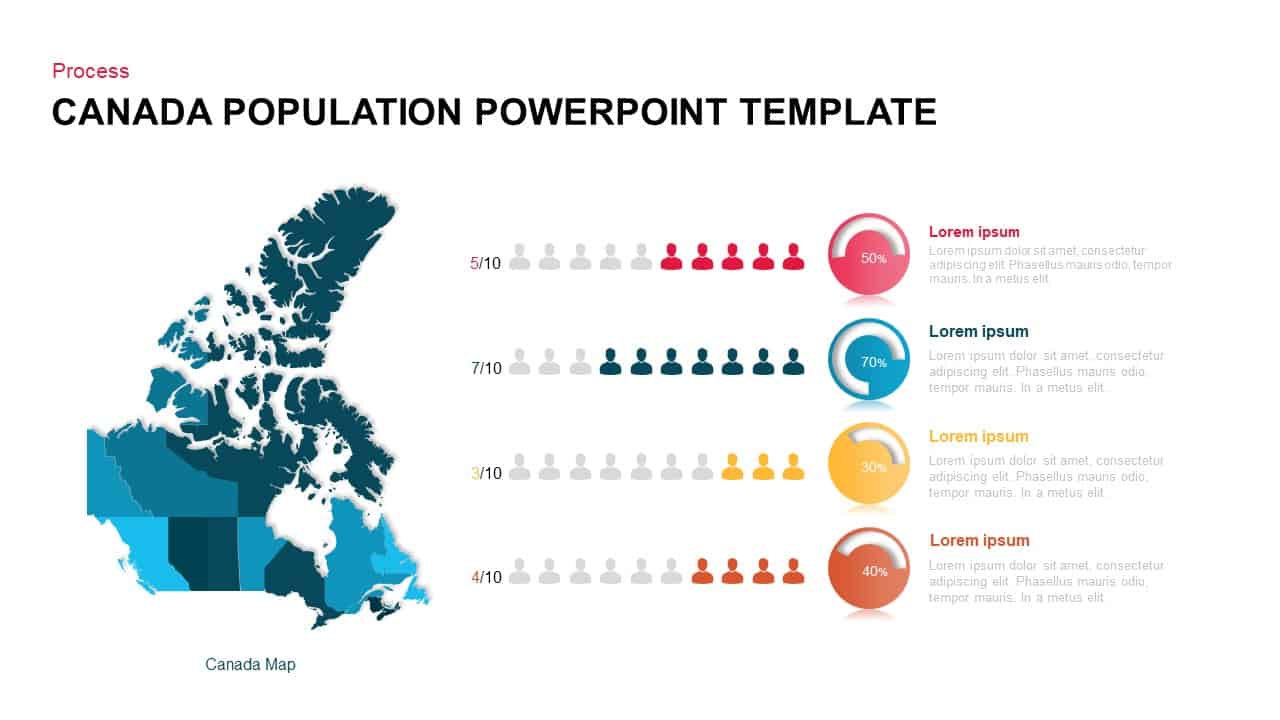
Canada Map & Population Template for PowerPoint and Keynote
Maps
Premium
Population PowerPoint Template
Infographic
Premium
US Map with Population Data PPT Template
Maps
Premium
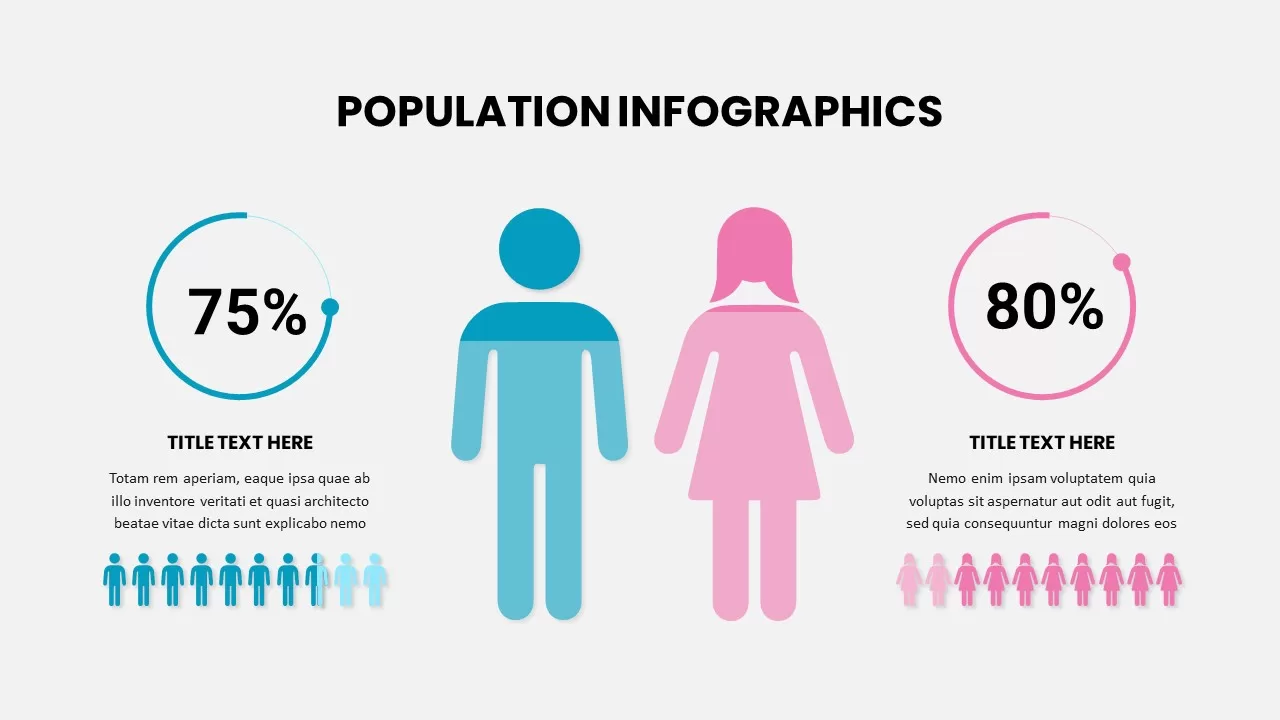
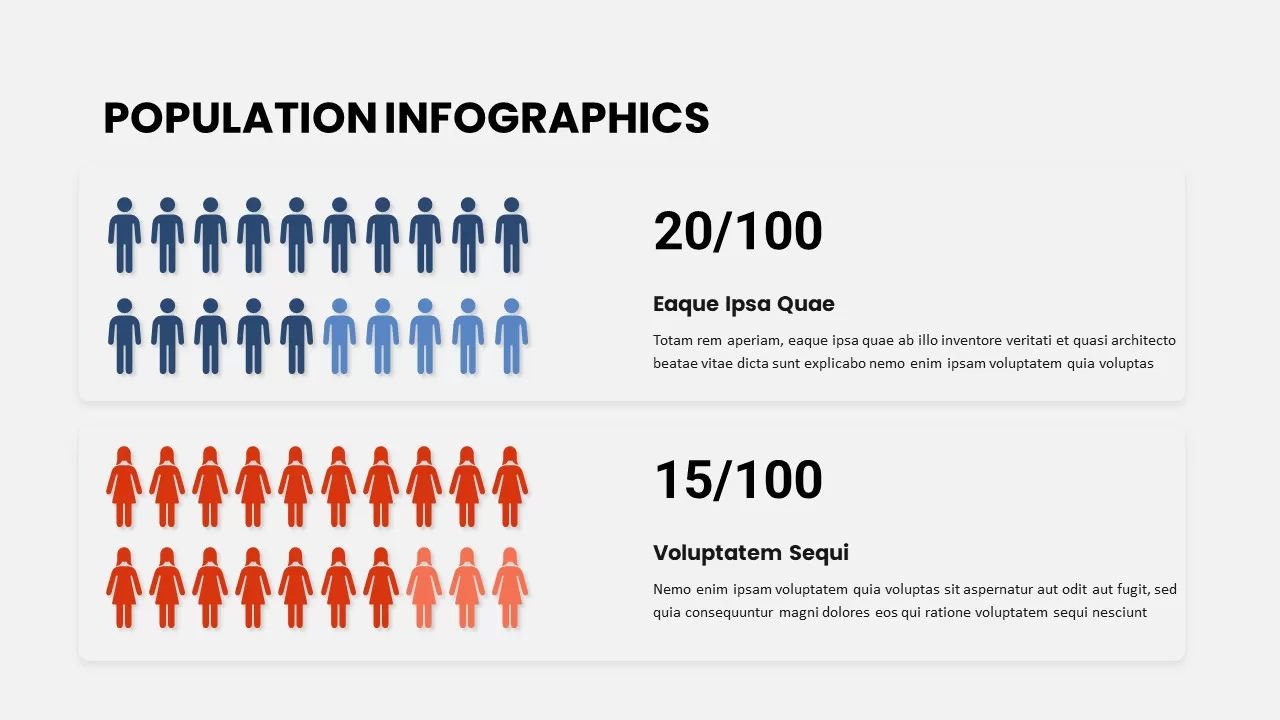
Population Infographics
Mock Up
Premium

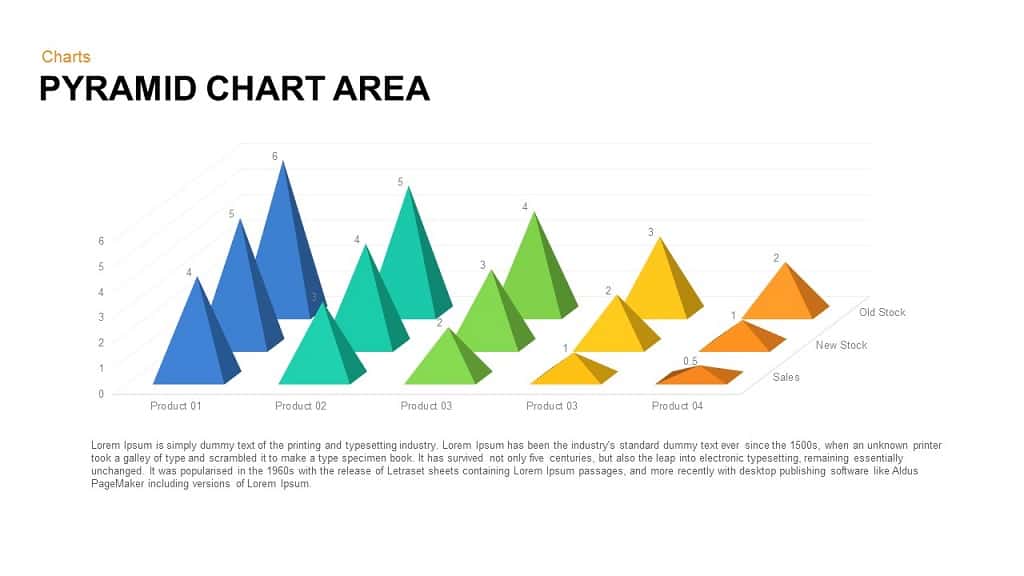
Pyramid Area Chart Template for PowerPoint and Keynote
Column and Bar chart
Premium
Pyramid Chart PowerPoint Template
PowerPoint Templates
Premium
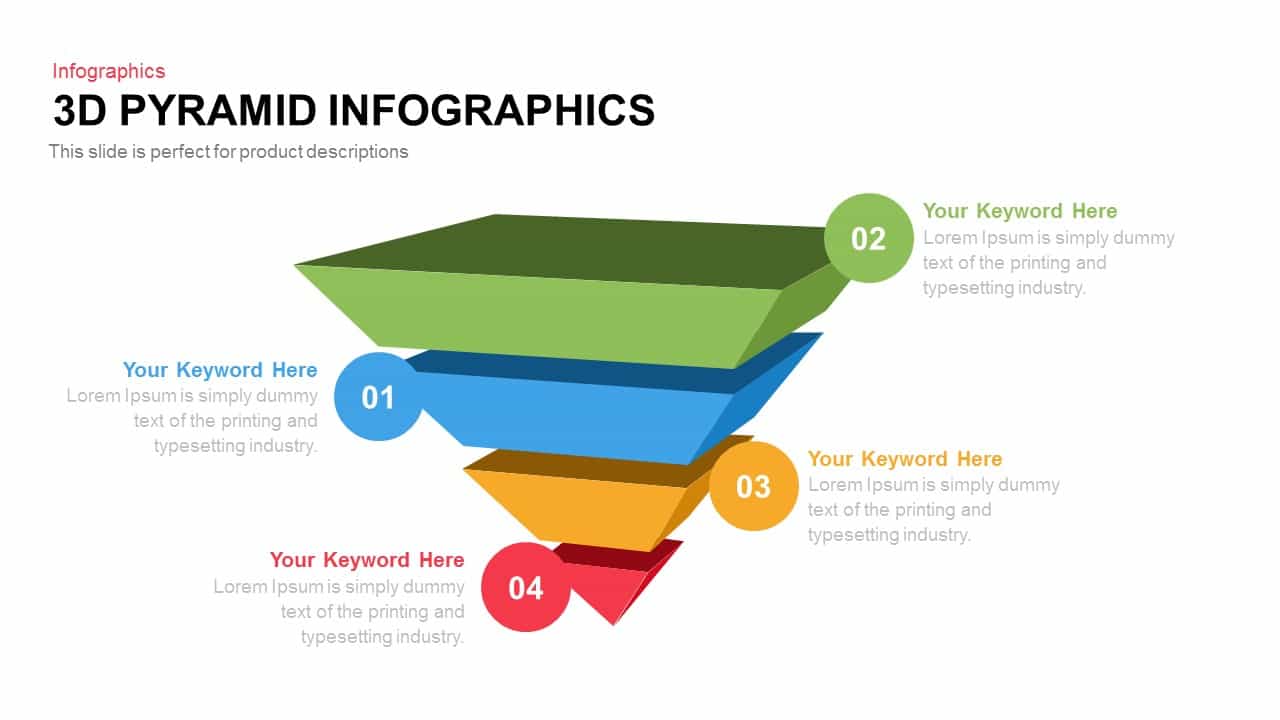
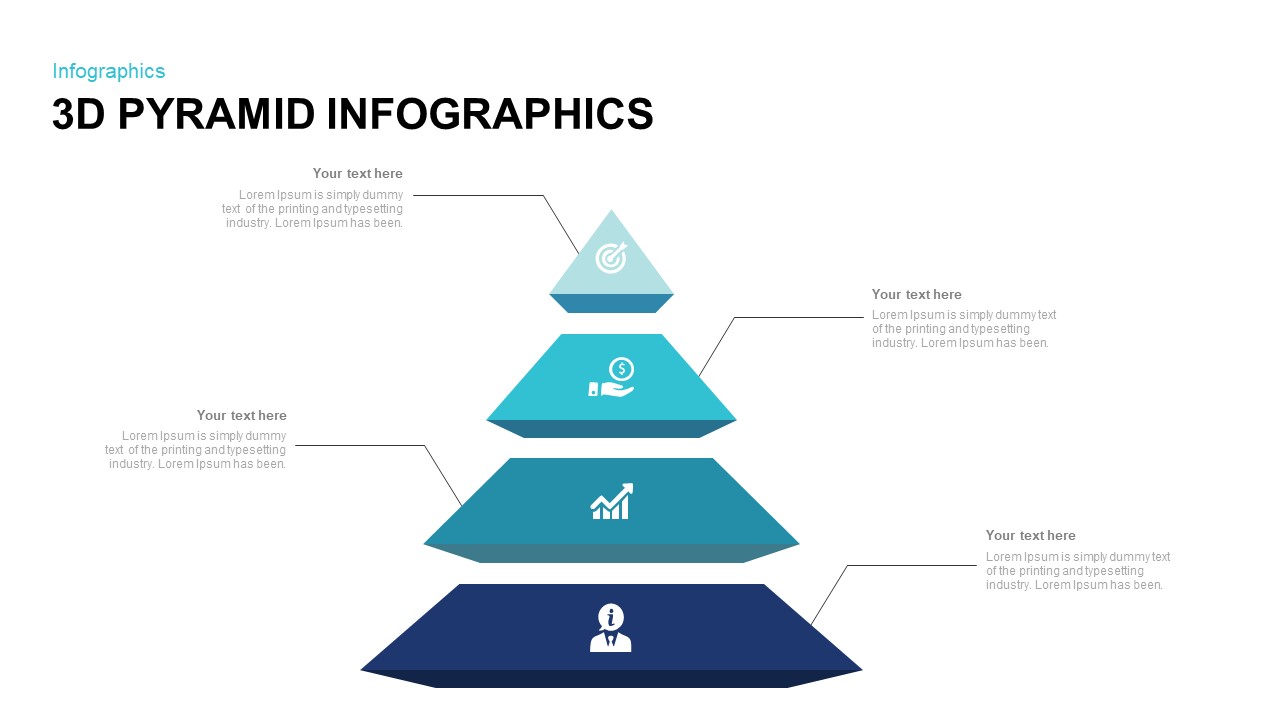
3d Infographics Powerpoint Pyramid Template and Keynote Template
3D Shapes
Premium
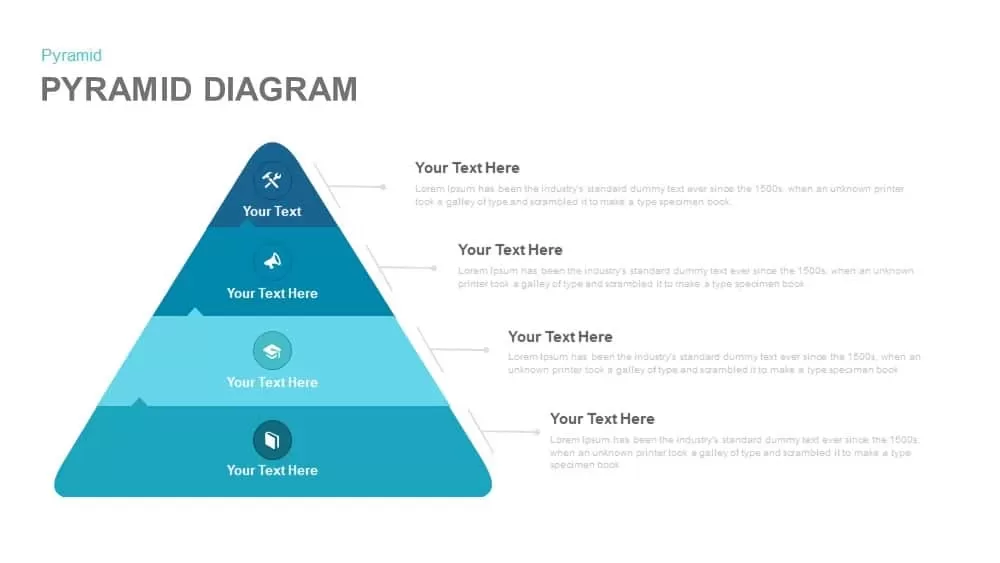
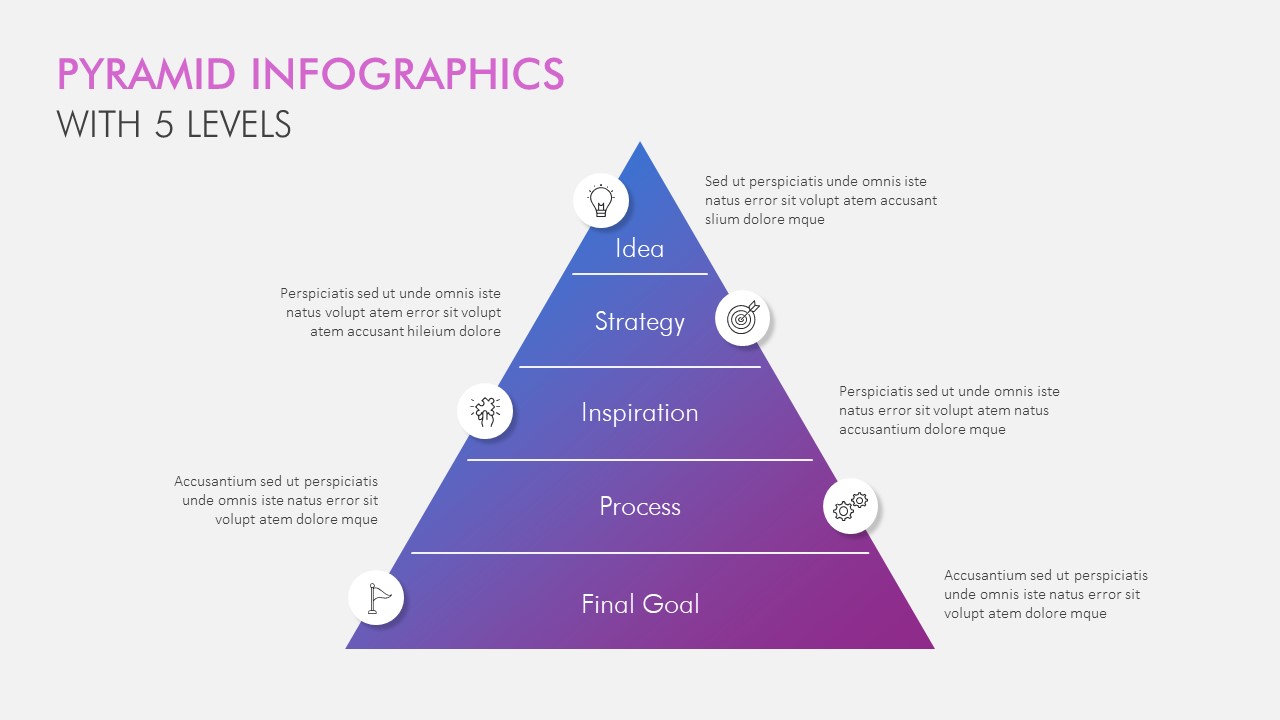
Pyramid Infographic Free PowerPoint and Keynote template
Pyramid
Free
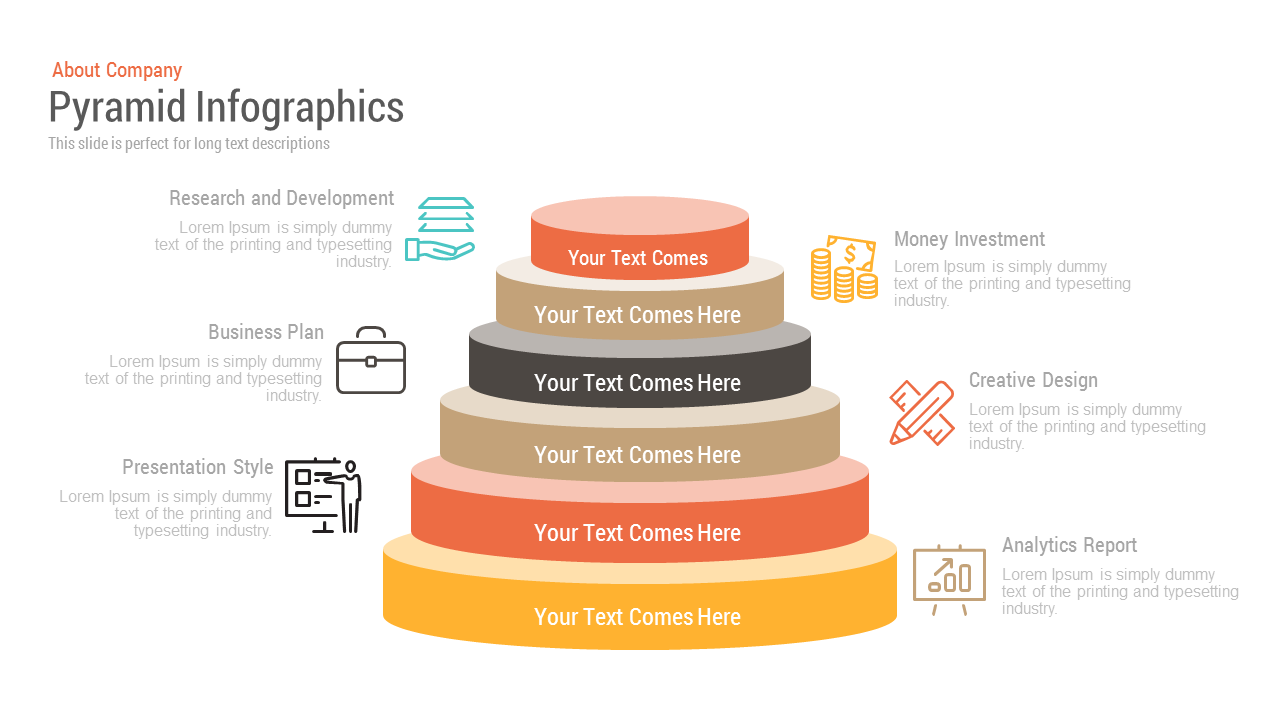
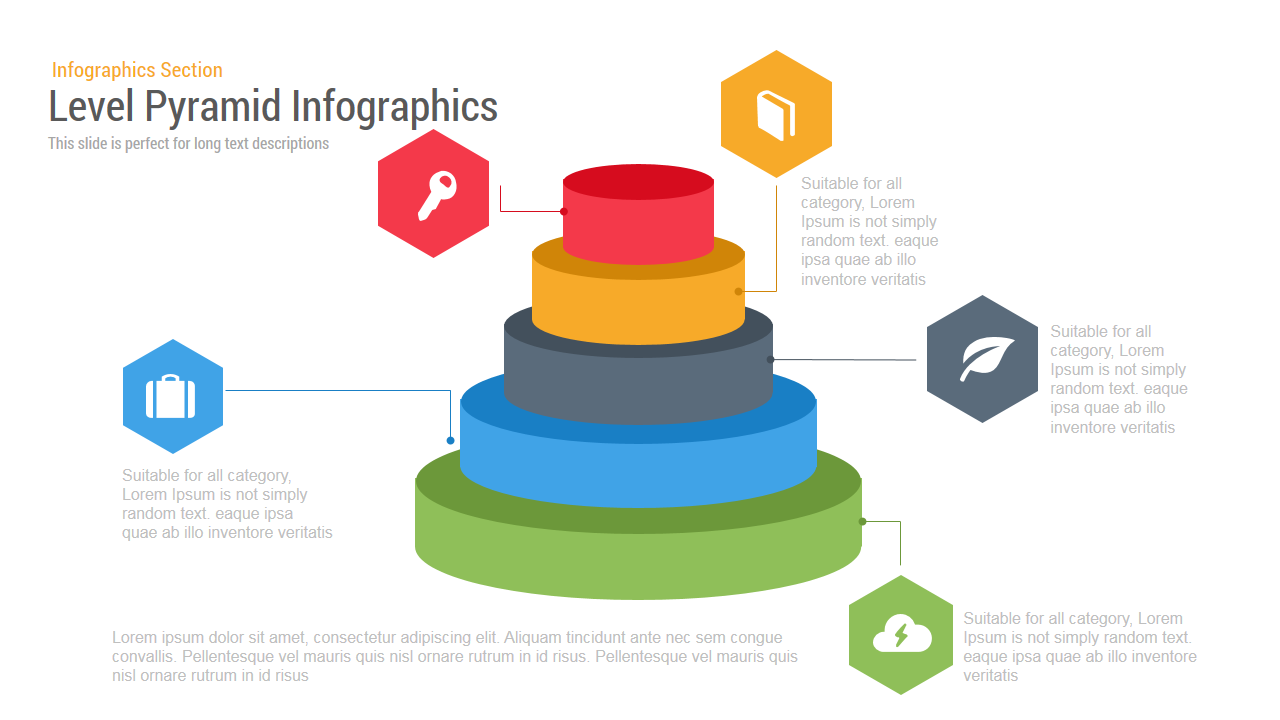
Level Pyramid Infographic PowerPoint Template and Keynote Slide
Stage Diagrams
Premium
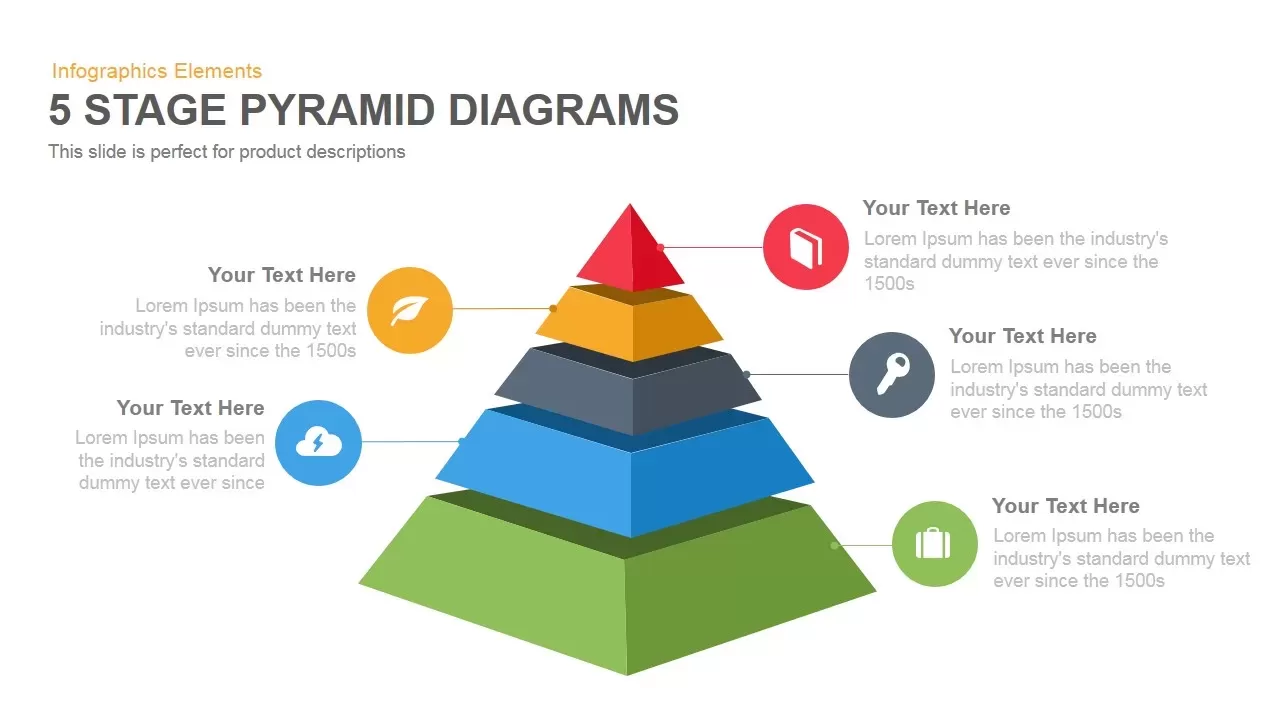
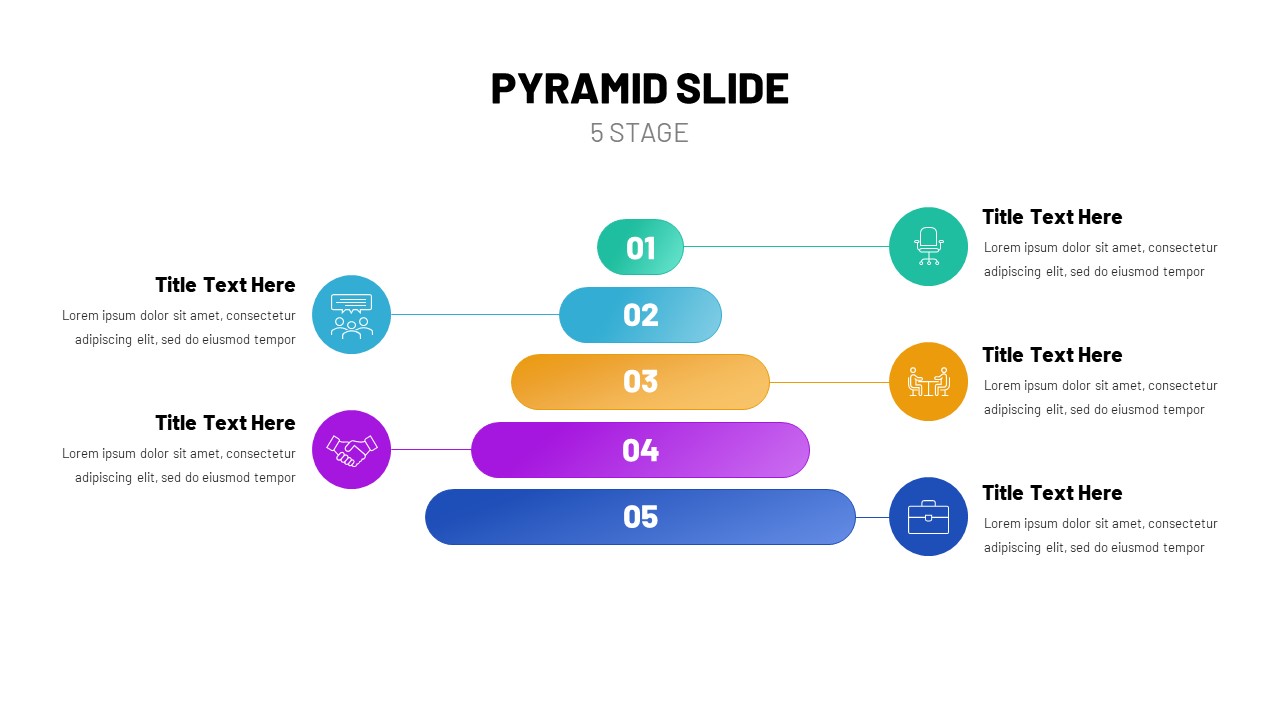
5 Stage Pyramid Diagrams PowerPoint Template and Keynote Slide
Pyramid
Premium
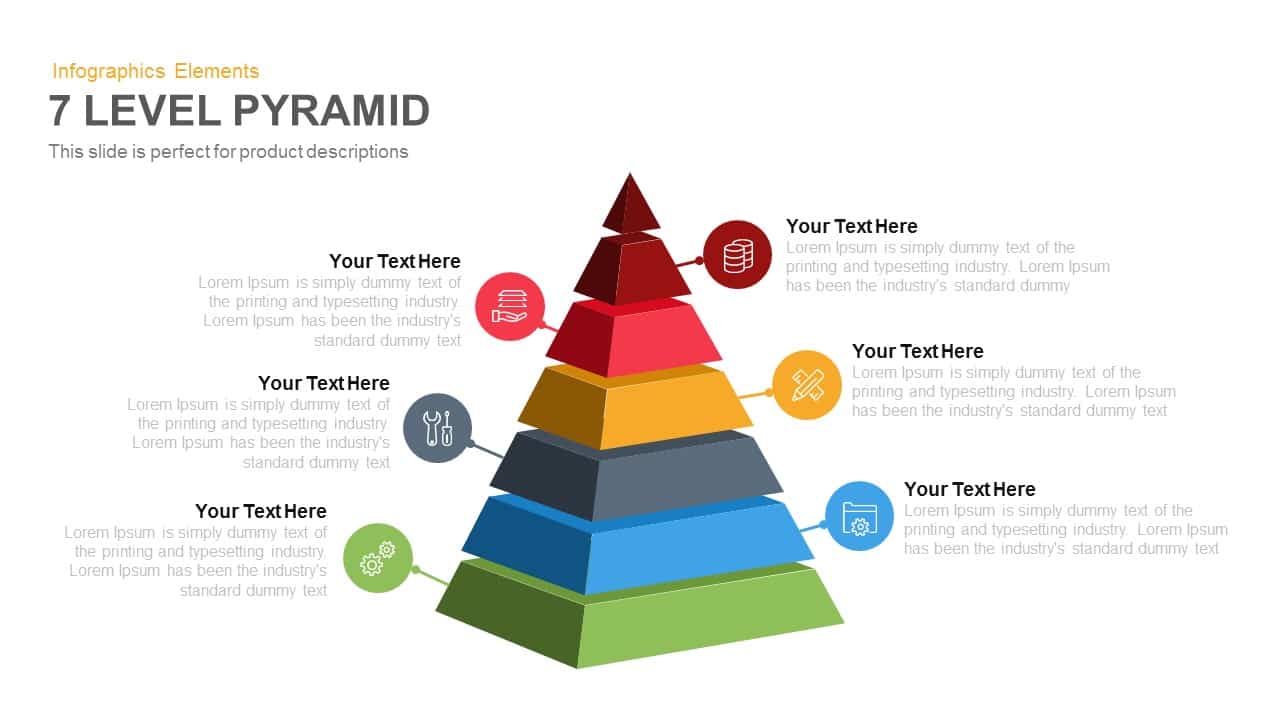
7 Level Pyramid Template for PowerPoint and Keynote
Business Models
Premium
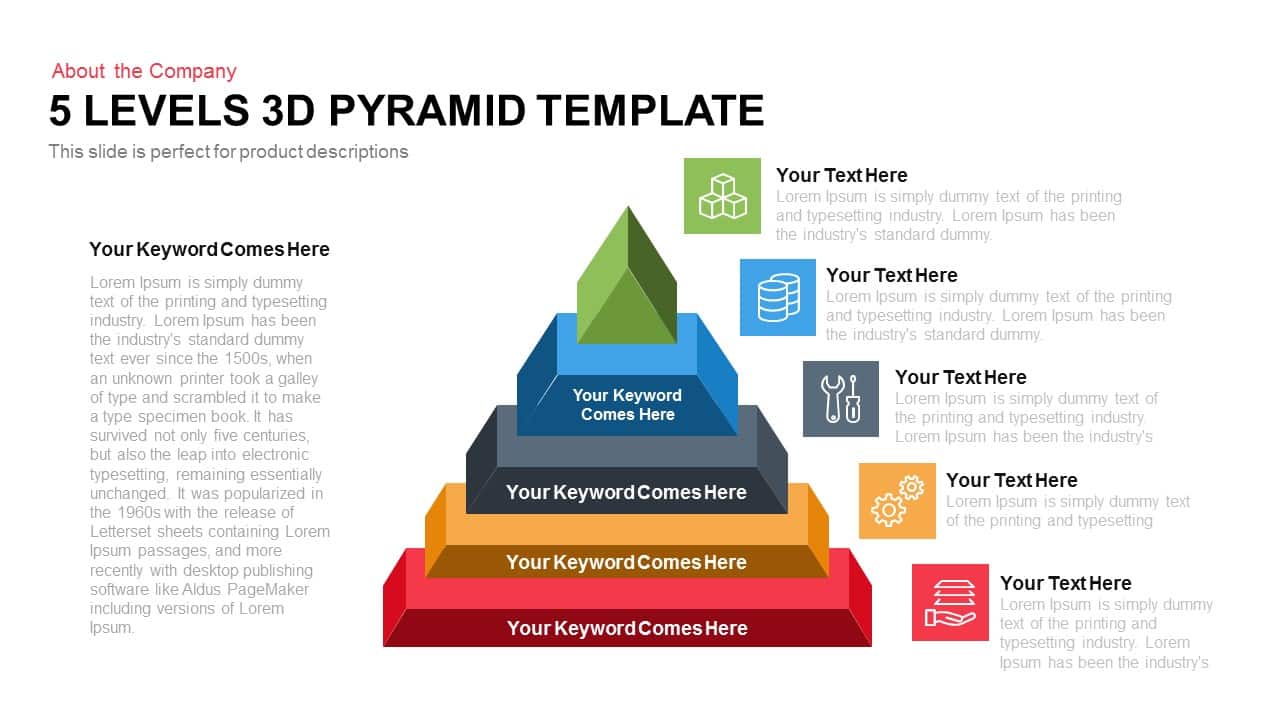
5 Levels 3D Pyramid Template for PowerPoint and Keynote
Business Models
Premium
4 Step Pyramid PowerPoint Template and Keynote
Diagrams
Premium

3d Pyramid PowerPoint Template and Keynote Diagram
3D Shapes
Premium
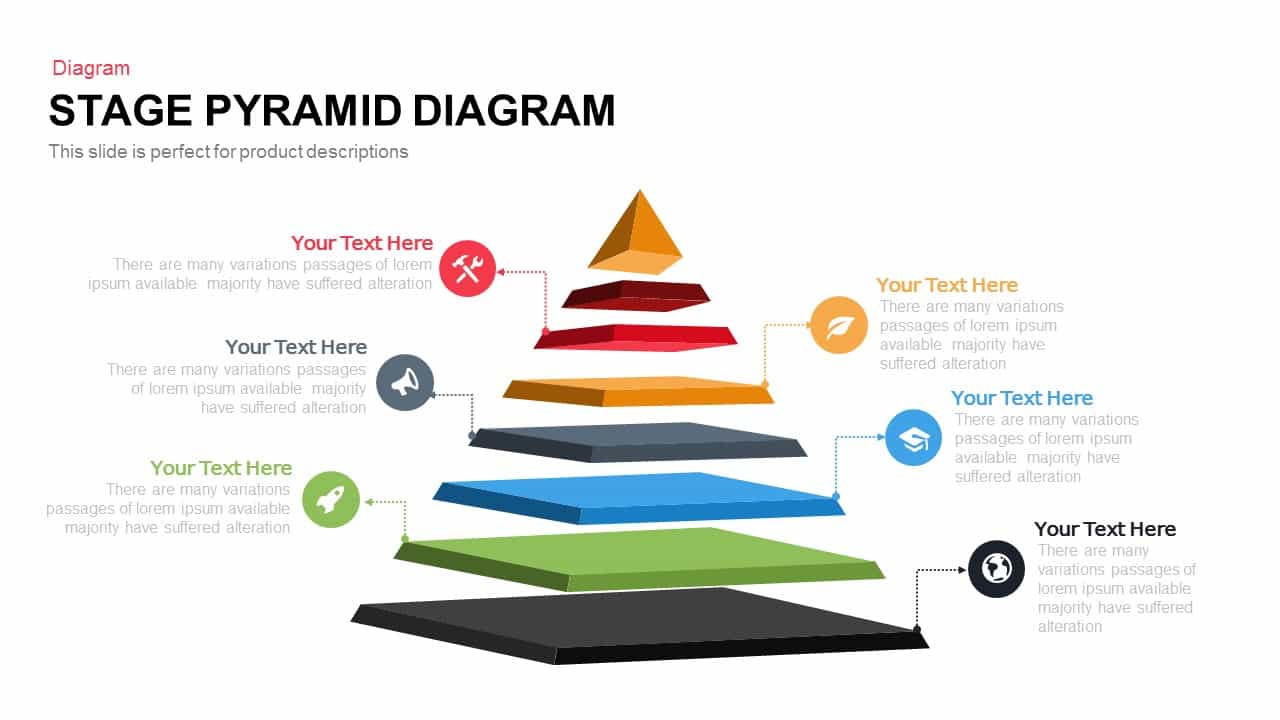
Stage Pyramid Diagram PowerPoint Template and Keynote
3D Shapes
Premium
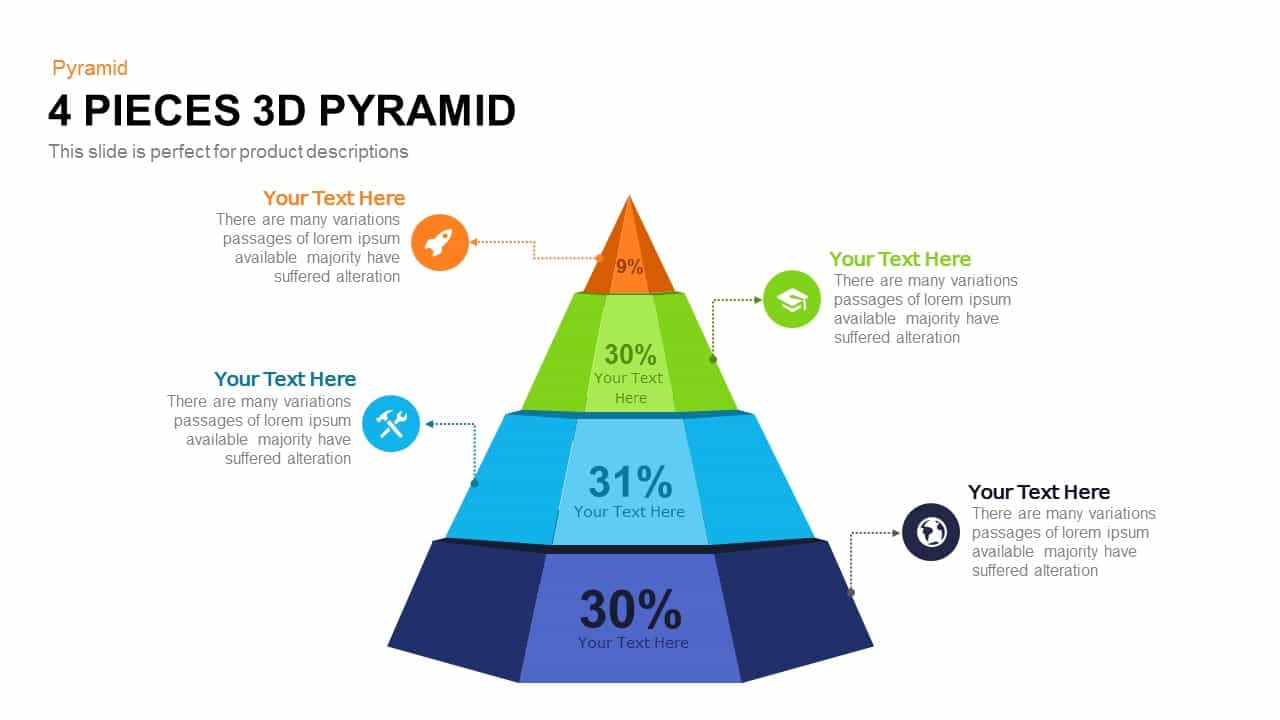
4 Pieces 3d Pyramid PowerPoint Template and Keynote Slide
Pyramid
Premium
5 Staged Infographic Pyramid PowerPoint Template and Keynote
Pyramid
Premium
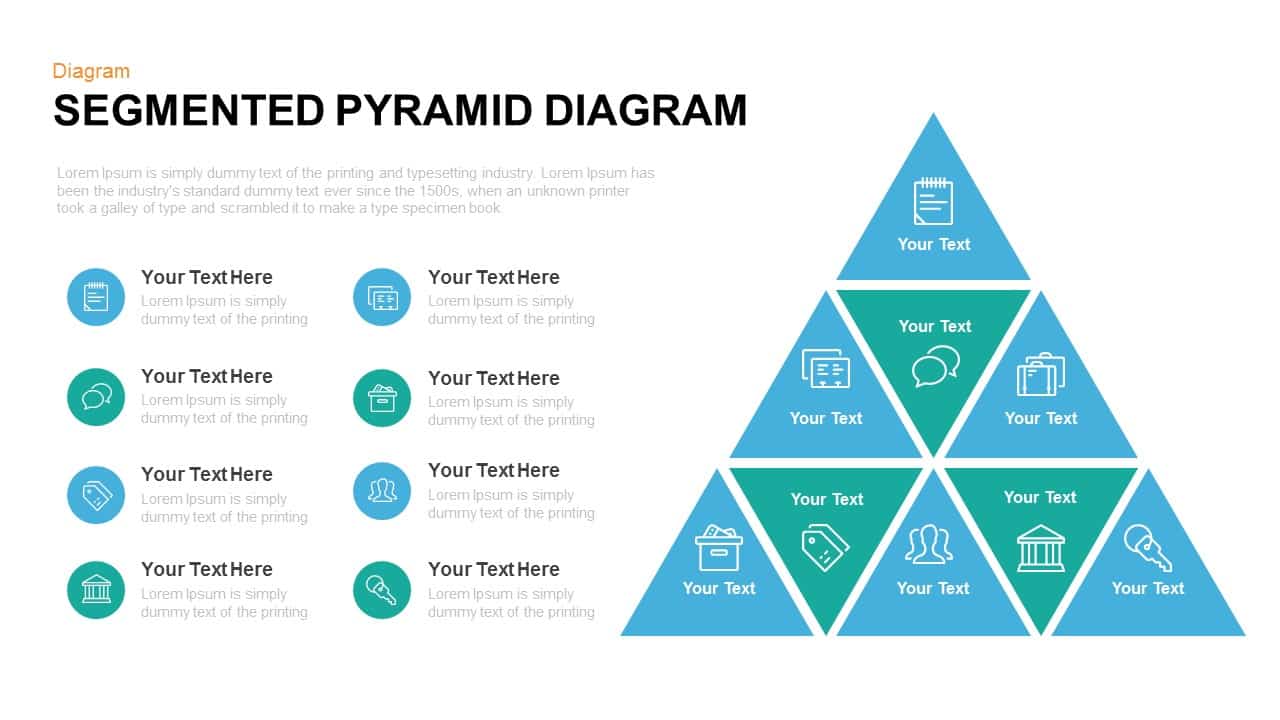
Segmented Pyramid Diagram Template for PowerPoint and Keynote
Pyramid
Premium
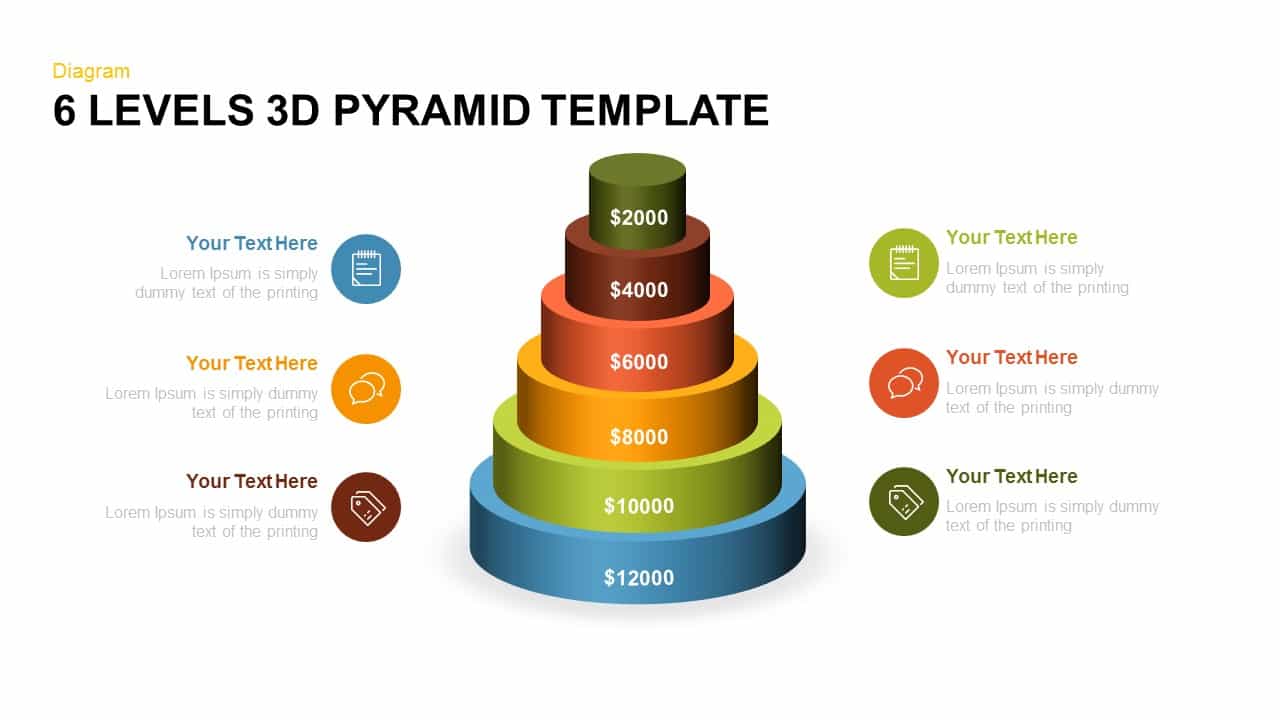
6 Levels 3d Pyramid PowerPoint Template and Keynote Slide
Pyramid
Premium
Goal Achievement Pyramid Template for PowerPoint and Keynote
Diagrams
Premium
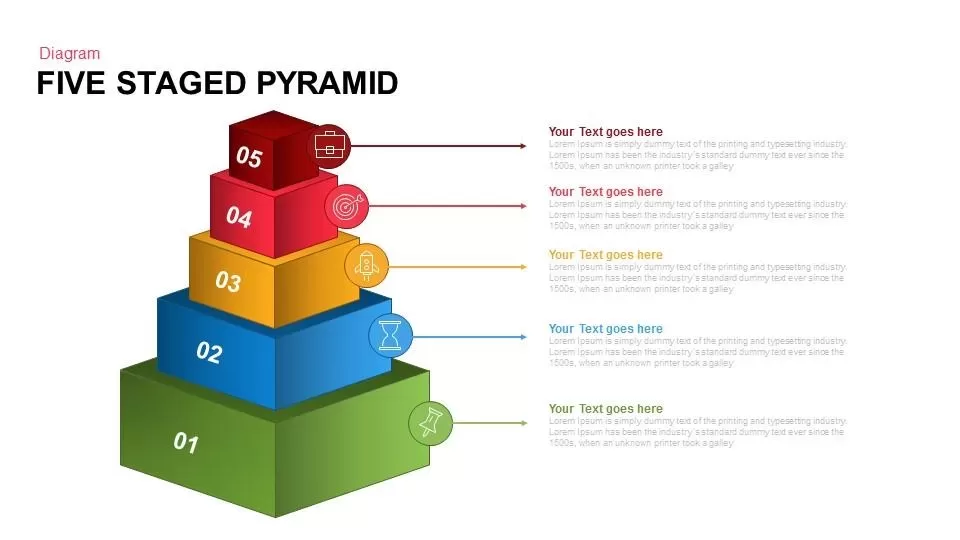
Five Staged Pyramid PowerPoint template and Keynote Slide
Pyramid
Premium

4 Stage Pyramid Diagram Template for PowerPoint and Keynote
Pyramid
Premium
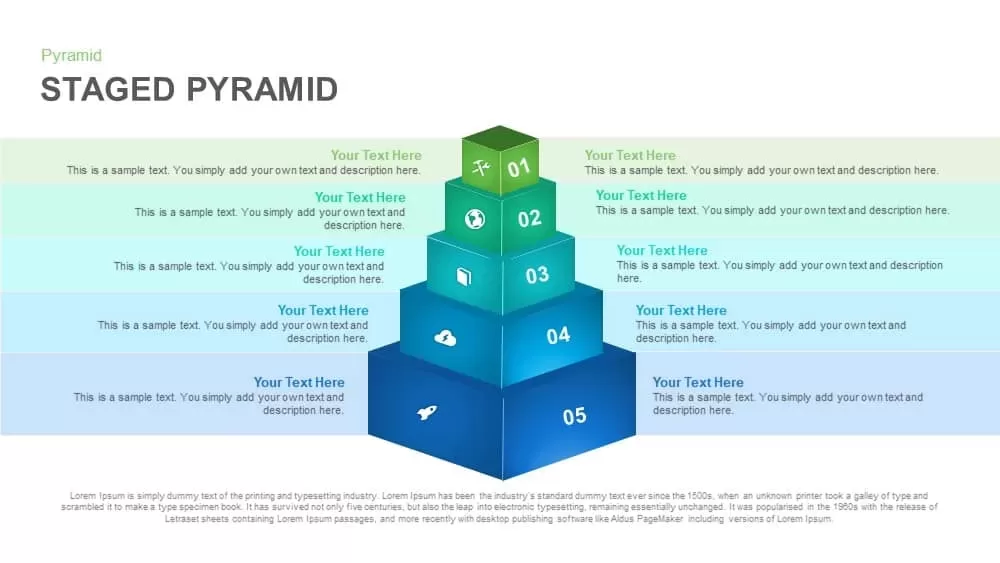
Staged Pyramid PowerPoint Template & Keynote Slide
Pyramid
Premium
5 Stages Ribbon Pyramid Diagram Template for PowerPoint and Keynote
Diagrams
Premium
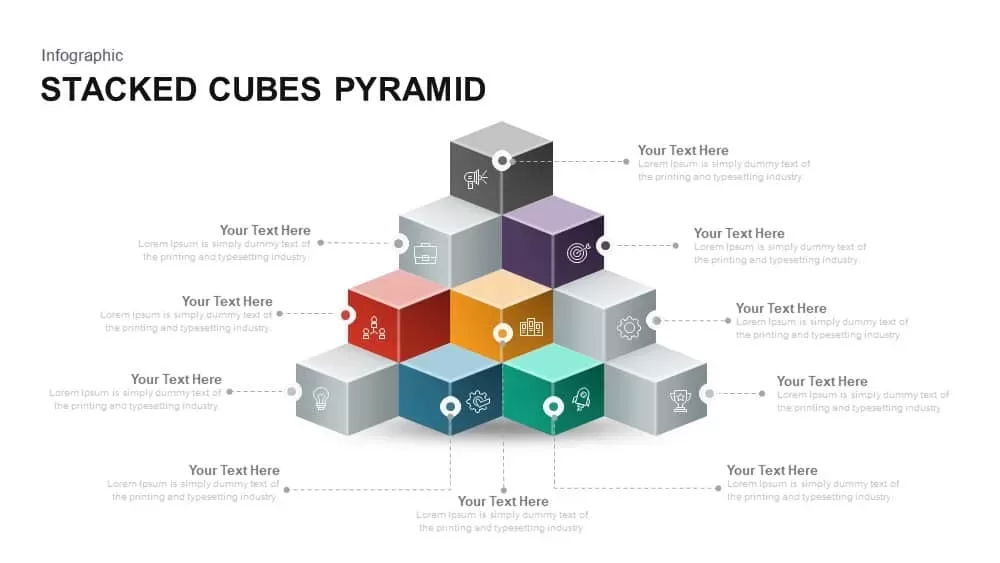
Stacked Cubes Pyramid PowerPoint Template and Keynote Slide
Pyramid
Premium
5 Stage Infographics Pyramid Diagram Template for PowerPoint and Keynote
Pyramid
Premium
3D Pyramid Infographic Template for PowerPoint
Pyramid
Premium
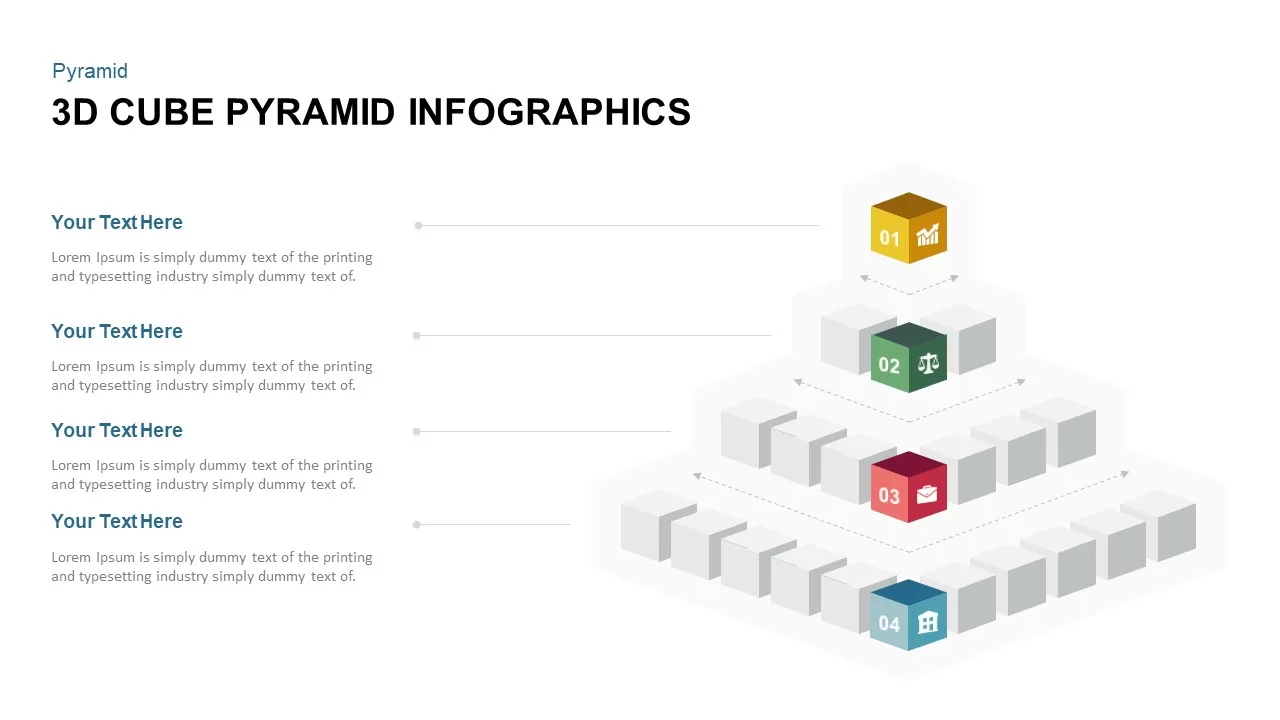
3D Pyramid PowerPoint Template with Cubes
3D Shapes
Premium
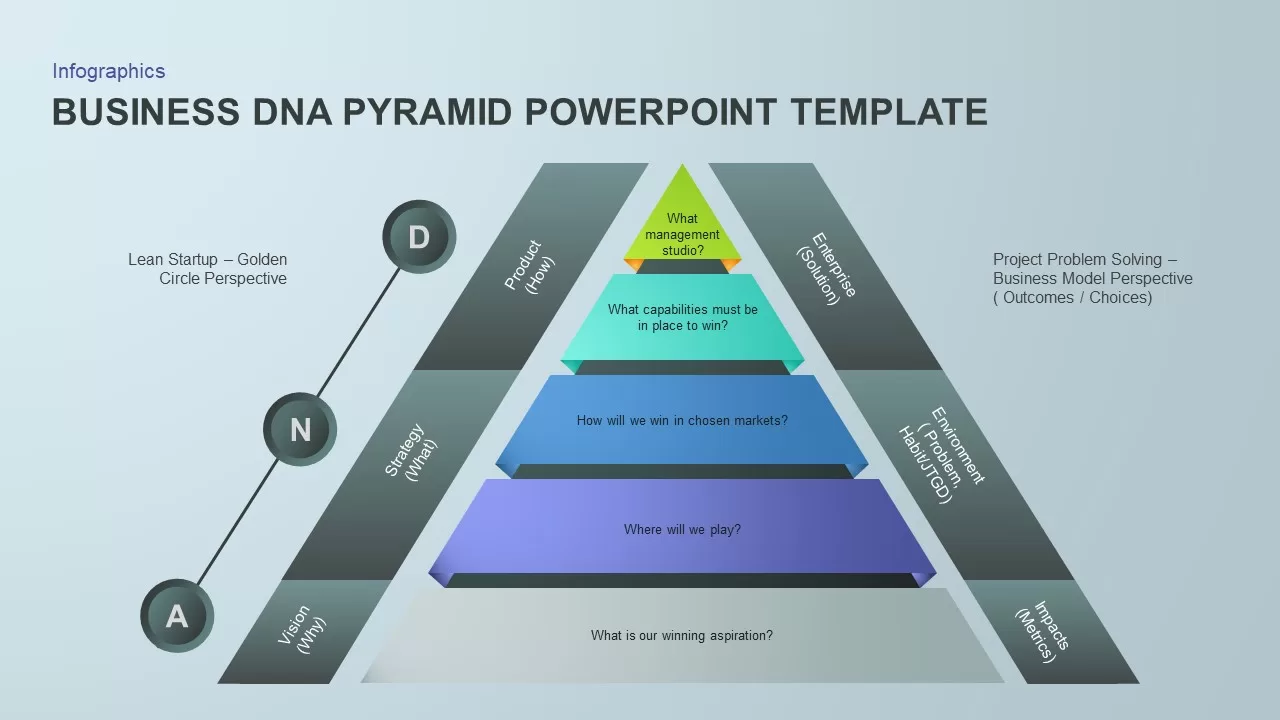
Business DNA Pyramid PowerPoint Template
Pyramid
Premium
Hand-drawn Cubes Pyramid Template for PowerPoint and Keynote Presentations
Cubes
Premium
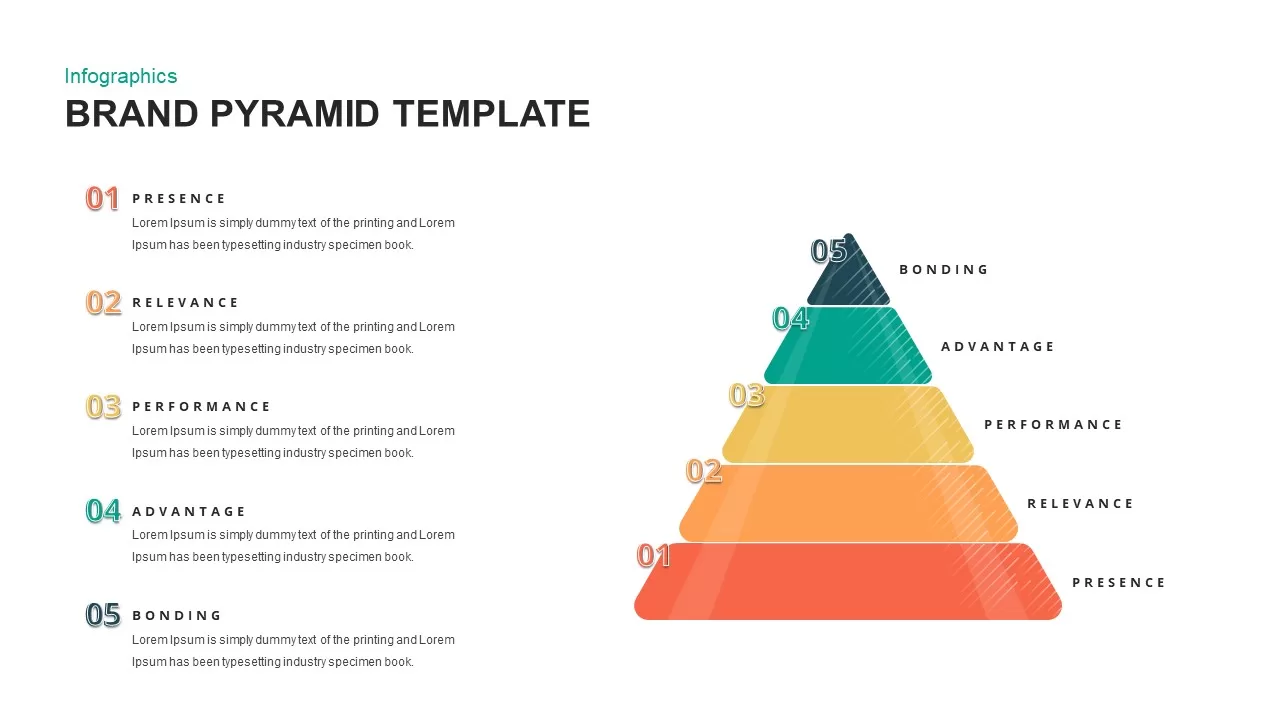
Brand Pyramid PowerPoint Template
Pyramid
Premium
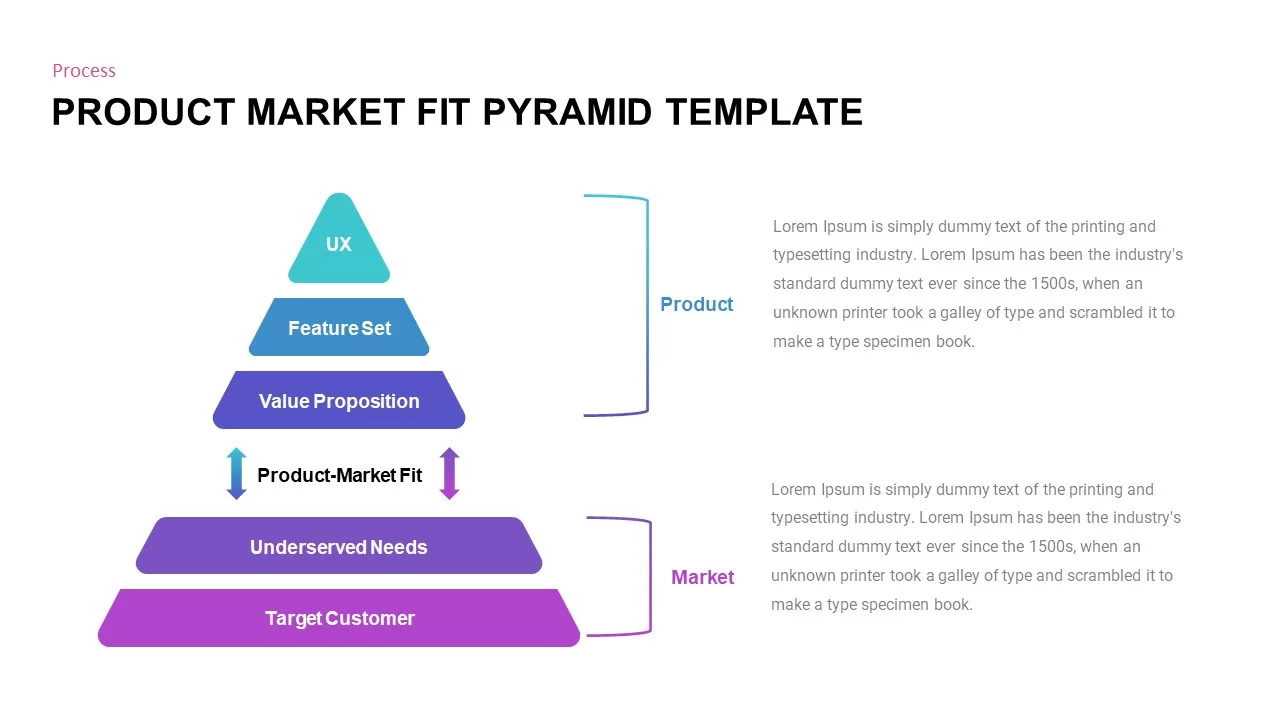
Product Market Fit Pyramid PowerPoint Template
Pyramid
Premium
3 Stage Pyramid Slide PowerPoint Template
Pyramid
Premium
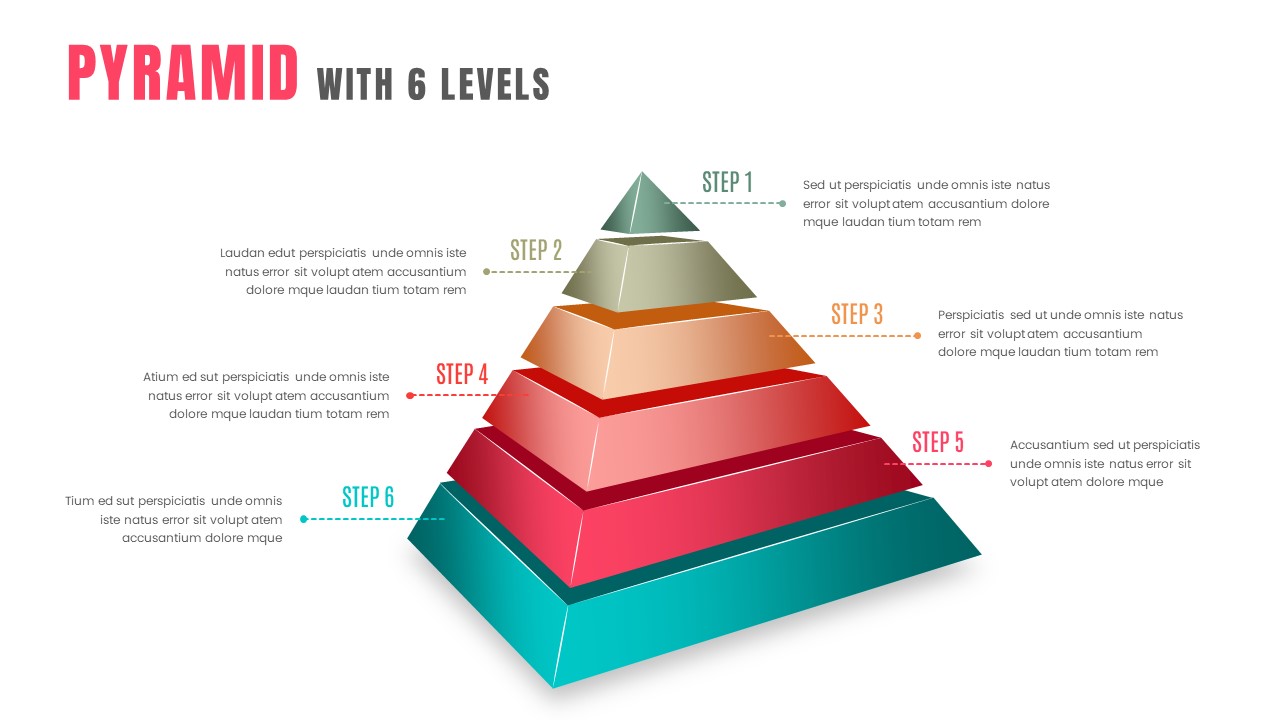
6 Stage Pyramid Template For PowerPoint
Pyramid
Premium
3D Pyramid Slide PowerPoint Template
Pyramid
Premium
4 Stage Pyramid Slide PowerPoint Template
Pyramid
Premium
4 Level Pyramid PowerPoint Template
Pyramid
Premium
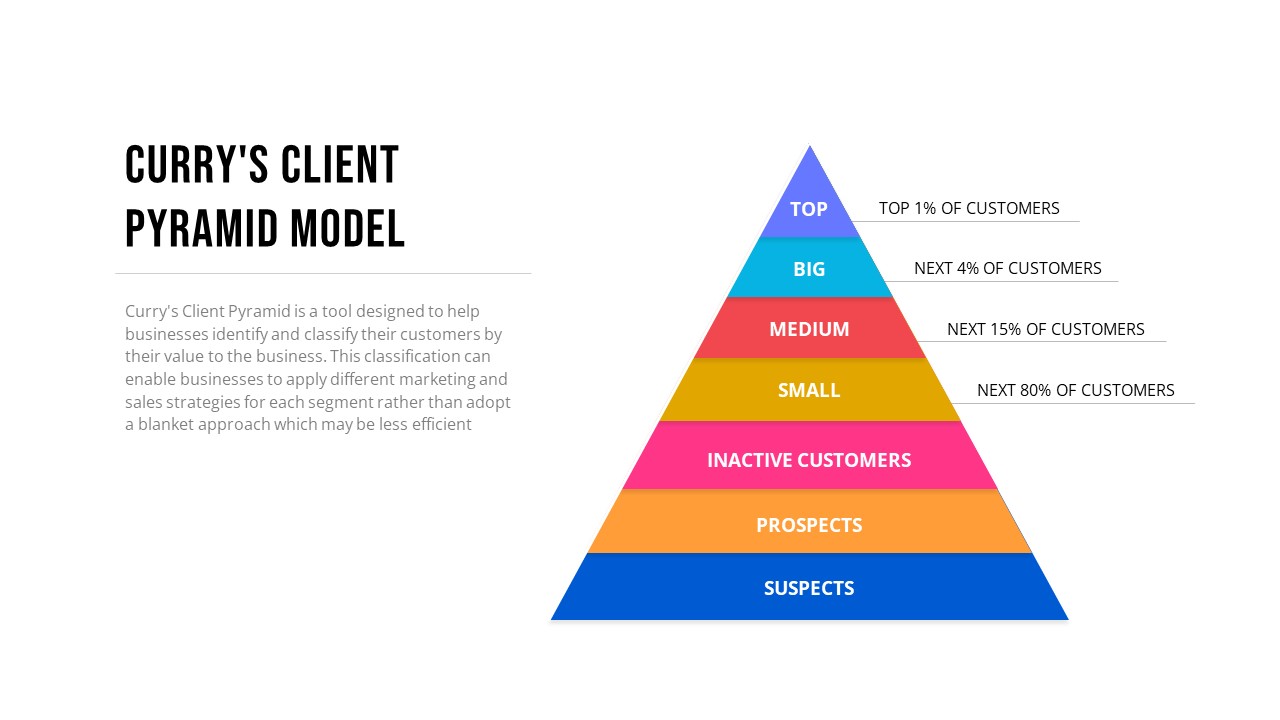
Curry’s Client Pyramid PowerPoint Template
PowerPoint Templates
Premium
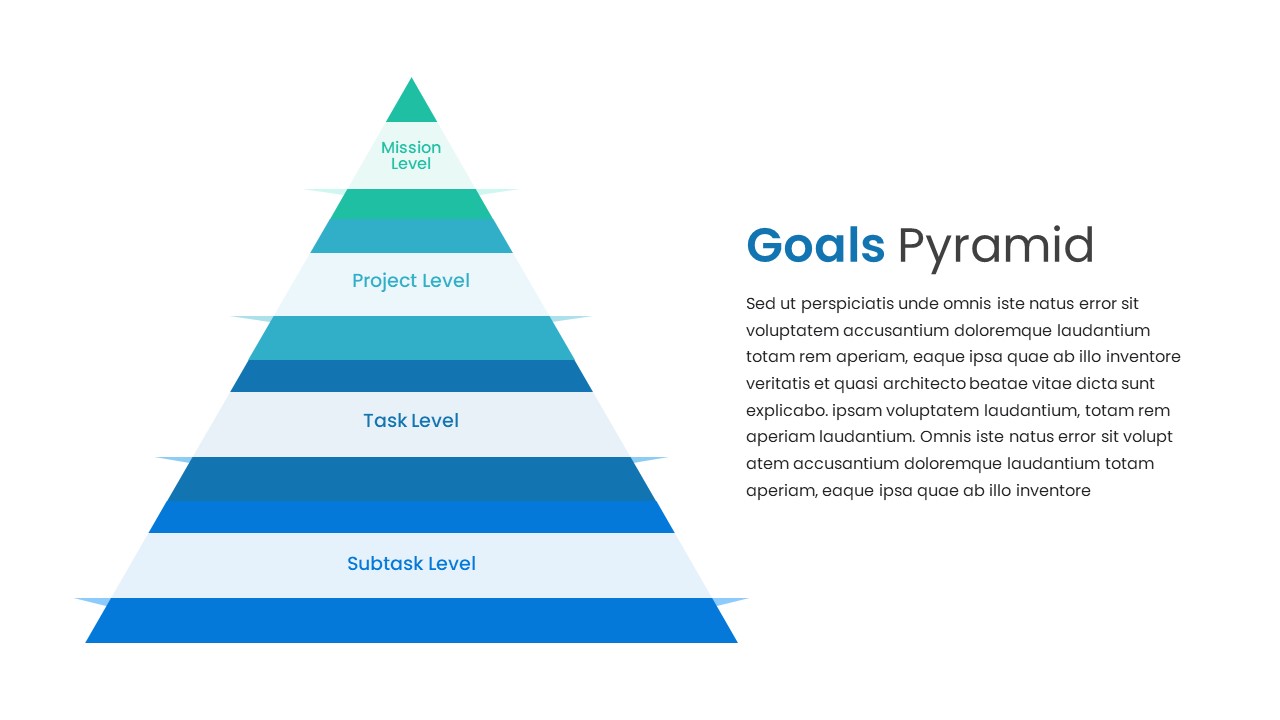
Goals Pyramid PowerPoint Template
PowerPoint Templates
Premium
Risk Pyramid PowerPoint Template
Pyramid
Premium
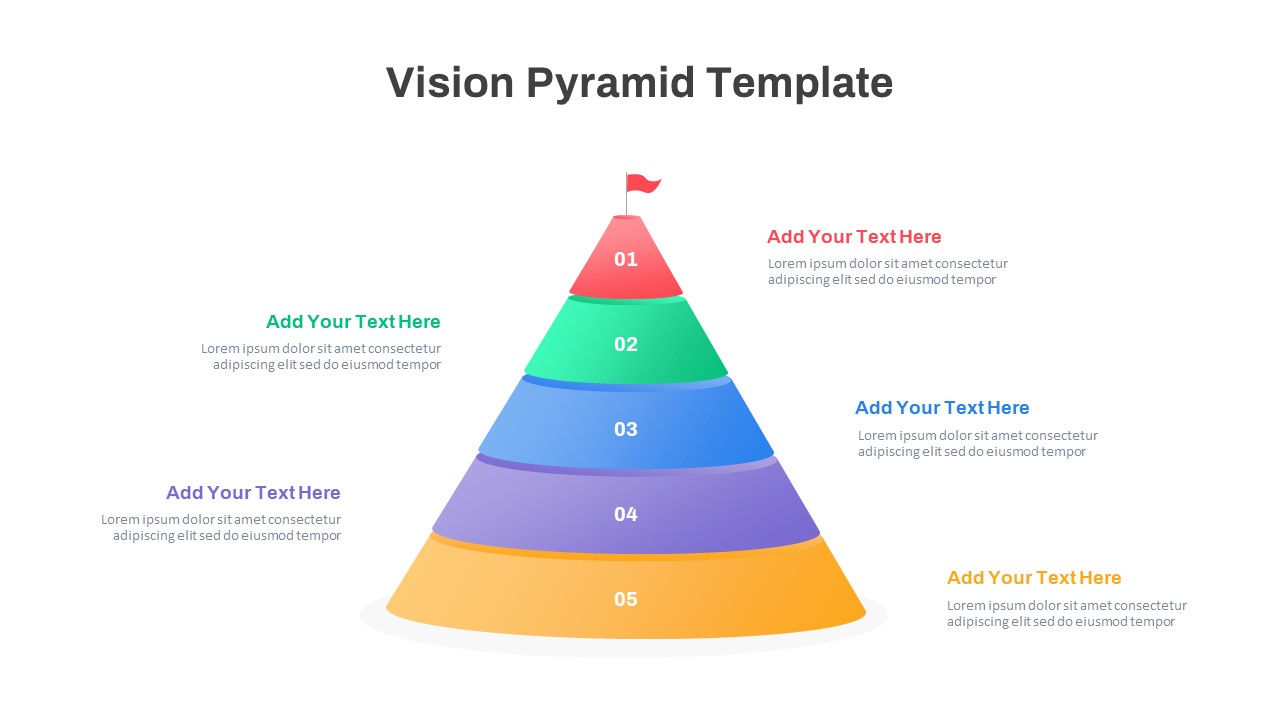
Vision Pyramid PowerPoint Template
Pyramid
Premium
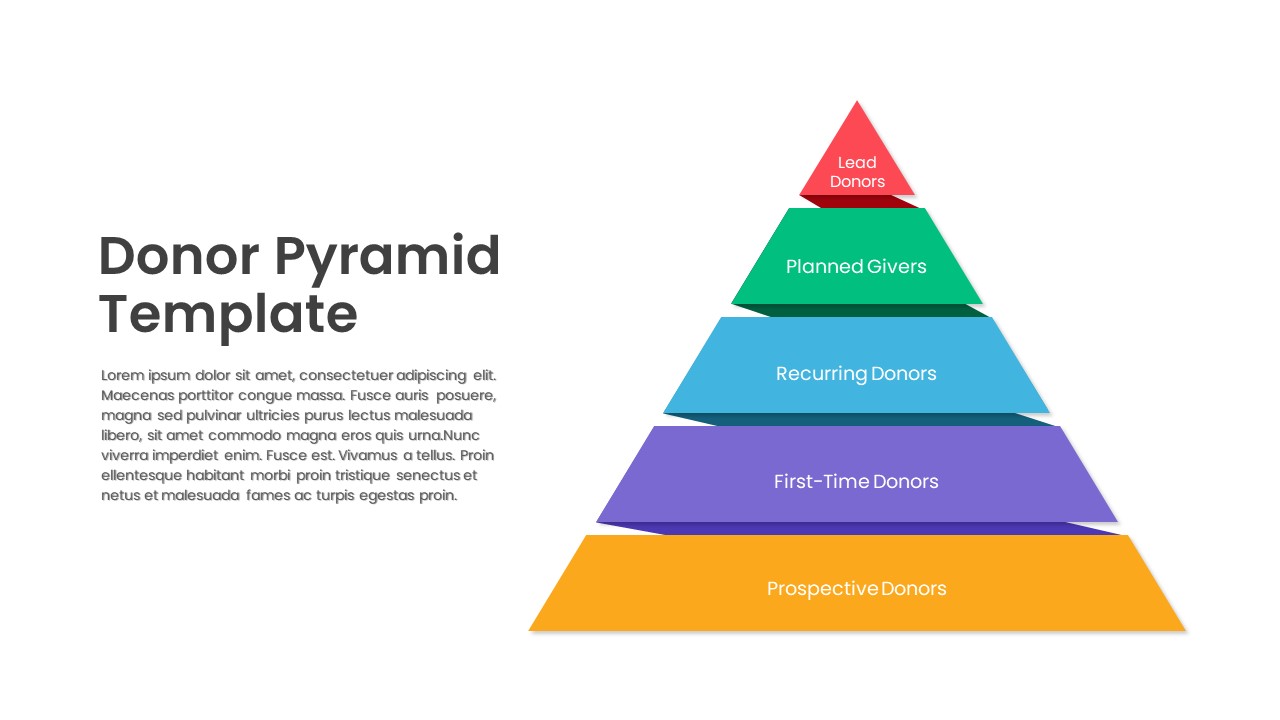
Donor Pyramid PowerPoint Template
Pyramid
Premium
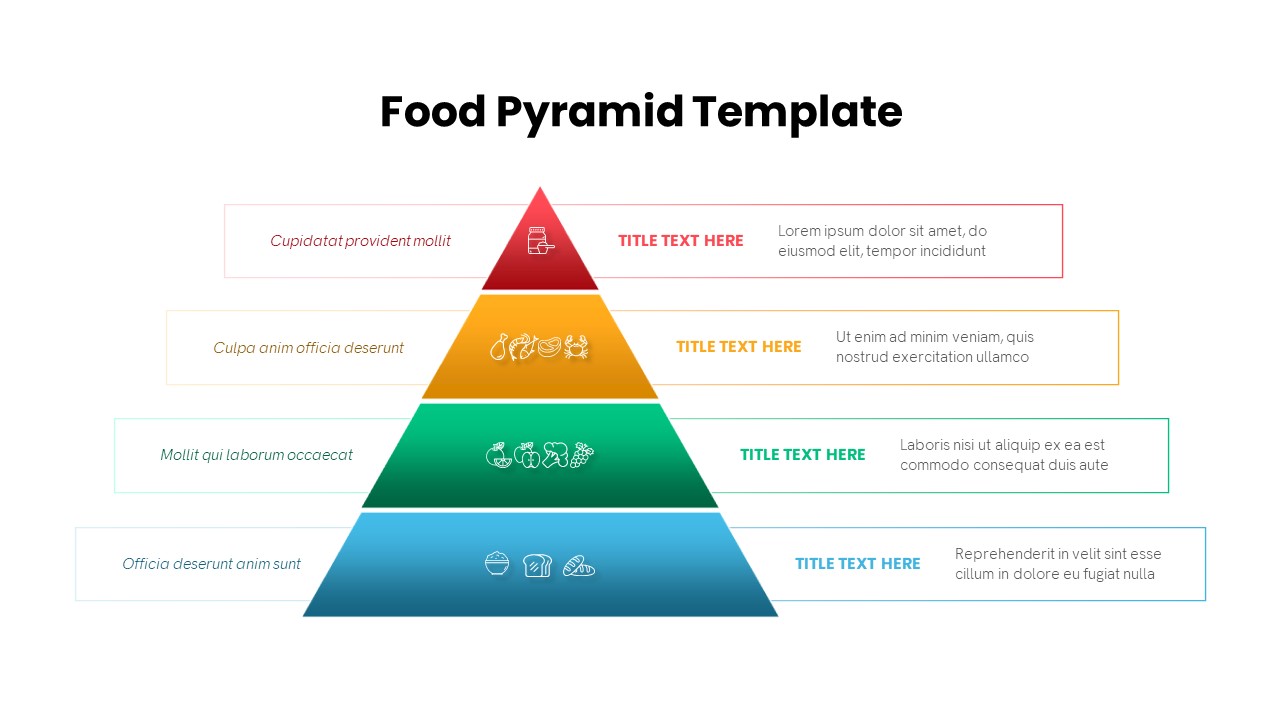
Food Pyramid PowerPoint Template
Pyramid
Free
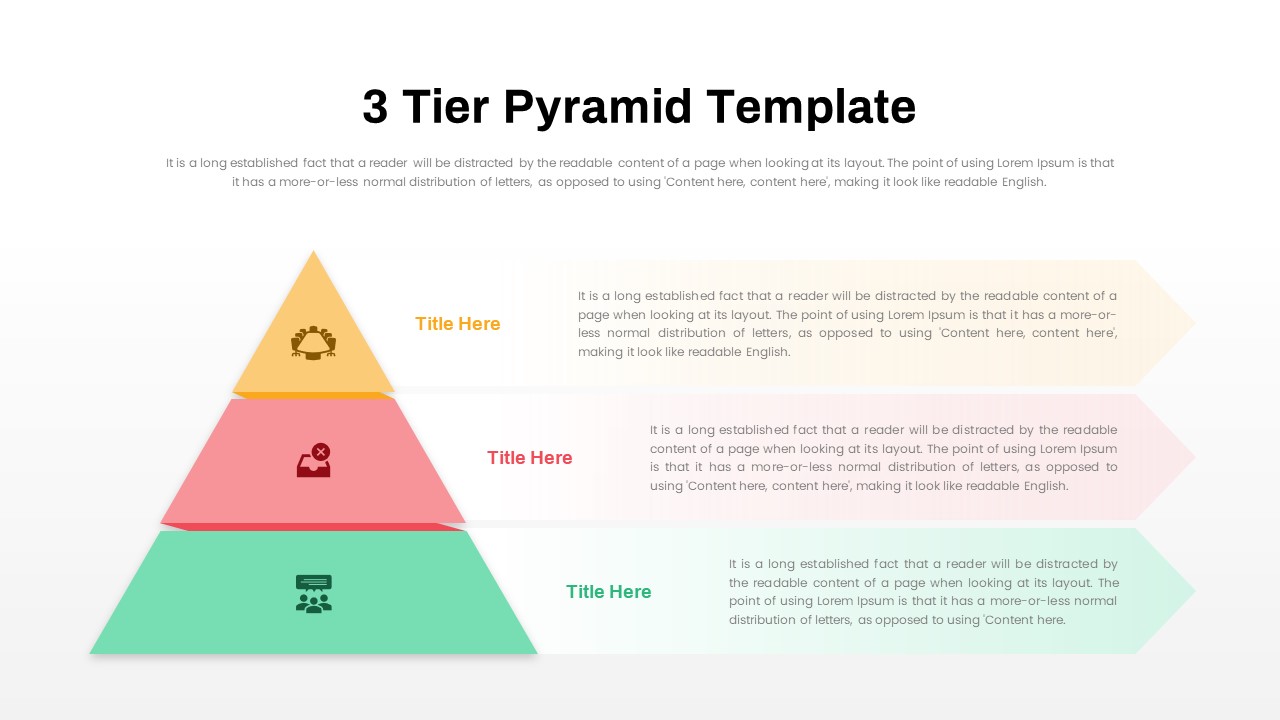
3 Tier Pyramid PowerPoint Template
Pyramid
Premium
Free Learning Pyramid PowerPoint Template
Pyramid
Free
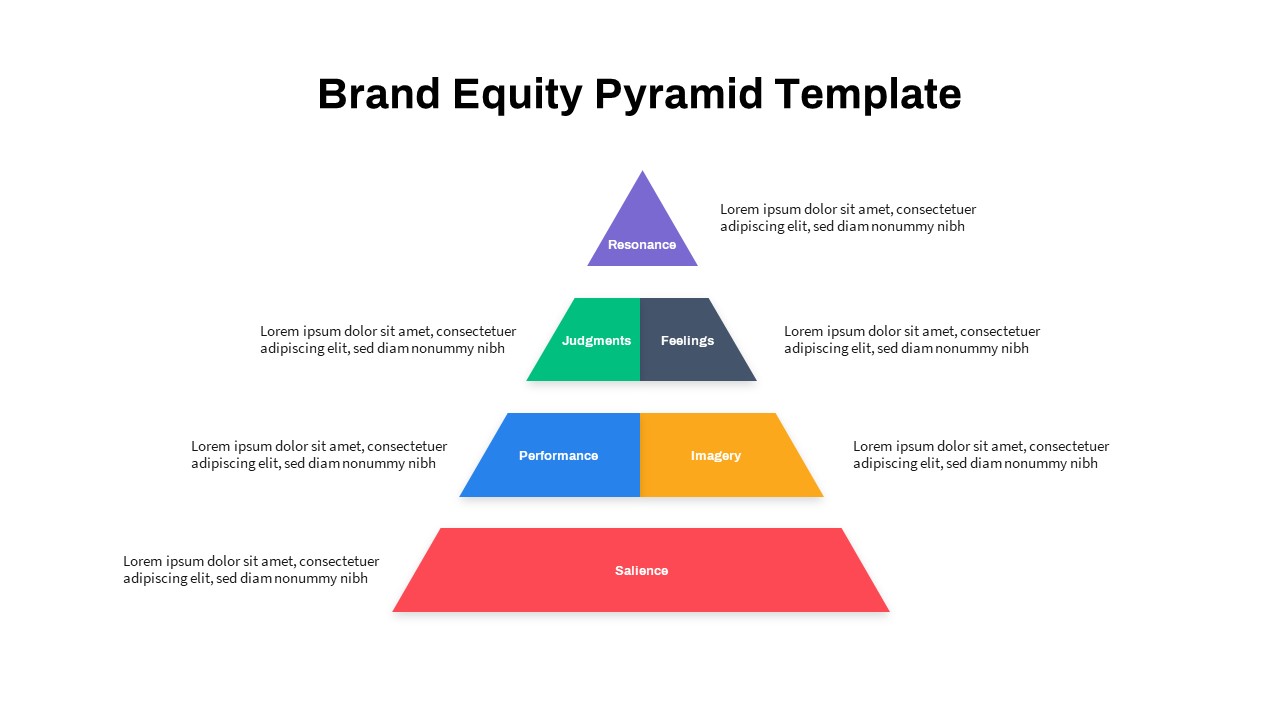
Brand Equity Pyramid PowerPoint Template
PowerPoint Templates
Premium
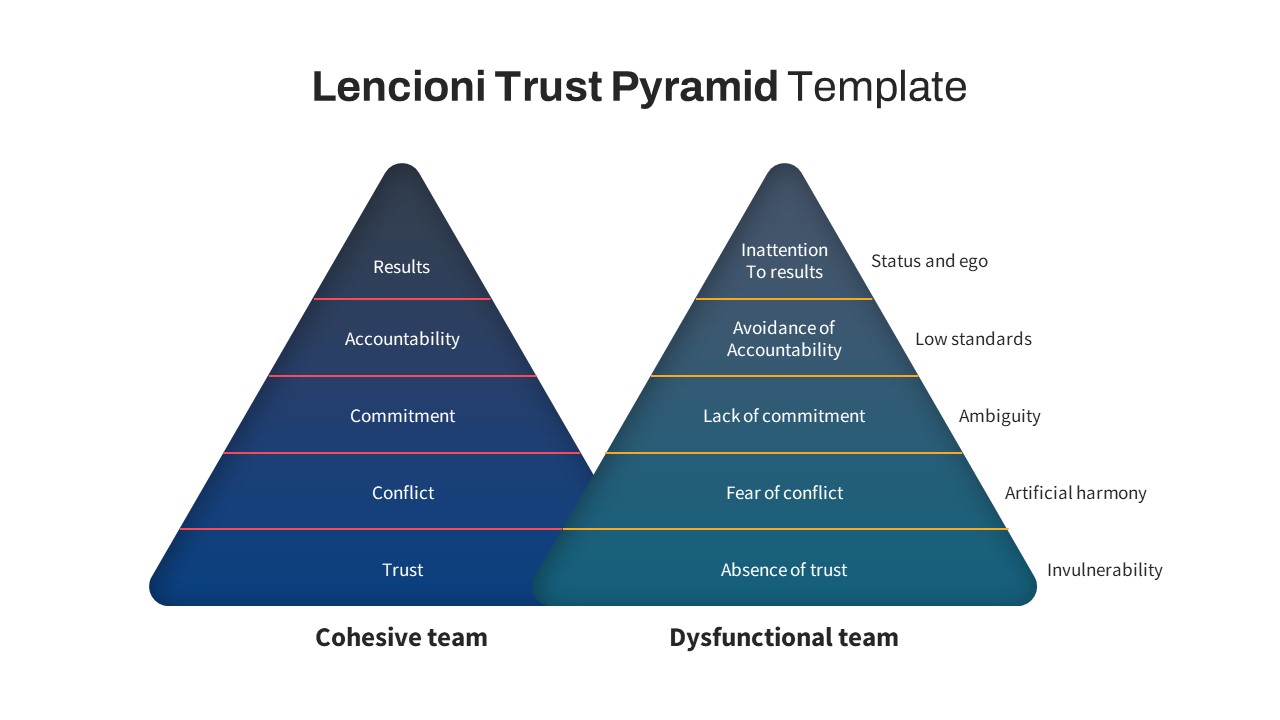
Lencioni Trust Pyramid PowerPoint Template
Pyramid
Premium
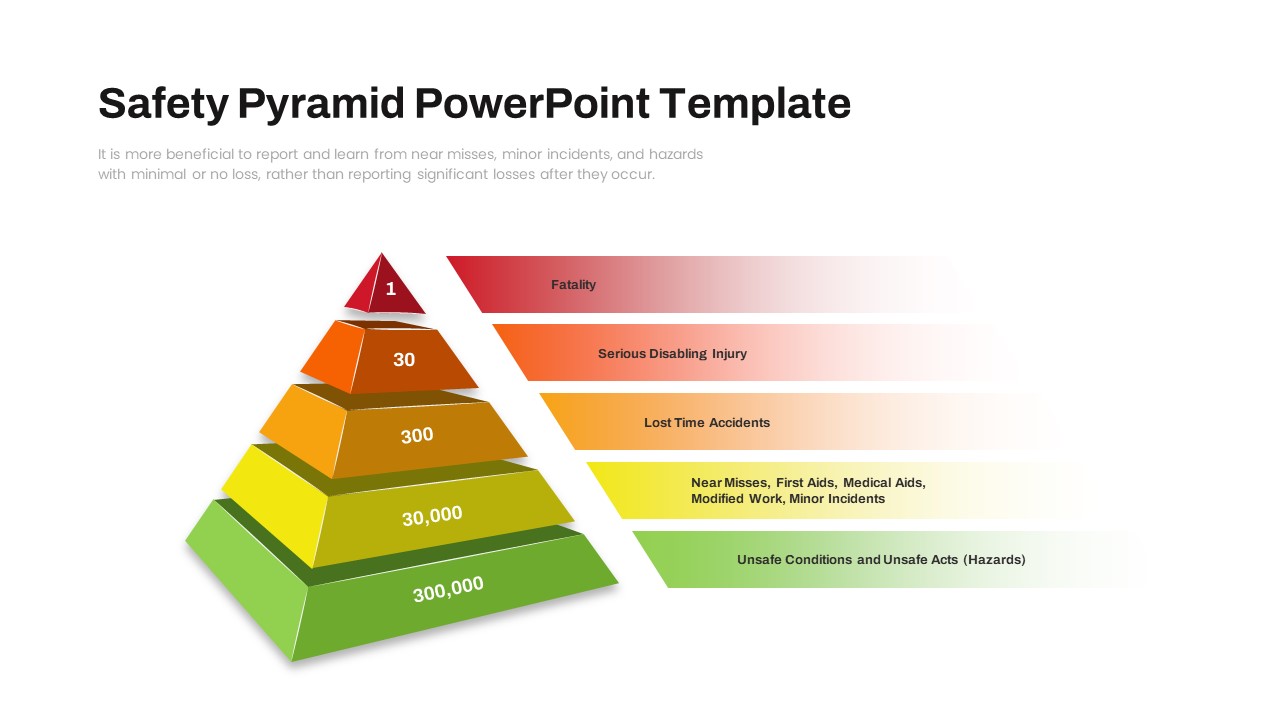
Safety Pyramid PowerPoint Template
Pyramid
Premium
MVP Pyramid PowerPoint Template
Pyramid
Premium
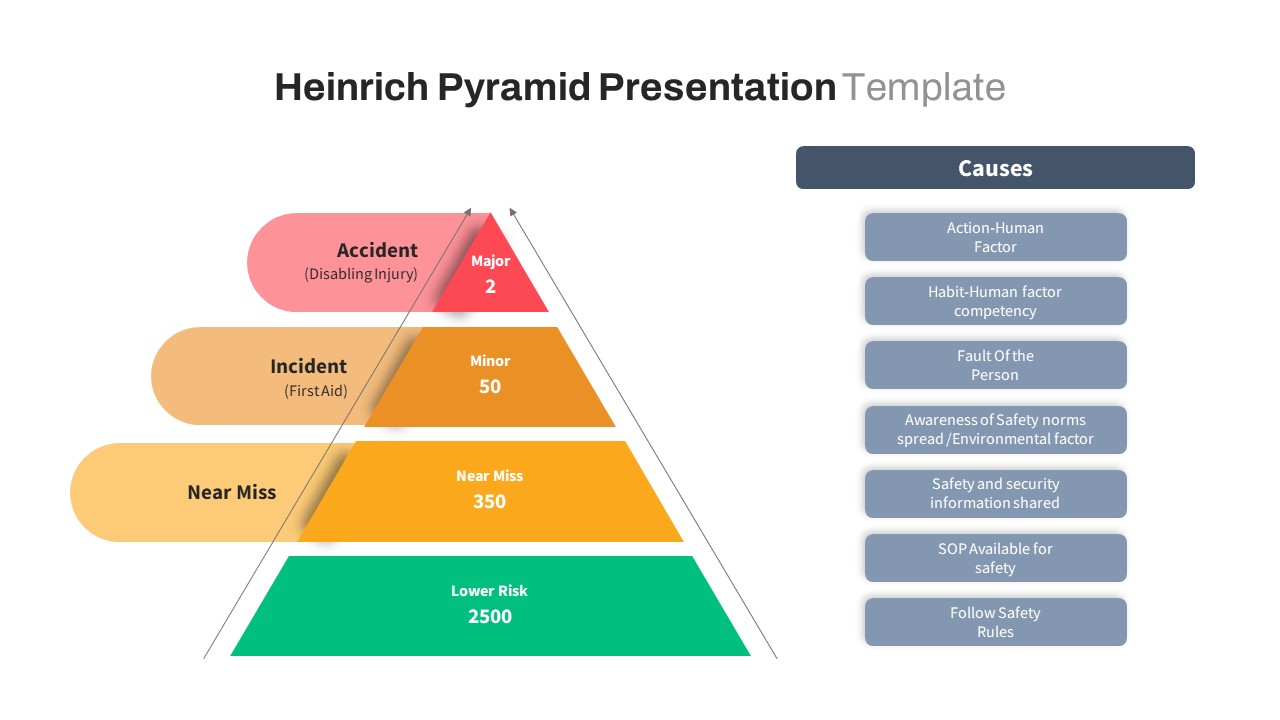
Heinrich Pyramid PowerPoint Template
Pyramid
Premium
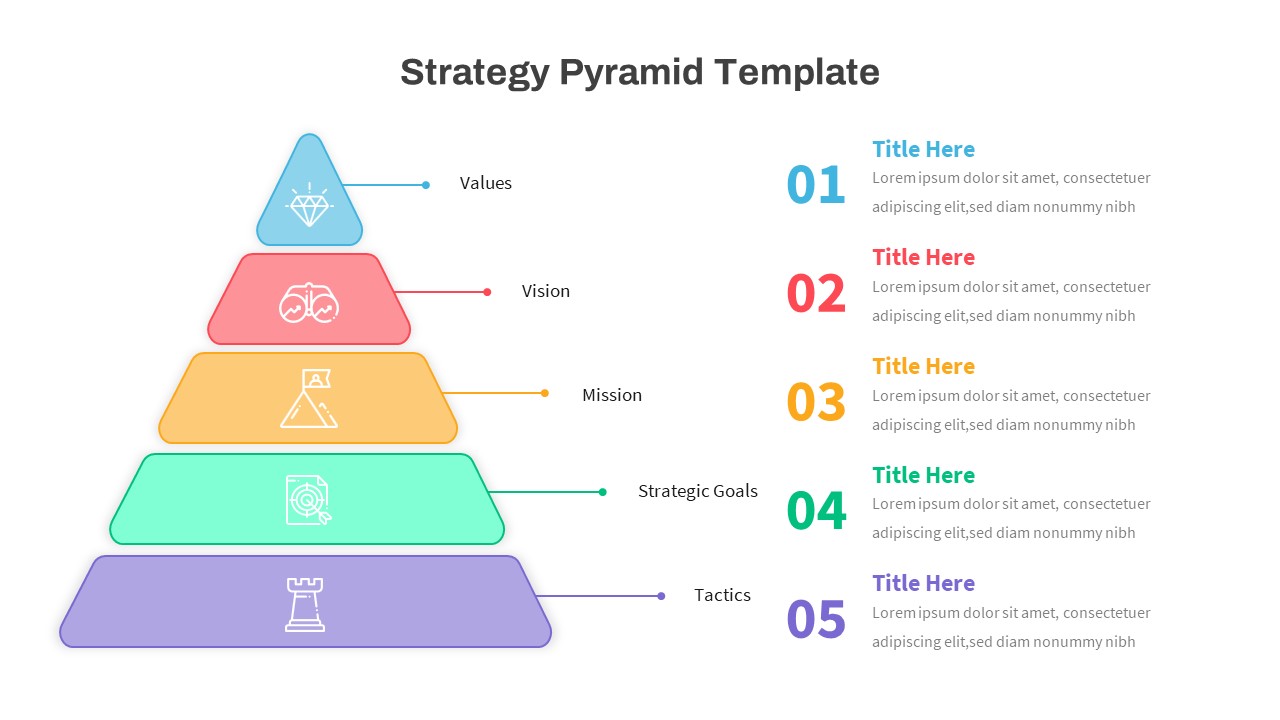
Strategy Pyramid PowerPoint Template
Business PowerPoint Templates
Premium
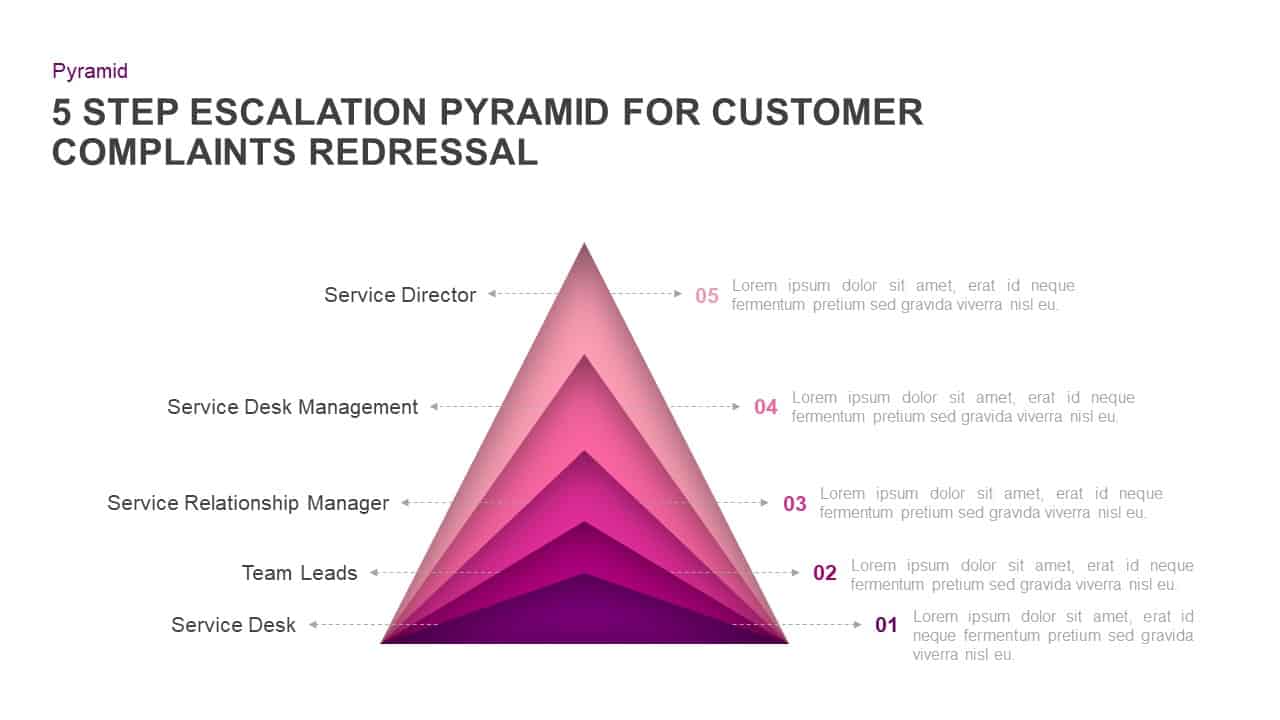
5 Step Escalation Pyramid For Customer Complaints Redressal PowerPoint Show
Pyramid
Premium
5 Stage Pyramid Slide For PowerPoint
Pyramid
Premium
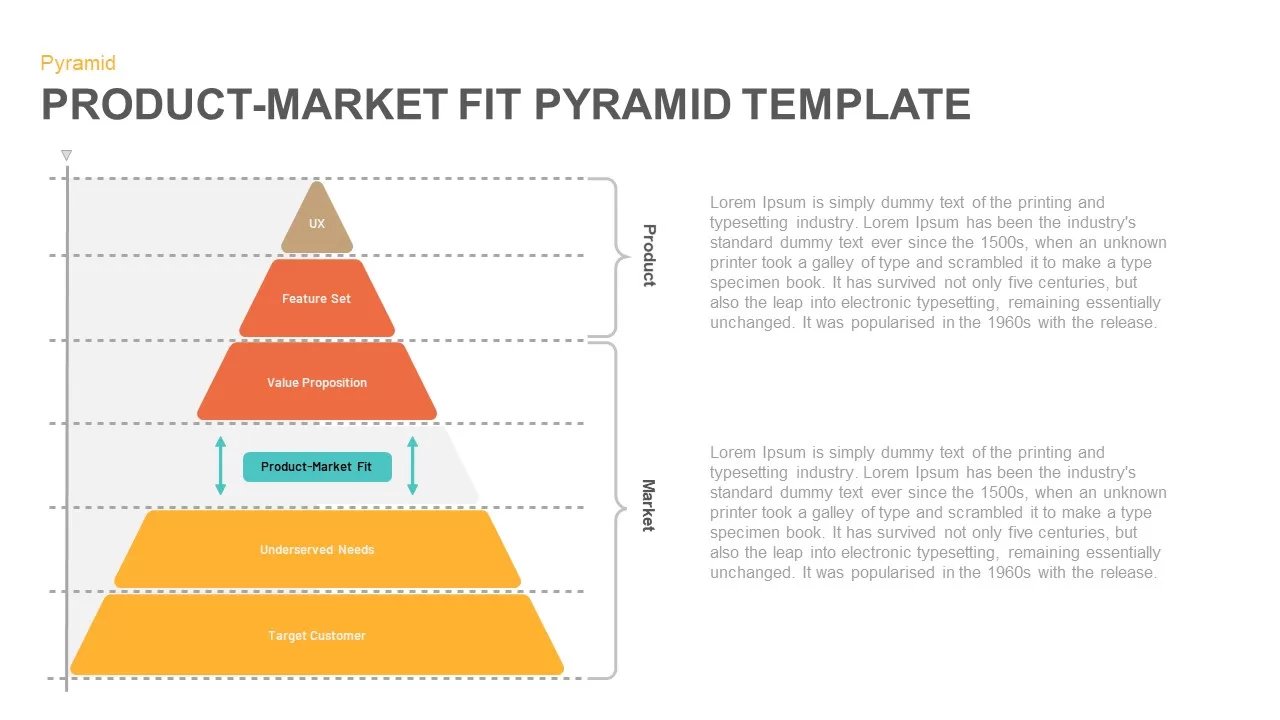
Product Market Fit Pyramid Template
Pyramid
Premium
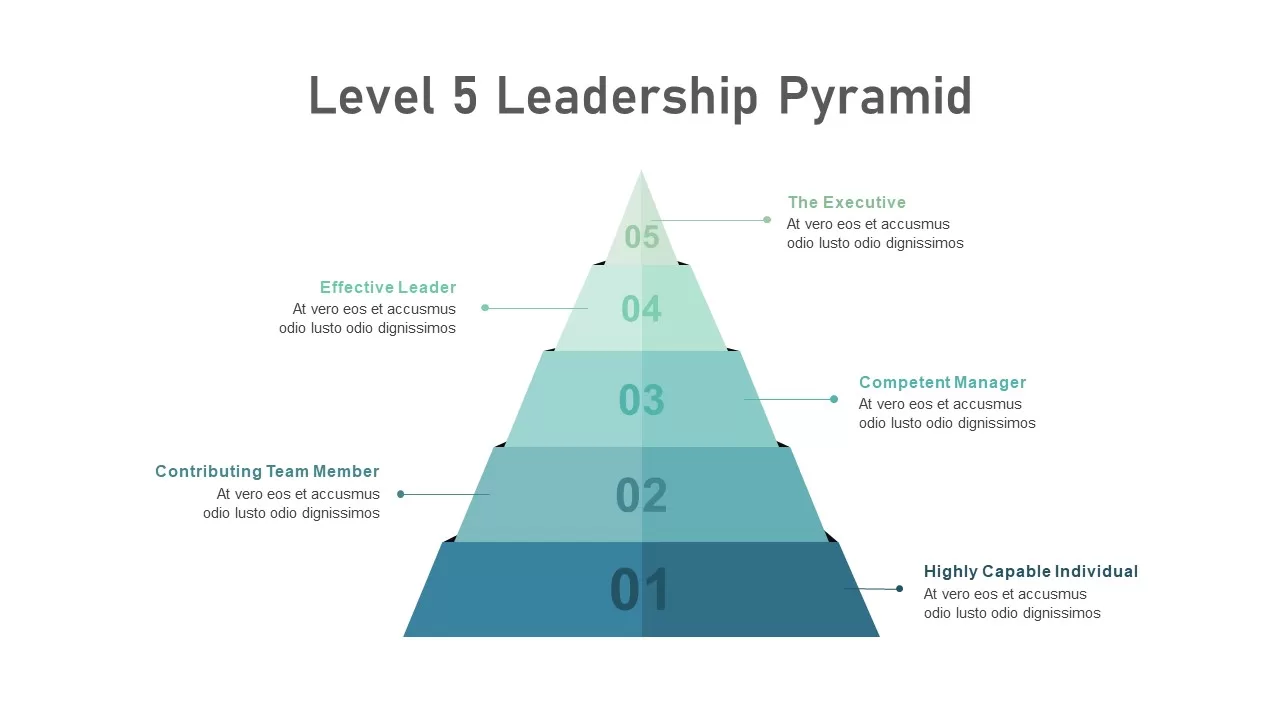
Level 5 Leadership Pyramid Template
3D Shapes
Premium
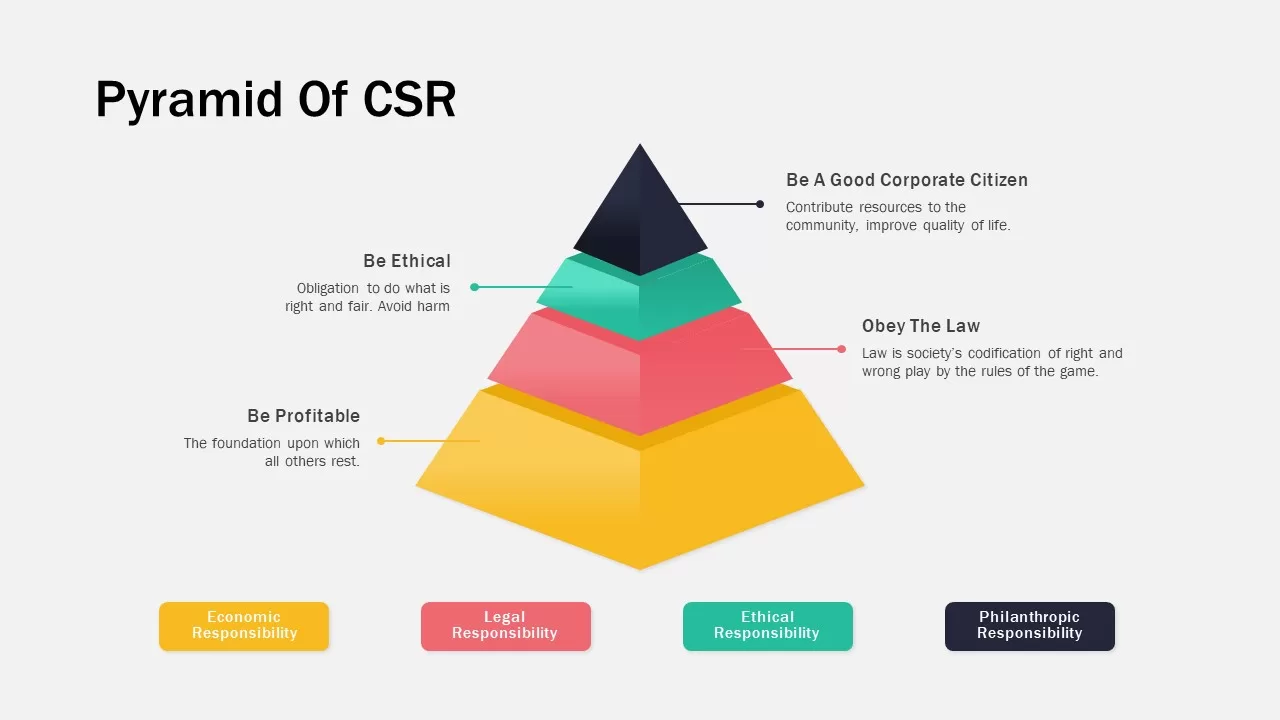
Pyramid Of CSR Template
Pyramid
Premium
5 Stage Pyramid Slide Template
Pyramid
Premium
6 Level Pyramid Slide Template
Pyramid
Premium
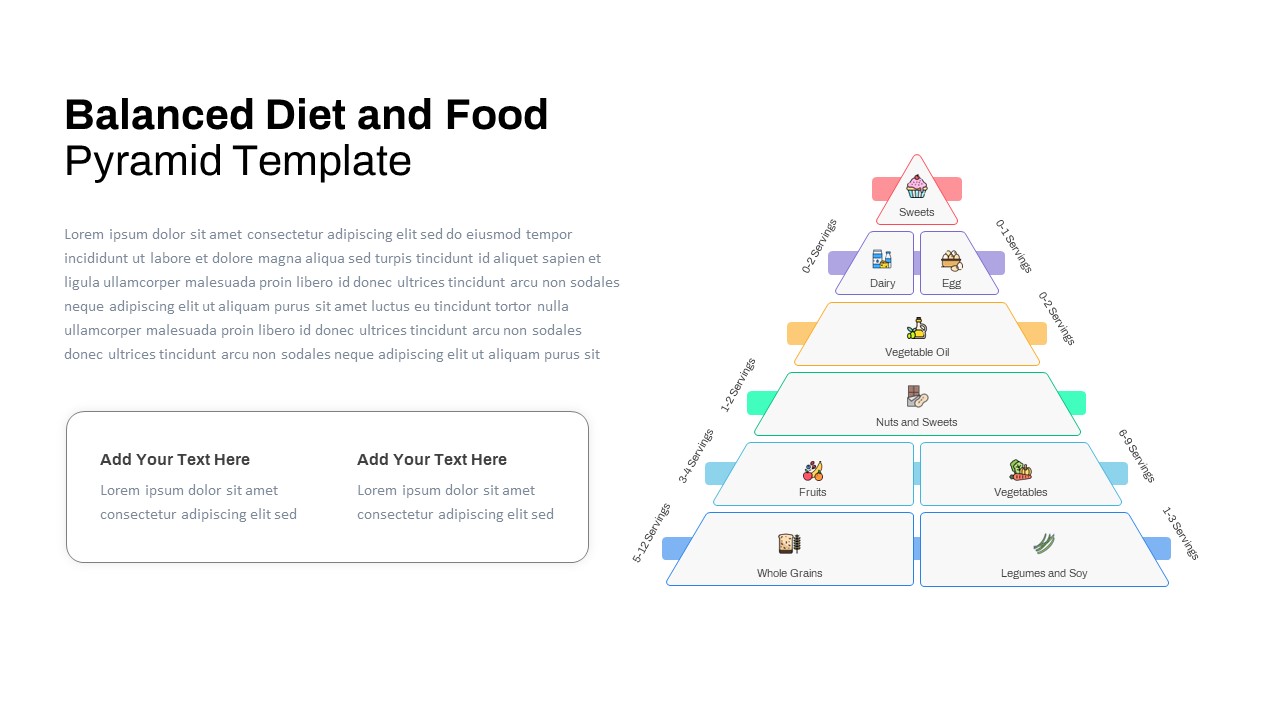
Free Balanced Diet Food Pyramid Template
Pyramid
Free
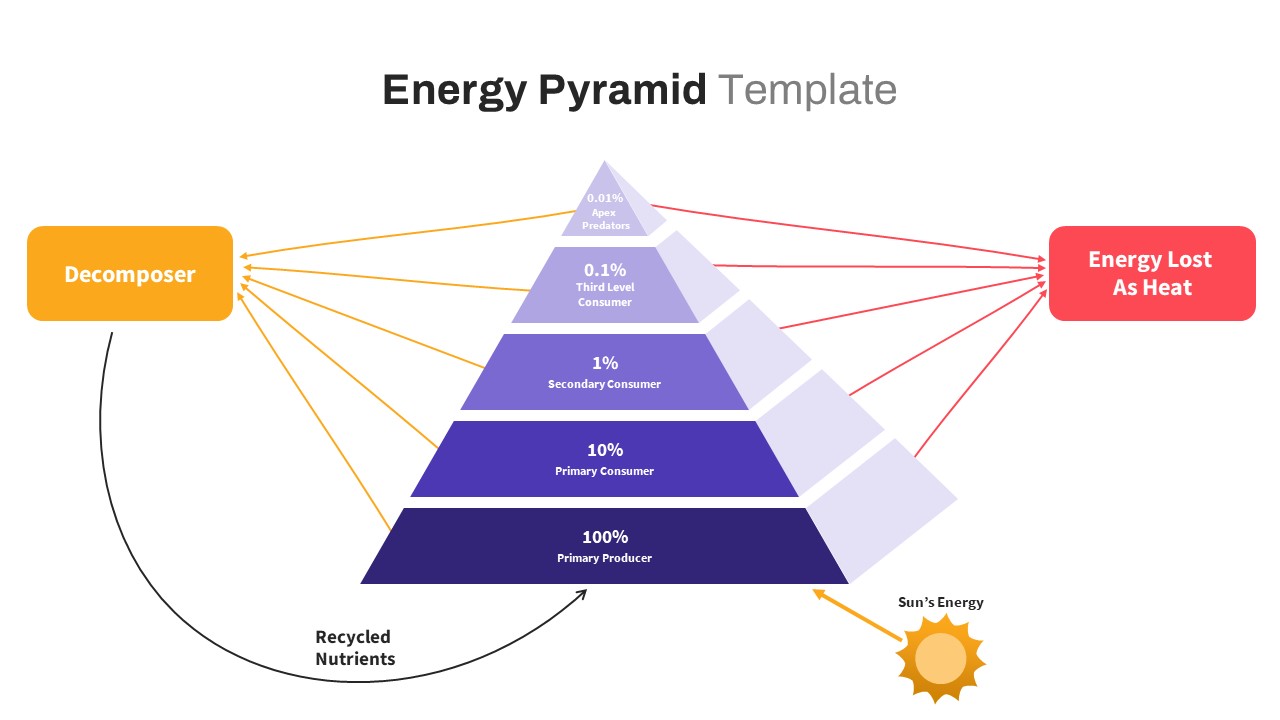
Free Energy Pyramid Template
Pyramid
Free
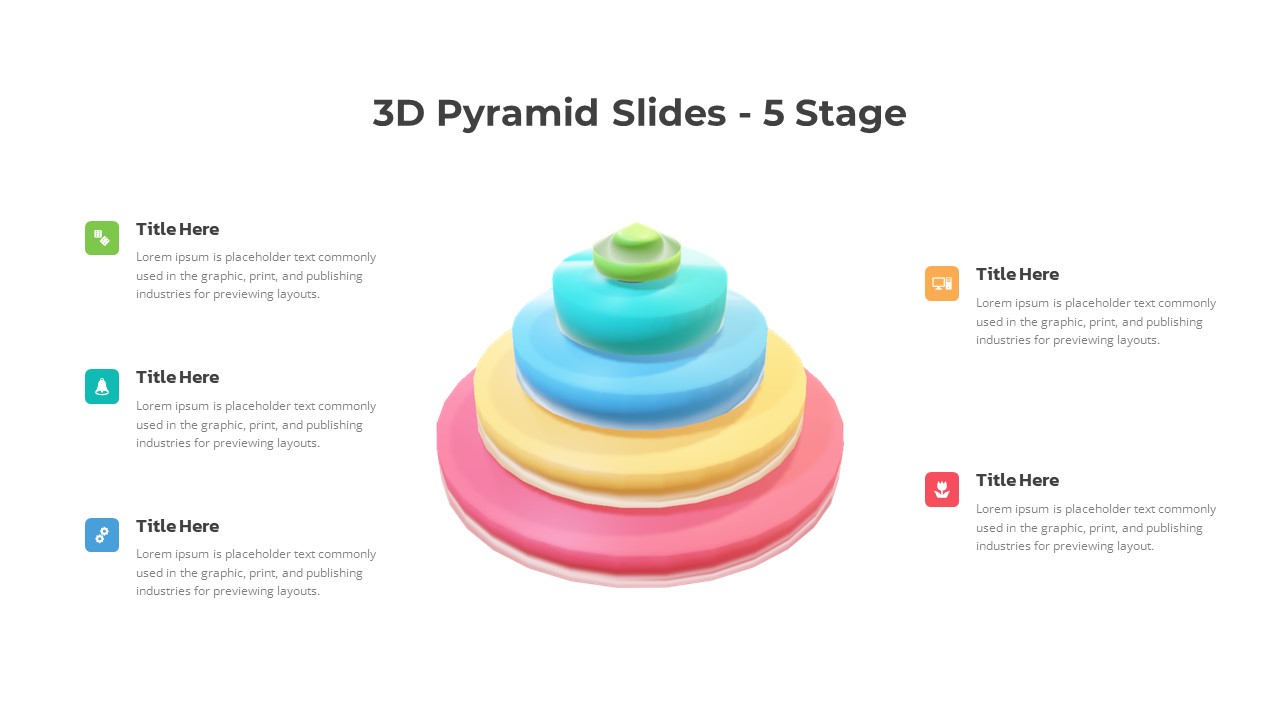
5 Stage 3D Pyramid Slides
Pyramid
Premium
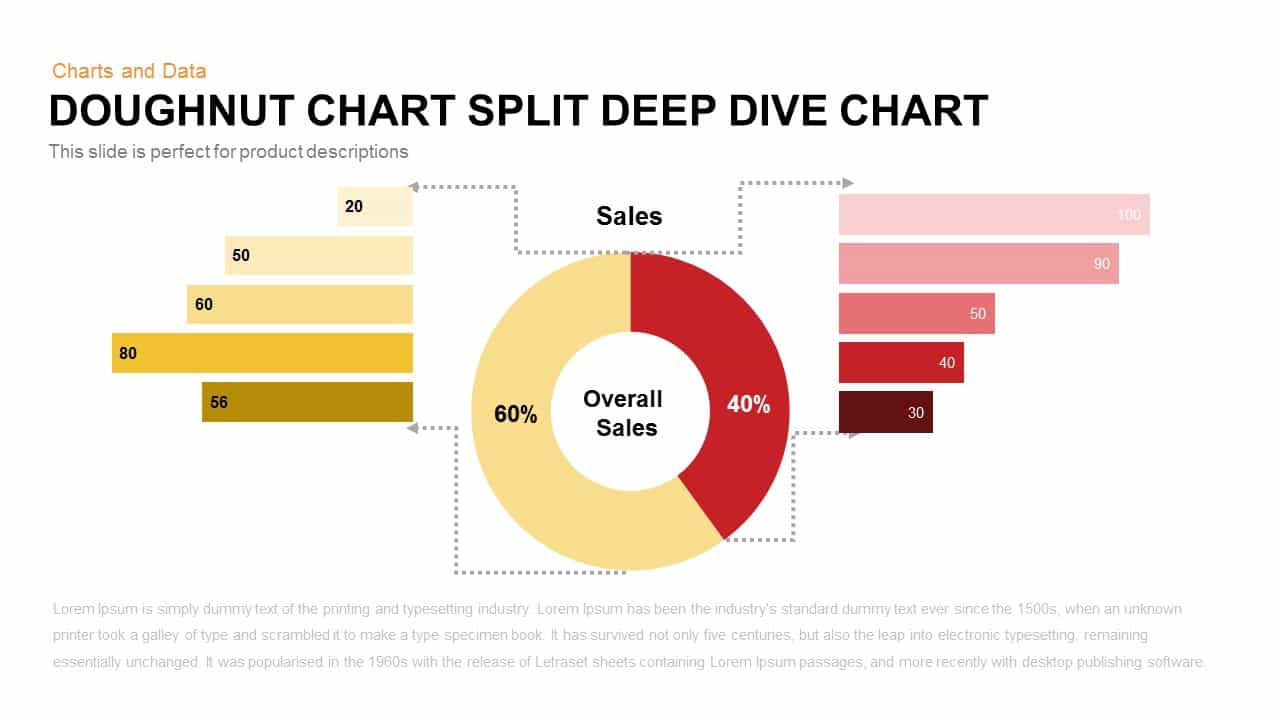
Donut Chart Split Deep Dive Chart Template For PowerPoint and Keynote
Keynote Templates
Premium
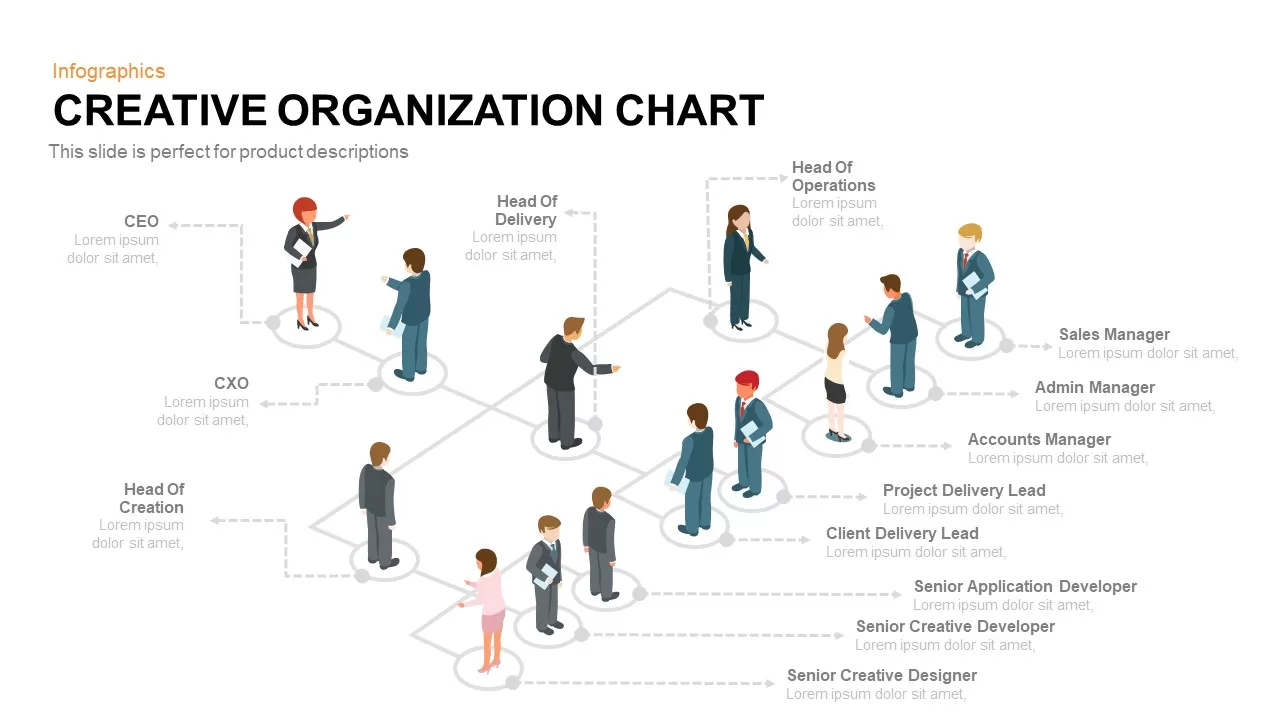
Creative Isometric Organization Chart PowerPoint Template and Keynote template
Keynote Templates
Premium
Circle Chart Infographic PowerPoint Template and Keynote
Infographic
Premium
Creative Infographic SWOT Chart PowerPoint Template and Keynote Slide
Business Models
Premium
Donut Split Analysis Chart PowerPoint Template and Keynote Slide
Infographic
Premium
Multi level Donut Chart Template for PowerPoint and Keynote
PowerPoint Charts
Premium
3D Bar Chart Infographics Template for PowerPoint and Keynote
Diagrams
Premium
Gantt Chart Powerpoint and Keynote template
PowerPoint Charts
Premium
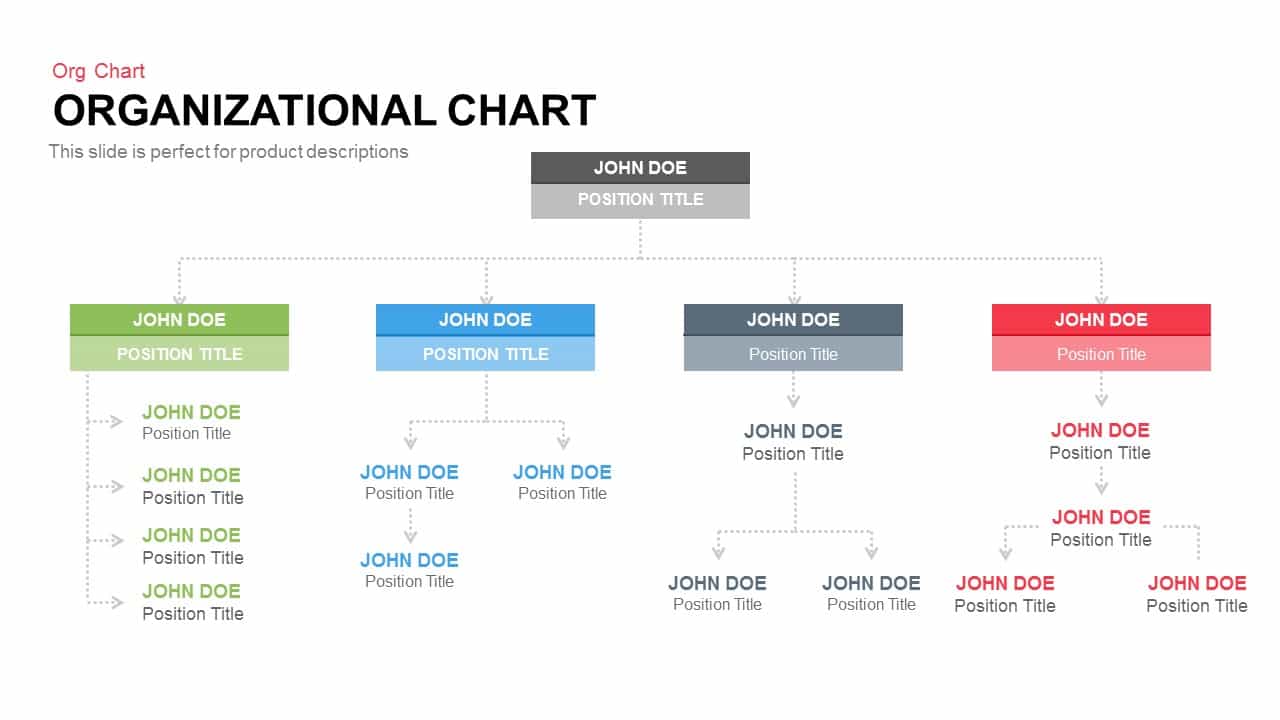
Organizational Chart PowerPoint Template and Keynote Slide
Keynote Templates
Premium

Gantt Chart PowerPoint Template
Keynote Templates
Premium

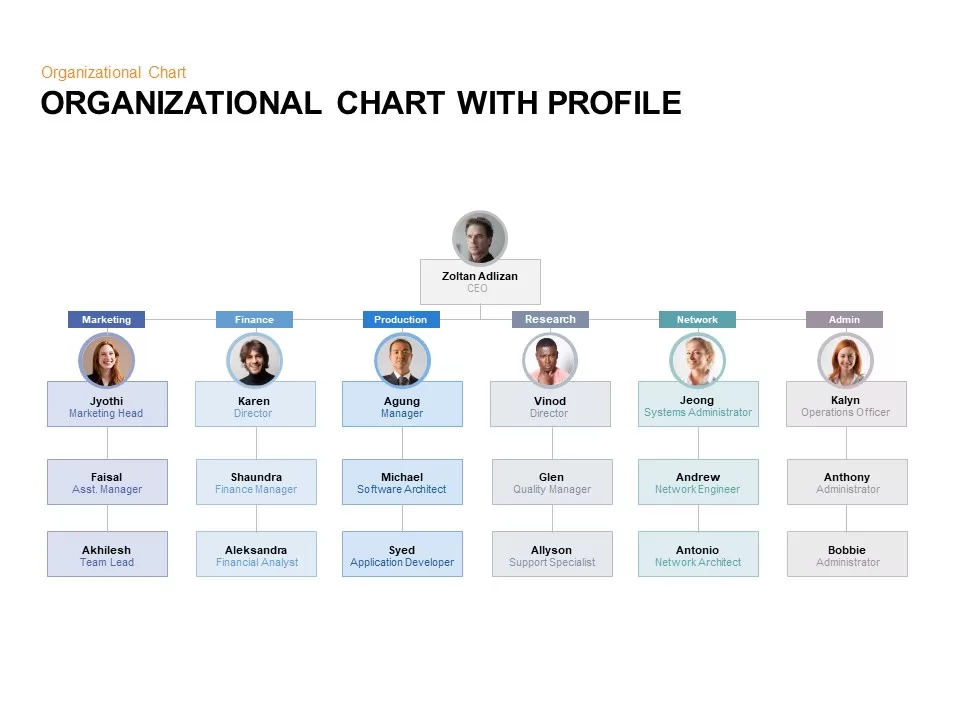
Organizational Chart with Profile PowerPoint and Keynote Template
Org Charts
Premium

Cone Chart Data PowerPoint Template
Column and Bar chart
Premium
Tornado Chart PowerPoint template and keynote Slide
Diagrams
Premium
Radar Chart Product Comparison PowerPoint Template
Business Models
Premium
Distracting Factors at Work – Bar Chart Template for PowerPoint & Keynote
Column and Bar chart
Premium
Car Companies Sales Pie Chart Template for PowerPoint & Keynote
Column and Bar chart
Premium
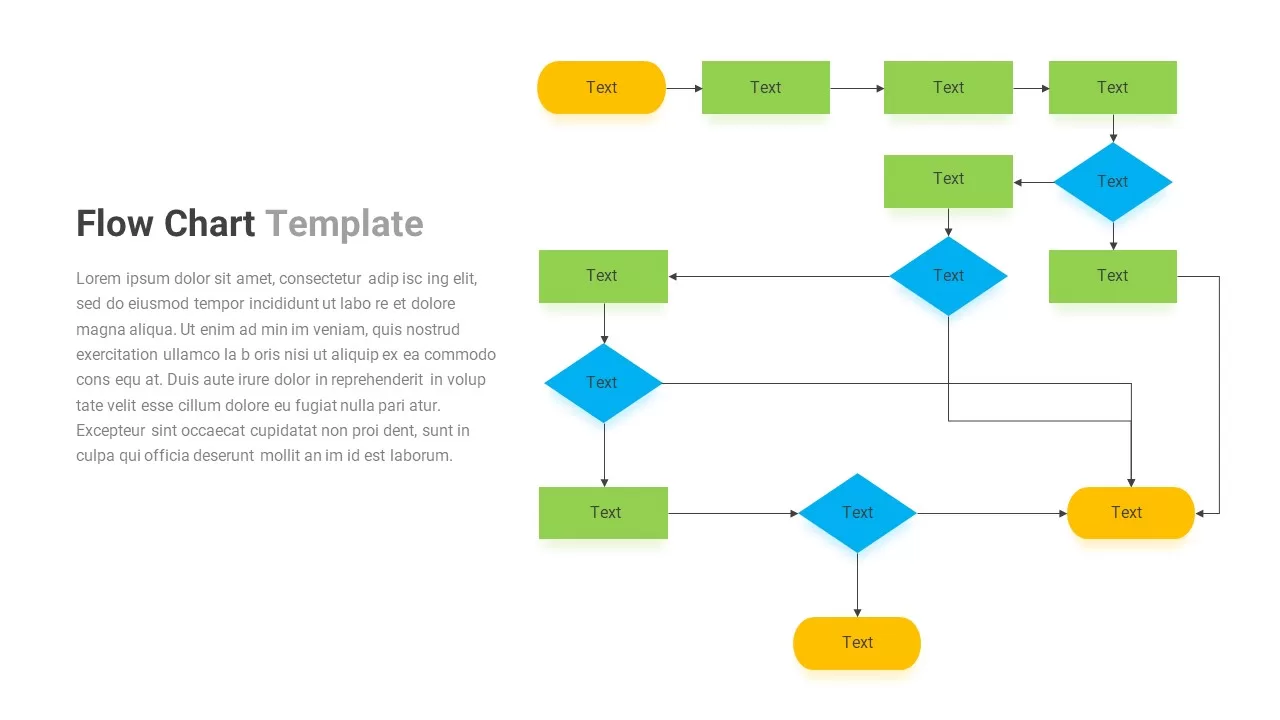
Flow Chart PowerPoint Template
Flow Charts
Premium
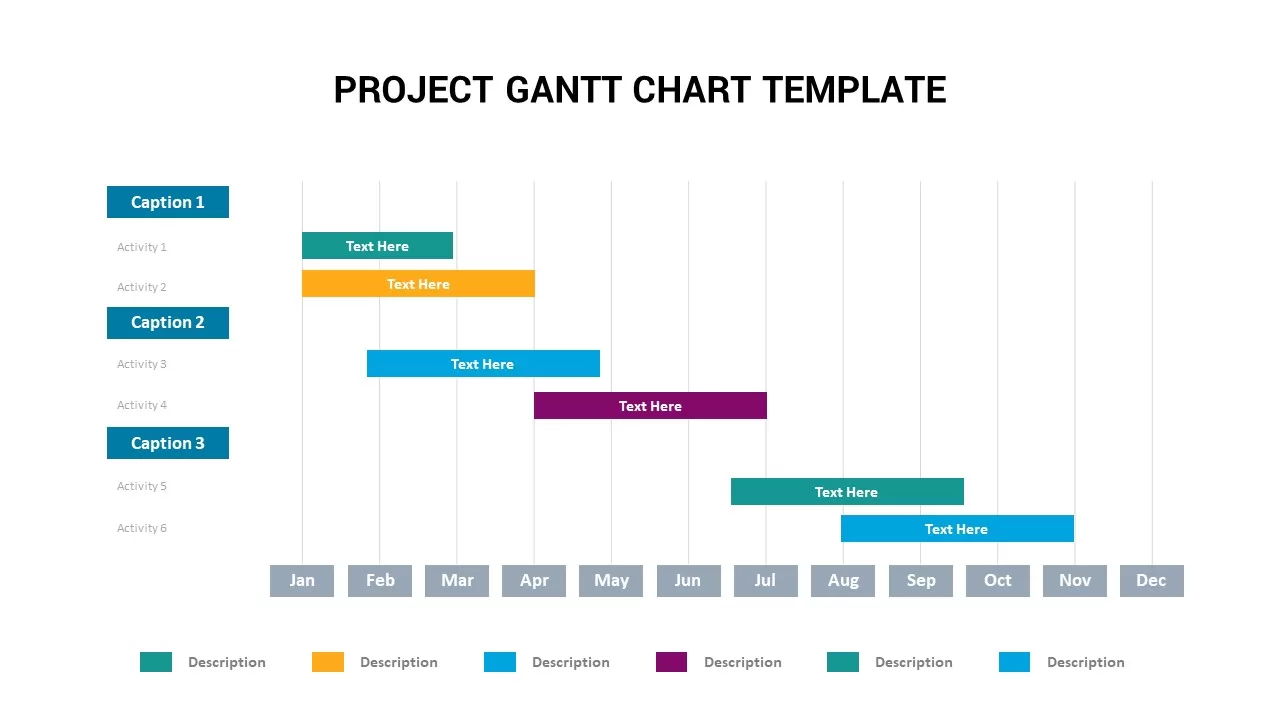
Project Gantt Chart Infographics PowerPoint Template
Infographic
Premium
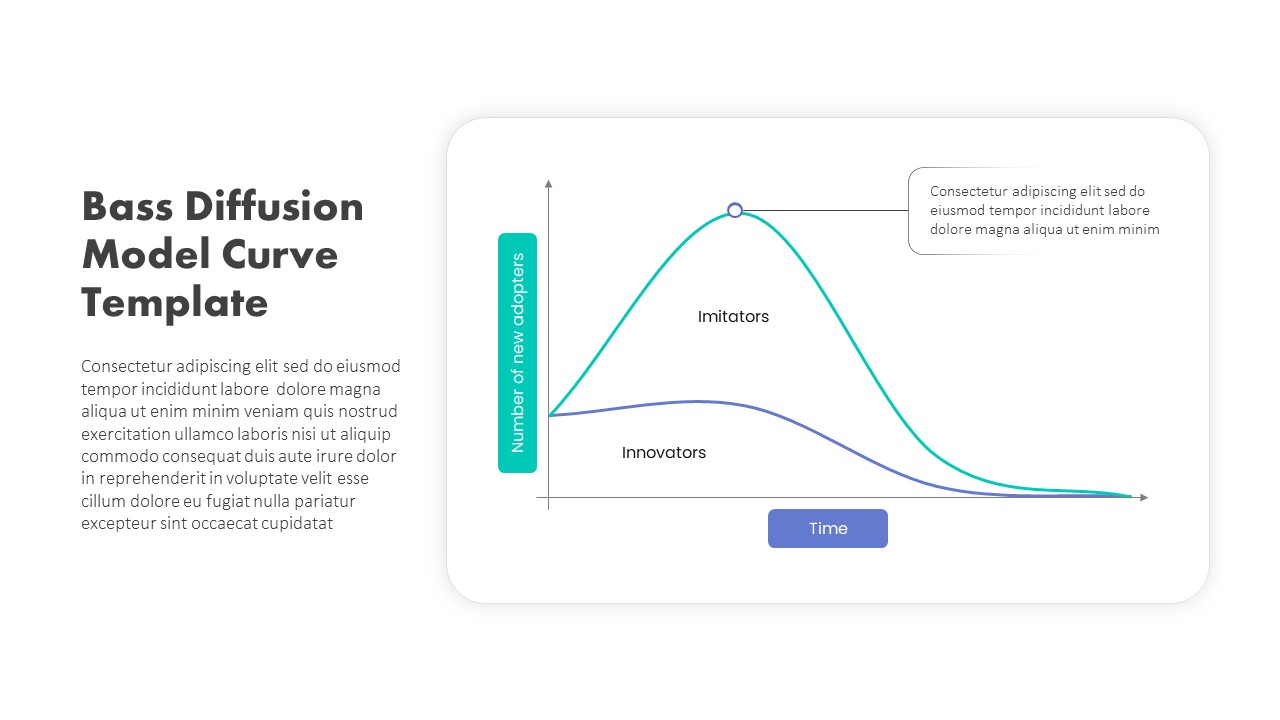
Bass Diffusion Model Chart PowerPoint Slide Template
PowerPoint Templates
Premium
Waffle Chart PowerPoint Template
PowerPoint Templates
Premium
Combination Chart PowerPoint Template
PowerPoint Charts
Premium
Clustered Column Chart PowerPoint Template
PowerPoint Charts
Premium
Simple Scatter Chart PowerPoint Template
PowerPoint Charts
Premium
100% Stacked Column Chart PowerPoint Template
Column and Bar chart
Premium
Data Over Time Line Chart PowerPoint Template
PowerPoint Charts
Premium
Wheel Chart PowerPoint Template
Circular Diagrams
Premium
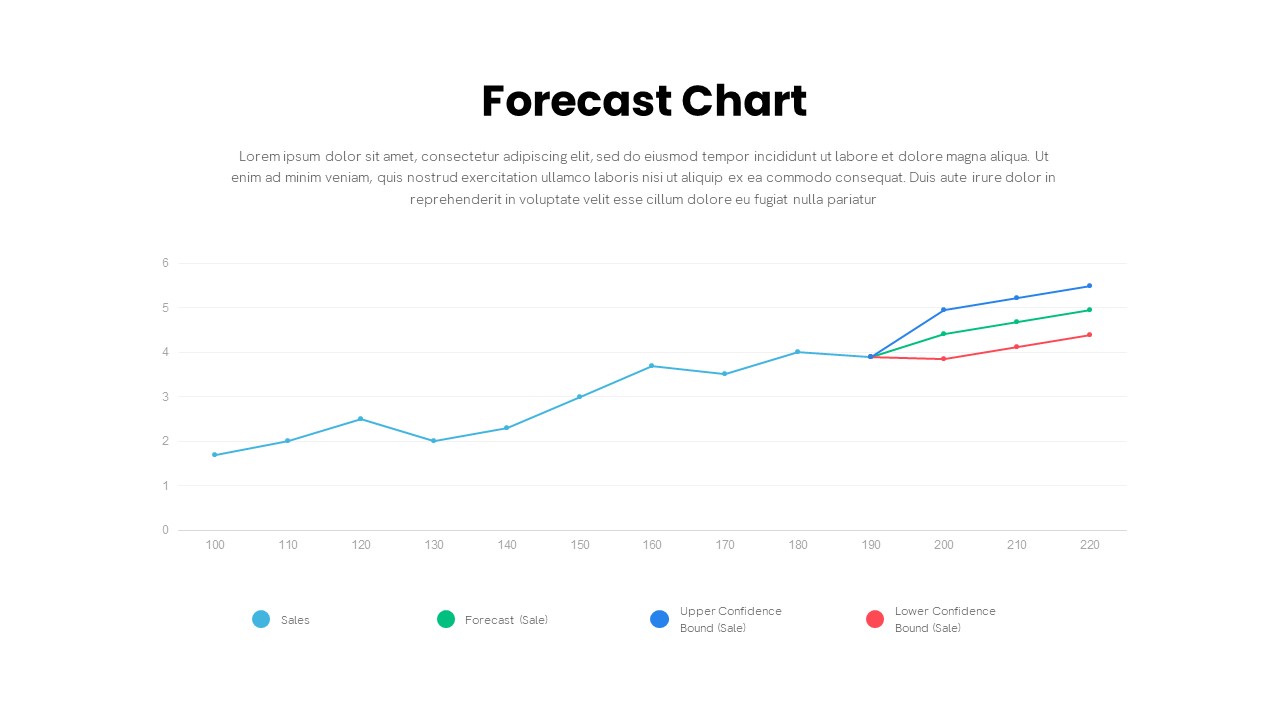
Forecast Chart PowerPoint Template
PowerPoint Charts
Premium
Evolution Line Chart PowerPoint Template
PowerPoint Templates
Premium
Multiple Line Chart PowerPoint Template
PowerPoint Charts
Premium
Animated Org Chart PowerPoint Template
Org Charts
Premium
Mirror Bar Chart PowerPoint Template
PowerPoint Templates
Premium
Clock Chart Template PowerPoint
Circular Diagrams
Premium
Waste Water Treatment Flow Chart PowerPoint Template
PowerPoint Templates
Premium
Progress Bar Chart PowerPoint Template
PowerPoint Templates
Premium
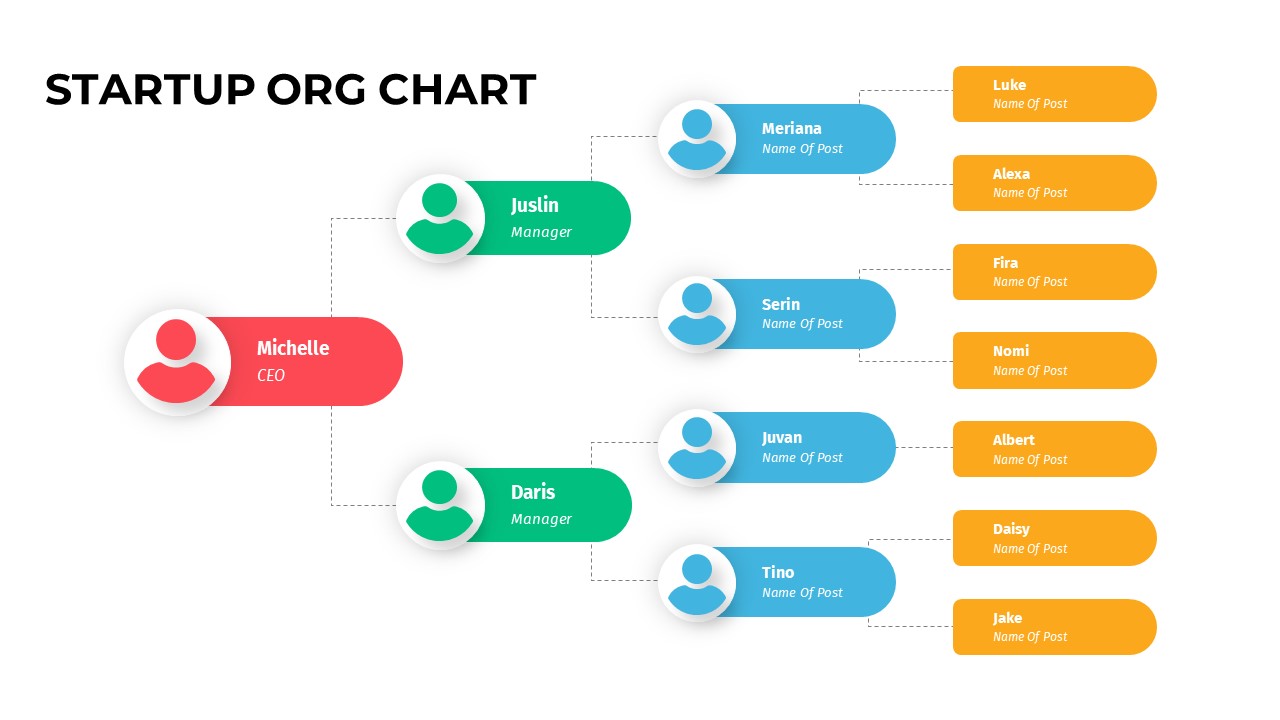
Startup Org Chart PowerPoint Template
Org Charts
Premium
Area Chart PowerPoint Template
PowerPoint Charts
Premium
Proportional Area Chart PowerPoint Template
PowerPoint Templates
Premium
Financial Analysis Line Chart PowerPoint Template
PowerPoint Templates
Premium