Heinrich Safety Pyramid Theory PPT & Google Slides


Heinrich Pyramid Theory Template & Accident Triangle
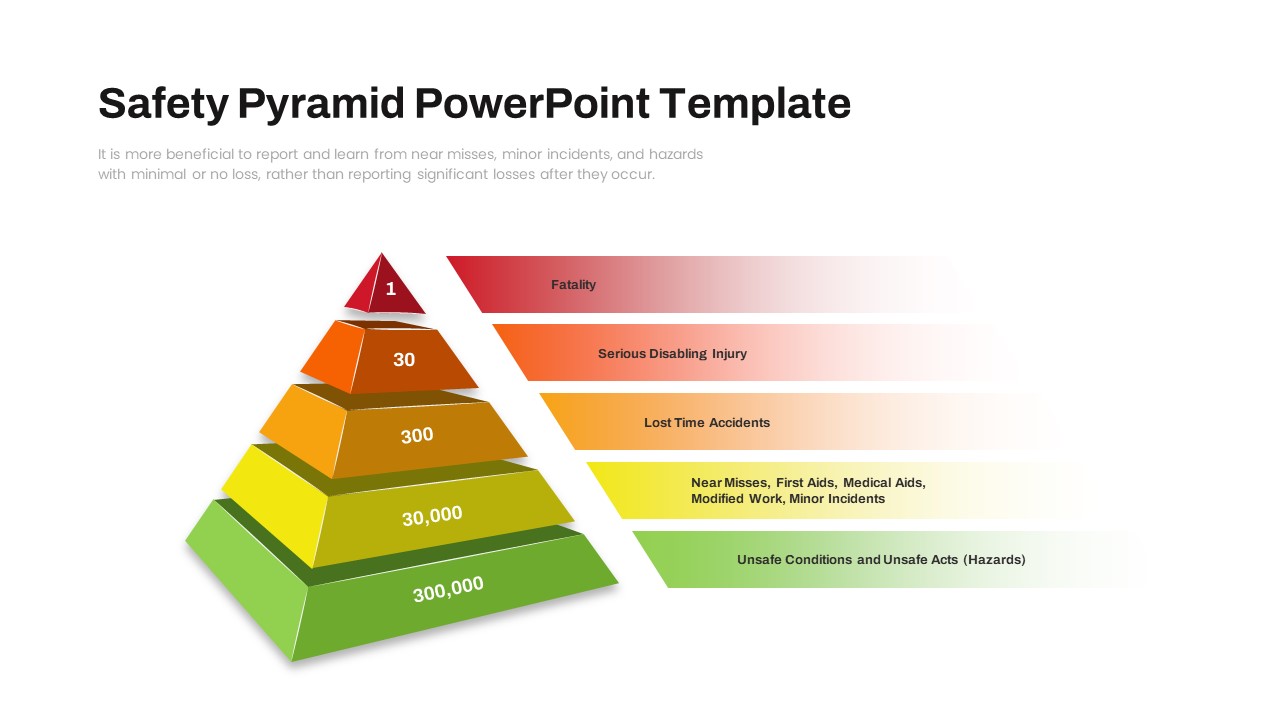
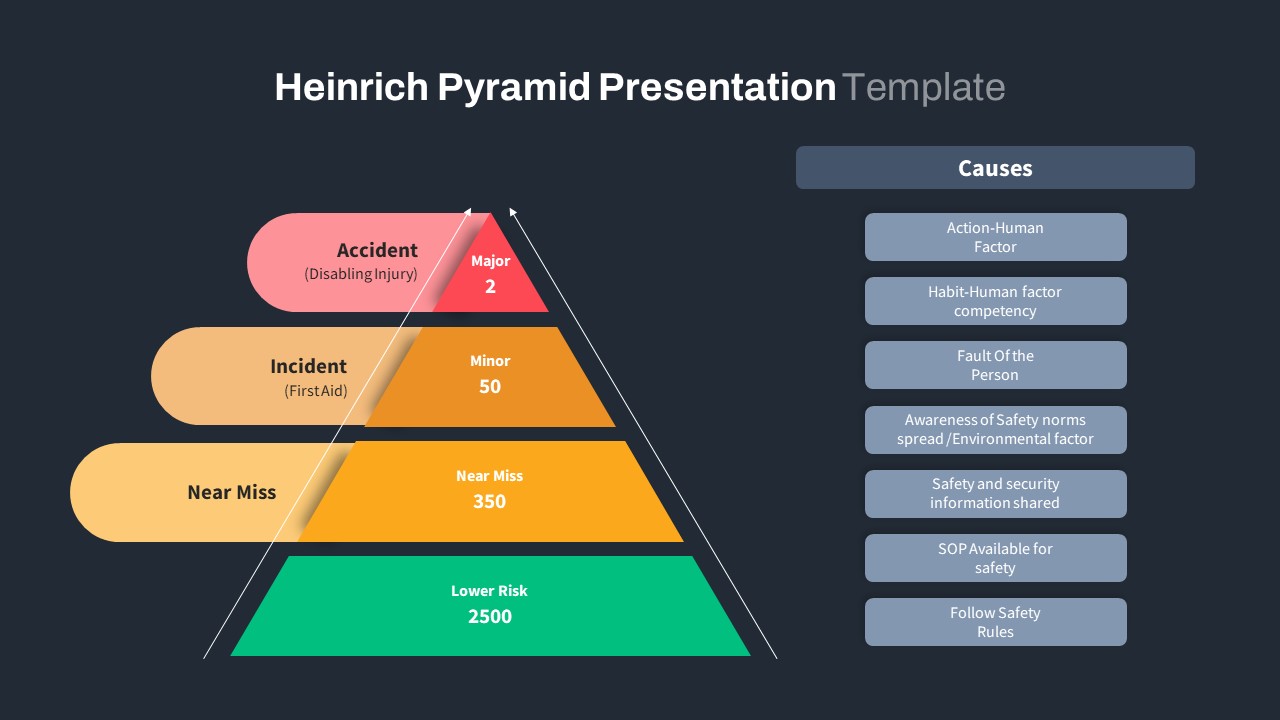
Presenting organizational risk statistics, workplace hazard classifications, or industrial incident prevention models requires an authoritative visual framework. This Heinrich Safety Pyramid Theory PPT template delivers a highly structured vector solution to illustrate the classic 300-29-1 accident ratio model. The safety pyramid infographic is a professional step concept framework designed to showcase inherent risk analysis and industrial accident mitigation strategies. Serving as an essential tool for Environment, Health, and Safety (EHS) managers, safety officers, and operations leads.
This comprehensive Heinrich pyramid template illustrates Herbert William Heinrich’s classic 1-29-300 accident ratio theory. This structural visual layout helps safety teams run effective site briefings, annual audits, and toolbox talks to underscore the deep correlation between unsafe acts, near misses, minor injuries, and major operational fatalities.
What is the Heinrich Safety Pyramid theory?
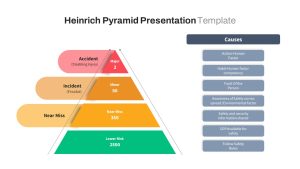
The Heinrich Safety Pyramid, also known as the Accident Triangle or Bird Triangle, is a foundational workplace safety concept proposed by Herbert William Heinrich in 1931. The theory states that a predictable relationship exists between serious accidents, minor injuries, and near misses. Specifically, his data showed that for every 1 major disabling injury, there are 29 minor injuries and 300 near misses stemming from unsafe acts.
Where to Use this Heinrich Pyramid Theory Template
- Workplace Safety Onboarding Seminars: Use the tiered triangular charts to explain the critical importance of documenting near-miss behaviors to new facility employees clearly.
- Corporate EHS Compliance Briefings: Provide executive leadership and insurance steerage committees with a clear, standardized analysis of recent company health performance data.
- Industrial Risk Mitigation Workshops: Leverage the integrated fishbone alternatives and incident timelines to execute a systematic root-cause review of facility operations.
Download this Heinrich’s triangle template today to eliminate formatting bugs and deliver a polished risk management presentation to your steering committee.
Login to download this file

Item ID
SB04150
Related Templates

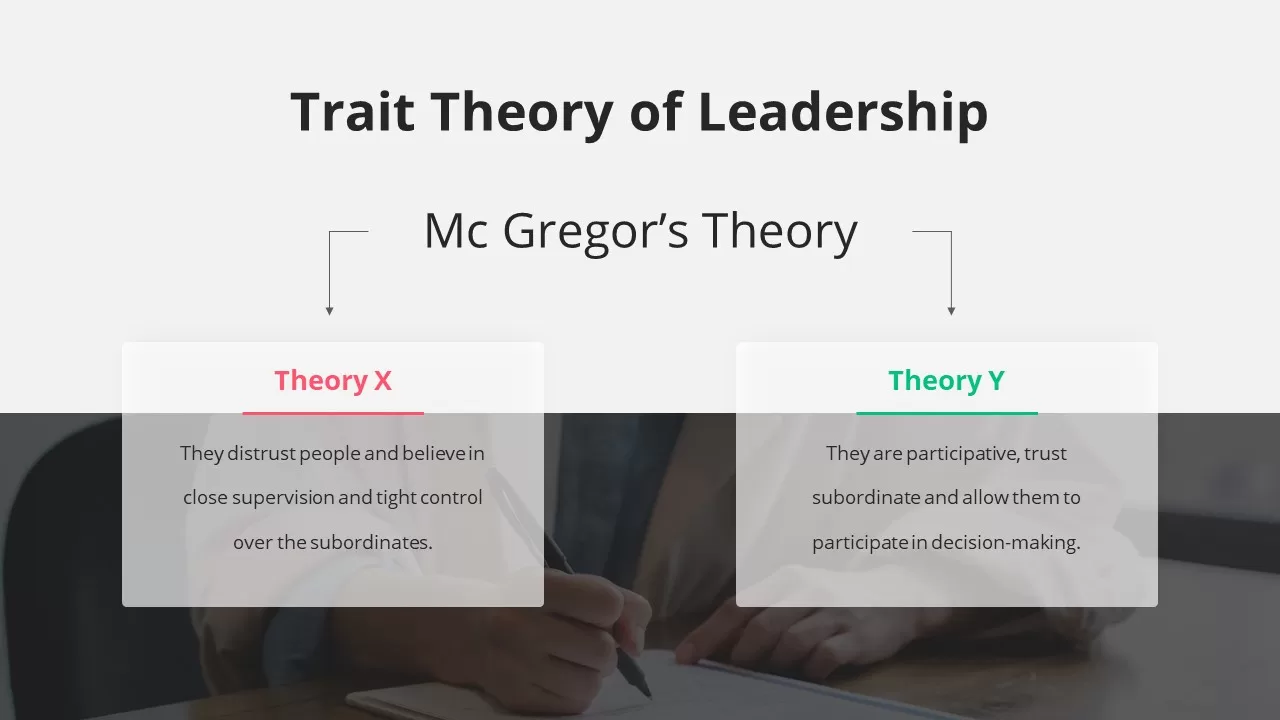
Theory X and Theory Y Comparison Template for PowerPoint & Google Slides
Comparison
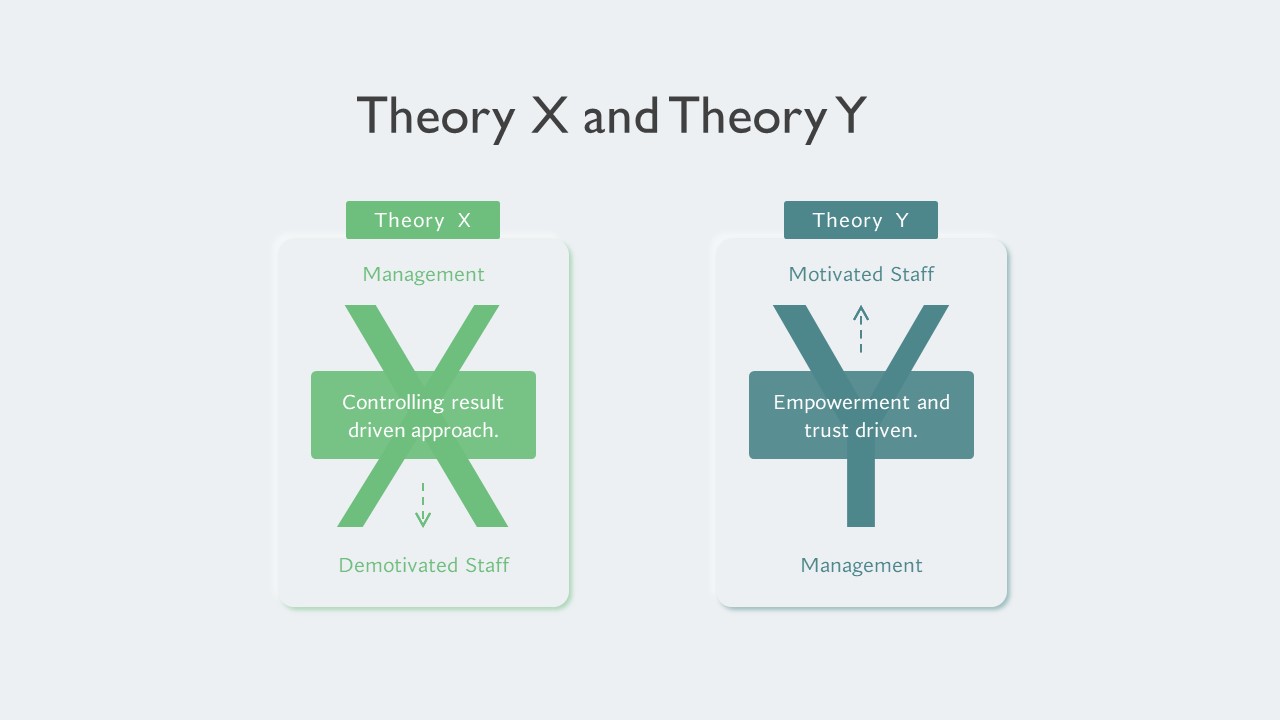
McGregor’s Theory X and Theory Y infographic Template for PowerPoint & Google Slides
Business Strategy
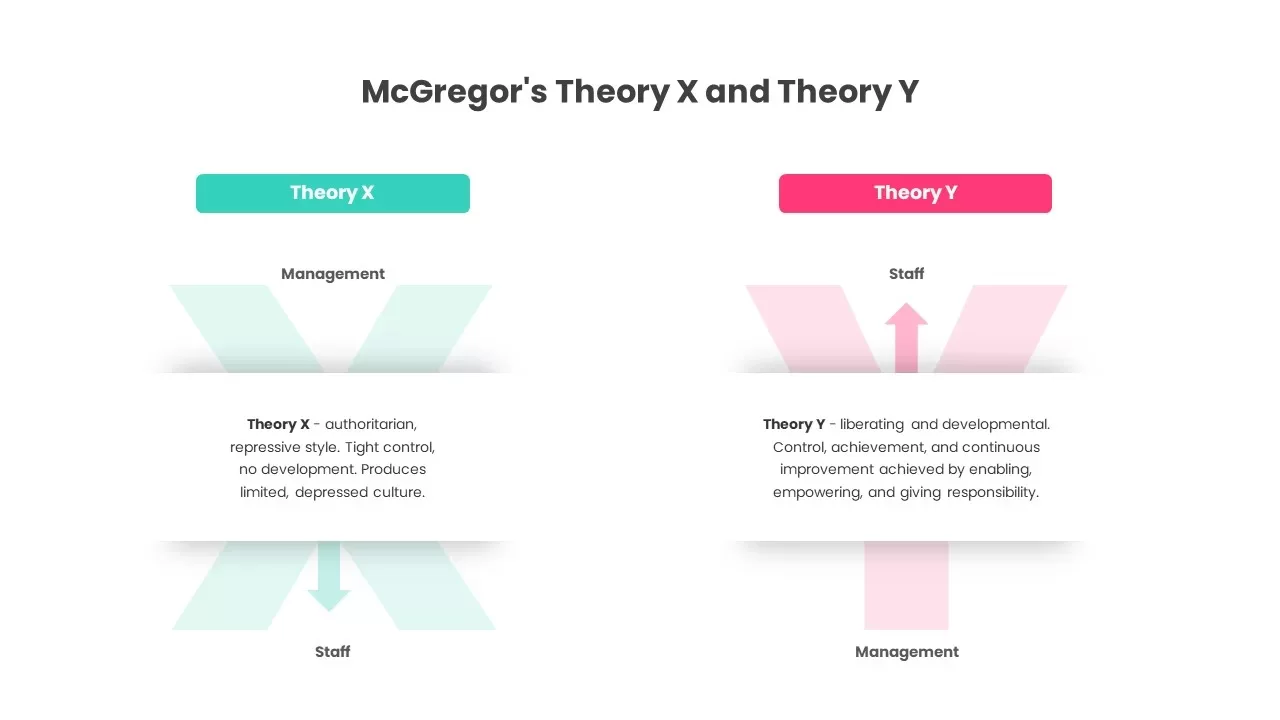
McGregor’s Theory X vs Theory Y Template for PowerPoint & Google Slides
Comparison
Safety Pyramid PowerPoint Template
Risk Management
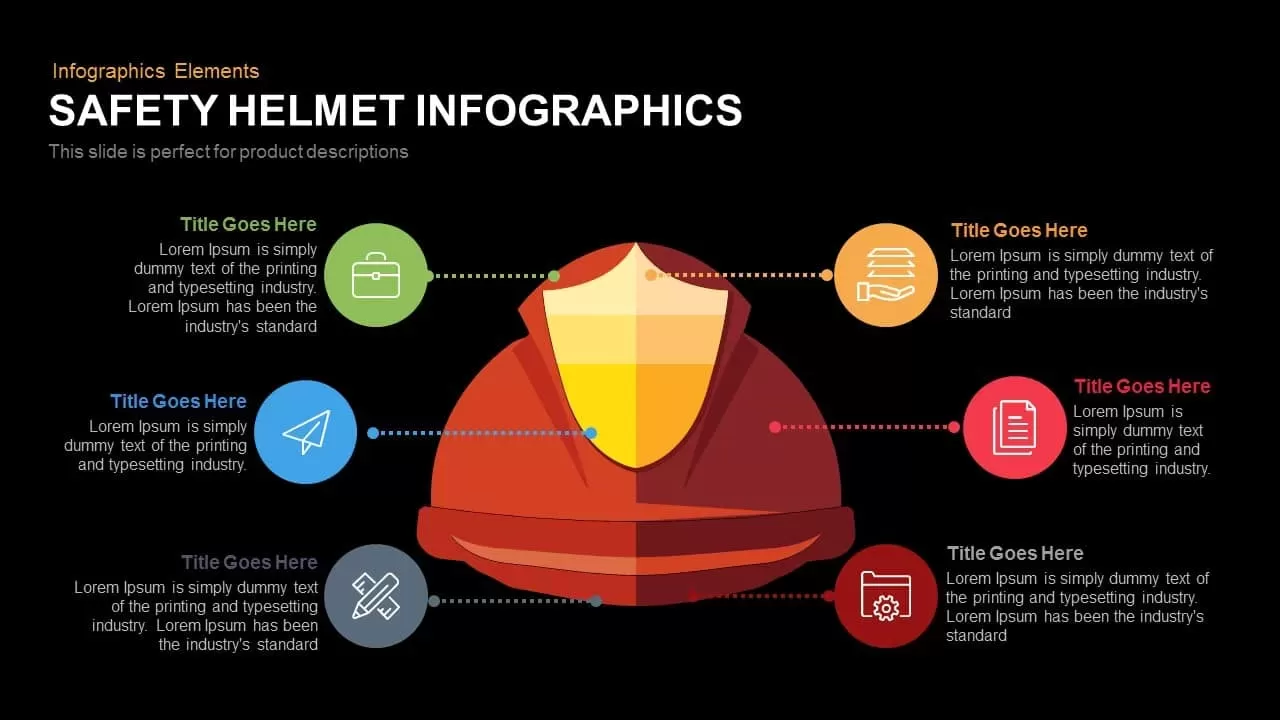
Safety Helmet Infographics Template for PowerPoint & Google Slides
Infographics
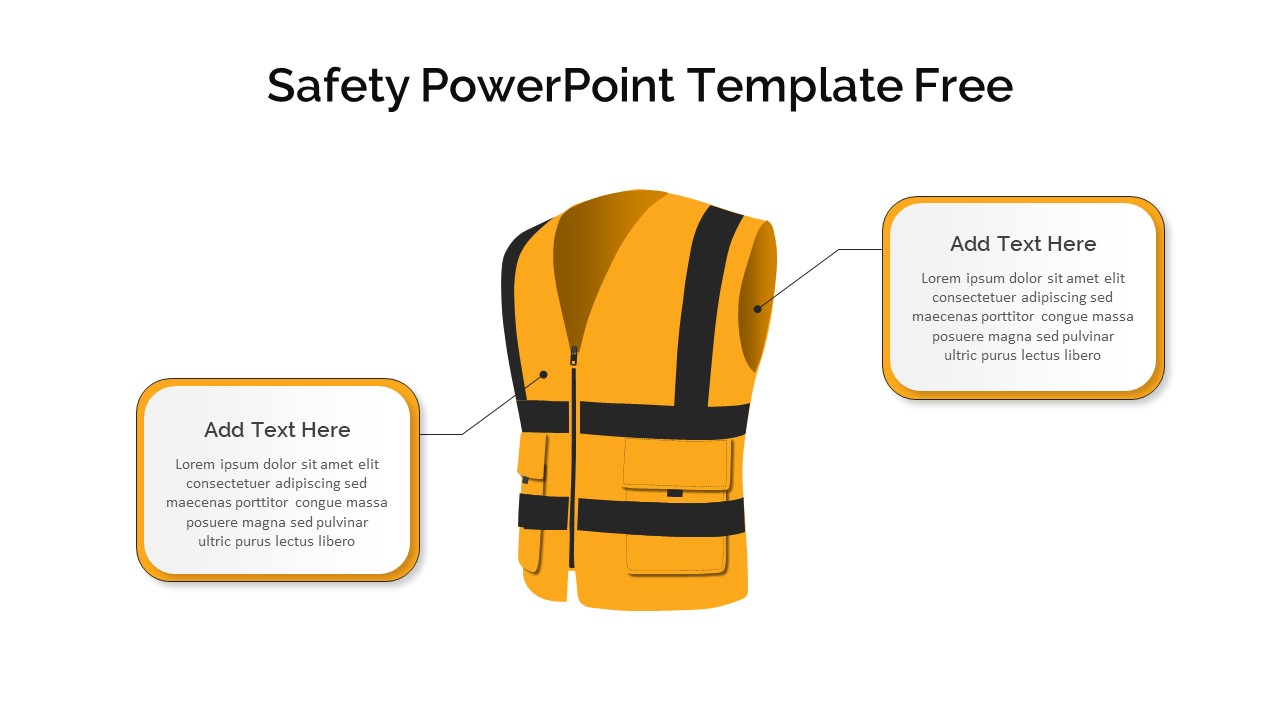
Free 4 Safety Equipment Infographic Pack Template for PowerPoint & Google Slides
Pitch Deck
Free
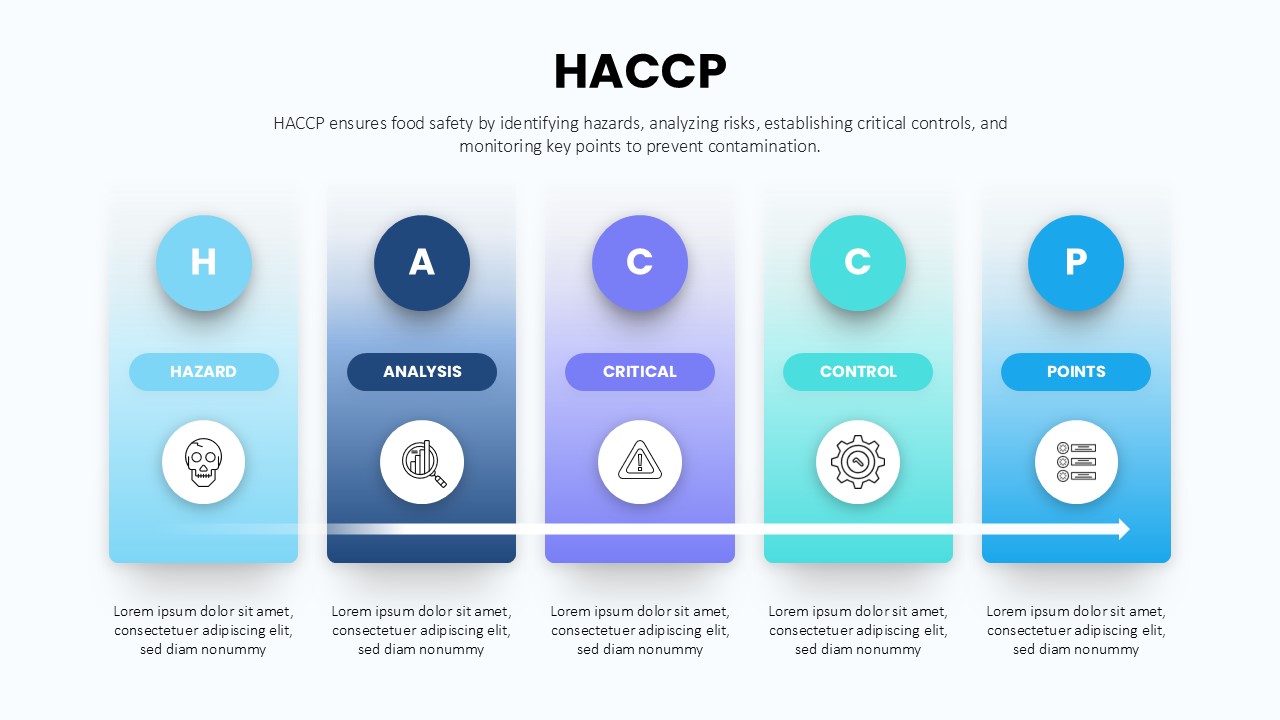
HACCP 5-Step Food Safety Process Diagram Template for PowerPoint & Google Slides
Process
5 Rights of Medication Safety Template for PowerPoint & Google Slides
Health
Work Safety PowerPoint Template
Risk Management

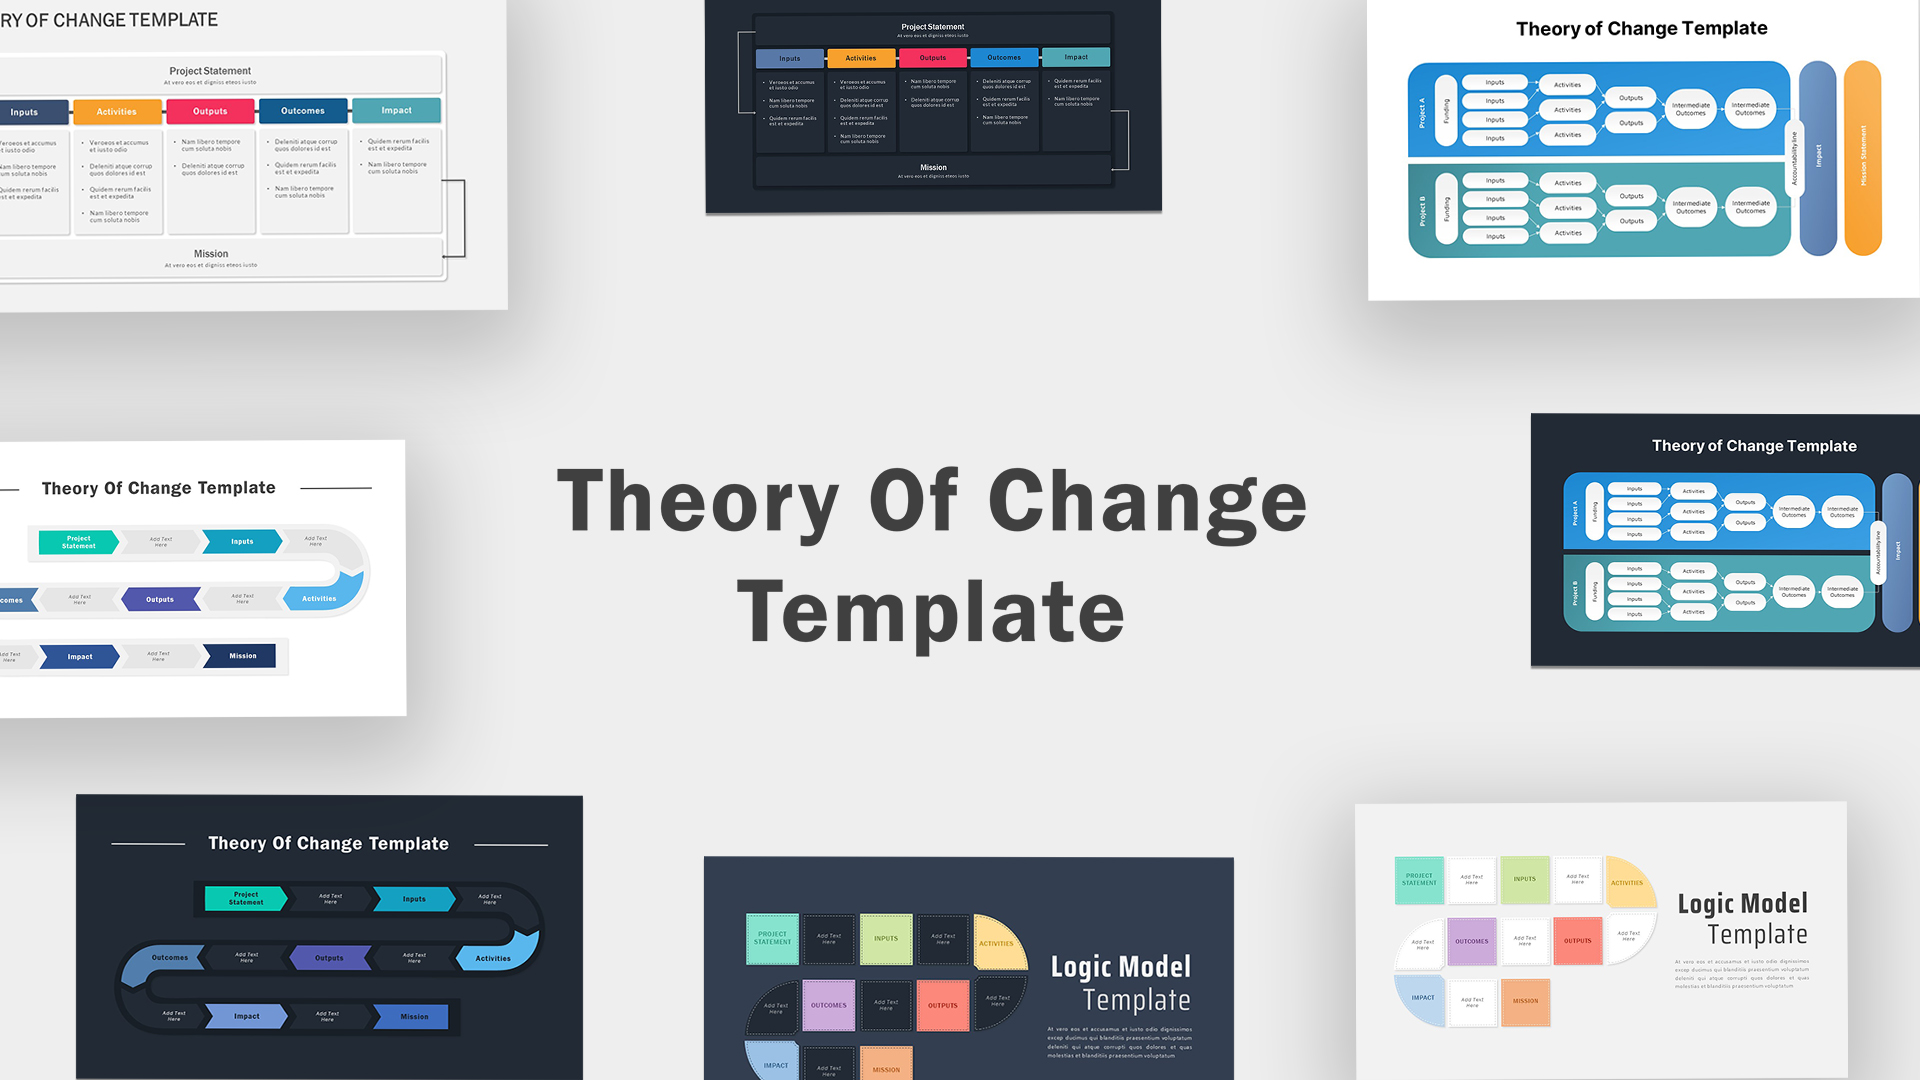
Theory Of Change Template PPT Slide
Process
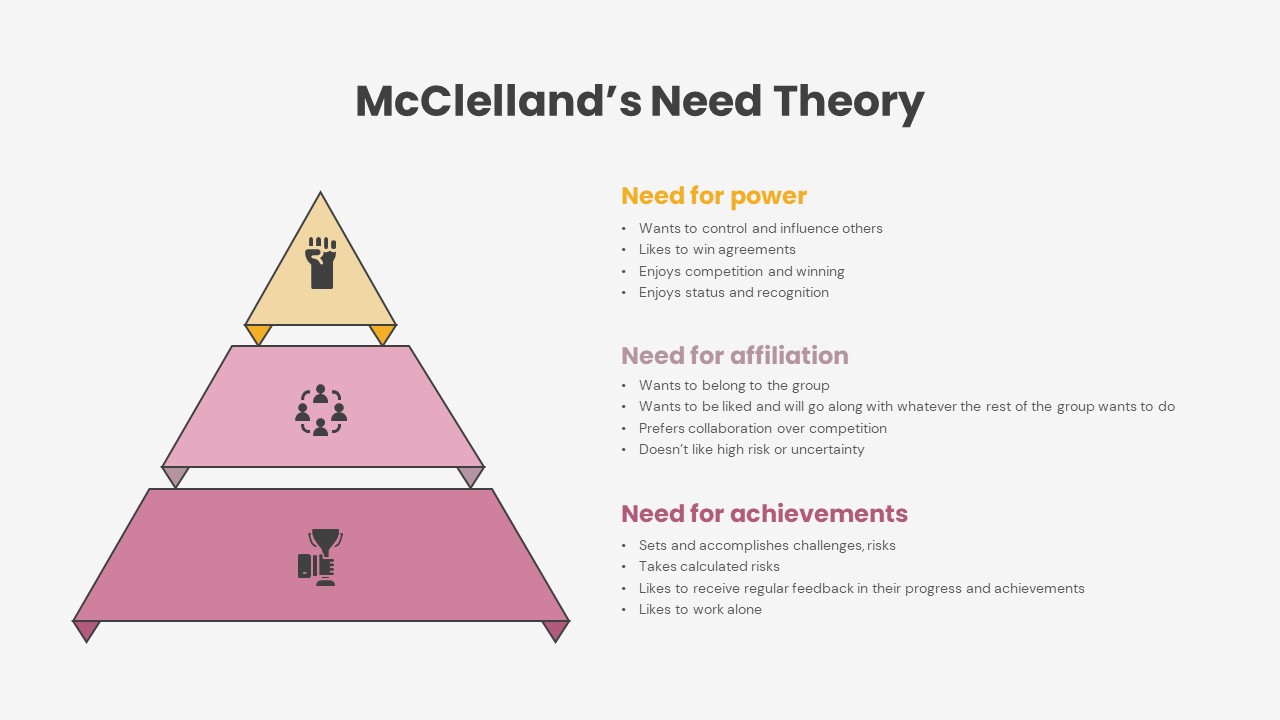
McClelland Theory of Motivation PPT
Pyramid
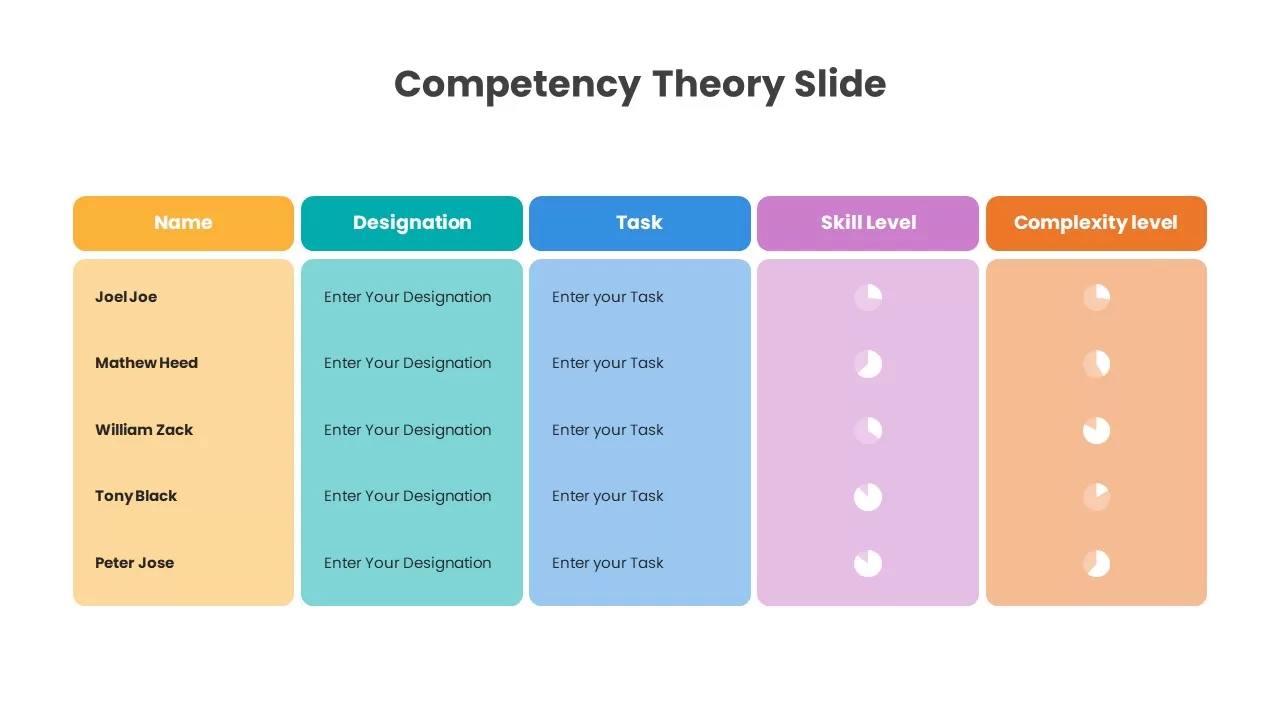
Competency Theory Slide for PowerPoint & Google Slides
Employee Performance
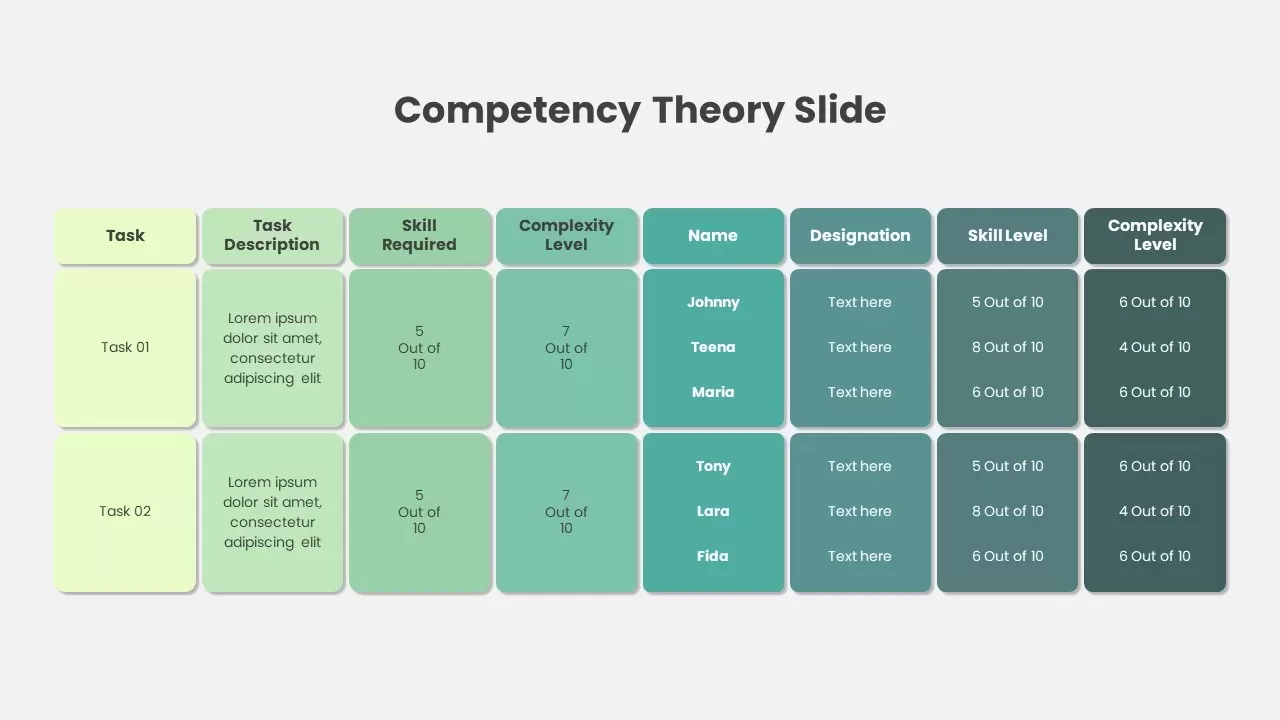
Competency Theory Slide for PowerPoint & Google Slides
Employee Performance
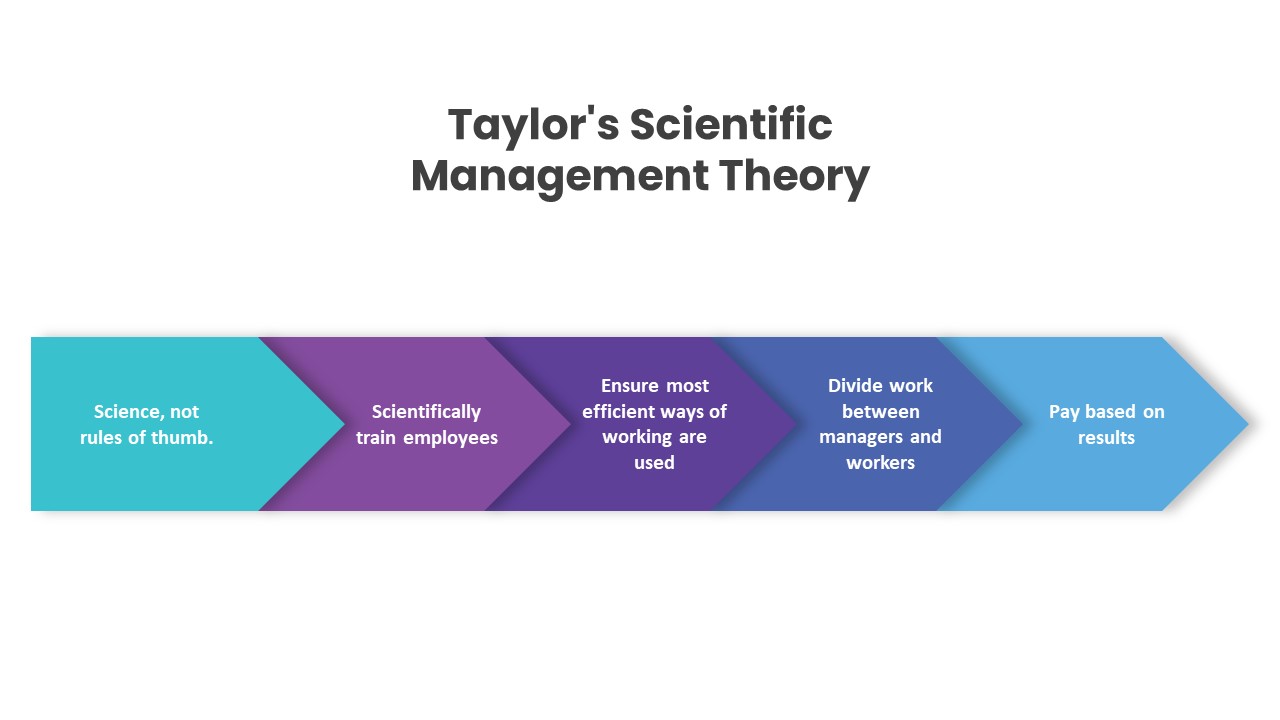
Taylor’s Scientific Management Theory PPT & Google Slides
Process
Incentive Theory of Motivation Diagram Template for PowerPoint & Google Slides
Employee Performance
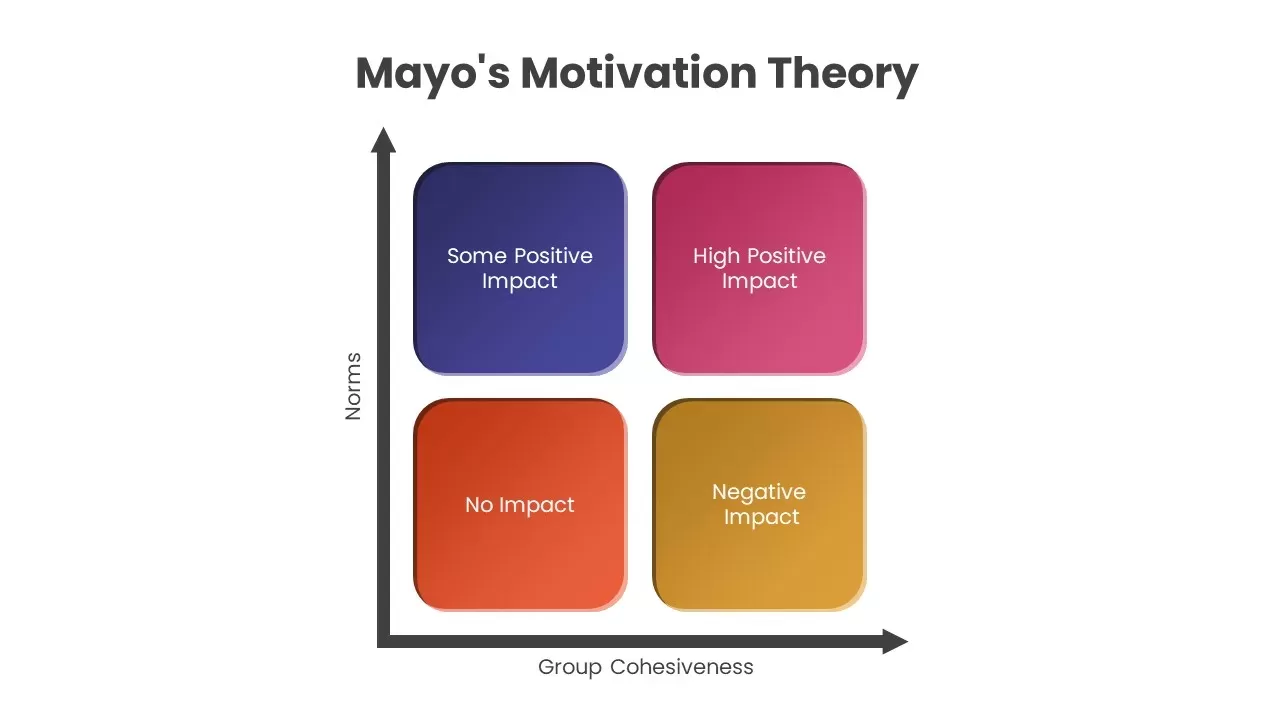
Mayo’s Motivation Theory Diagram Template for PowerPoint & Google Slides
Comparison
Adam’s Equity Theory Scale Comparison Template for PowerPoint & Google Slides
Comparison
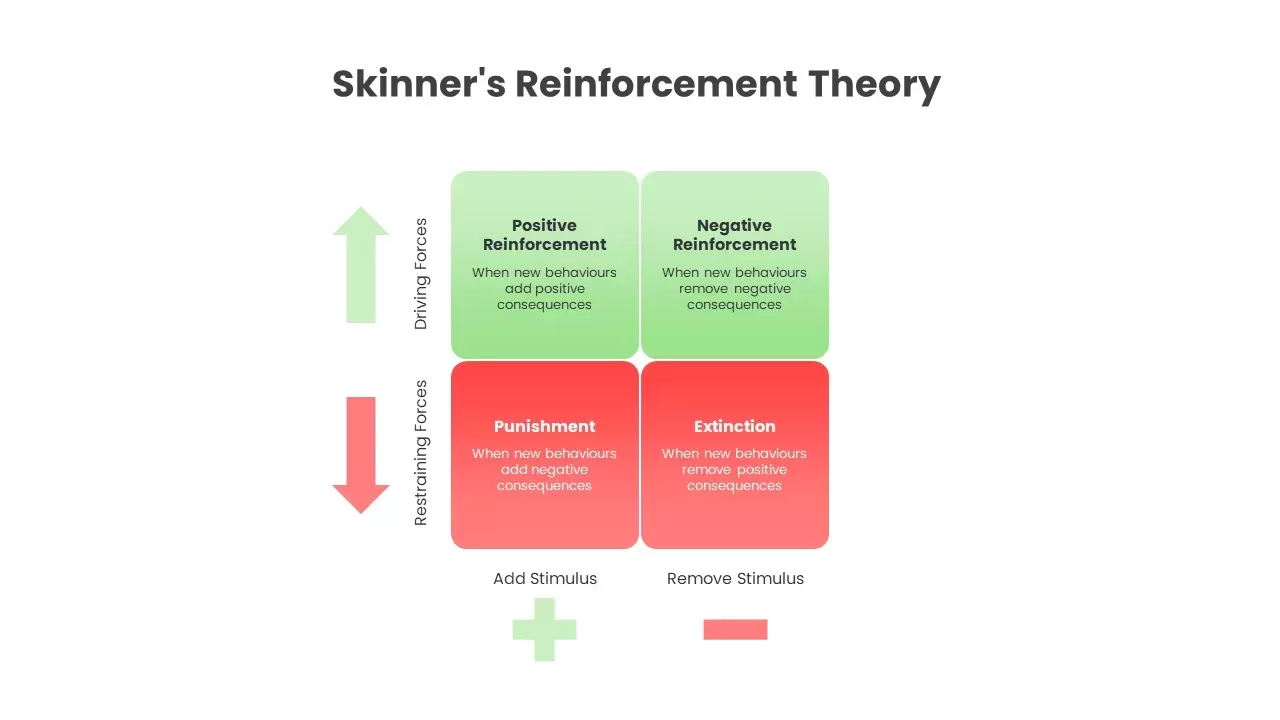
Skinner’s Reinforcement Theory PPT & Google Slides
Comparison
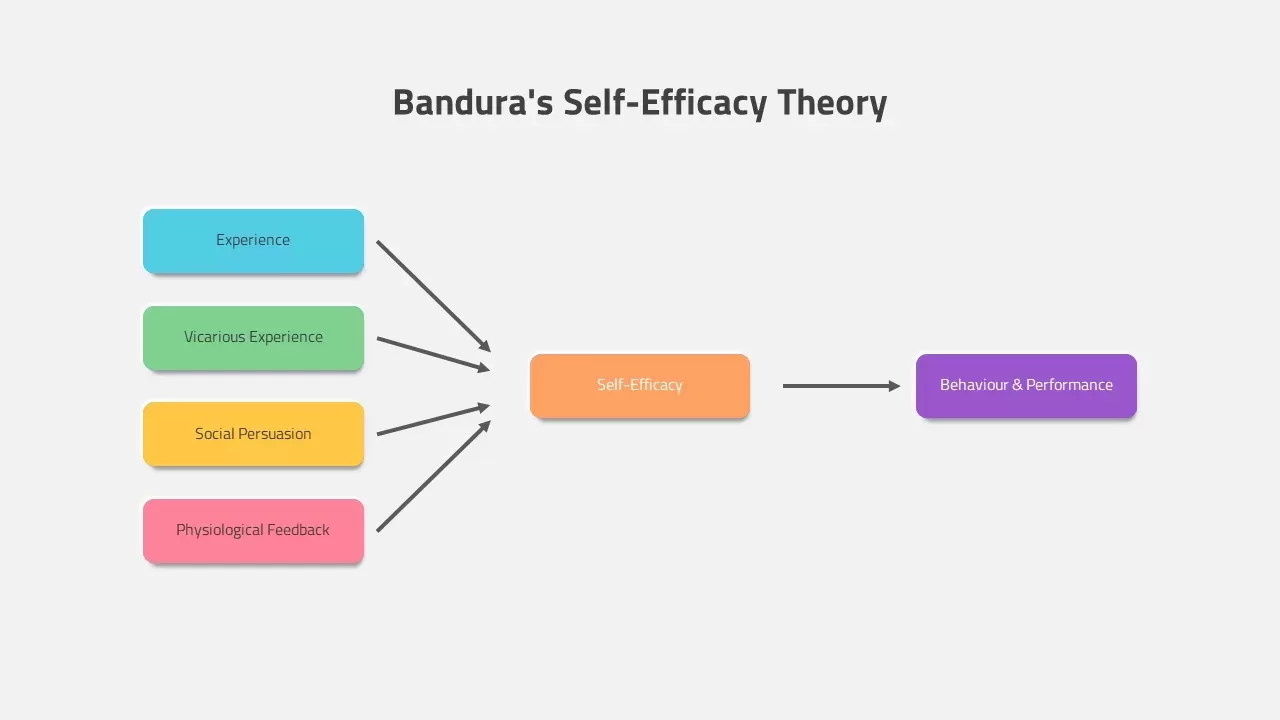
Bandura’s Self-Efficacy Theory Template for PowerPoint & Google Slides
Process
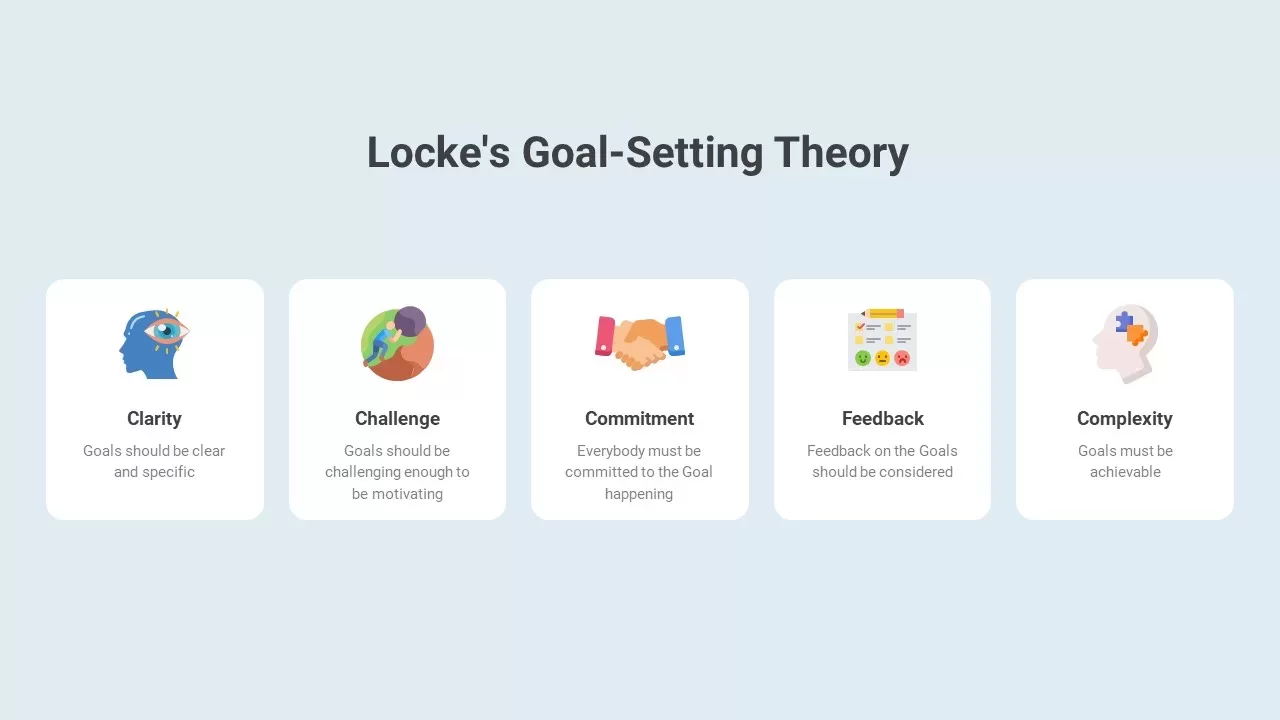
Locke’s Goal-Setting Theory Infographic Template for PowerPoint & Google Slides
Goals
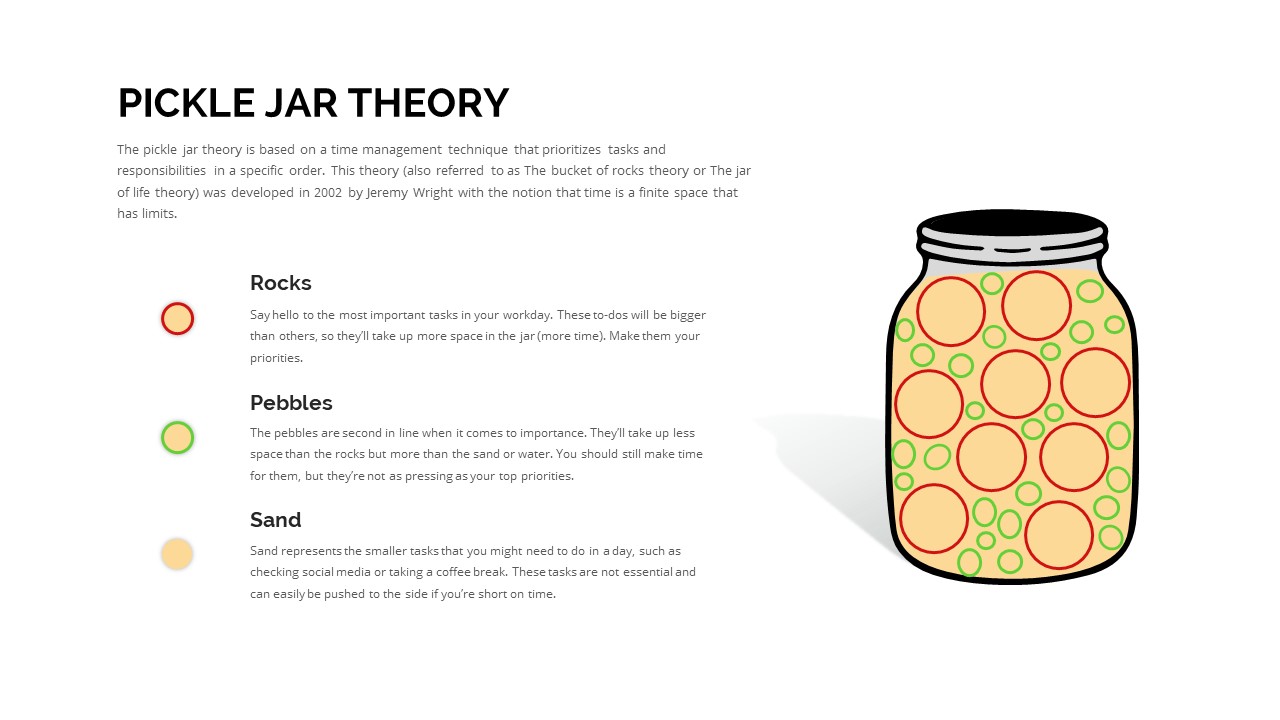
Pickle Jar Theory for PowerPoint & Google Slides
Business Strategy
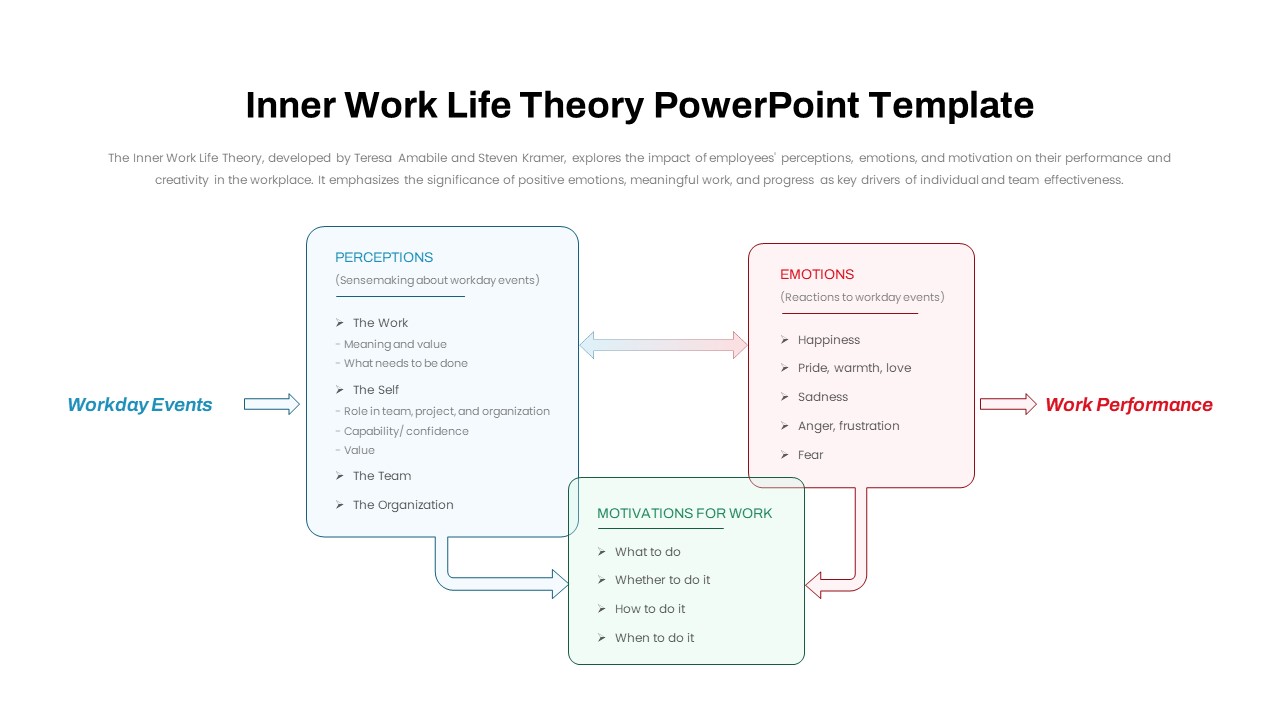
Inner Work Life Theory Diagram Slide for PowerPoint & Google Slides
Employee Performance
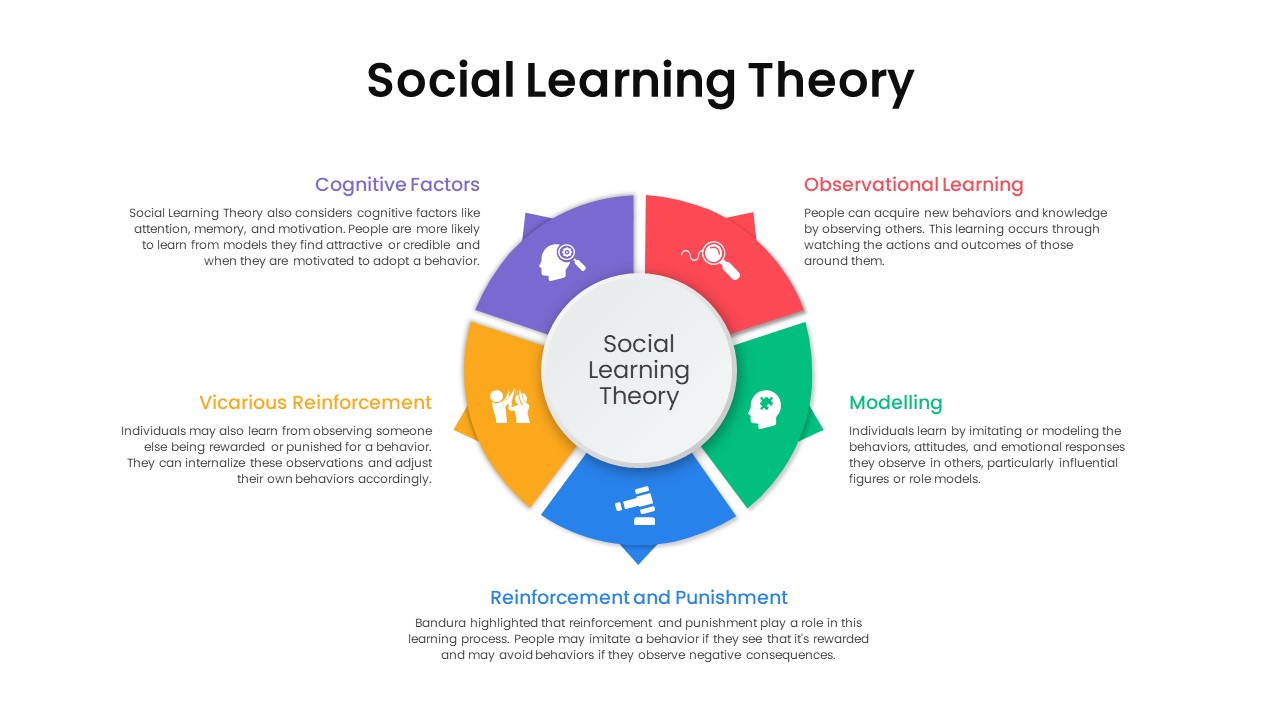
Social Learning Theory Infographic Template for PowerPoint & Google Slides
Circular
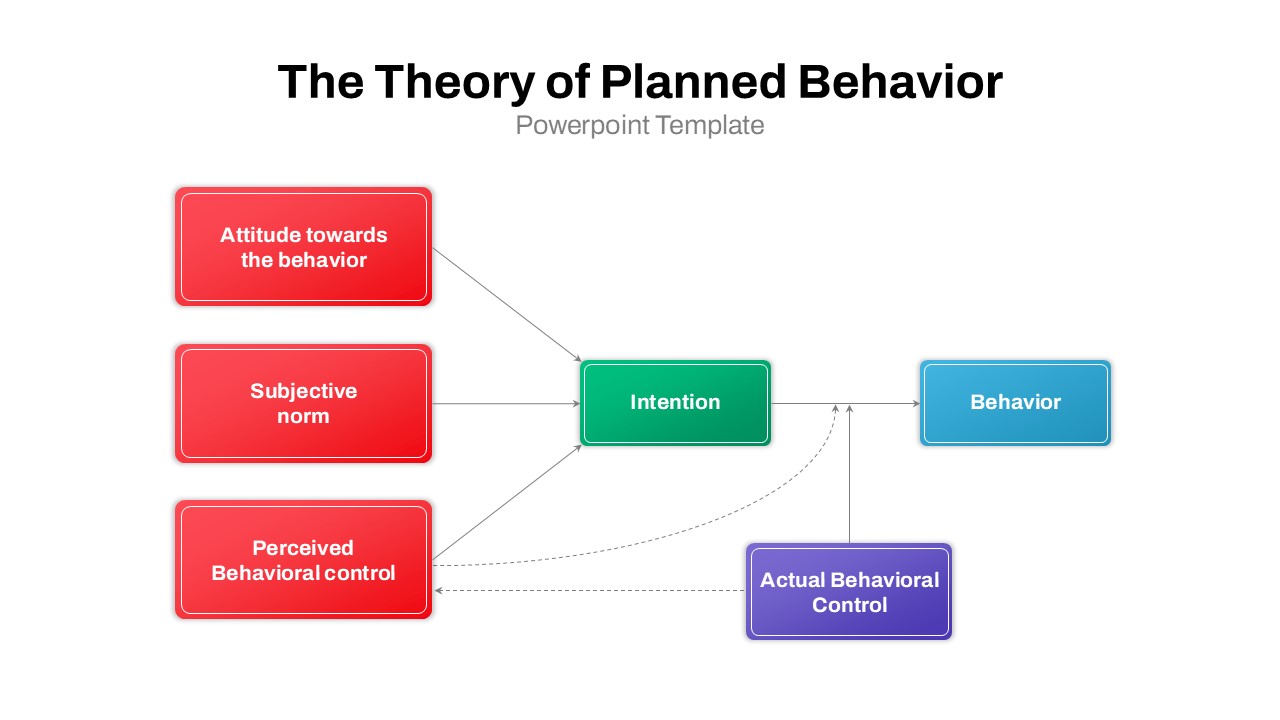
The Theory of Planned Behavior for PowerPoint & Google Slides
Flow Charts
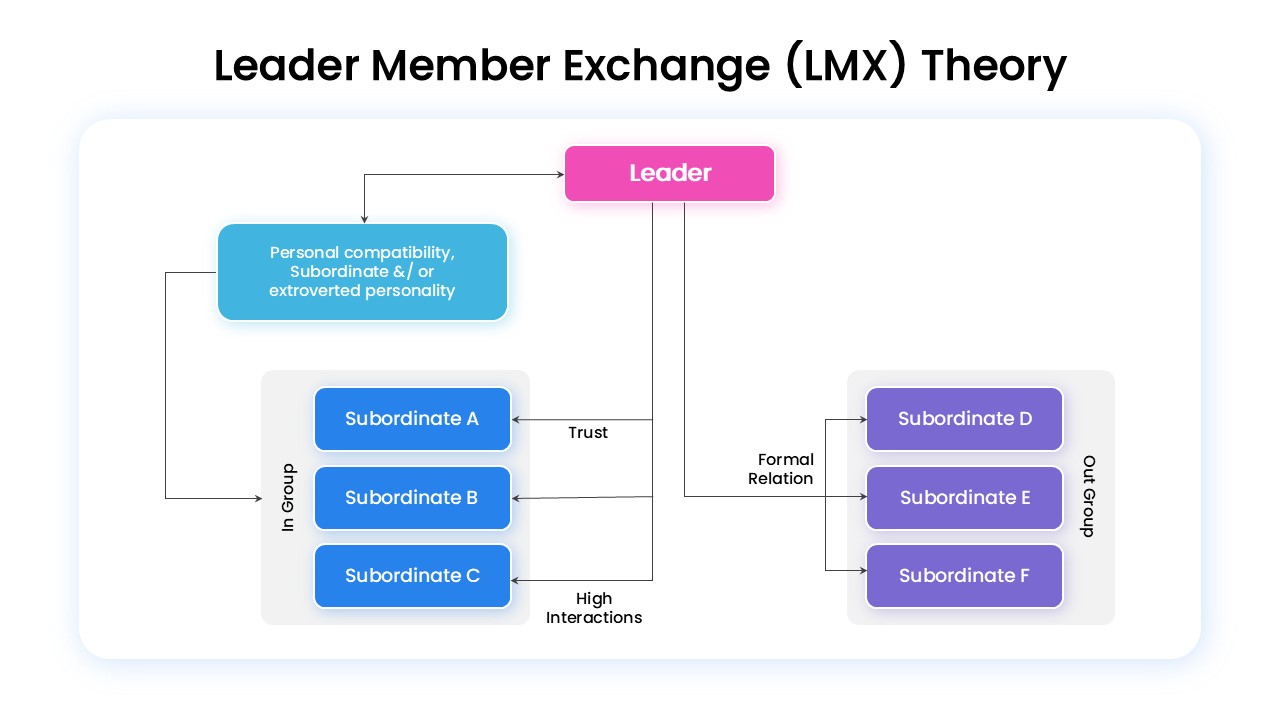
Leader-Member Exchange (LMX) Theory for PowerPoint & Google Slides
Business Strategy
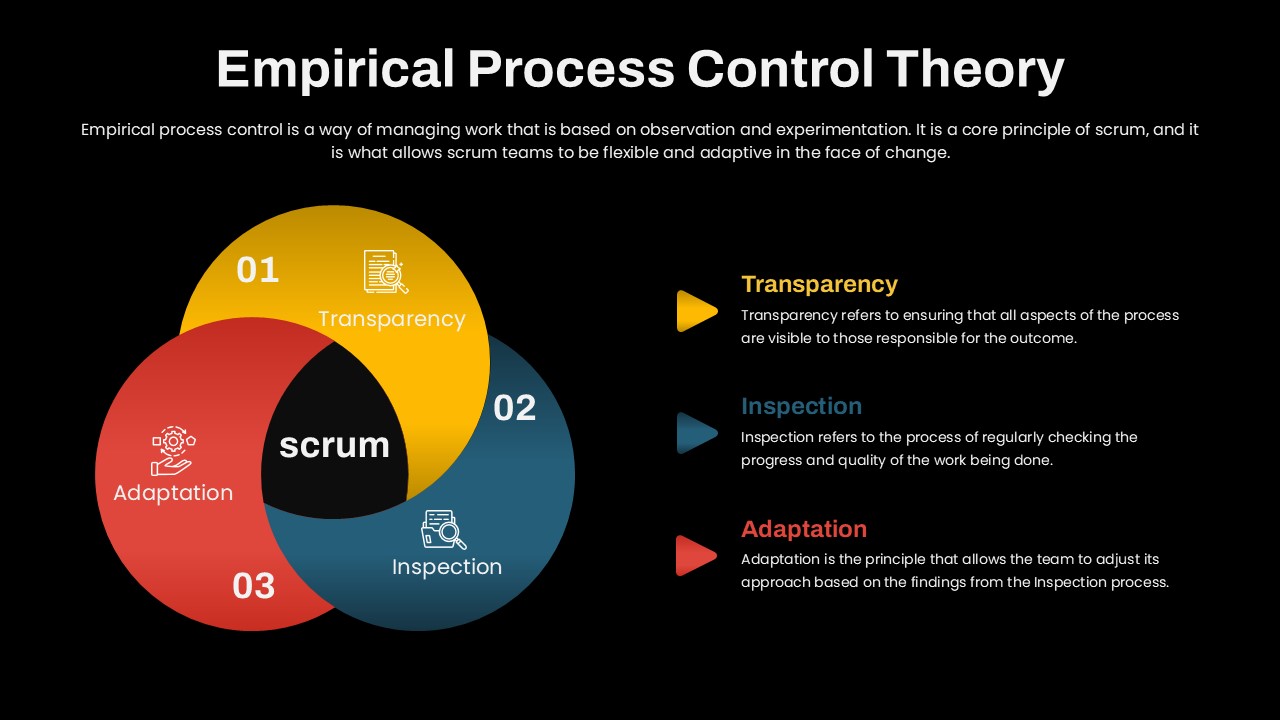
Empirical Process Control Theory Diagram Template for PowerPoint & Google Slides
Circular
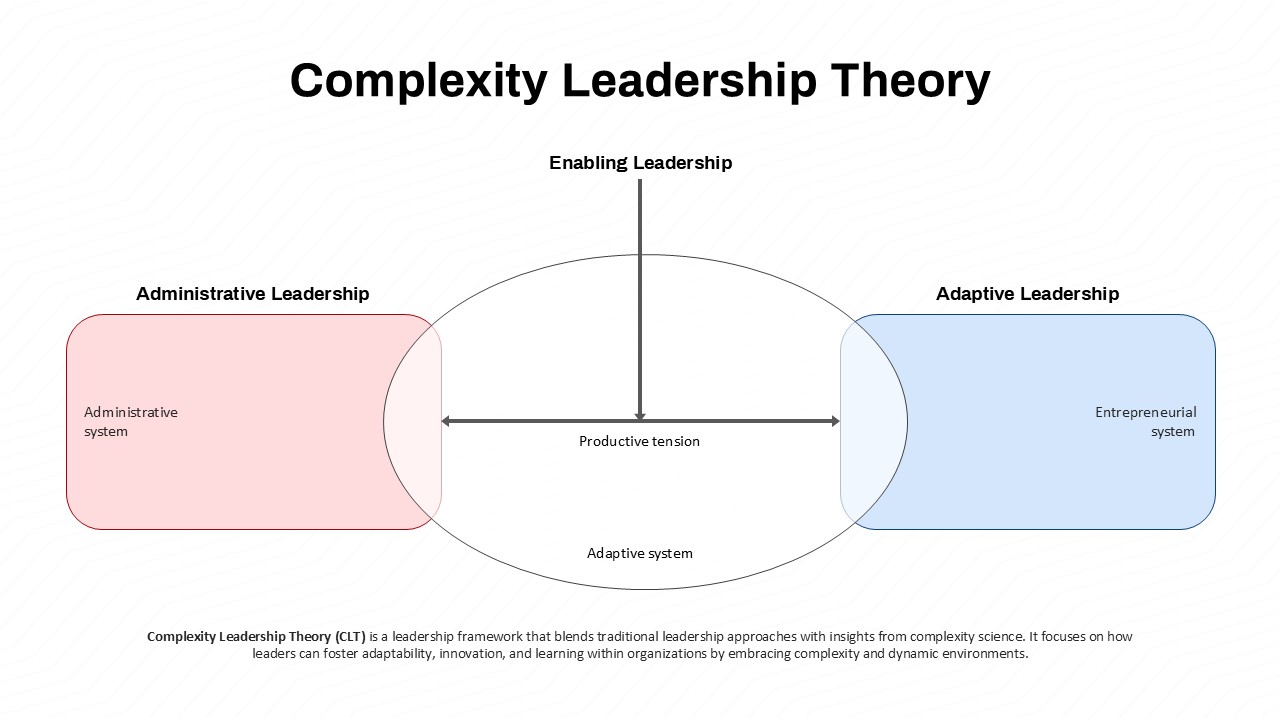
Complexity Leadership Theory Overview Template for PowerPoint & Google Slides
Leadership
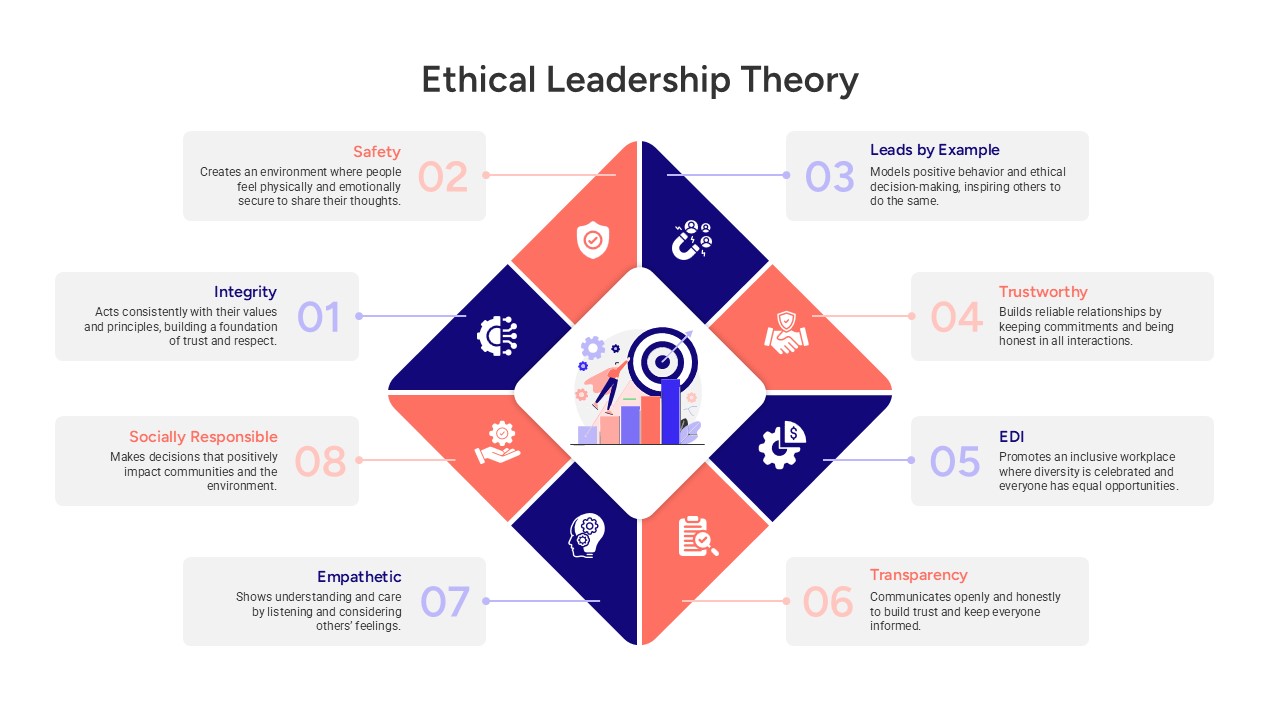
Ethical Leadership Theory Framework Template for PowerPoint & Google Slides
Leadership
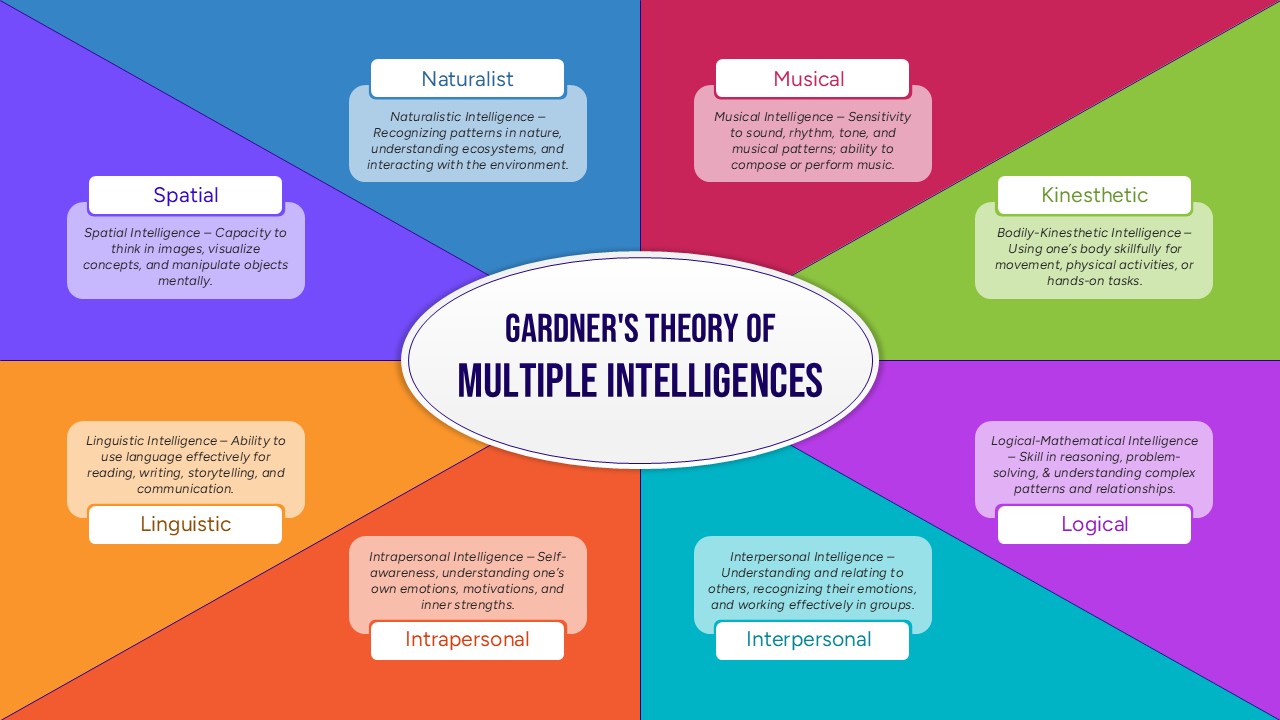
Gardner’s Theory of Multiple Intelligences Diagram Template for PowerPoint & Google Slides
Leadership
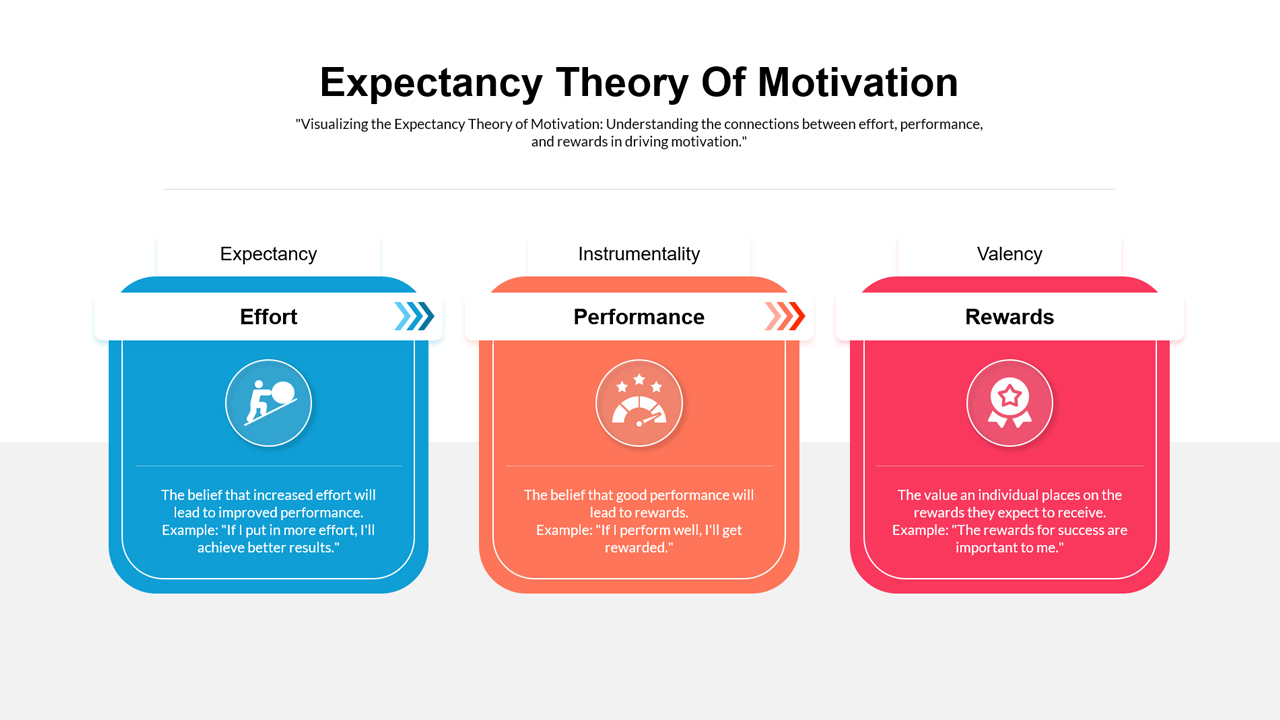
Expectancy Theory Of Motivation Template for PowerPoint & Google Slides
Process
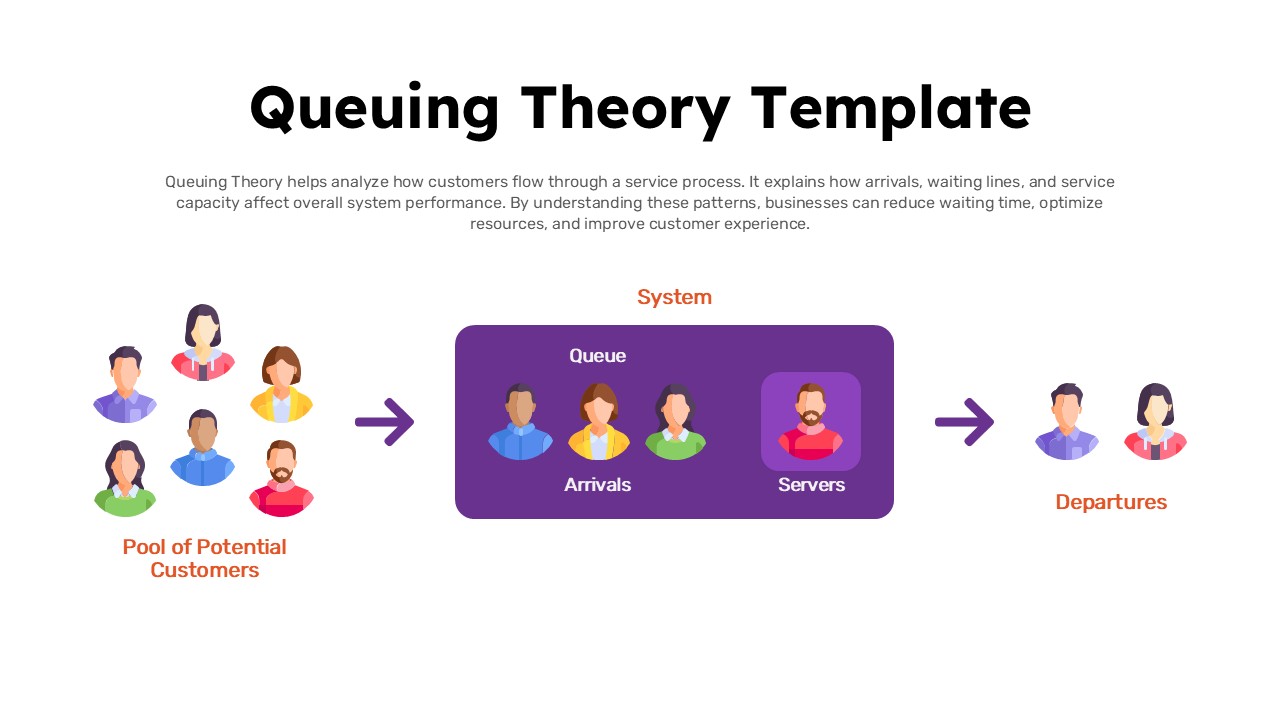
Queuing Theory System Flow Diagram Template for PowerPoint & Google Slides
Process
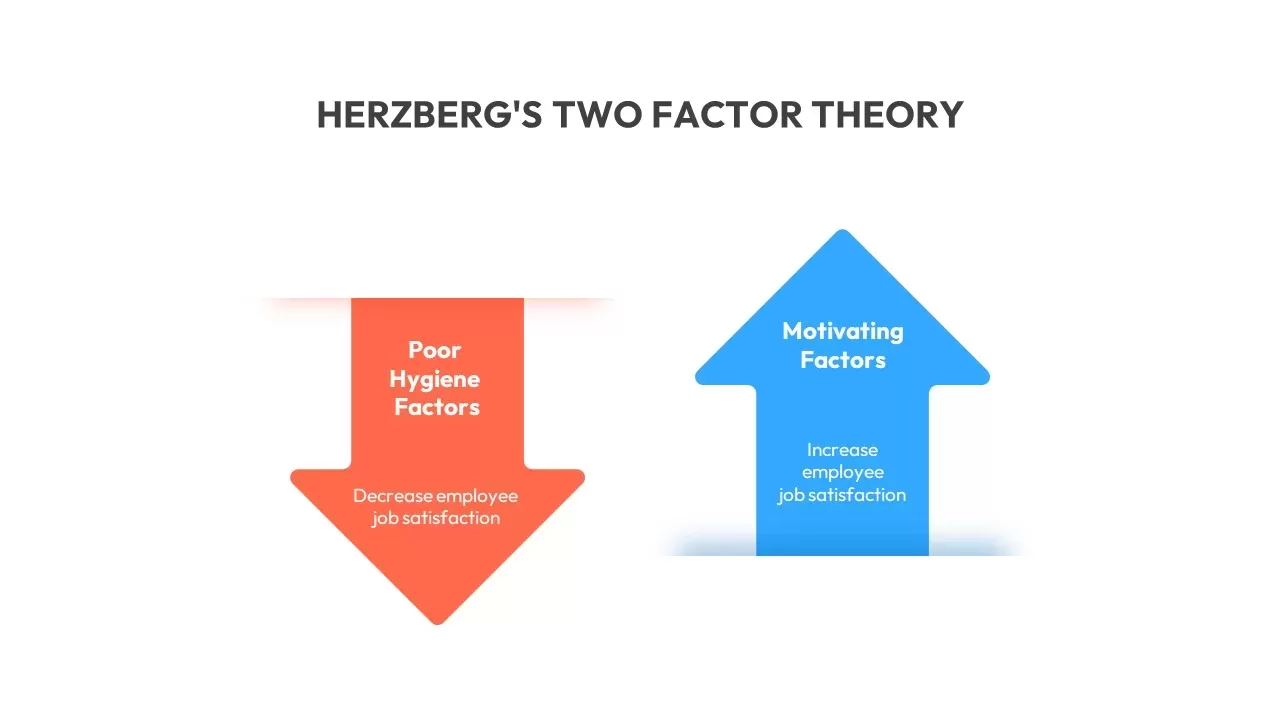
Herzberg’s Two Factor Theory Template
Comparison
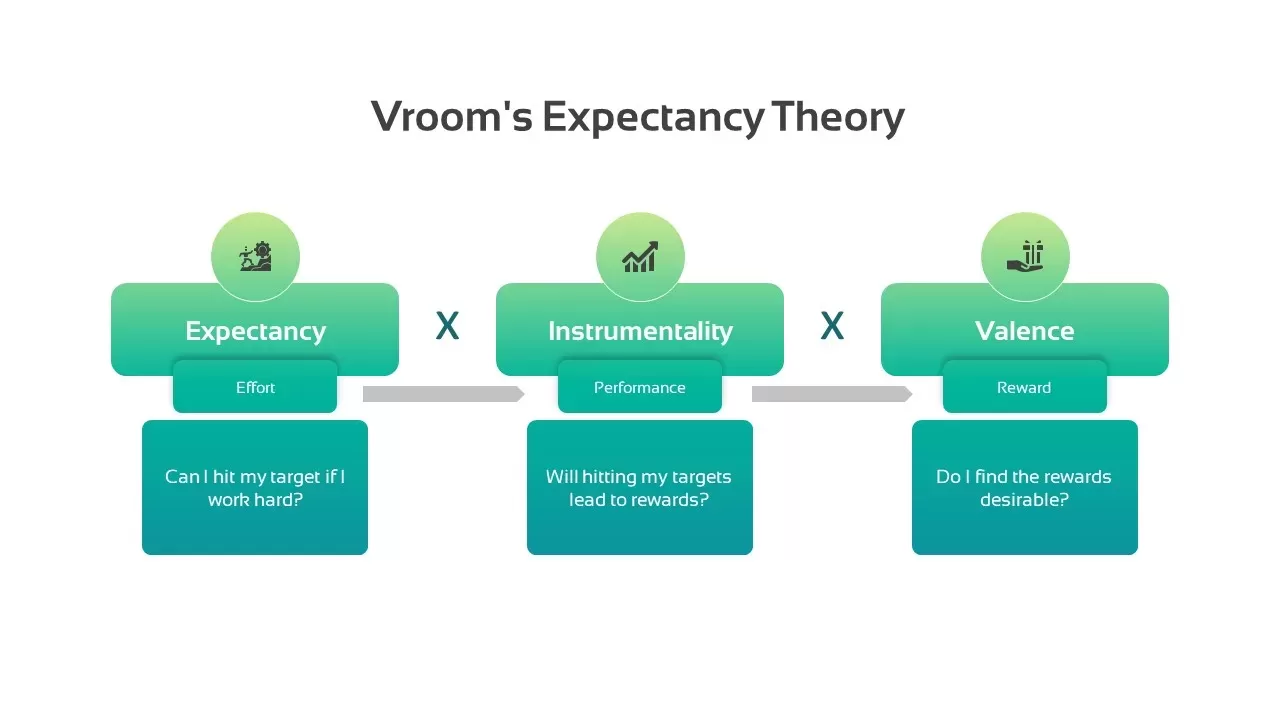
Vrooms Expectancy Theory Template
Process
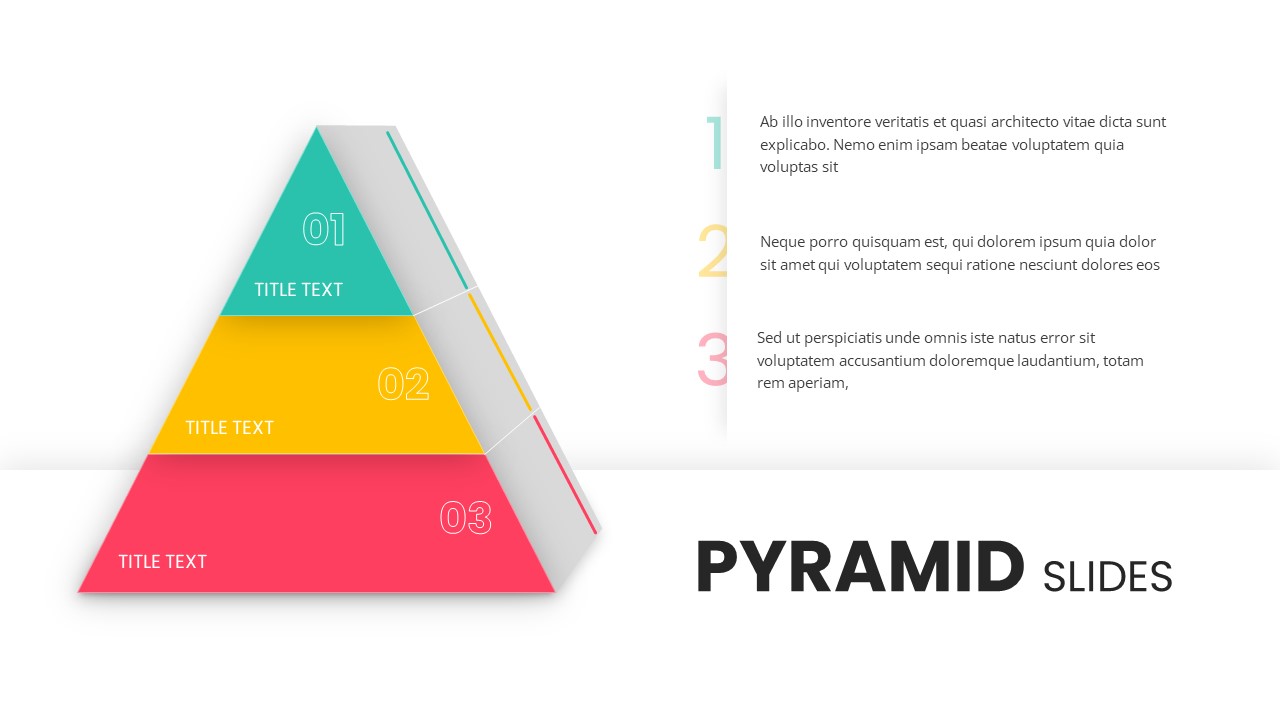
3 Stage Pyramid Slides for PowerPoint & Google Slides
Pyramid
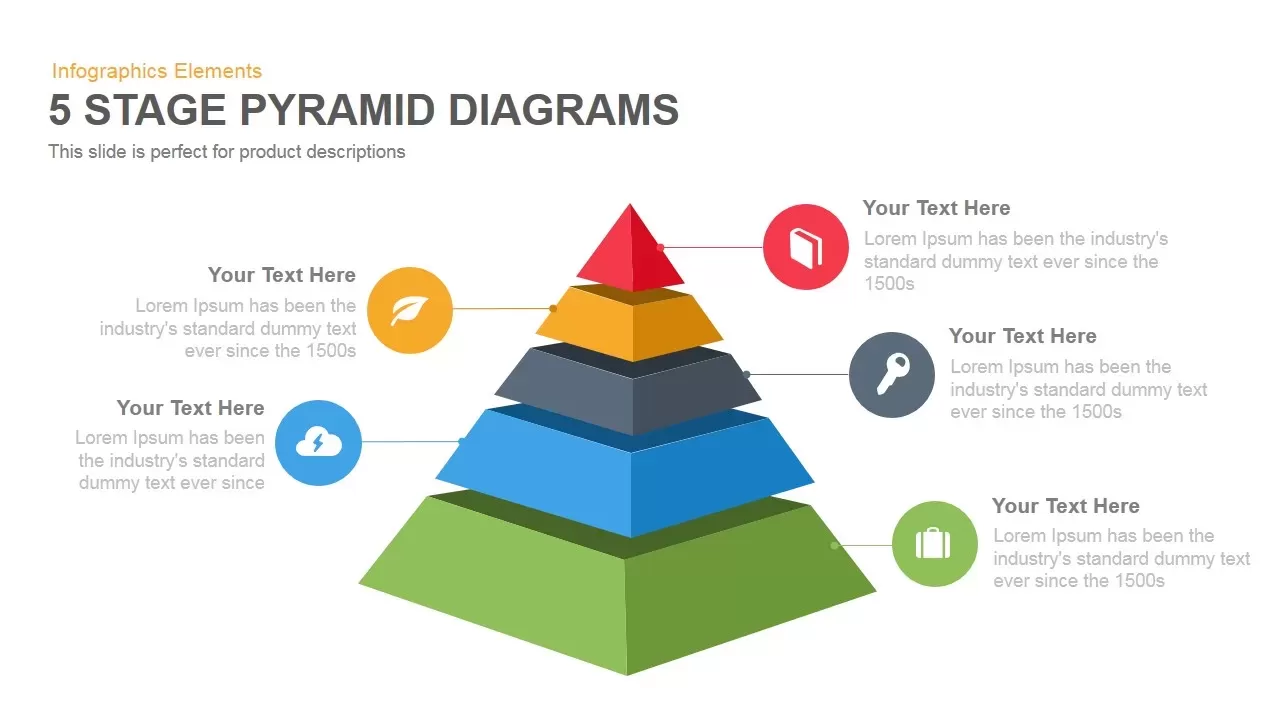
5 Stage Pyramid template for PowerPoint & Google Slides
Pyramid
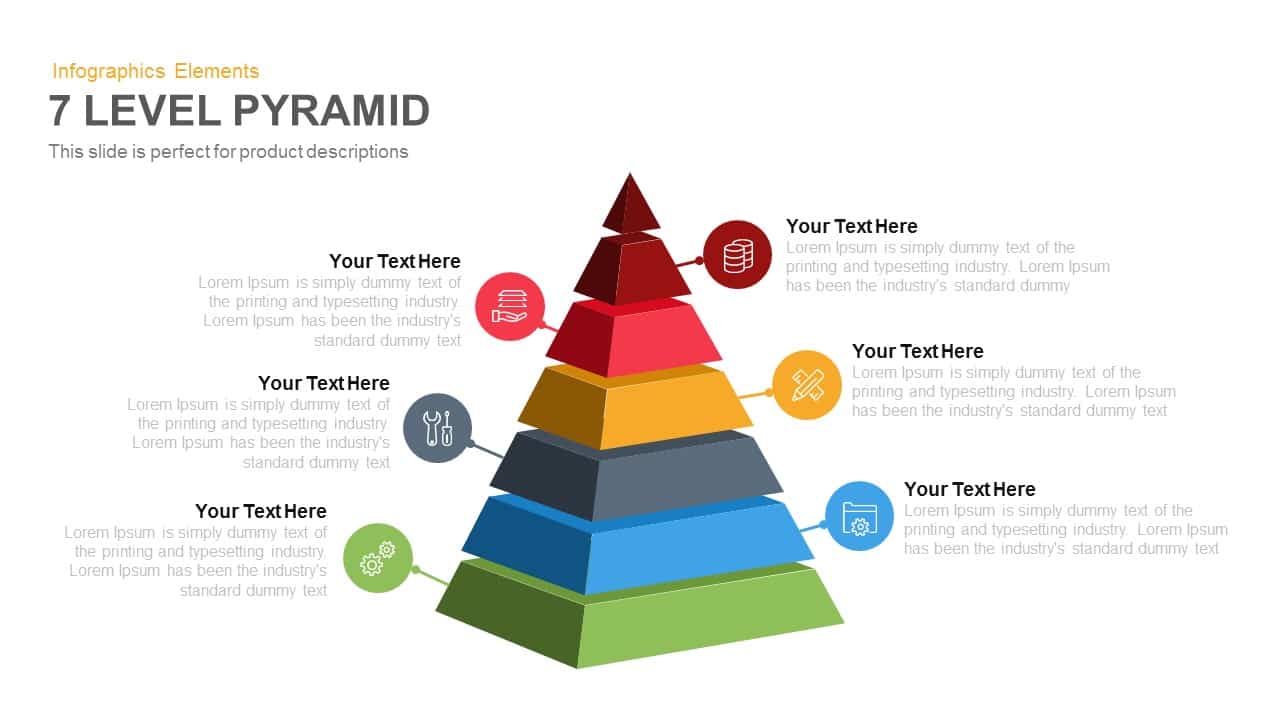
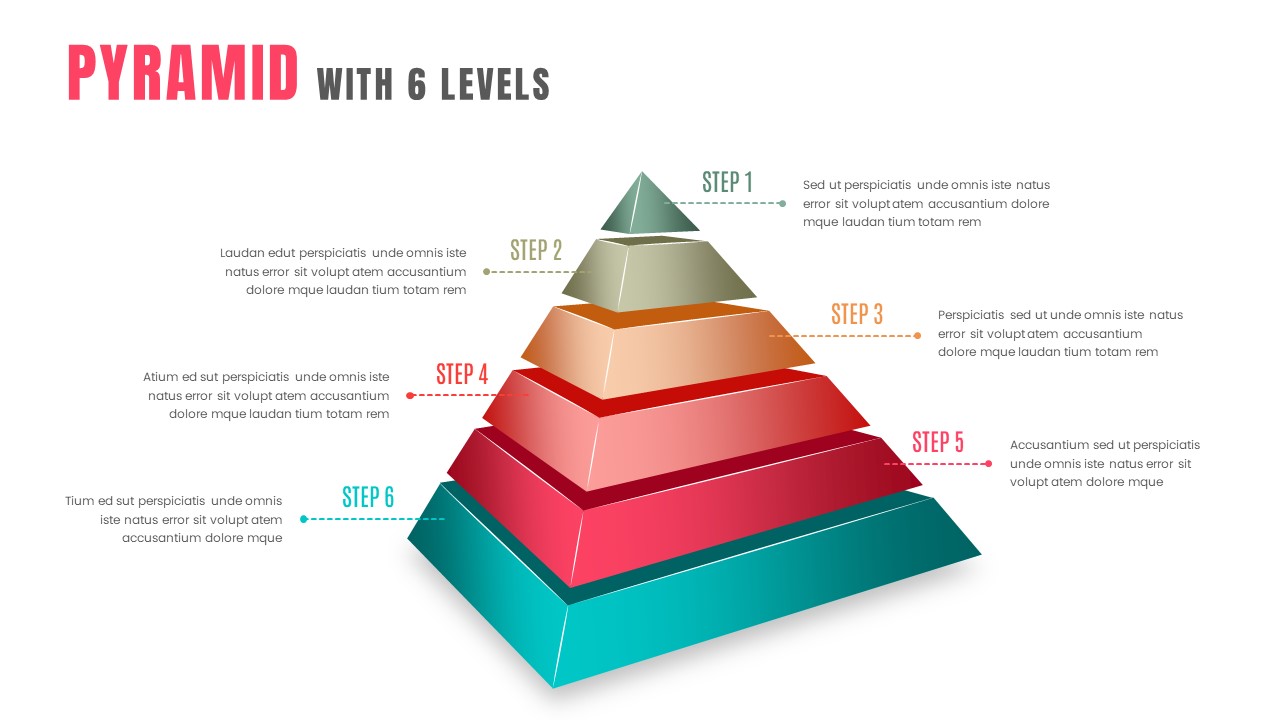
7-Level 3D Pyramid Infographic Diagram Template for PowerPoint & Google Slides
Pyramid
Five-Level 3D Pyramid Hierarchy Template for PowerPoint & Google Slides
Pyramid
Four-Level 3D Pyramid Infographic Template for PowerPoint & Google Slides
Pyramid
Professional 5-Stage Pyramid Diagram Template for PowerPoint & Google Slides
Pyramid
Professional 4-Piece 3D Pyramid Diagram Template for PowerPoint & Google Slides
Pyramid
Five-Stage Pyramid Infographics Diagram Template for PowerPoint & Google Slides
Pyramid
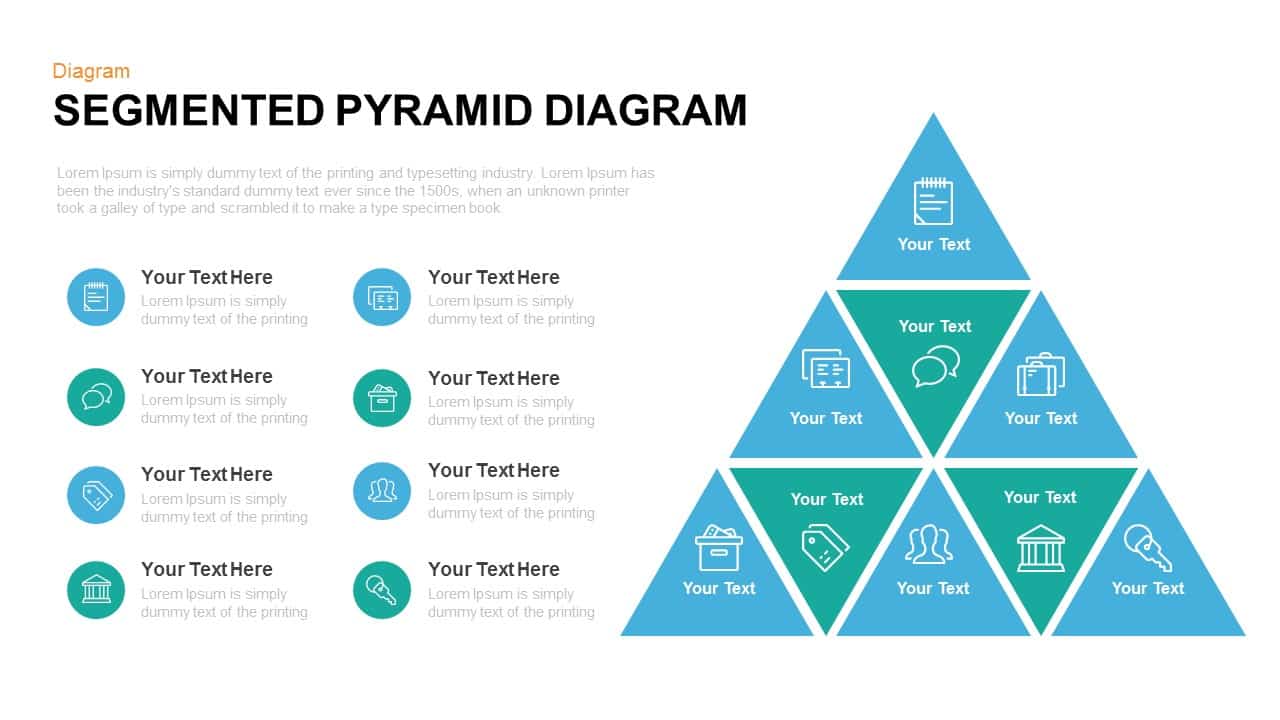
Segmented Pyramid Diagram Infographic Template for PowerPoint & Google Slides
Pyramid
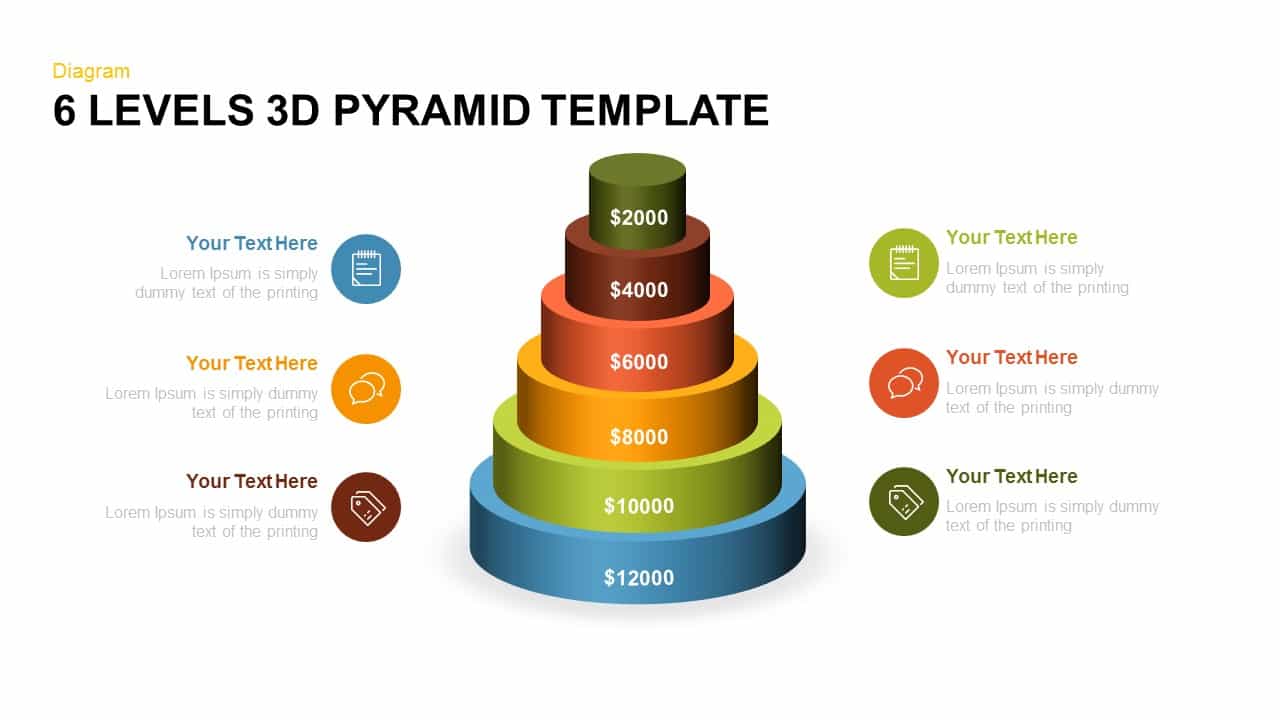
Editable Six-Level 3D Pyramid Diagram Template for PowerPoint & Google Slides
Pyramid

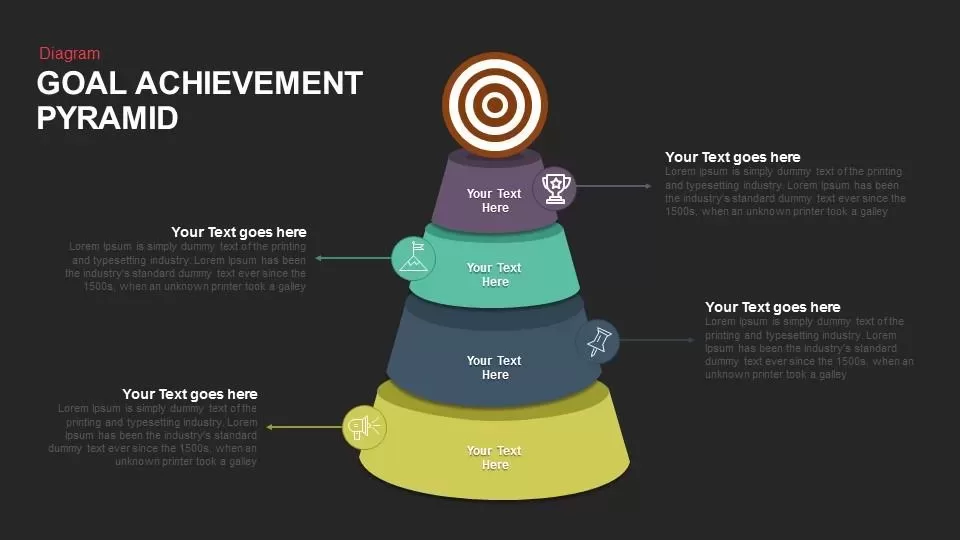
Goal Achievement Pyramid Diagram for PowerPoint & Google Slides
Pyramid
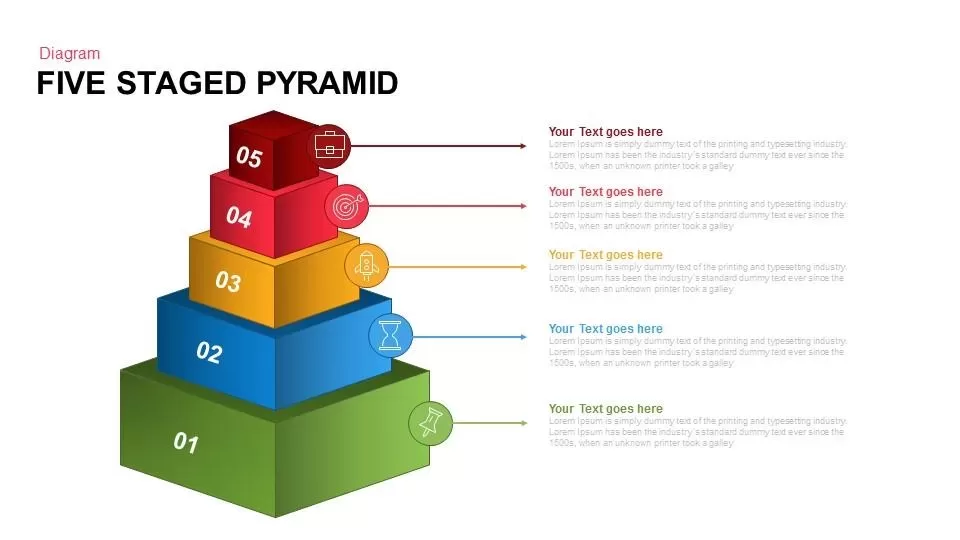
Five Staged Pyramid Diagram for PowerPoint & Google Slides
Pyramid

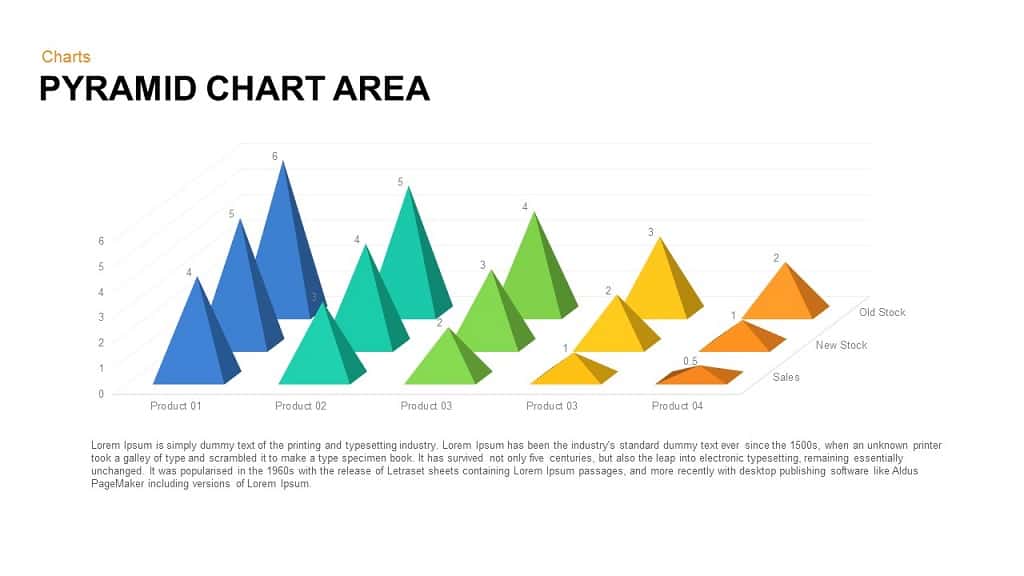
Pyramid Chart Area template for PowerPoint & Google Slides
Pyramid

Four-Level Business Pyramid Diagram Template for PowerPoint & Google Slides
Pyramid
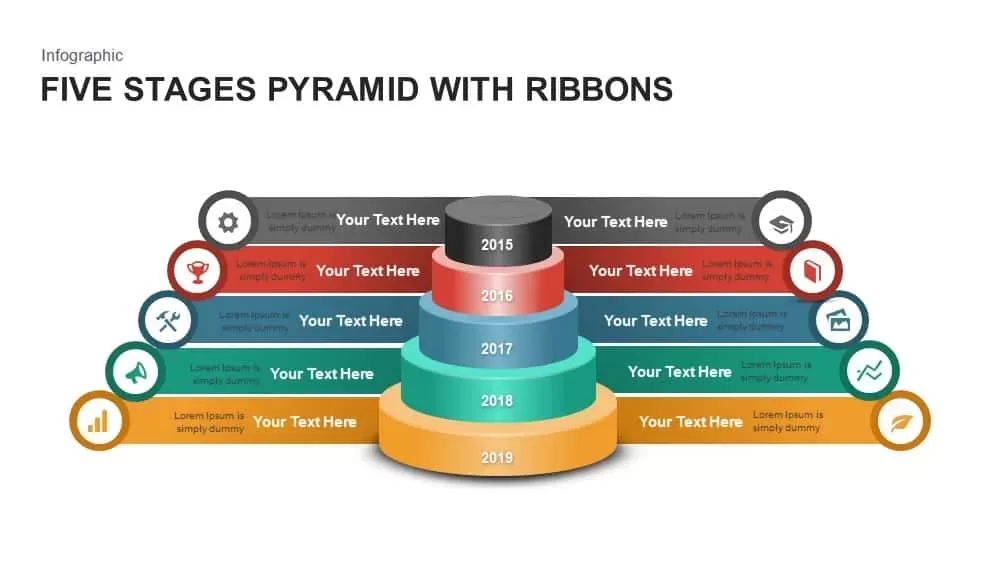
Five Stages Pyramid with Ribbons Diagram Template for PowerPoint & Google Slides
Pyramid
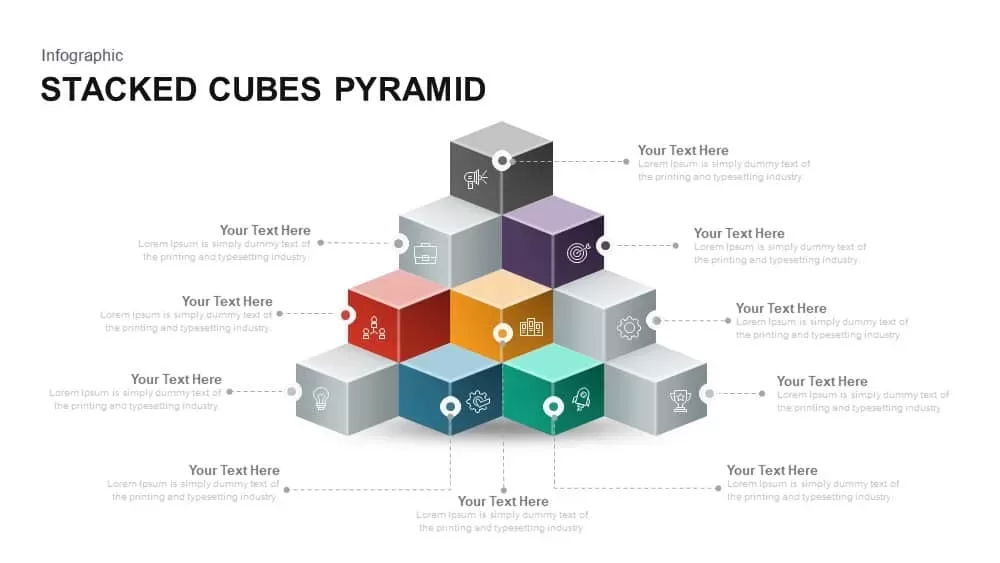
Stacked Cubes Pyramid Infographic Template for PowerPoint & Google Slides
Pyramid
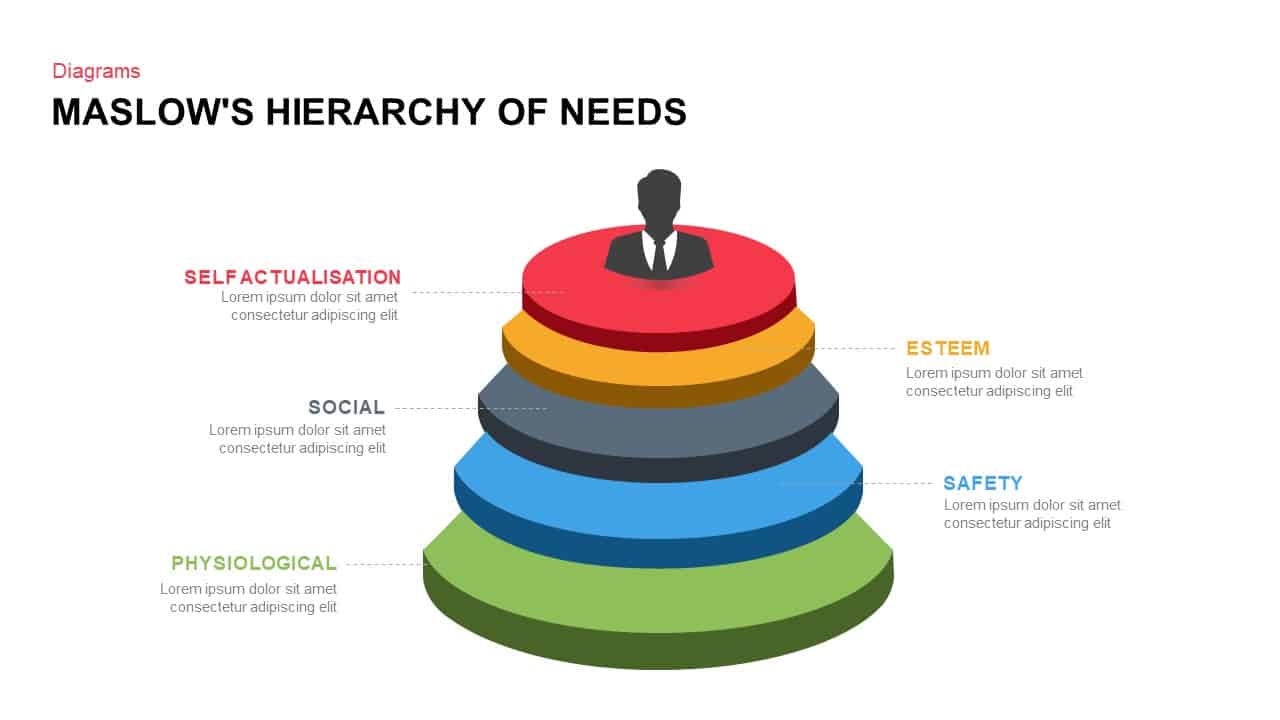
Maslow’s Hierarchy of Needs Pyramid Template for PowerPoint & Google Slides
Pyramid
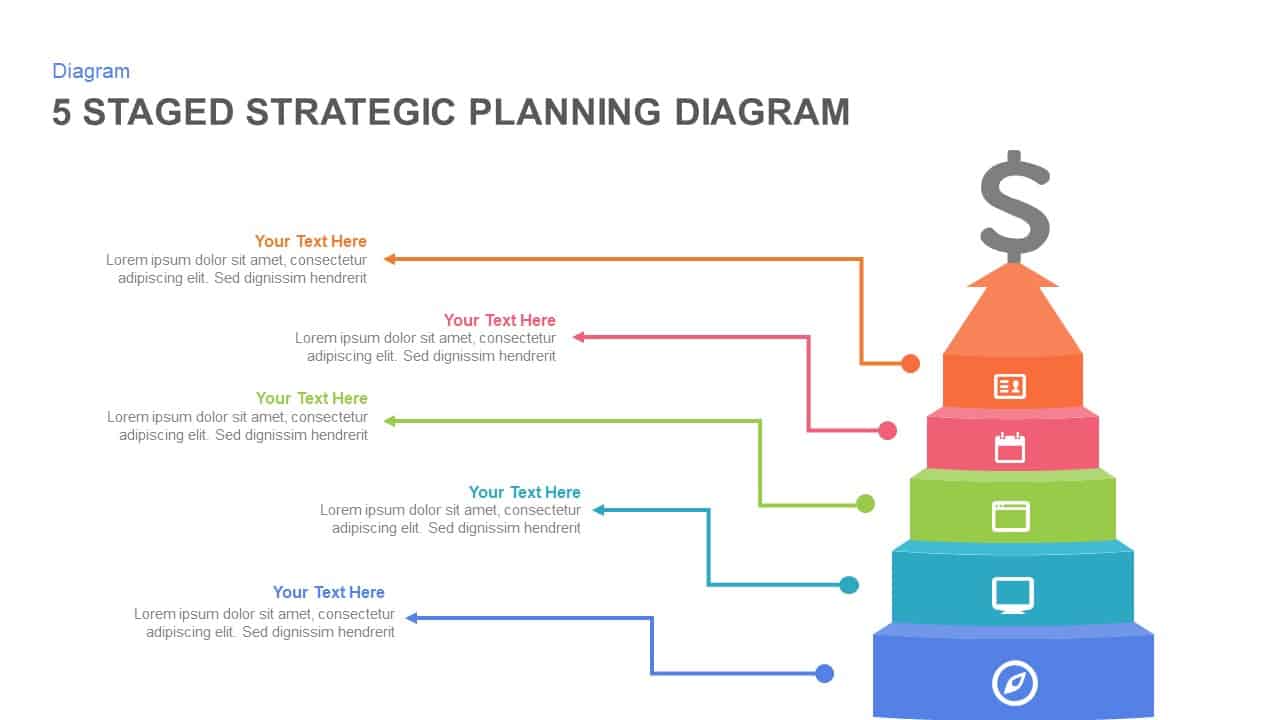
5-Stage Strategic Planning Pyramid Template for PowerPoint & Google Slides
Business Strategy
Maslow’s Hierarchy of Needs Pyramid template for PowerPoint & Google Slides
Pyramid
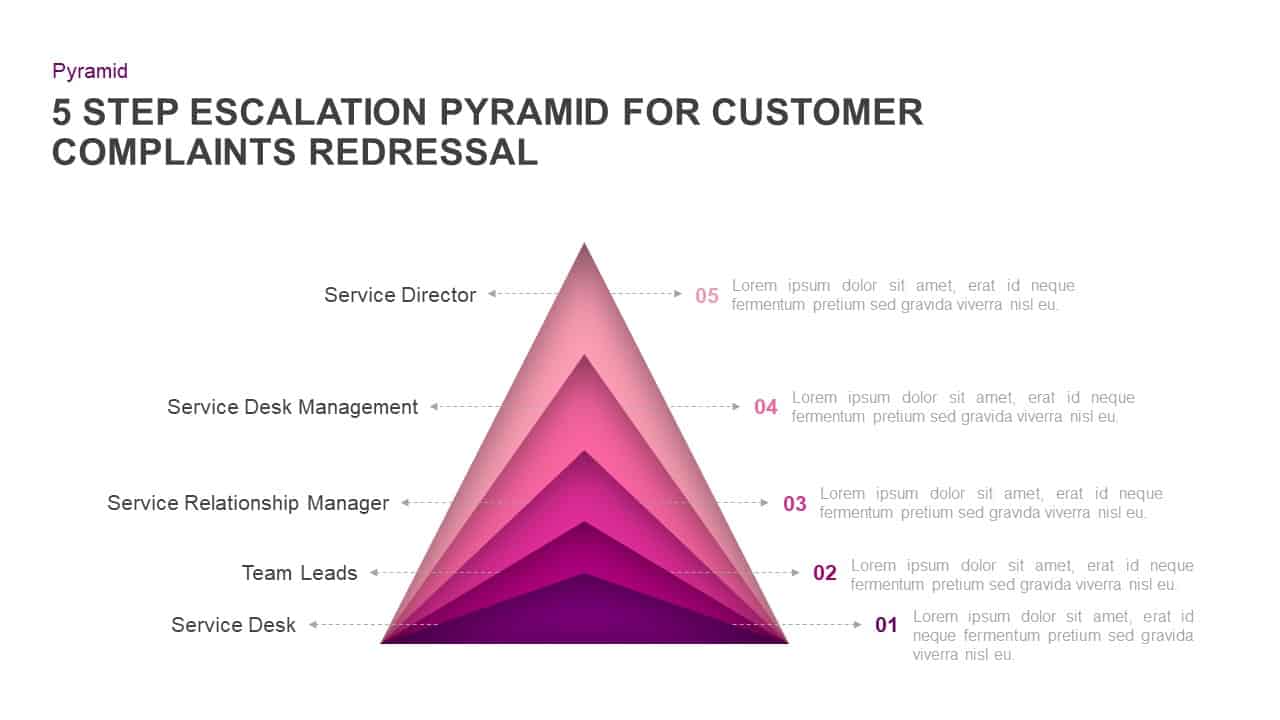
Customer Complaints Escalation Pyramid Template for PowerPoint & Google Slides
Infographics
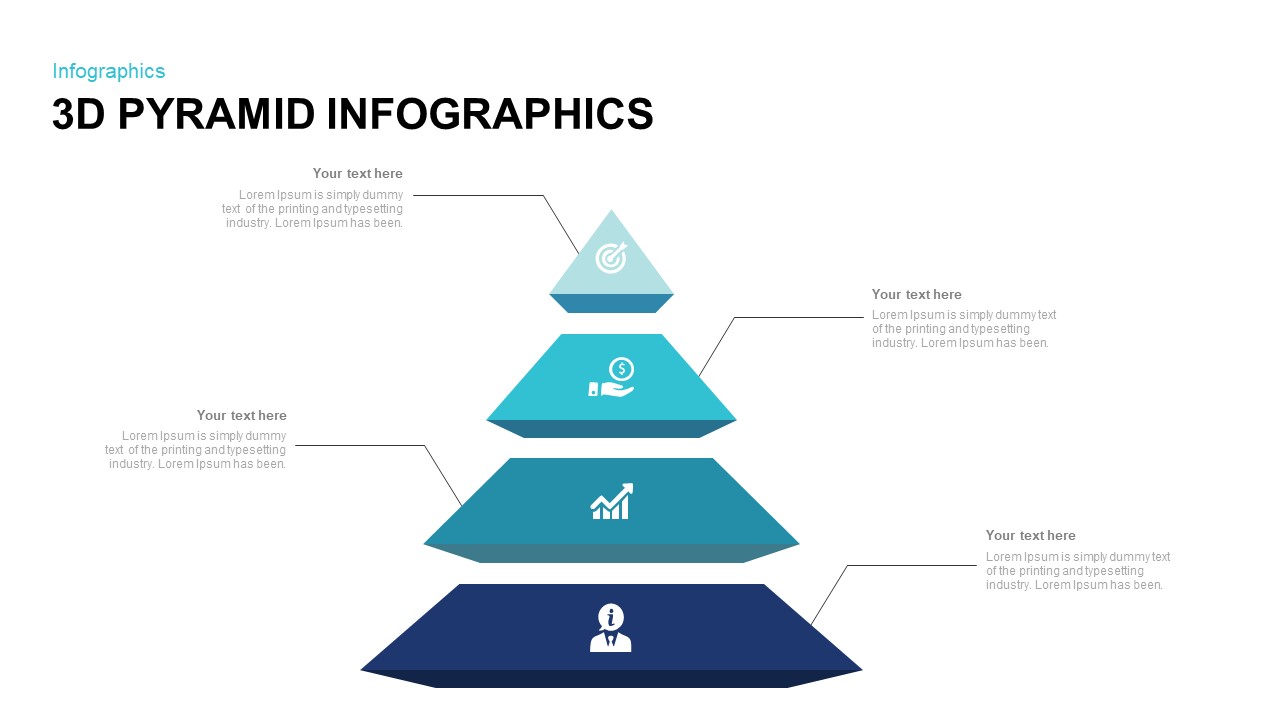
3D Pyramid Infographics Slide Template for PowerPoint & Google Slides
Pyramid
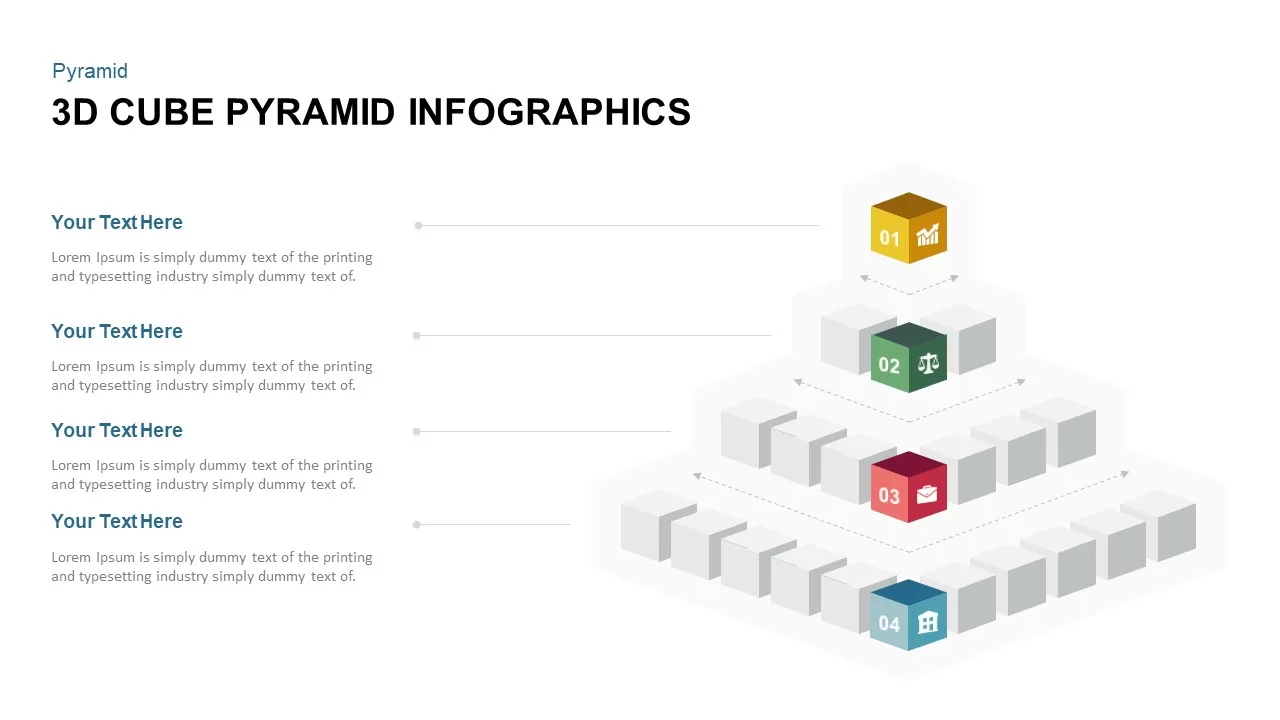
3D Cube Pyramid Infographics Slide Template for PowerPoint & Google Slides
Pyramid
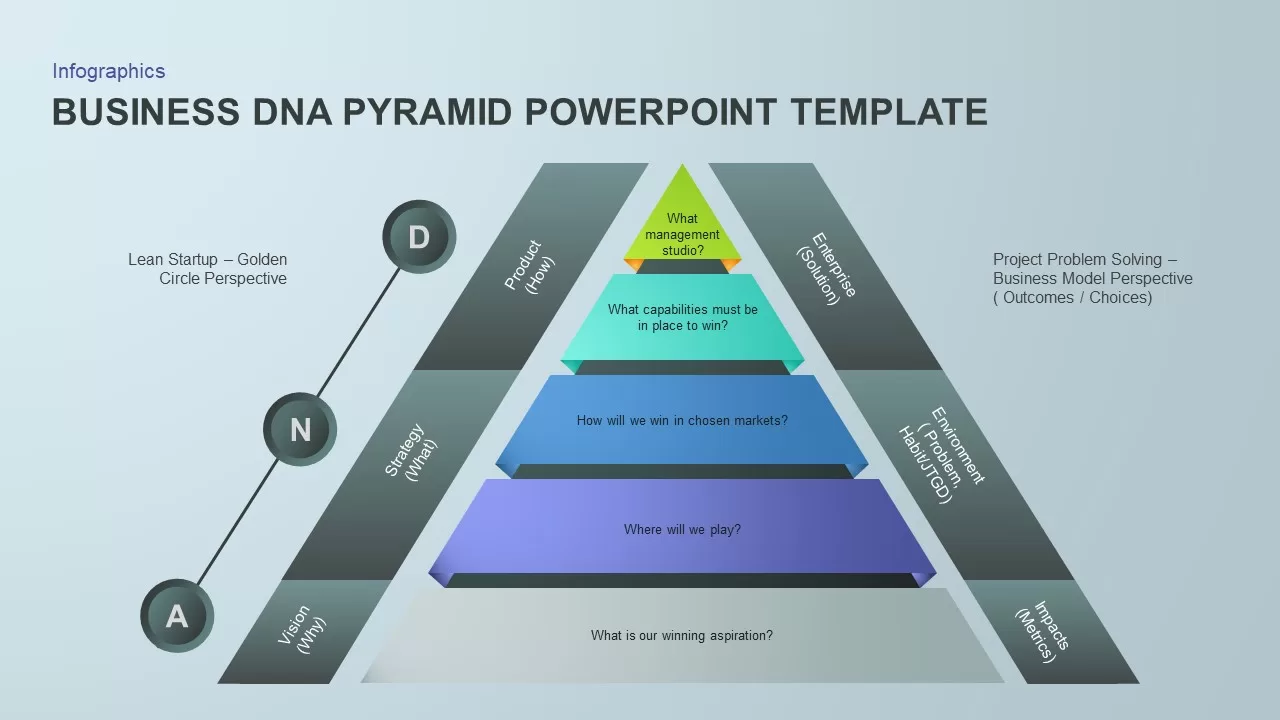
Business DNA Pyramid PowerPoint Template for PowerPoint & Google Slides
Pyramid
Stacked Cubes Pyramid Six-Option Diagram Template for PowerPoint & Google Slides
Pyramid
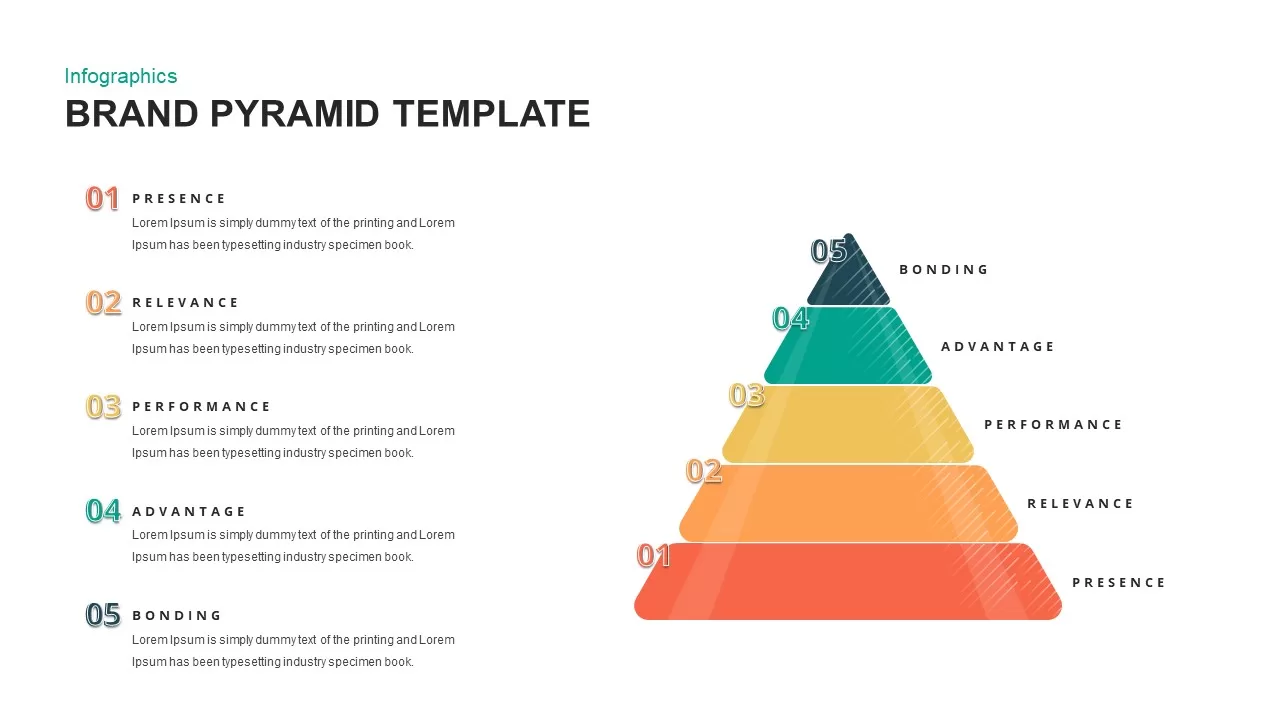
Brand Pyramid Framework template for PowerPoint & Google Slides
Pyramid
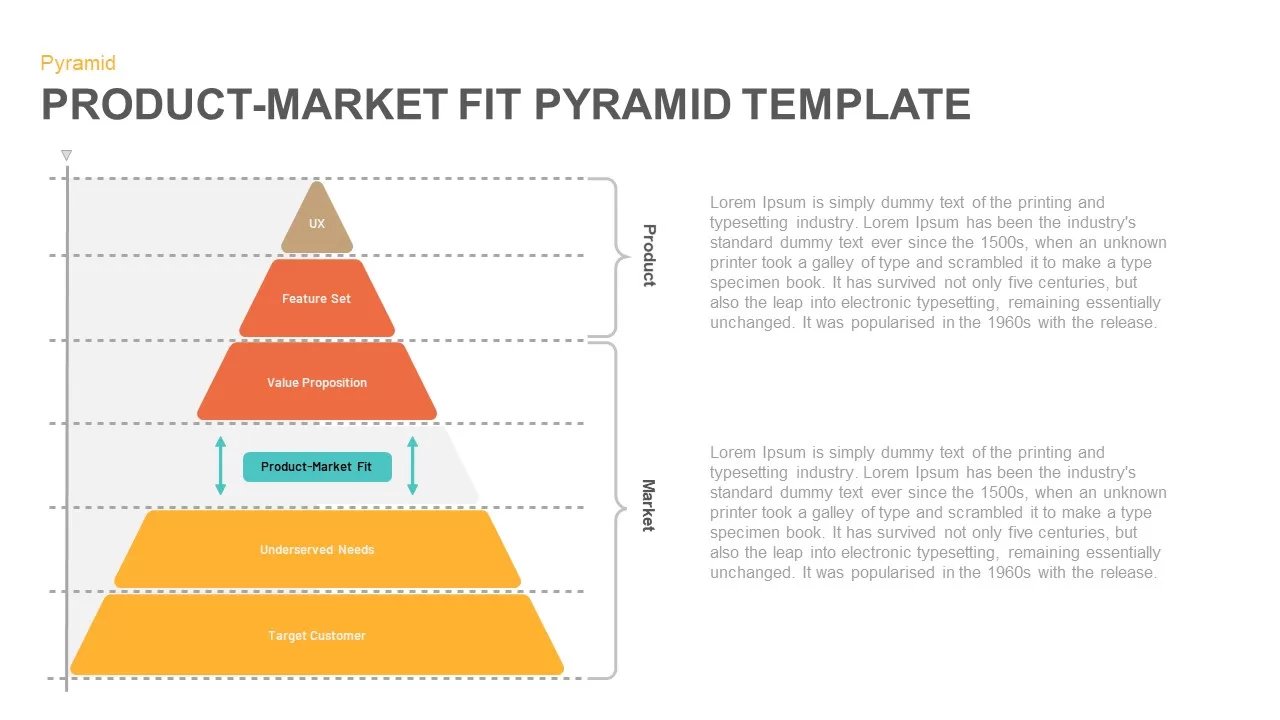
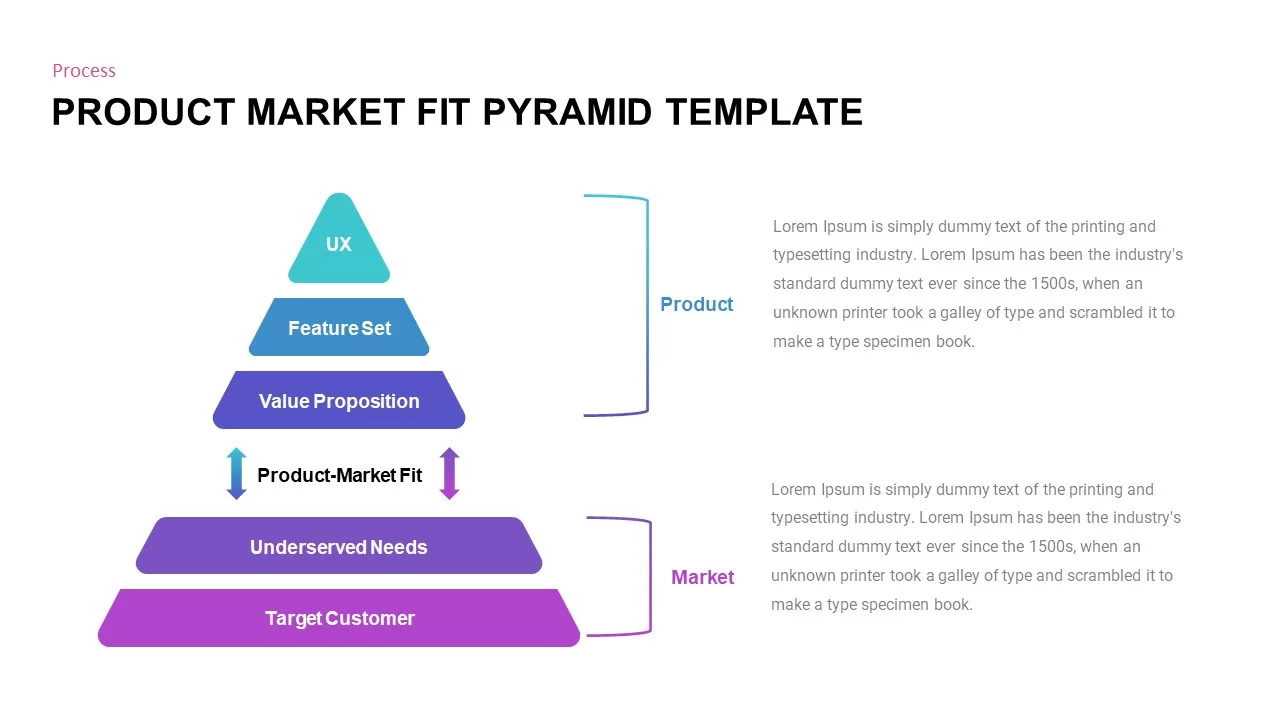
Product-Market Fit Pyramid template for PowerPoint & Google Slides
Pyramid
Professional Product Market Fit Pyramid Template for PowerPoint & Google Slides
Pyramid
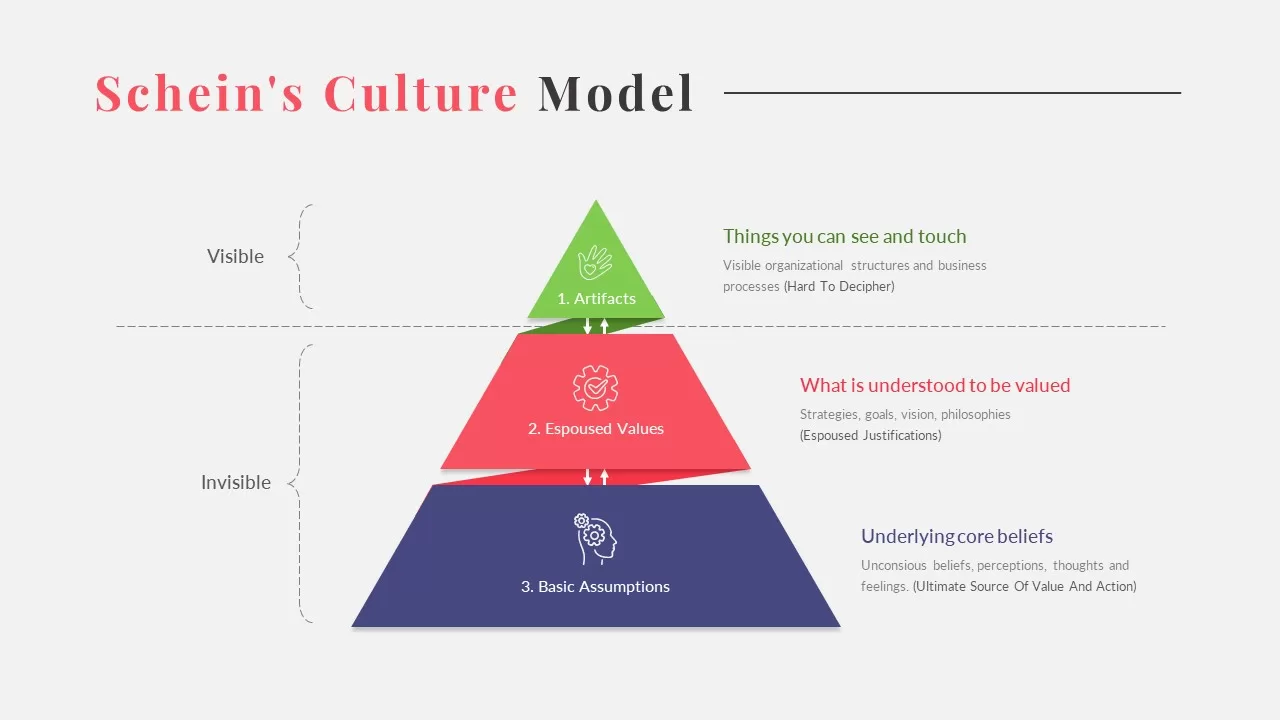
Schein’s Culture Pyramid Model Template for PowerPoint & Google Slides
Pyramid
DIKW Data to Wisdom Pyramid Model Template for PowerPoint & Google Slides
Pyramid
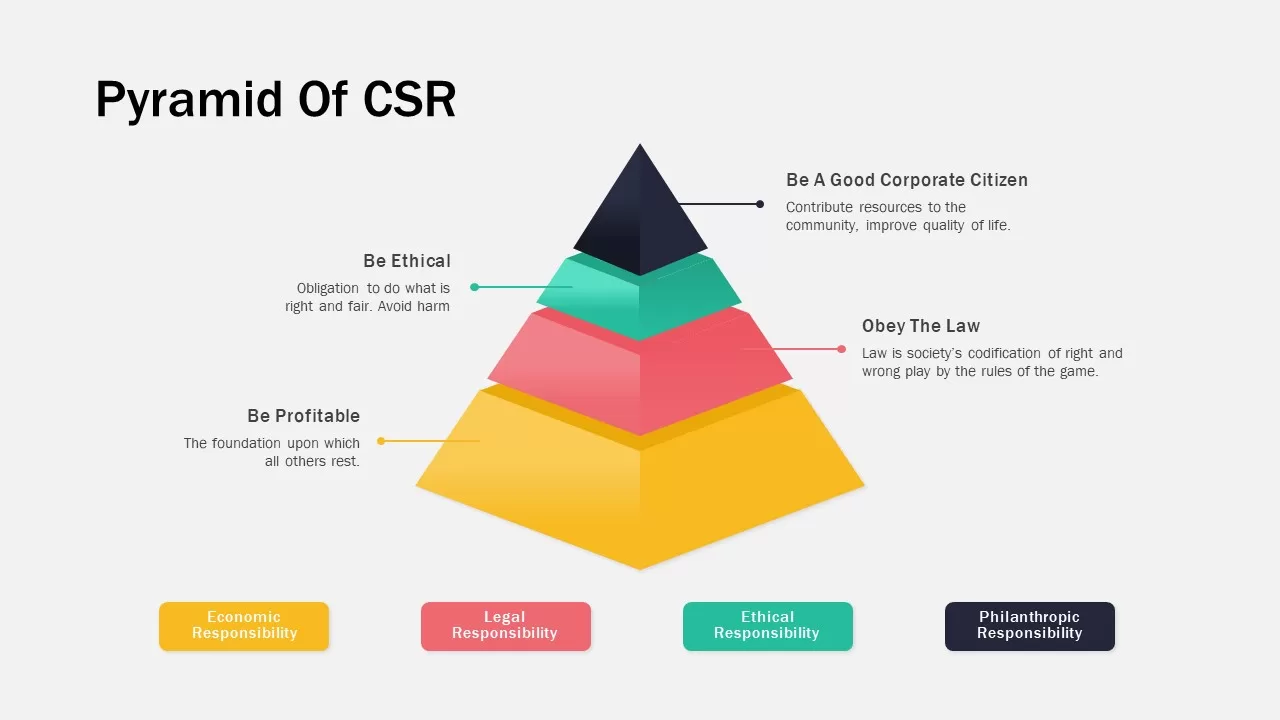
Corporate Social Responsibility Pyramid Template for PowerPoint & Google Slides
Pyramid
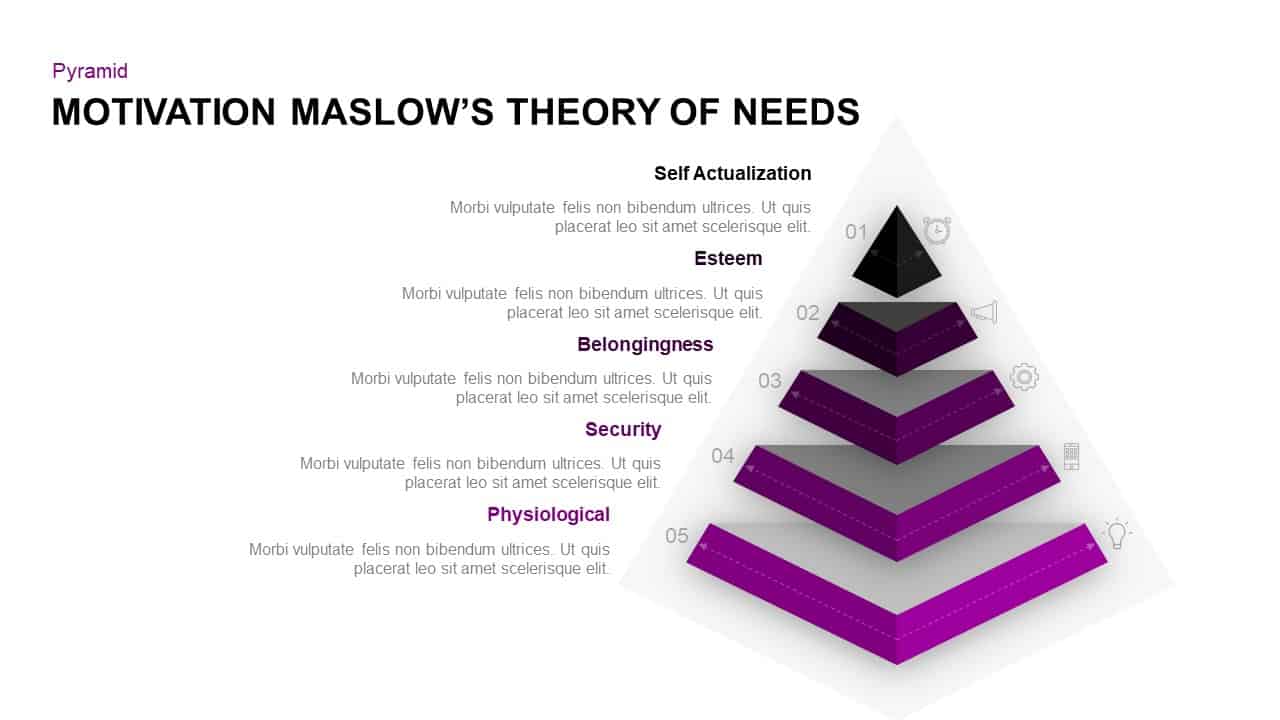
Maslow’s Colorful Pyramid of Needs Template for PowerPoint & Google Slides
Pyramid
5 Stage Pyramid Slide for PowerPoint & Google Slides
Pyramid
Five-Stage Pyramid Process Slide Template for PowerPoint & Google Slides
Pyramid
Six-Stage Pyramid Process Slide Template for PowerPoint & Google Slides
Pyramid
3D Four-Stage Pyramid Diagram Template for PowerPoint & Google Slides
Pyramid
Four-Level Colorful Pyramid Diagram Template for PowerPoint & Google Slides
Pyramid
3D Six-Level Pyramid Diagram Infographic Template for PowerPoint & Google Slides
Pyramid
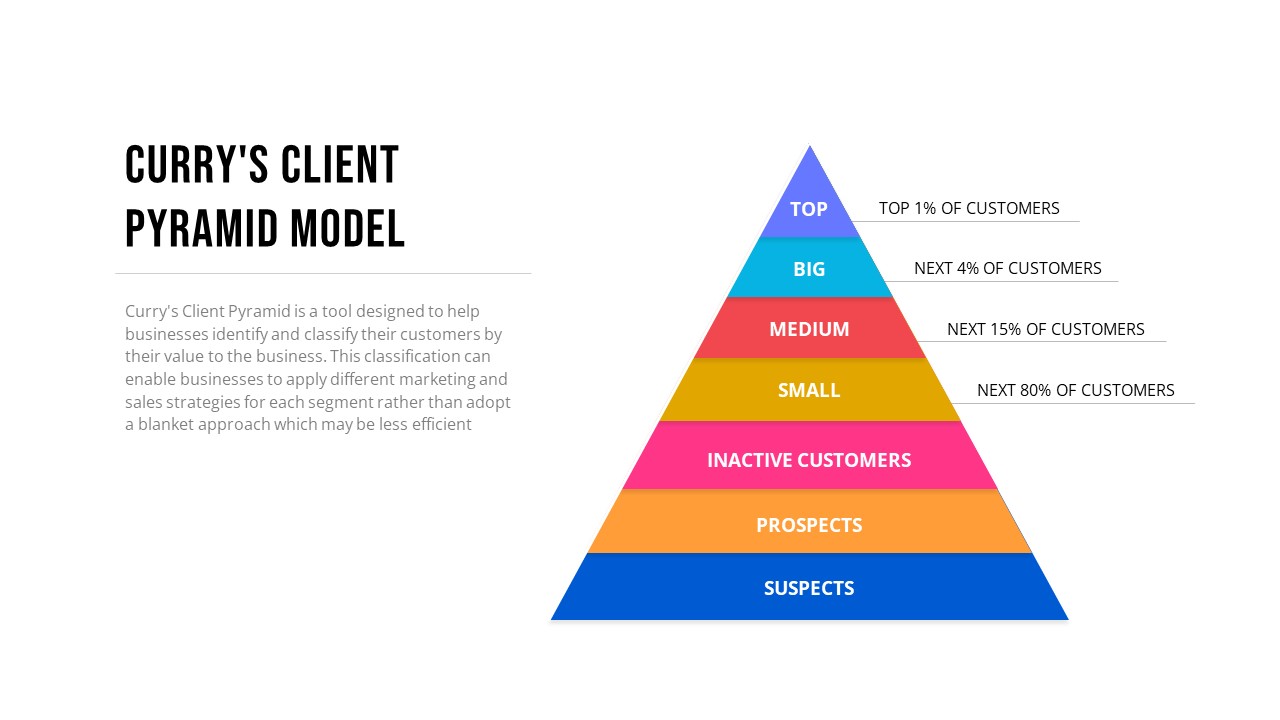
Curry’s Client Segmentation Pyramid Model Template for PowerPoint & Google Slides
Pyramid
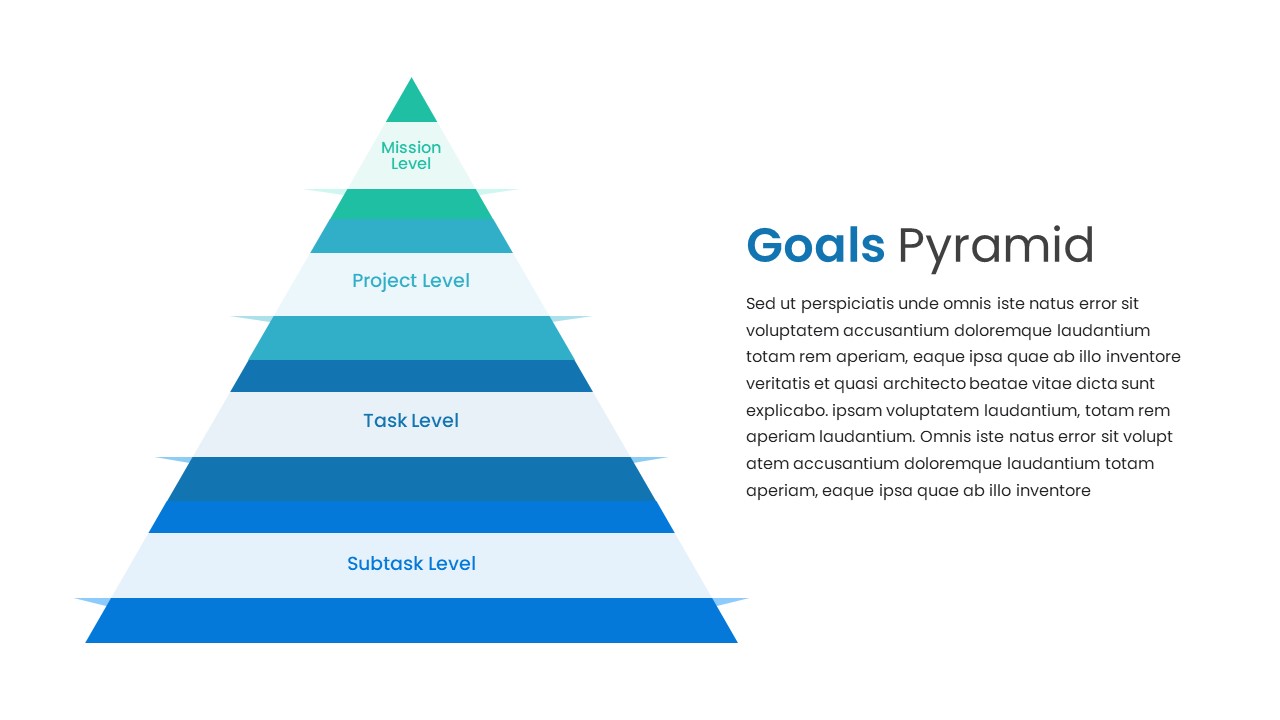
Goals Pyramid Hierarchy Slide Design Template for PowerPoint & Google Slides
Pyramid
Risk Pyramid Hierarchy Analysis Template for PowerPoint & Google Slides
Pyramid
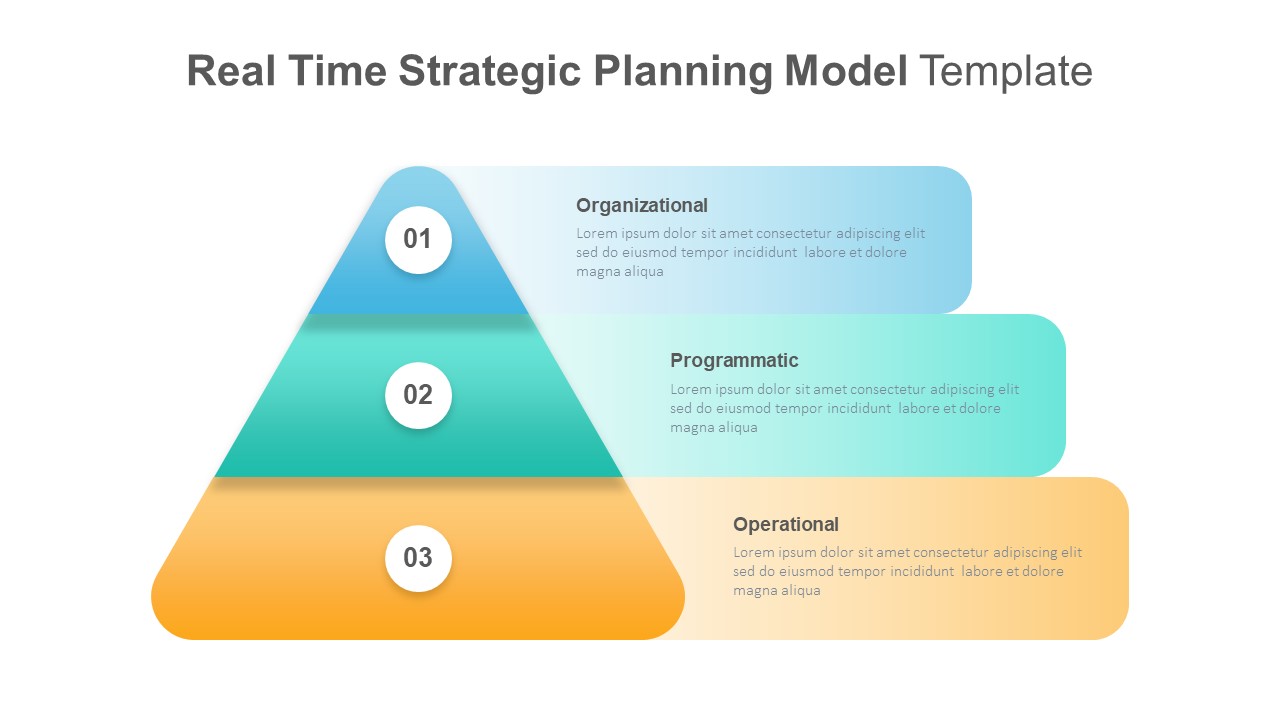
Real-Time Strategic Planning Pyramid Slide for PowerPoint & Google Slides
Business Strategy
Population Pyramid Chart Analysis Template for PowerPoint & Google Slides
Bar/Column
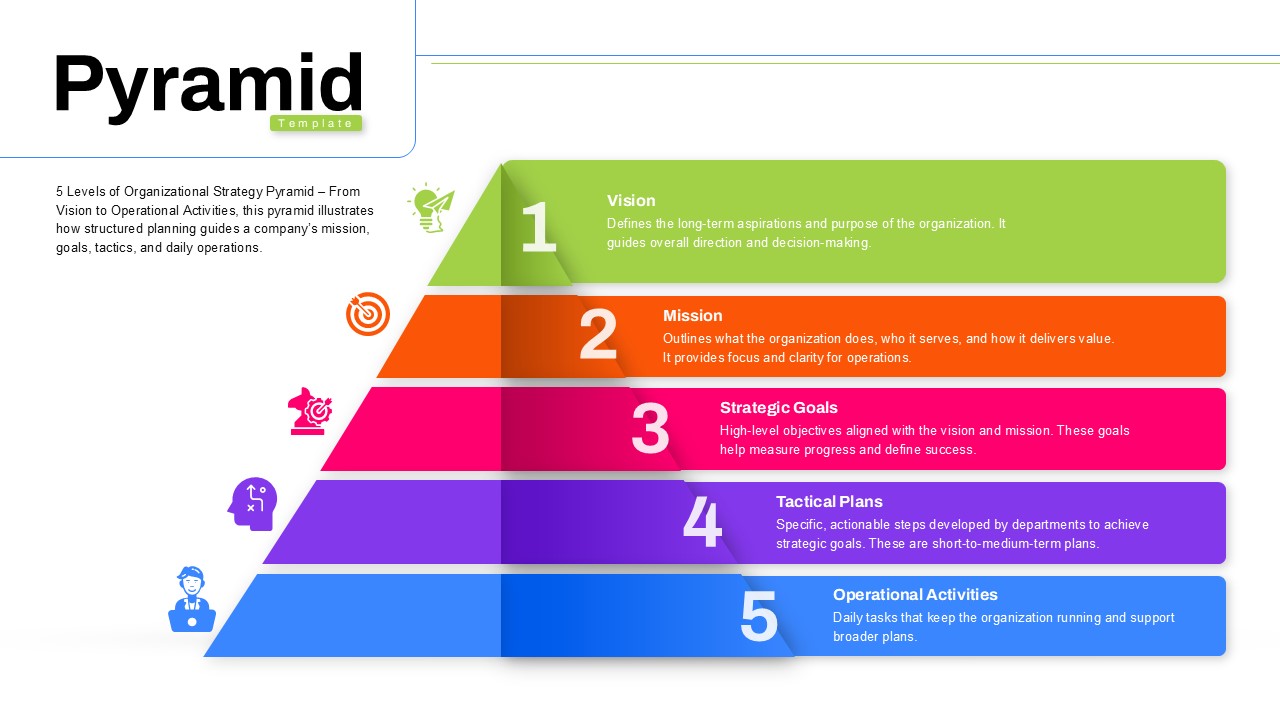
Five-Level Vision Pyramid Diagram Template for PowerPoint & Google Slides
Pyramid
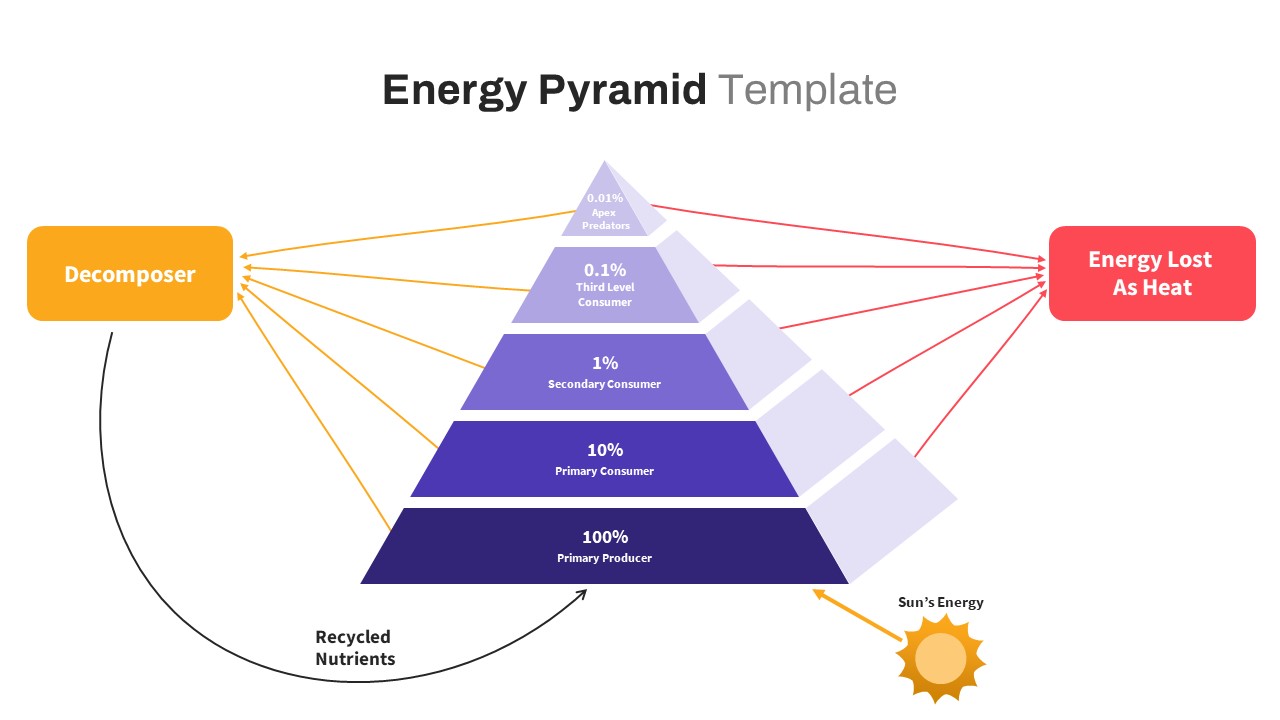
Free Ecological Energy Flow Pyramid Template for PowerPoint & Google Slides
Pyramid
Free
Five-Level Donor Pyramid Philanthropy Template for PowerPoint & Google Slides
Pyramid
Four-Level Food Pyramid Infographic Template for PowerPoint & Google Slides
Pyramid
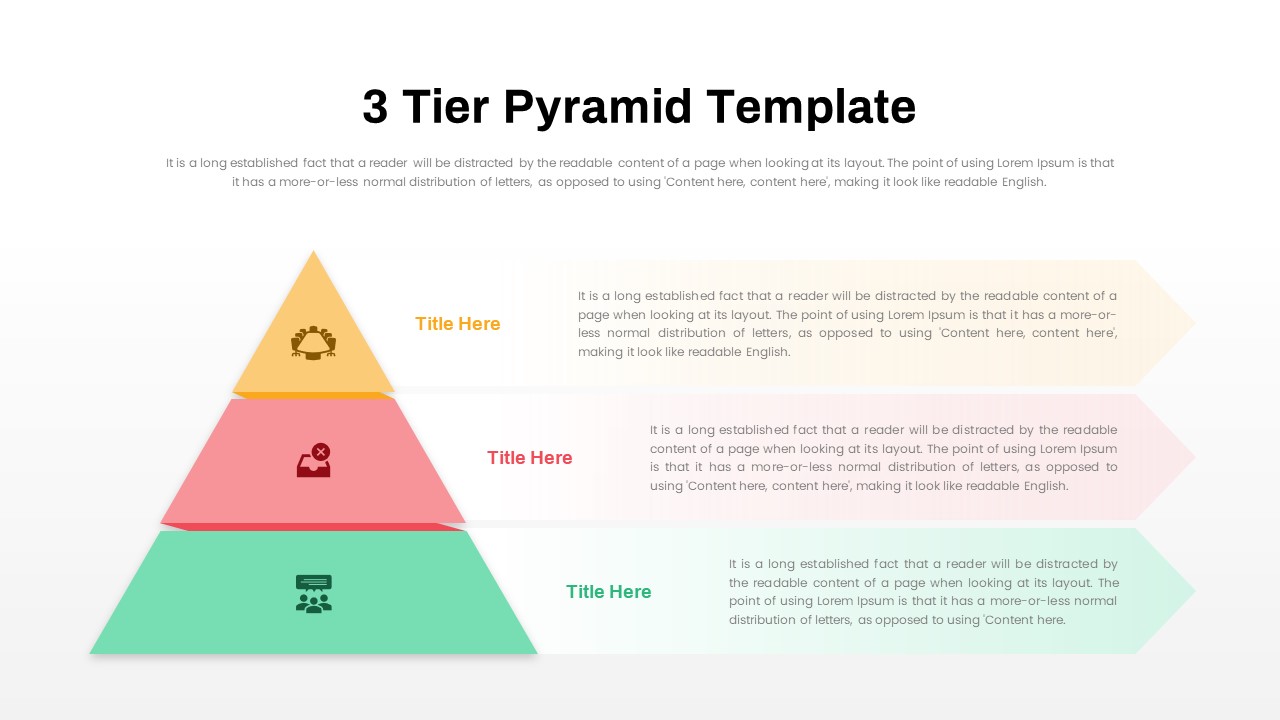
3 Tier Pyramid Template for PowerPoint & Google Slides
Pyramid
Free Learning Retention Pyramid Chart Template for PowerPoint & Google Slides
Pyramid
Free
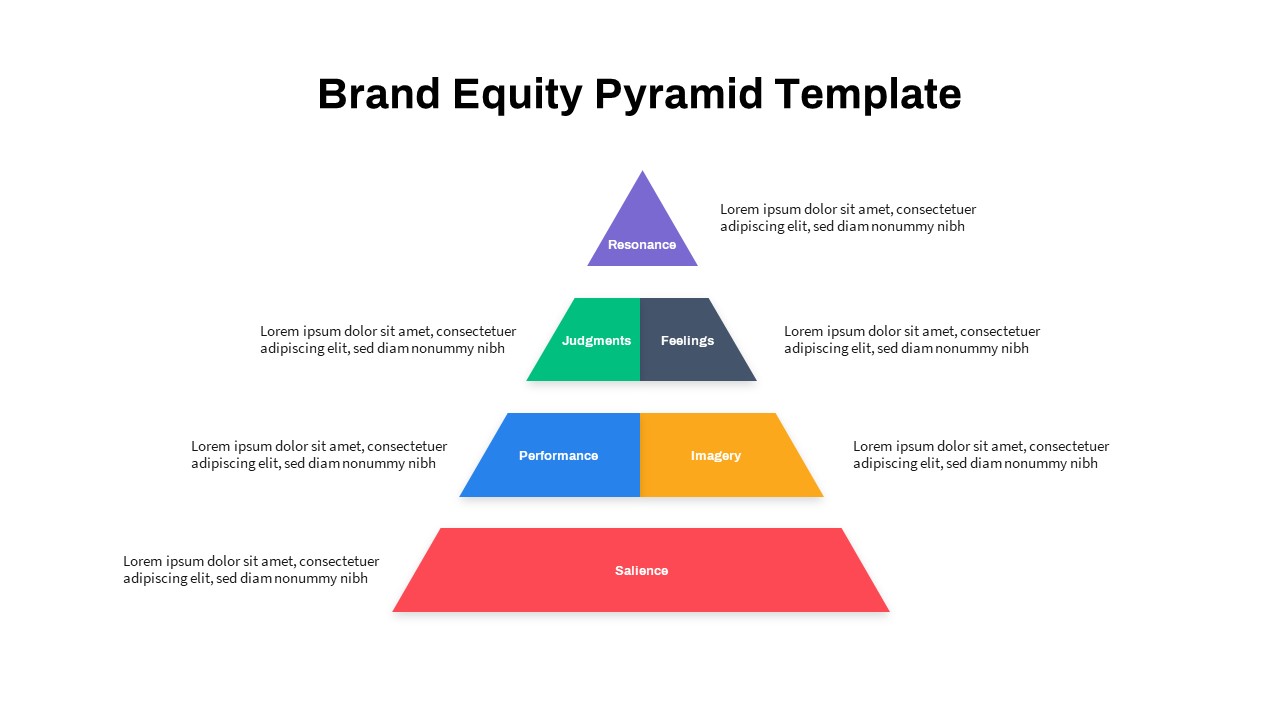
Strategic Brand Equity Pyramid Diagram Template for PowerPoint & Google Slides
Pyramid
Multi-Level Colorful Pyramid Chart Template for PowerPoint & Google Slides
Pyramid
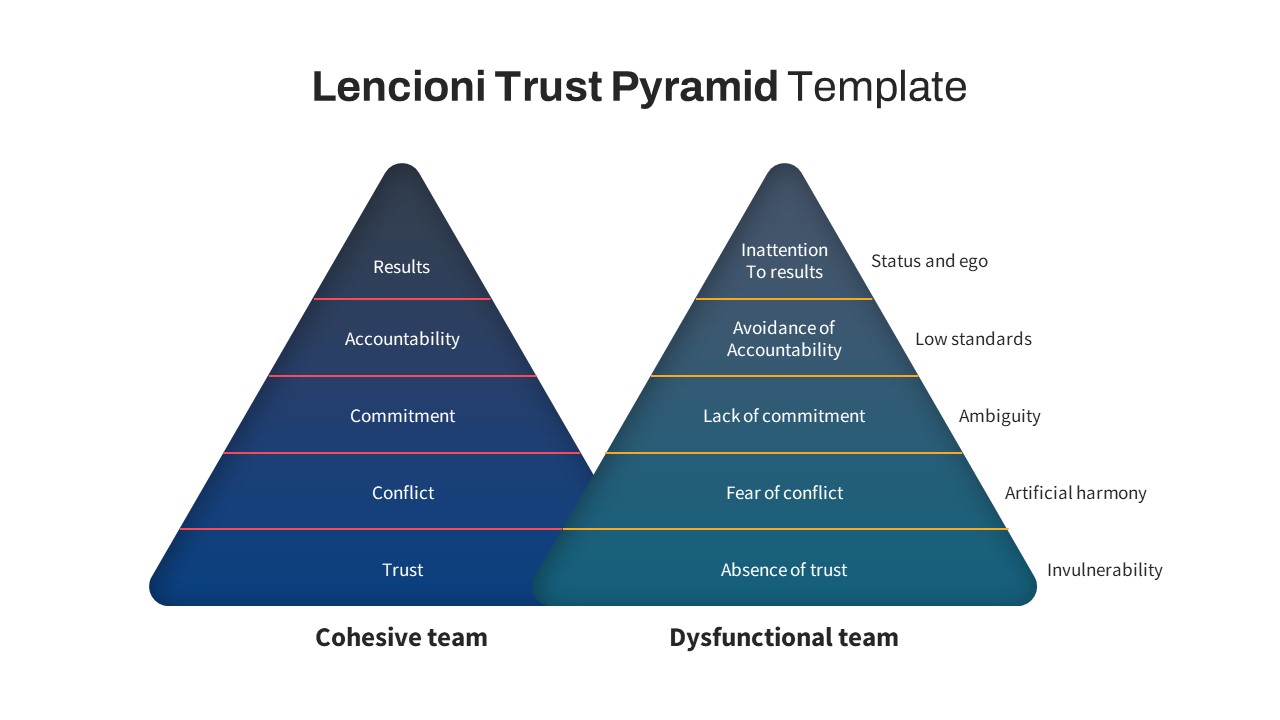
Lencioni Trust Pyramid Diagram Template for PowerPoint & Google Slides
Pyramid
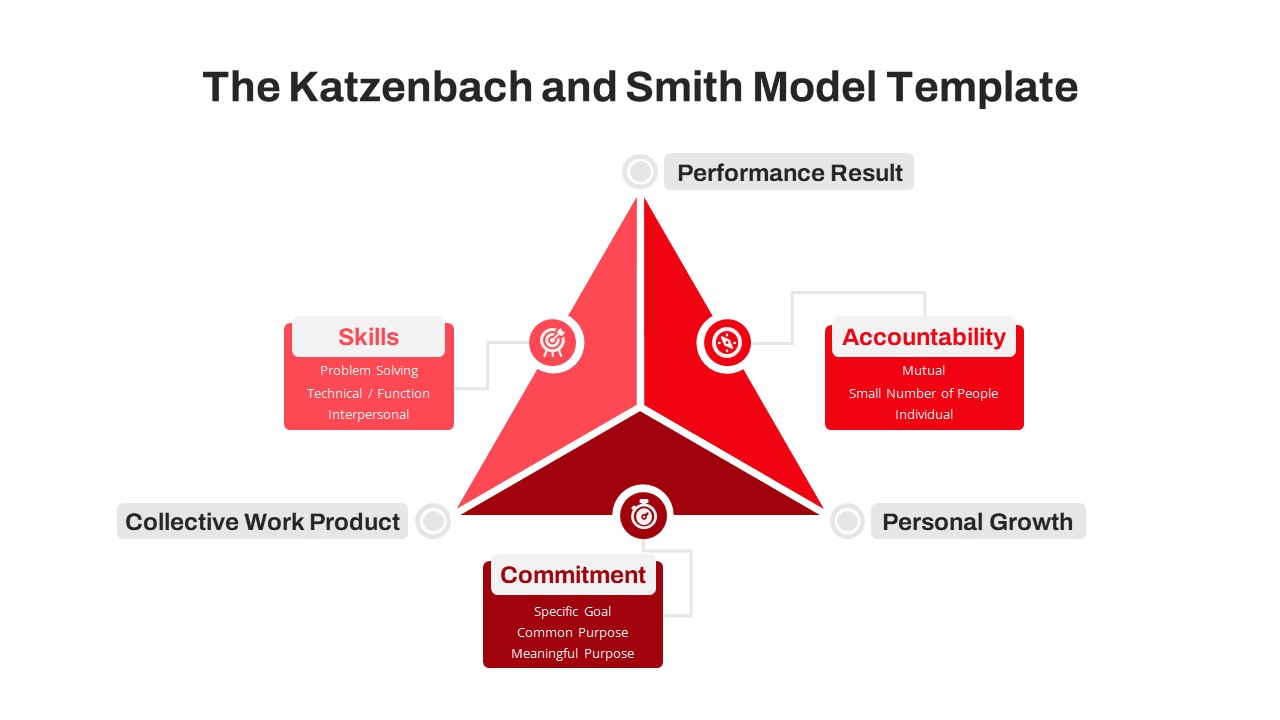
Katzenbach & Smith Model Pyramid Template for PowerPoint & Google Slides
Pyramid
True vs. Incomplete MVP Pyramid Slide for PowerPoint & Google Slides
Pyramid
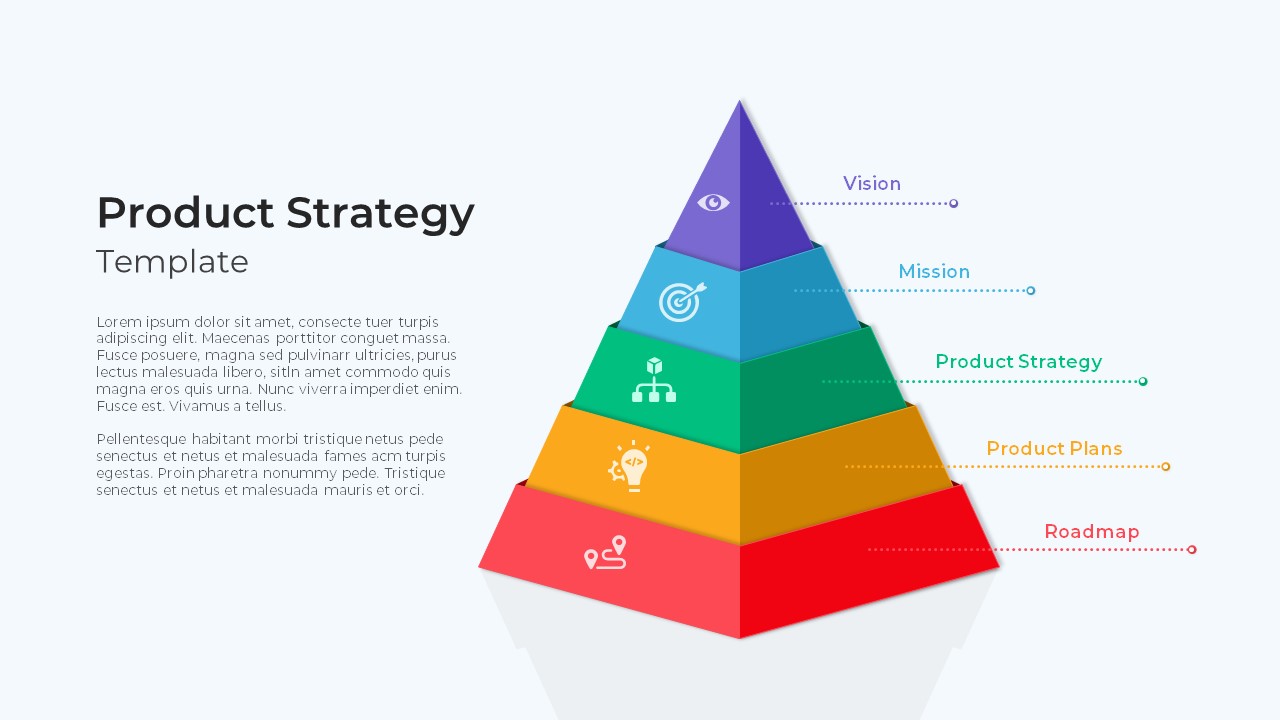
Product Strategy Pyramid Diagram for PowerPoint & Google Slides
Business Strategy
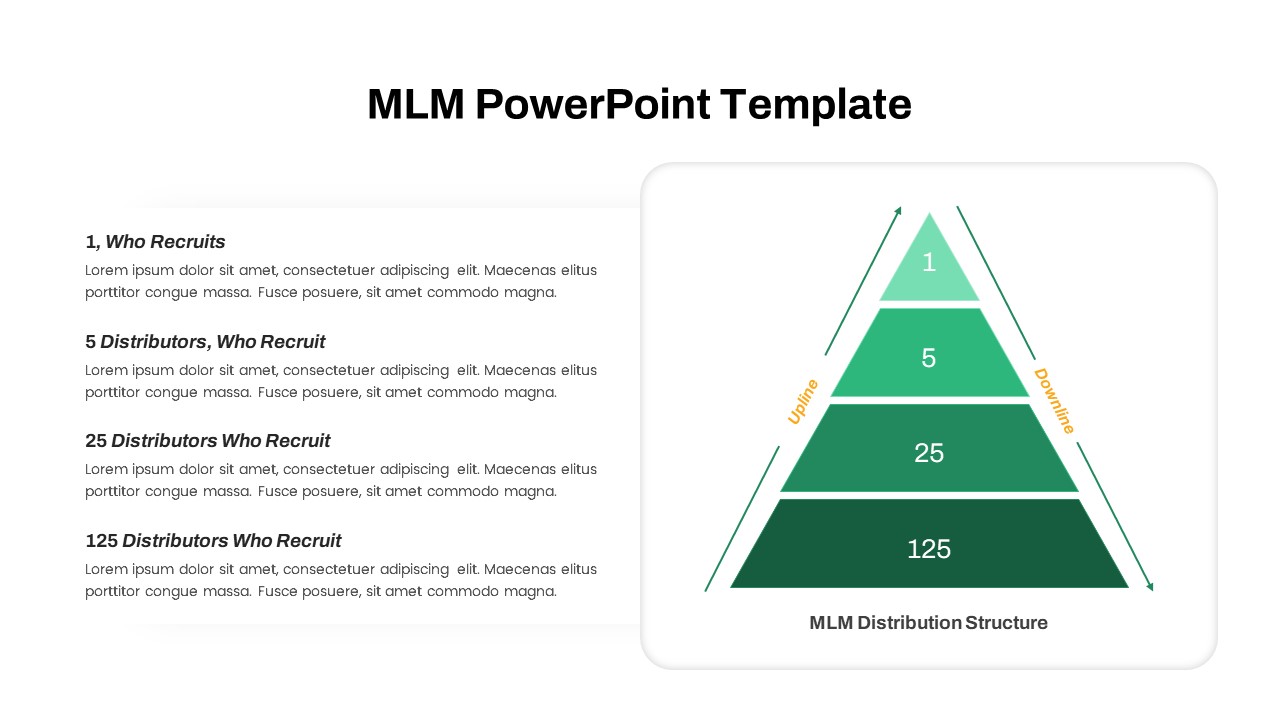
MLM Distribution Pyramid Diagram Template for PowerPoint & Google Slides
Business Models
3D Pyramid Column Chart Infographic Template for PowerPoint & Google Slides
Bar/Column
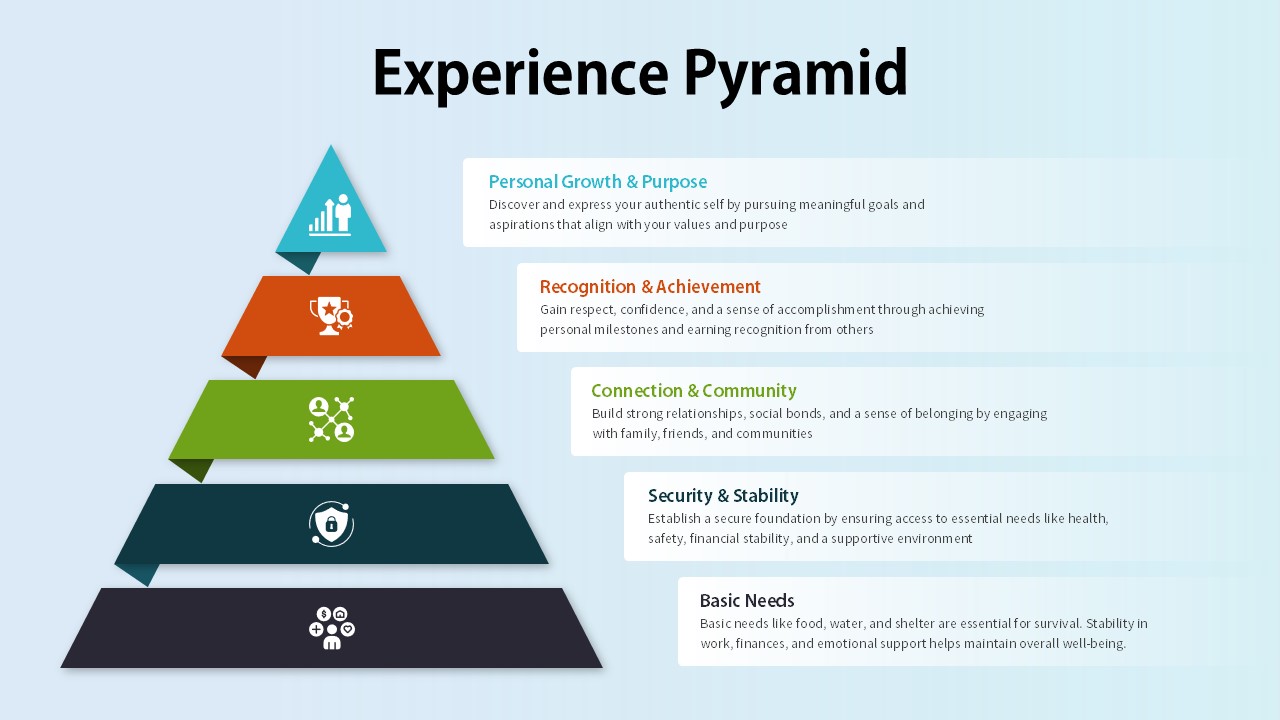
Experience Pyramid Hierarchy Diagram Template for PowerPoint & Google Slides
Pyramid
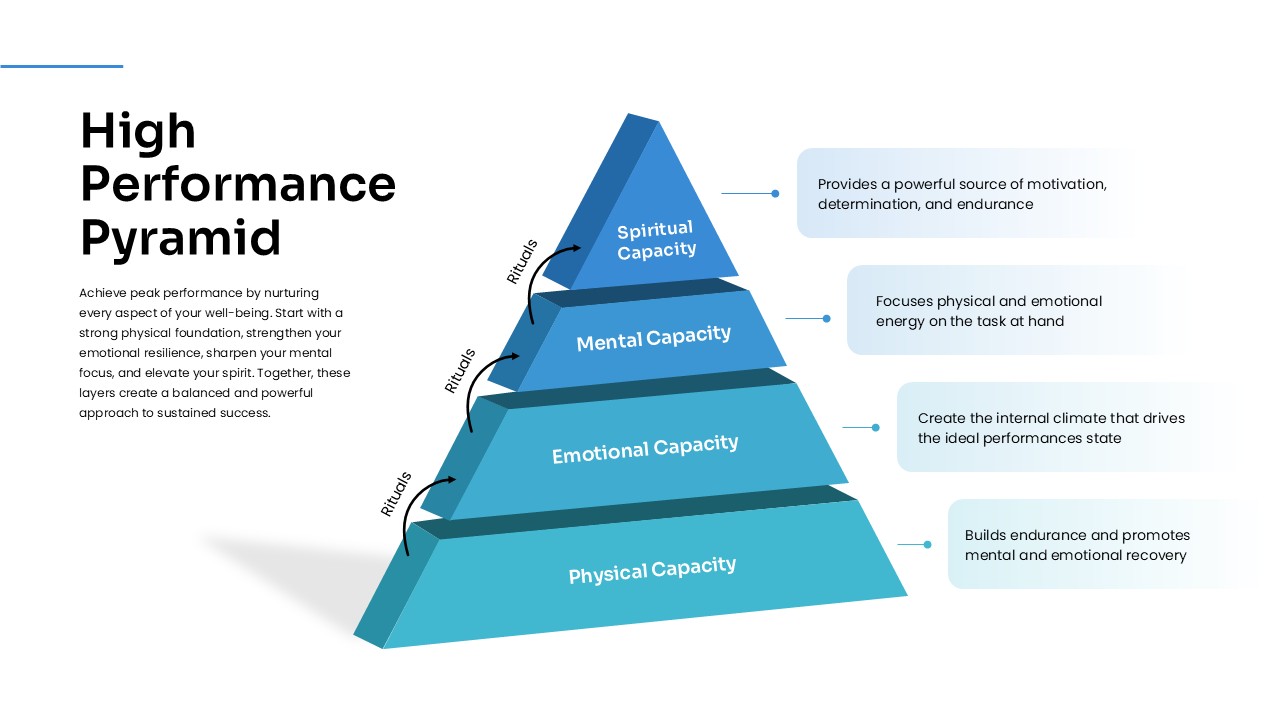
High Performance Pyramid Diagram Template for PowerPoint & Google Slides
Pyramid
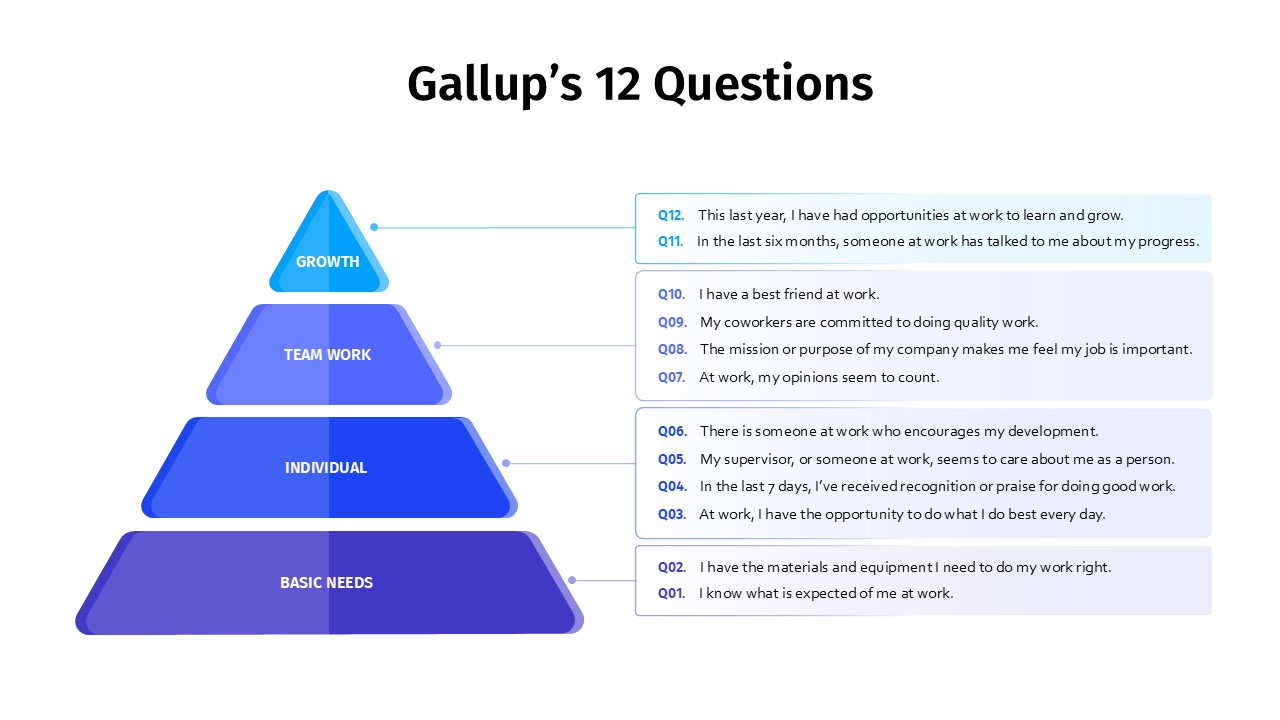
Gallup’s 12 Questions Engagement Pyramid Template for PowerPoint & Google Slides
Pyramid
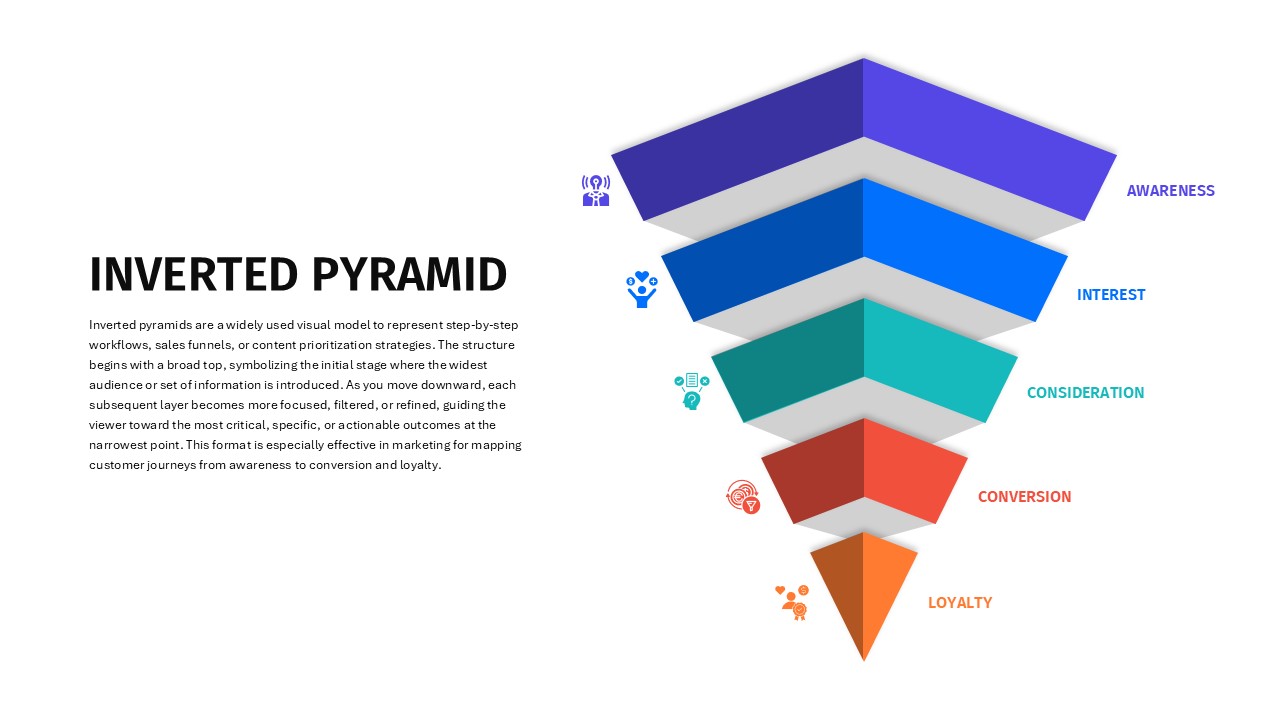
Inverted Pyramid for PowerPoint & Google Slides
Funnel
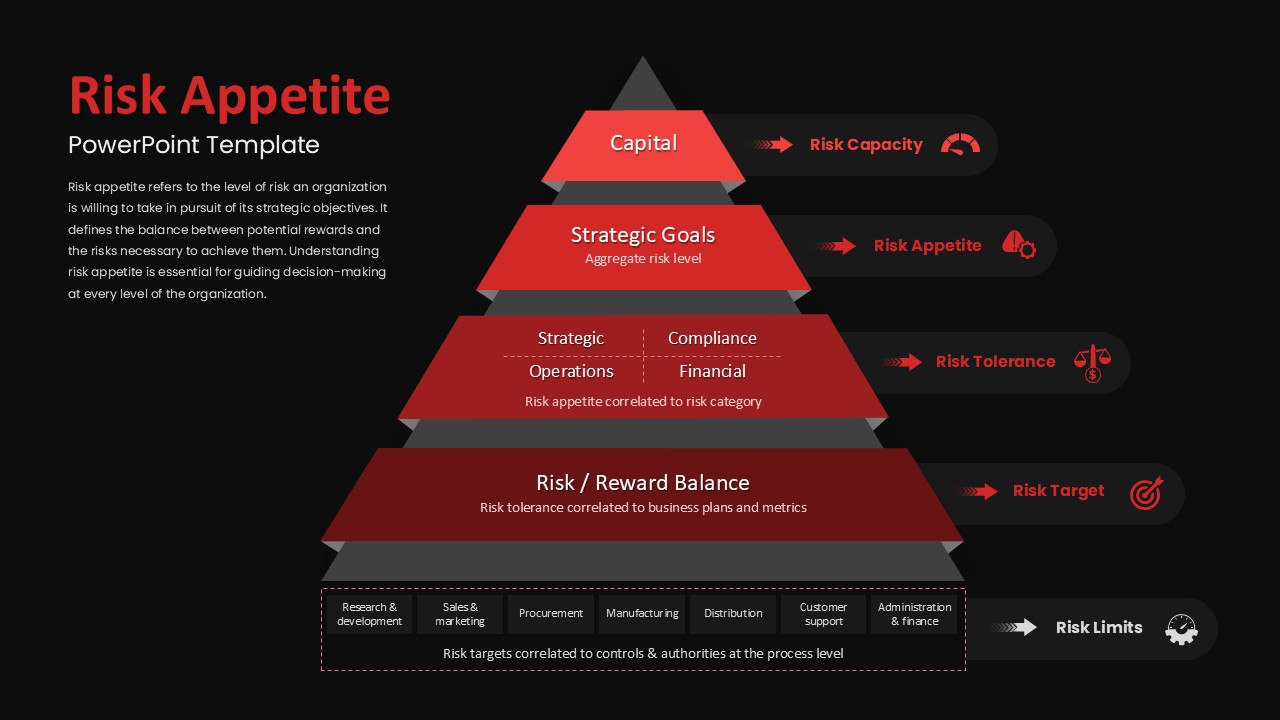
Risk Appetite Pyramid Framework Template for PowerPoint & Google Slides
Pyramid
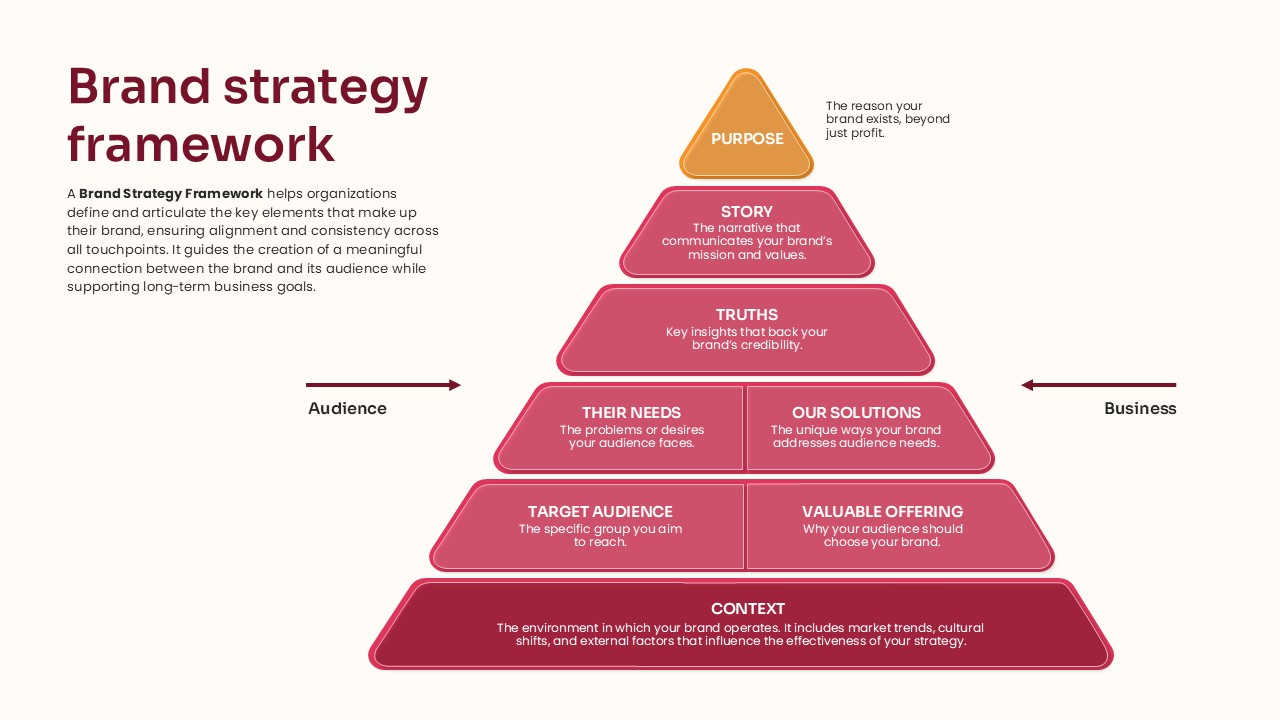
Pyramid Brand Strategy Framework Template for PowerPoint & Google Slides
Business Strategy
Data Governance Roles Pyramid Diagram Template for PowerPoint & Google Slides
Pyramid
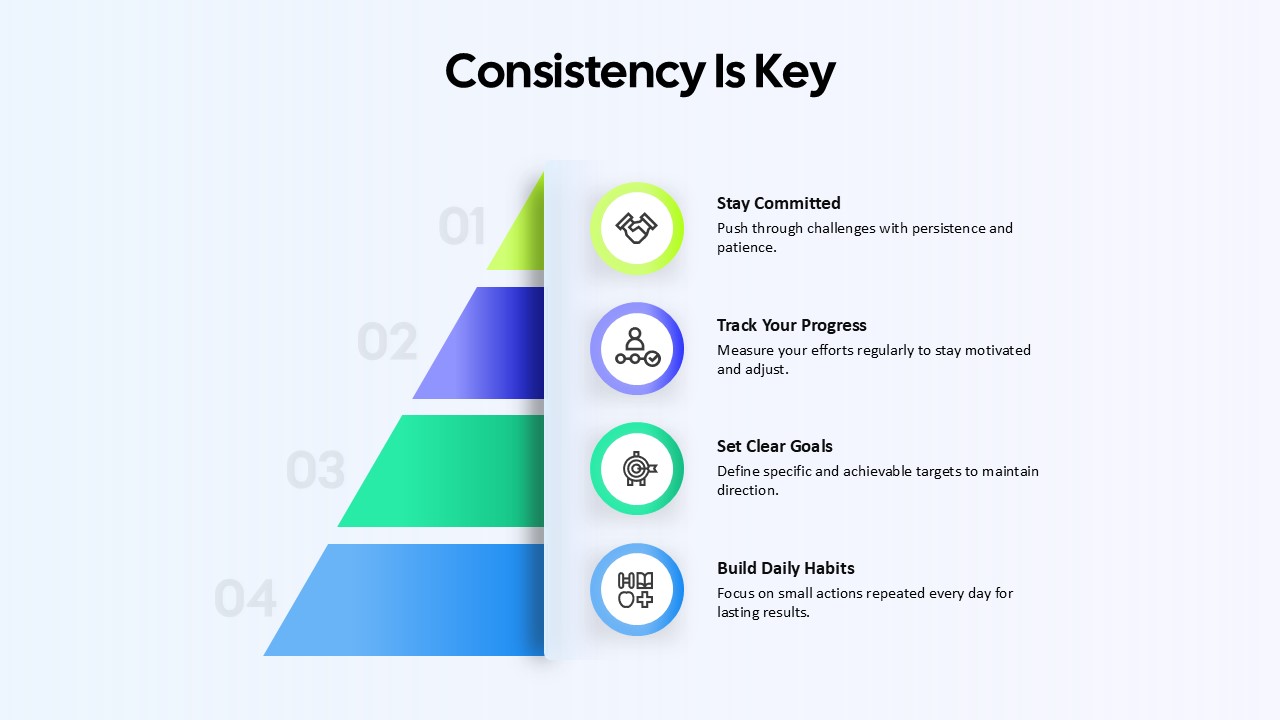
Consistency Is Key Four-Step Pyramid Template for PowerPoint & Google Slides
Process
Five-Stage Pyramid Template for PowerPoint & Google Slides
Pyramid
Four Level Pyramid Infographic Template for PowerPoint & Google Slides
Pyramid
5 Level Hierarchy Pyramid Template for PowerPoint & Google Slides
Pyramid