Fishbone Diagram Analysis Template for PowerPoint & Google Slides


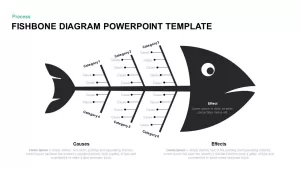
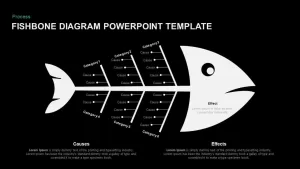
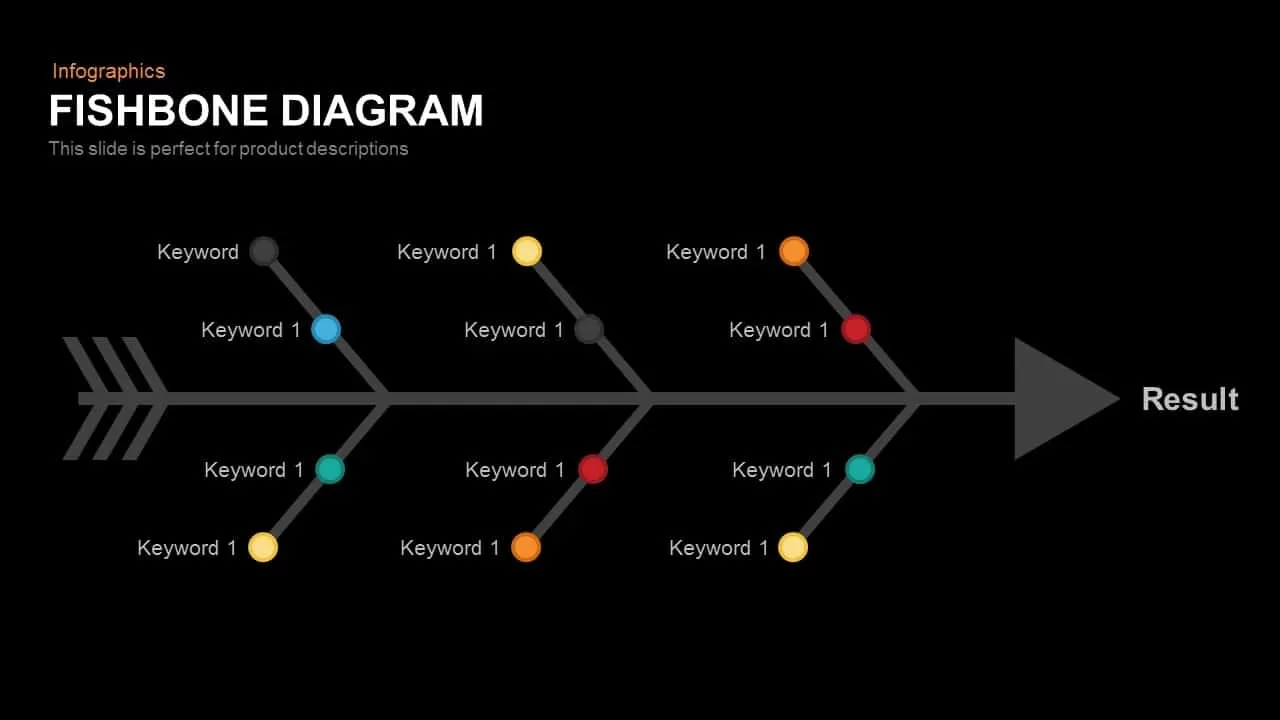
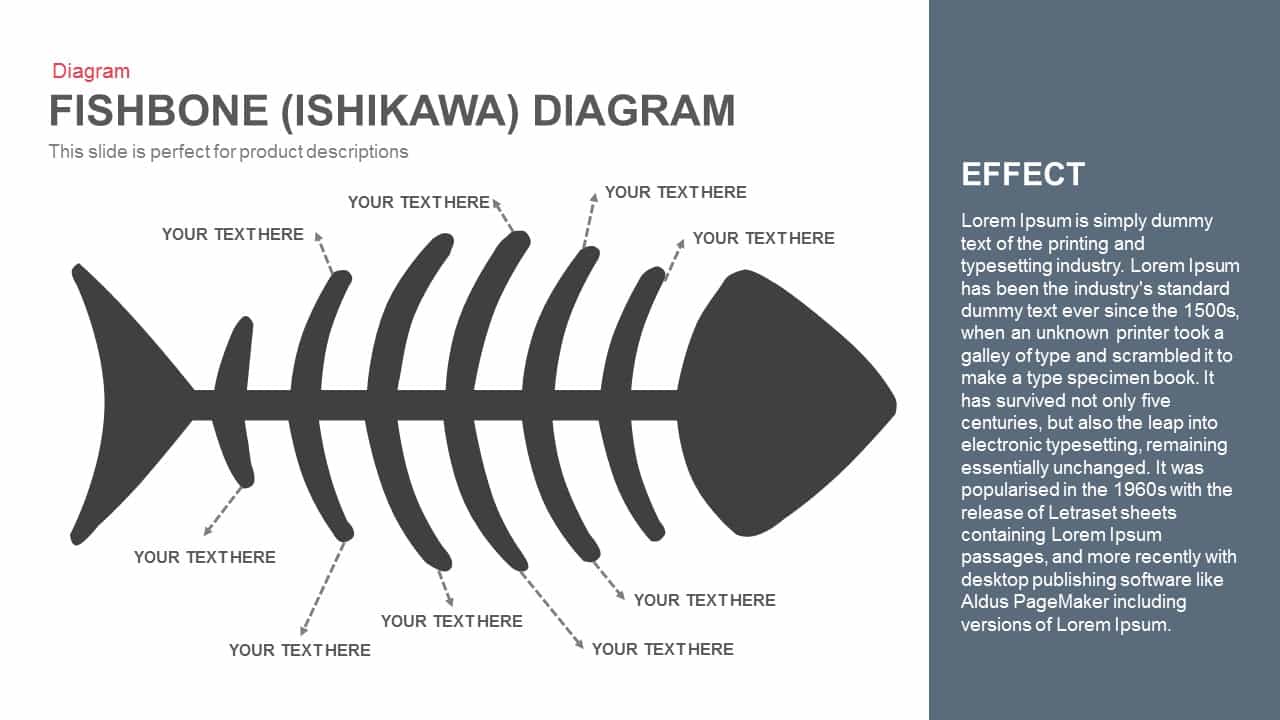
Diagnose root causes and visualize problem‐solving workflows with this classic fishbone (Ishikawa) diagram slide. A bold black fish silhouette anchors six angled “bones,” each labeled Category 1 through Category 6 and offering four editable cause lines. The large fish head on the right highlights the main Effect, while the tail on the left balances the layout. Clean, dark gray text and simple bullet markers on each bone keep focus on your content, and the spacious white background ensures readability during discussions or workshops.
All elements are vector-based on master slides: rename categories, add or remove cause lines, adjust font sizes, and update the Effect text in seconds. Swap the black silhouette for your brand color, or recolor each bone individually to match your theme without disrupting alignment. Prebuilt animations can reveal each category sequentially, guiding your audience through root-cause analysis step by step. Fully compatible with both PowerPoint and Google Slides, this template preserves pixel-perfect clarity and streamlines collaborative editing across distributed teams.
Whether you’re facilitating quality-improvement sessions, conducting risk assessments, or teaching problem-solving methods, this fishbone diagram turns complex cause-and-effect relationships into a clear, engaging visual framework that drives insight and action.
Who is it for
Quality managers, process engineers, and Lean Six Sigma practitioners will rely on this slide to break down contributing factors and drive corrective action. Trainers, consultants, and project teams can use it to workshop solutions, map failure modes, or align stakeholders on next steps.
Other Uses
Repurpose this layout for customer-journey pain-point analyses, stakeholder-impact mapping, or marketing-channel evaluations by renaming categories and adjusting cause details. Its structured format also works for brainstorming sessions, compliance reviews, or incident-investigation workshops.
Login to download this file

Item ID
SB01179
Related Templates

Fishbone Cause Analysis Diagram Template for PowerPoint & Google Slides
Process
Free Root Cause Analysis Fishbone Diagram Template for PowerPoint & Google Slides
Process
Free
5 Why Fishbone Diagram for Root Cause Analysis in PowerPoint & Google Slides
Process
Three-Section Fishbone Process Diagram template for PowerPoint & Google Slides
Process
Fishbone RCA Diagram Template for PowerPoint & Google Slides
Business Strategy
Fishbone Diagram Overview template for PowerPoint & Google Slides
Infographics
Fishbone Diagram Cause-and-Effect Template for PowerPoint & Google Slides
Process
Free Color-Coded Fishbone Diagram Template for PowerPoint & Google Slides
Project
Free
Fishbone Cause and Effect Diagram Template for PowerPoint & Google Slides
Process
Underwater Fishbone Cause-Effect Diagram Template for PowerPoint & Google Slides
Process
Fishbone Process Diagram template for PowerPoint & Google Slides
Infographics
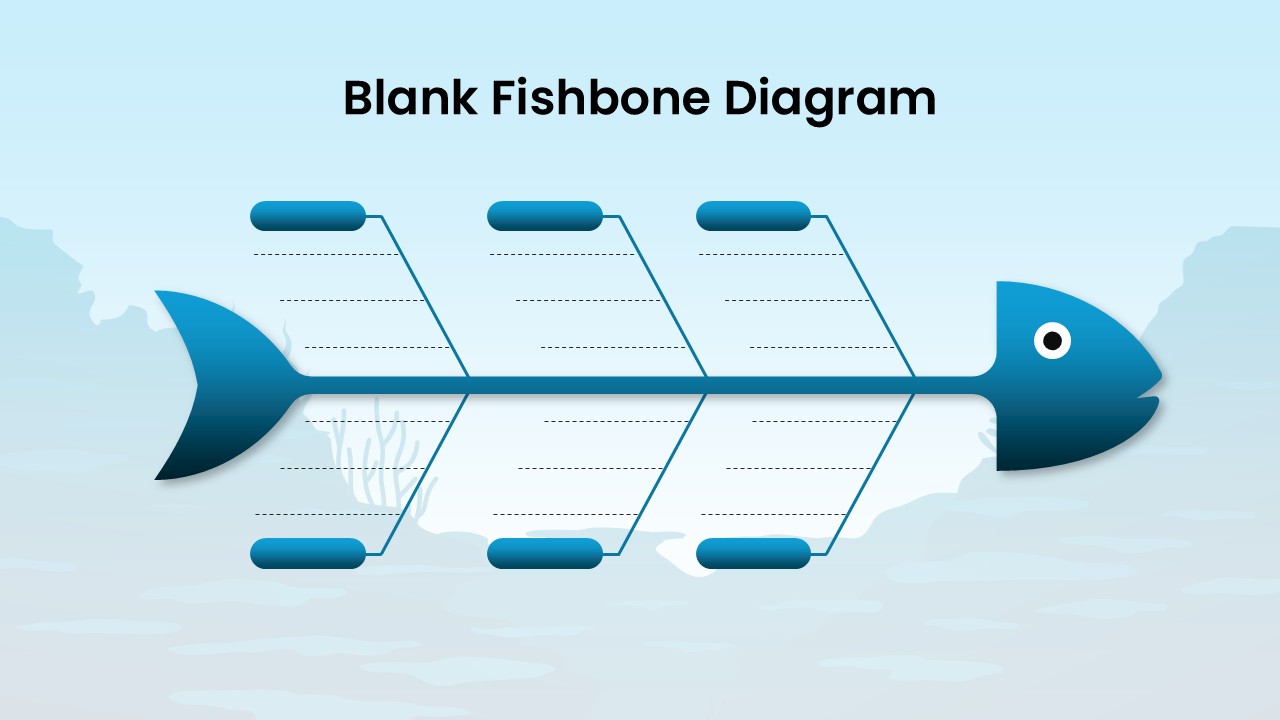
Blank Fishbone Diagram Template for PowerPoint & Google Slides
Process
Fishbone (Ishikawa) Diagram for PowerPoint & Google Slides
Process
Fishbone Cause and Effect Infographic Template for PowerPoint & Google Slides
Infographics
Fishbone Timeline Infographic Series Template for PowerPoint & Google Slides
Manufacturing
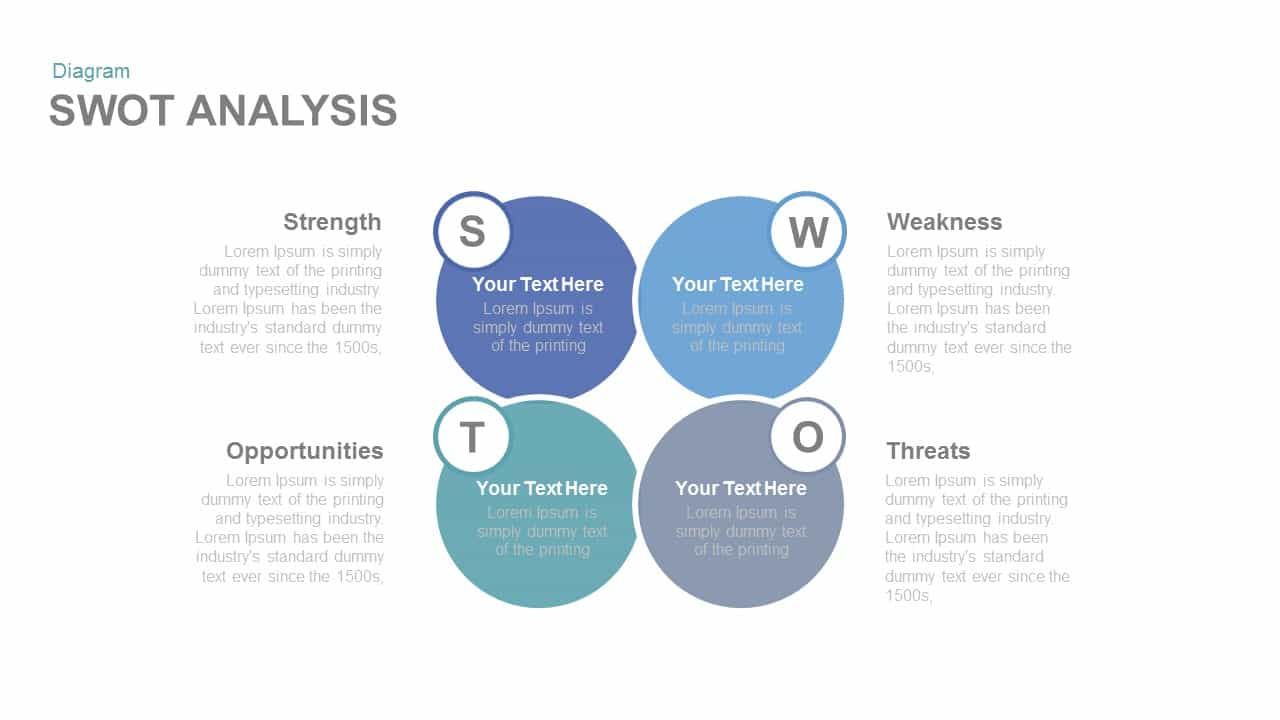
Modern Circle SWOT Analysis Diagram Template for PowerPoint & Google Slides
SWOT
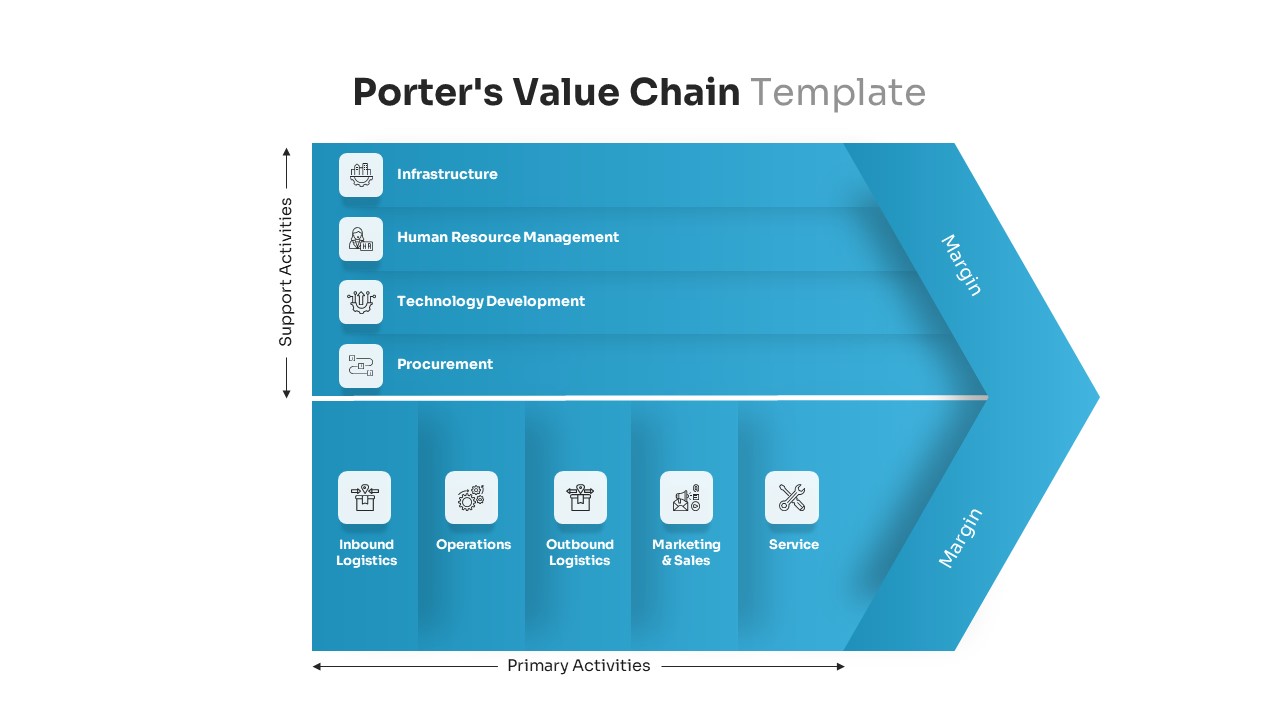
Porter’s Value Chain Analysis Diagram Template for PowerPoint & Google Slides
Business Strategy
Editable Force Field Analysis Diagram Template for PowerPoint & Google Slides
Business Plan

Professional PESTEL Analysis Diagram Template for PowerPoint & Google Slides
PEST
Puzzle-Style SWOT Analysis Table Diagram Template for PowerPoint & Google Slides
SWOT
PEST Analysis Circular Diagram Template for PowerPoint & Google Slides
PEST
PESTLE Analysis Table Layout Diagram Template for PowerPoint & Google Slides
PEST
SWOT Analysis Gear Diagram Slide Template for PowerPoint & Google Slides
SWOT

Interactive Gap Analysis Puzzle Diagram Template for PowerPoint & Google Slides
Gap
Cluster Analysis Infographic Diagram Template for PowerPoint & Google Slides
Business
Four-Quadrant SWOT Analysis Diagram Template for PowerPoint & Google Slides
SWOT
Business Target Analysis Diagram Template for PowerPoint & Google Slides
Circular
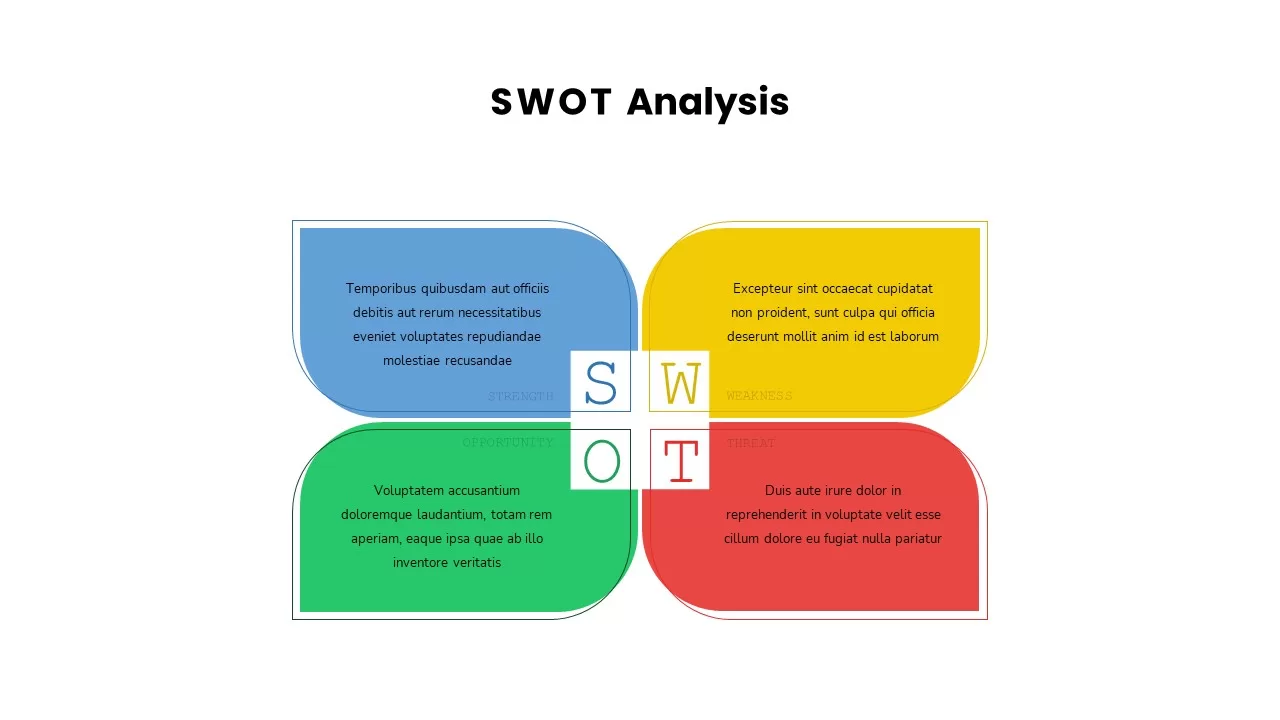
Butterfly SWOT Analysis Diagram Template for PowerPoint & Google Slides
SWOT
Four-Part SWOT Analysis Diagram Template for PowerPoint & Google Slides
SWOT

SWOT Analysis Infographic Diagram Template for PowerPoint & Google Slides
SWOT
IQ Scale Analysis Diagram template for PowerPoint & Google Slides
Employee Performance
Puzzle Piece SWOT Analysis Diagram Template for PowerPoint & Google Slides
Opportunities Challenges
Six-Step Business Analysis Diagram template for PowerPoint & Google Slides
Circular
Business Process Analysis Cycle Diagram Template for PowerPoint & Google Slides
Business Strategy
Experience Curve Analysis Diagram Template for PowerPoint & Google Slides
Business Strategy
Cost-Volume-Profit Analysis Diagram Template for PowerPoint & Google Slides
Finance

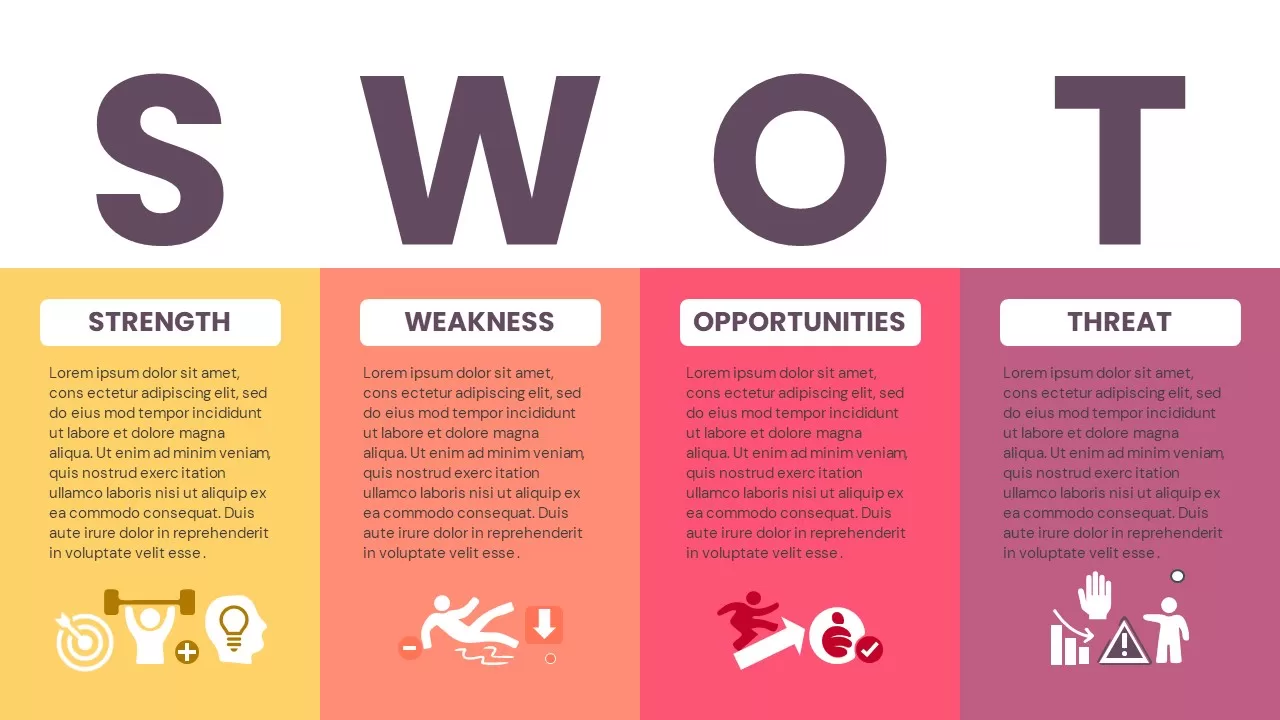
Colorful SWOT Analysis Diagram Template for PowerPoint & Google Slides
SWOT
Bottleneck Process Analysis Diagram Template for PowerPoint & Google Slides
Process
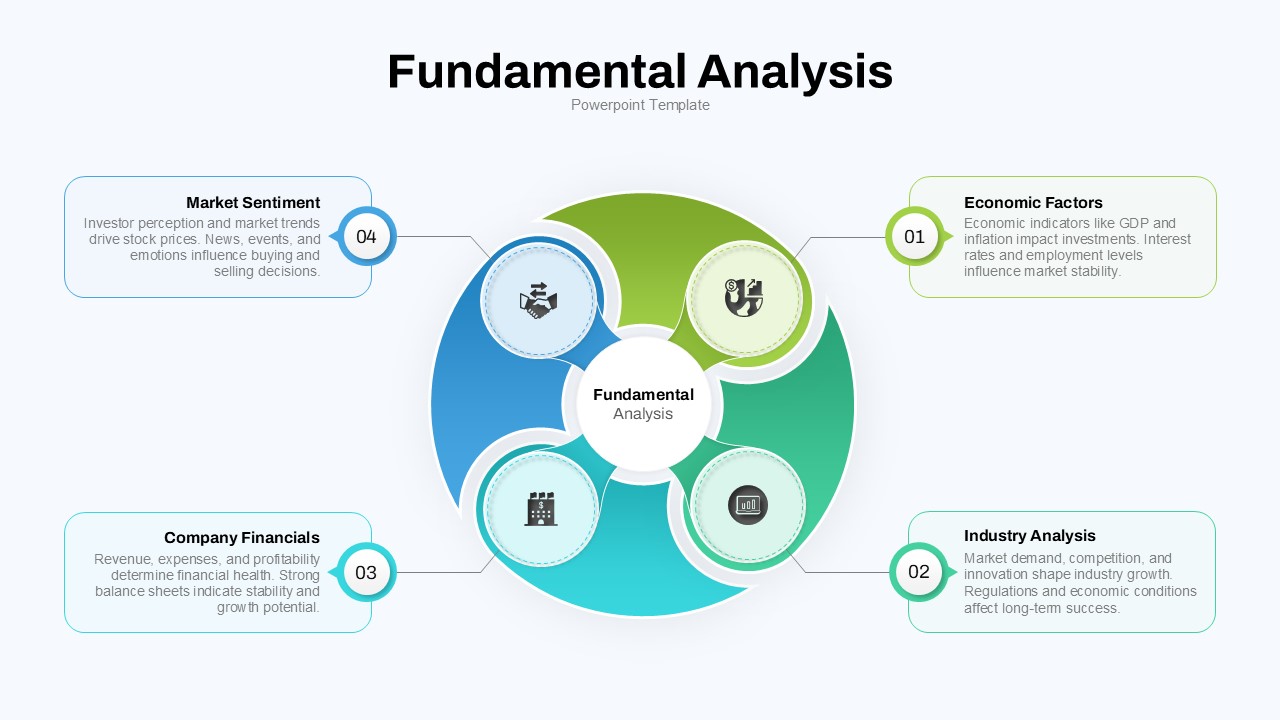
Fundamental Analysis Circular Diagram Template for PowerPoint & Google Slides
Circular
Cultural Web Analysis Circular Diagram Template for PowerPoint & Google Slides
Circular
DESTEP Marketing Analysis Diagram Template for PowerPoint & Google Slides
Circular
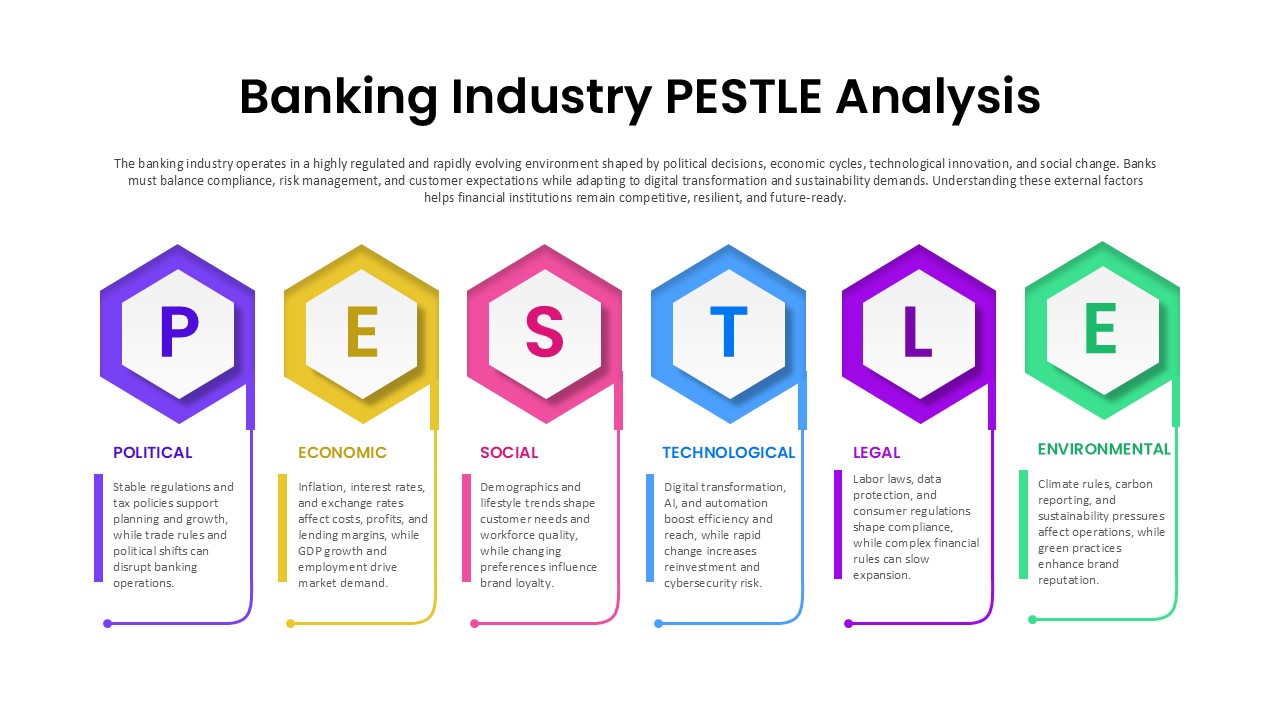
Banking Industry PESTLE Analysis Diagram Template for PowerPoint & Google Slides
PEST
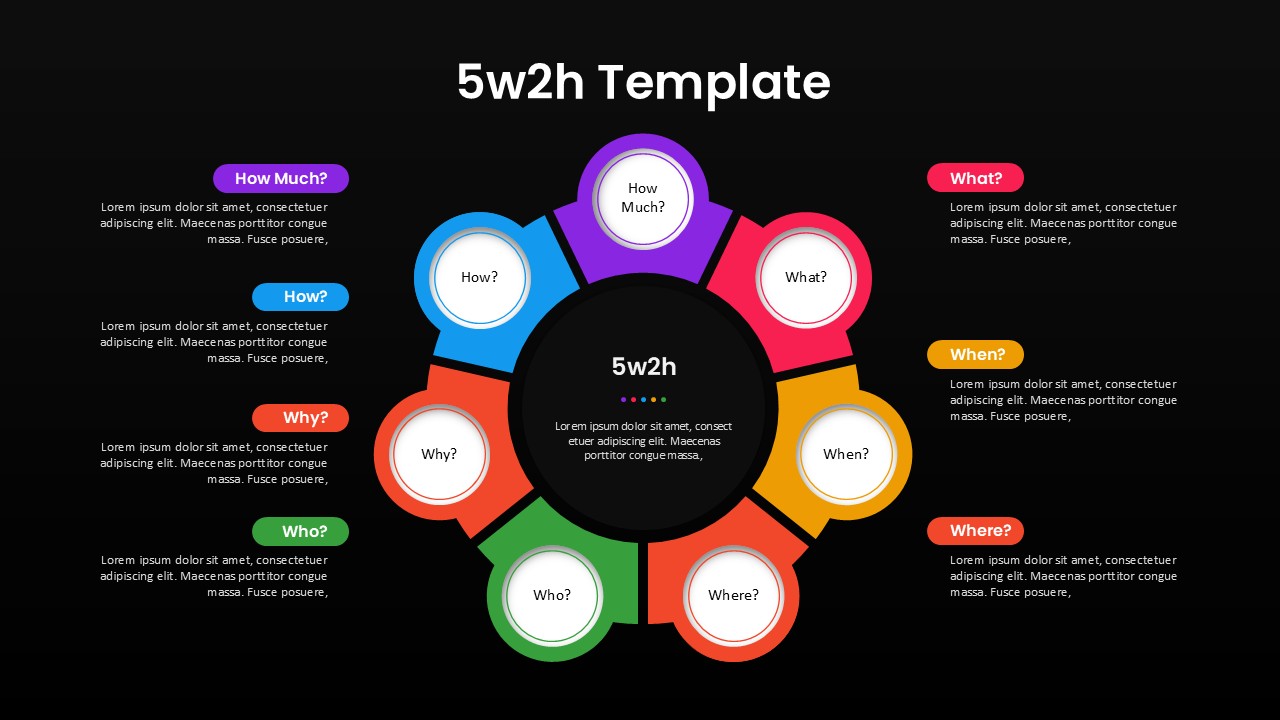
5W2H Analysis Radial Diagram Template for PowerPoint & Google Slides
Decision Tree
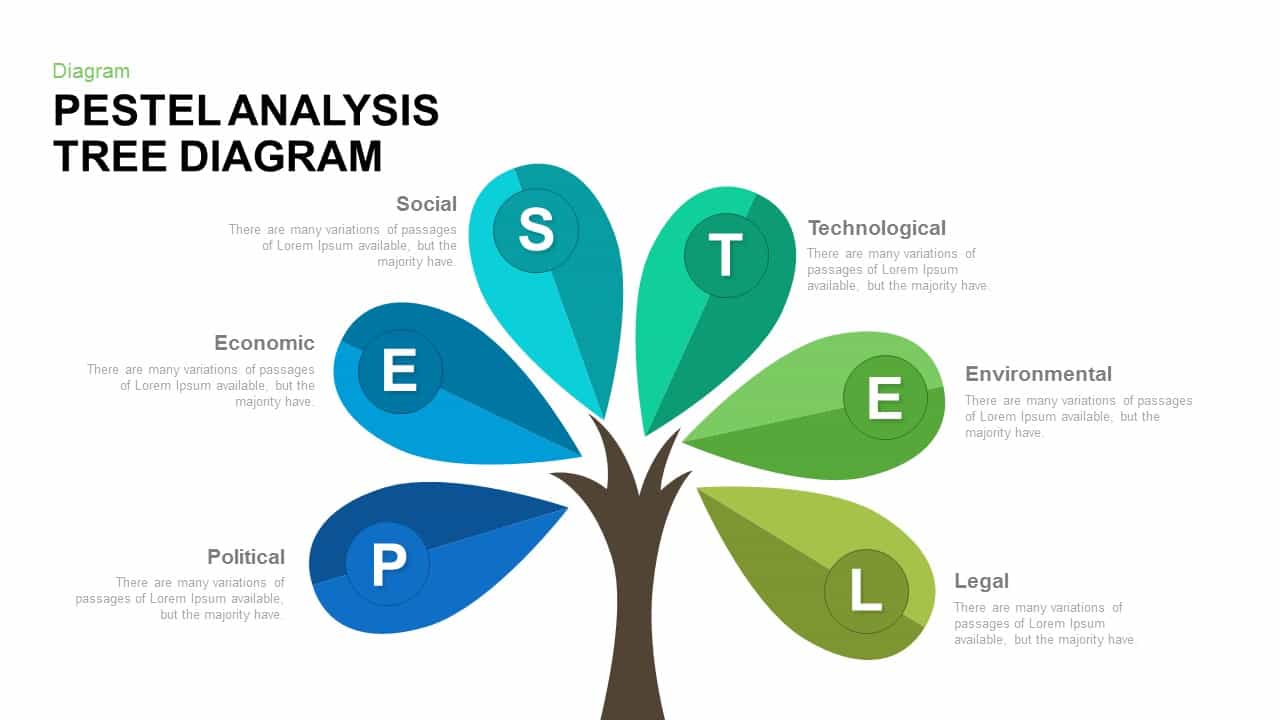
PESTEL Analysis Tree Diagram for PowerPoint & Google Slides
Process
PEST Analysis PowerPoint Template for PowerPoint & Google Slides
Business Strategy
Line Graph Analysis template for PowerPoint & Google Slides
Charts
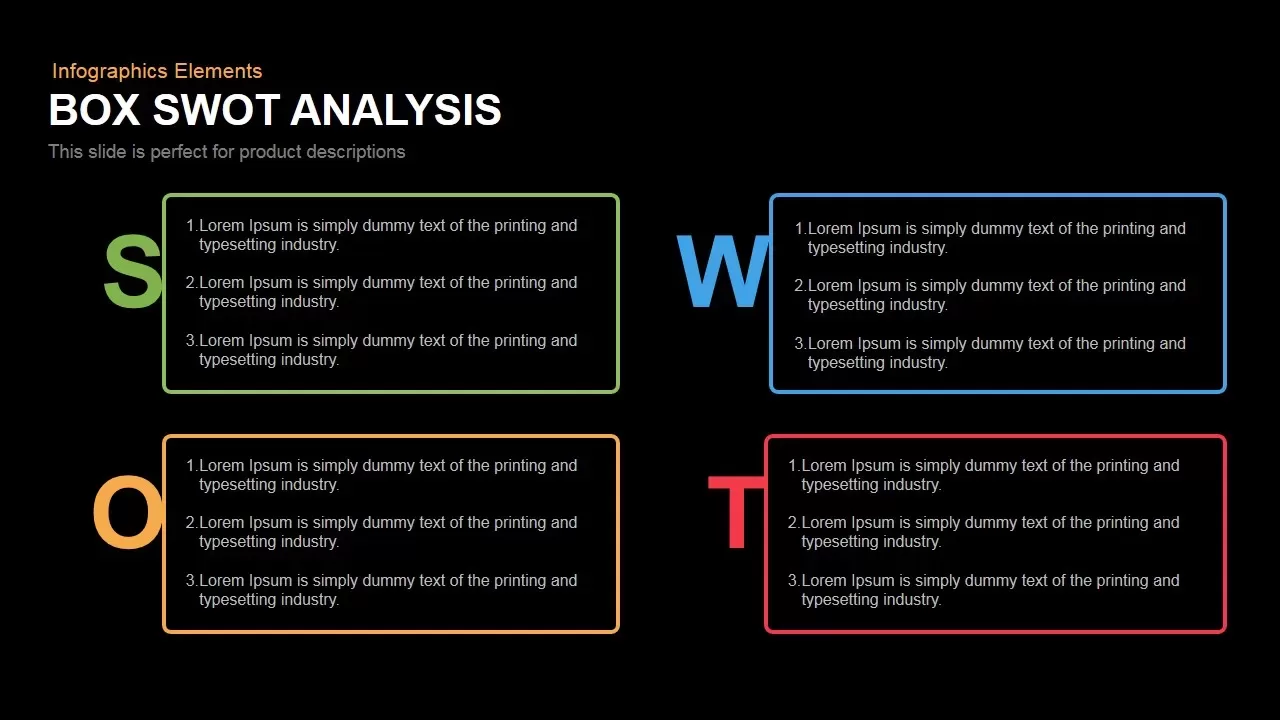
Box SWOT Analysis Infographic Template for PowerPoint & Google Slides
SWOT
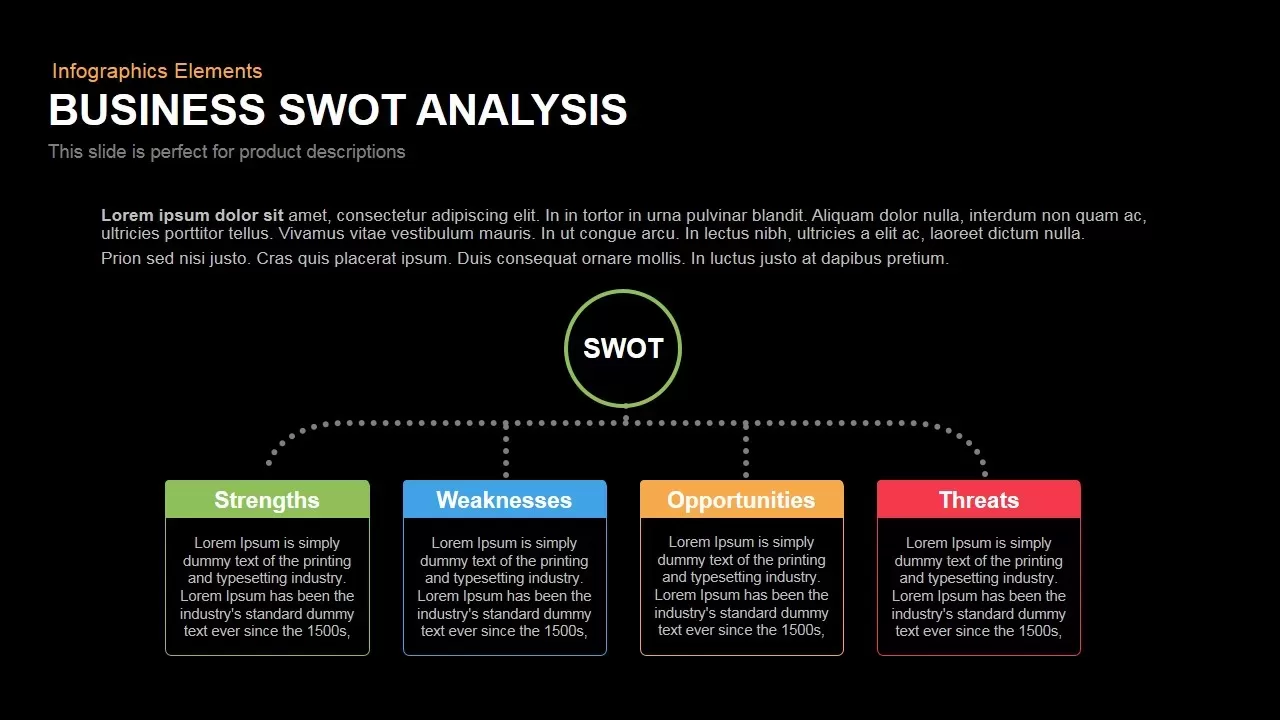
Box Business SWOT Analysis Template for PowerPoint & Google Slides
SWOT
E-Learning Report Analysis Template for PowerPoint & Google Slides
Infographics
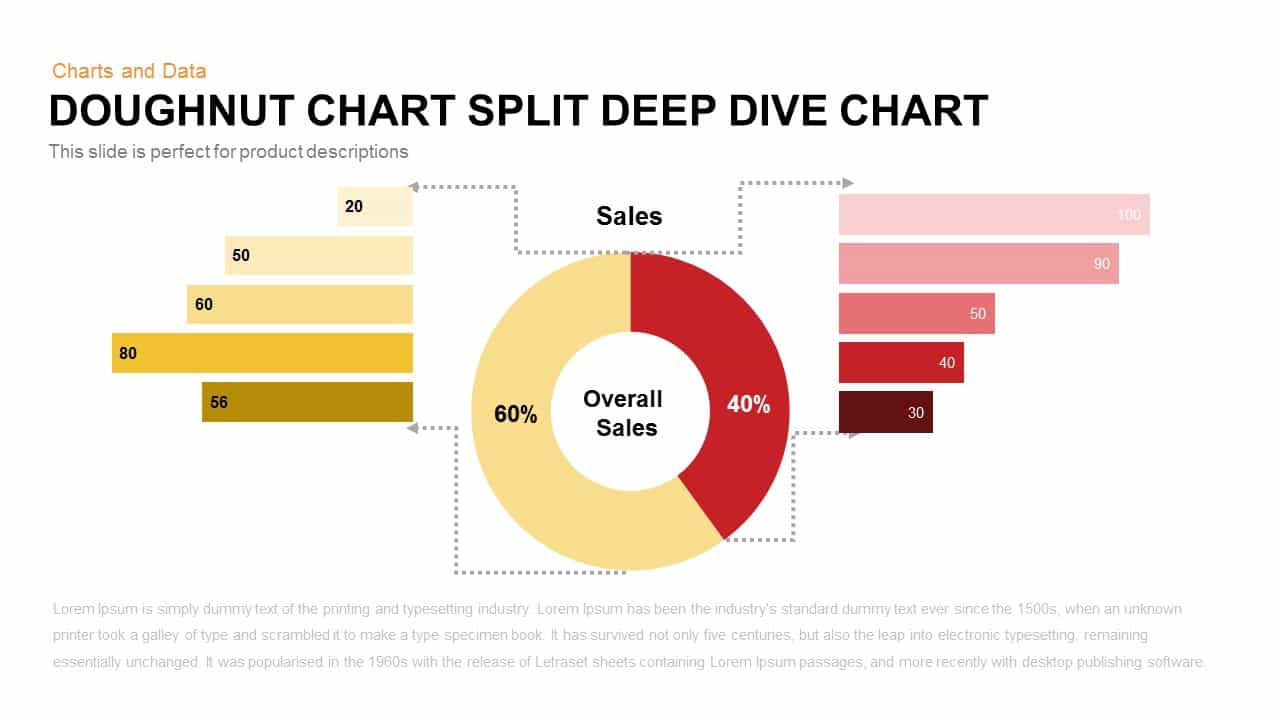
Split Doughnut Deep Dive Sales Analysis Template for PowerPoint & Google Slides
Pie/Donut
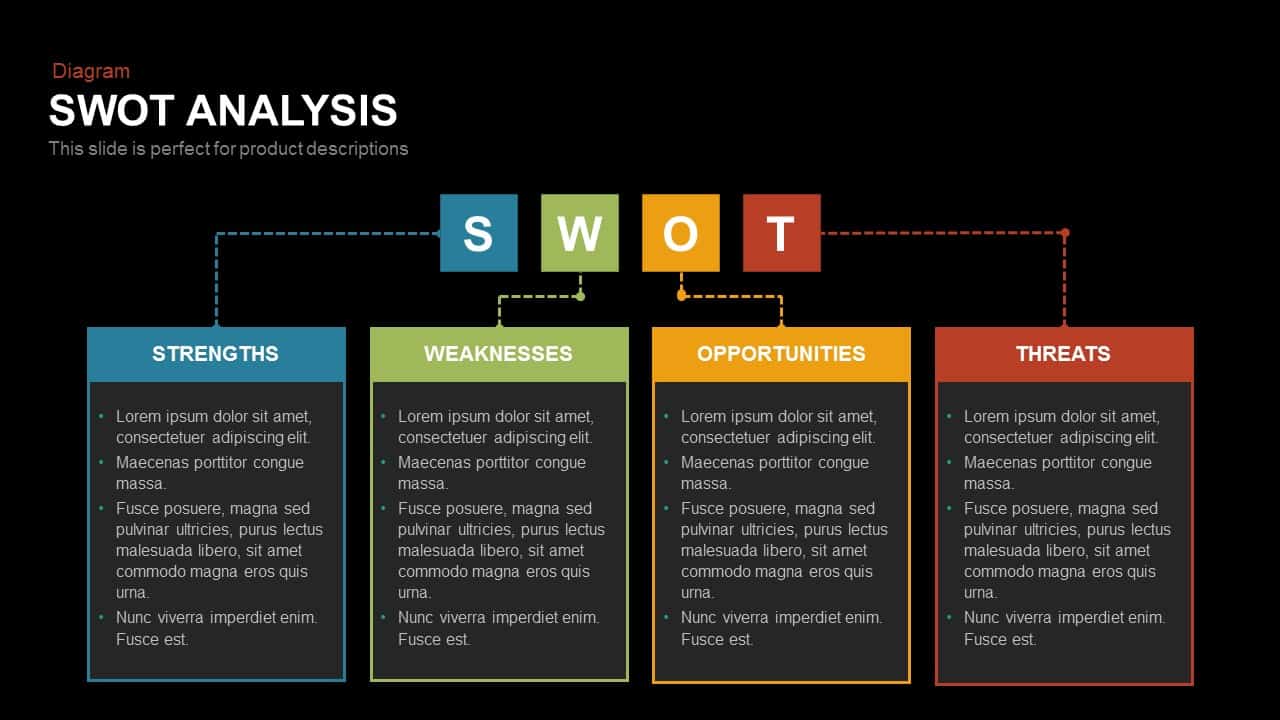
SWOT Analysis template for PowerPoint & Google Slides
SWOT
Free SWOT Analysis template for PowerPoint & Google Slides
SWOT
Free
Interactive 3D Puzzle SWOT Analysis Slide Template for PowerPoint & Google Slides
SWOT
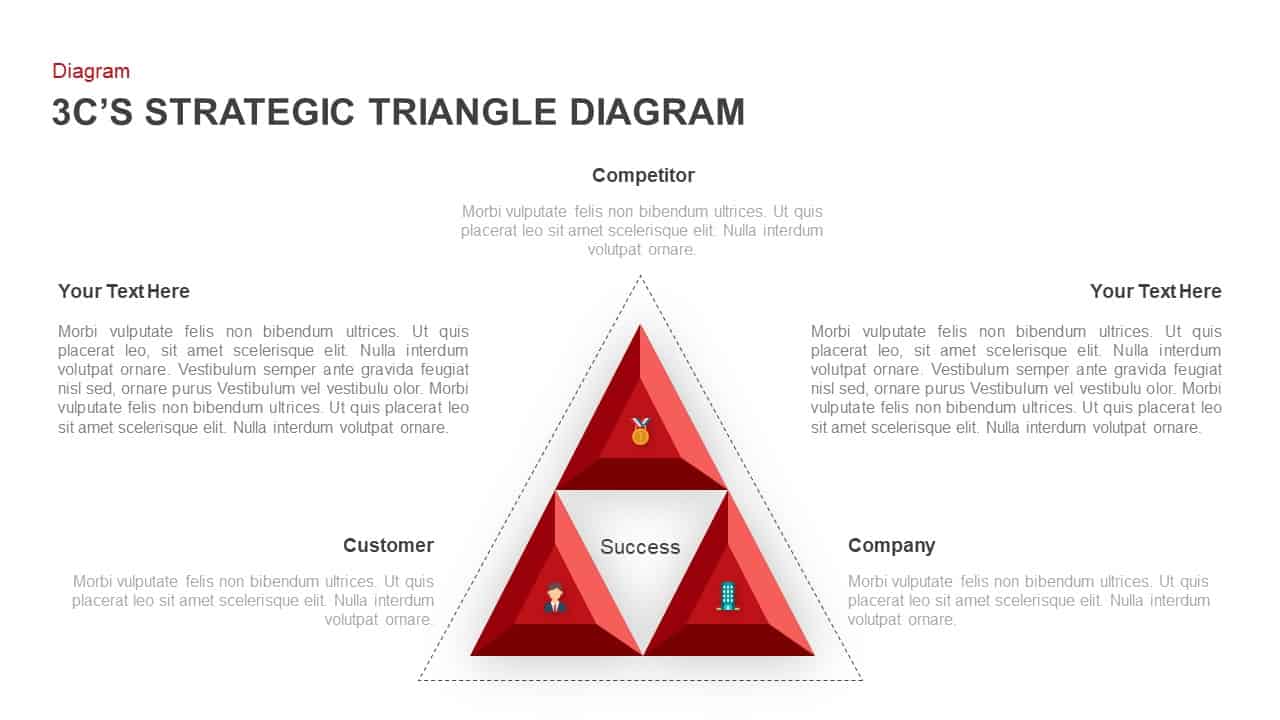
3C Strategic Triangle Analysis Template for PowerPoint & Google Slides
Competitor Analysis
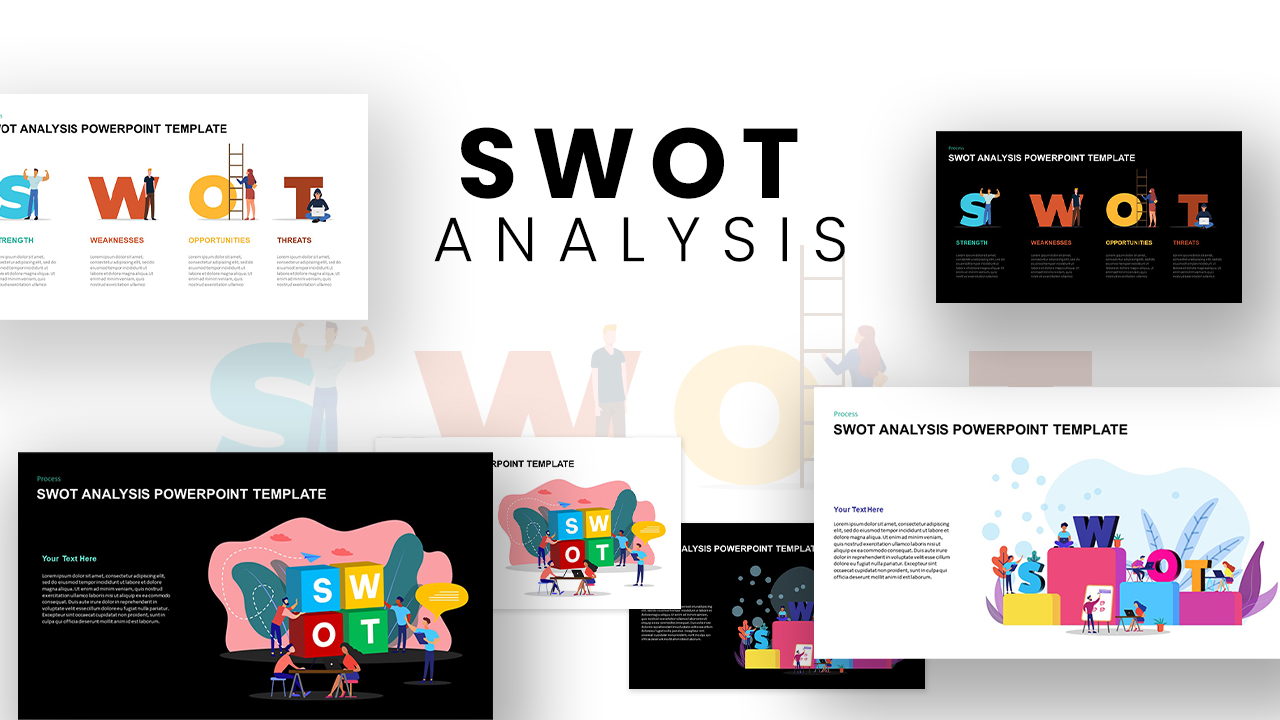
Versatile SWOT Analysis Slide Collection Template for PowerPoint & Google Slides
SWOT
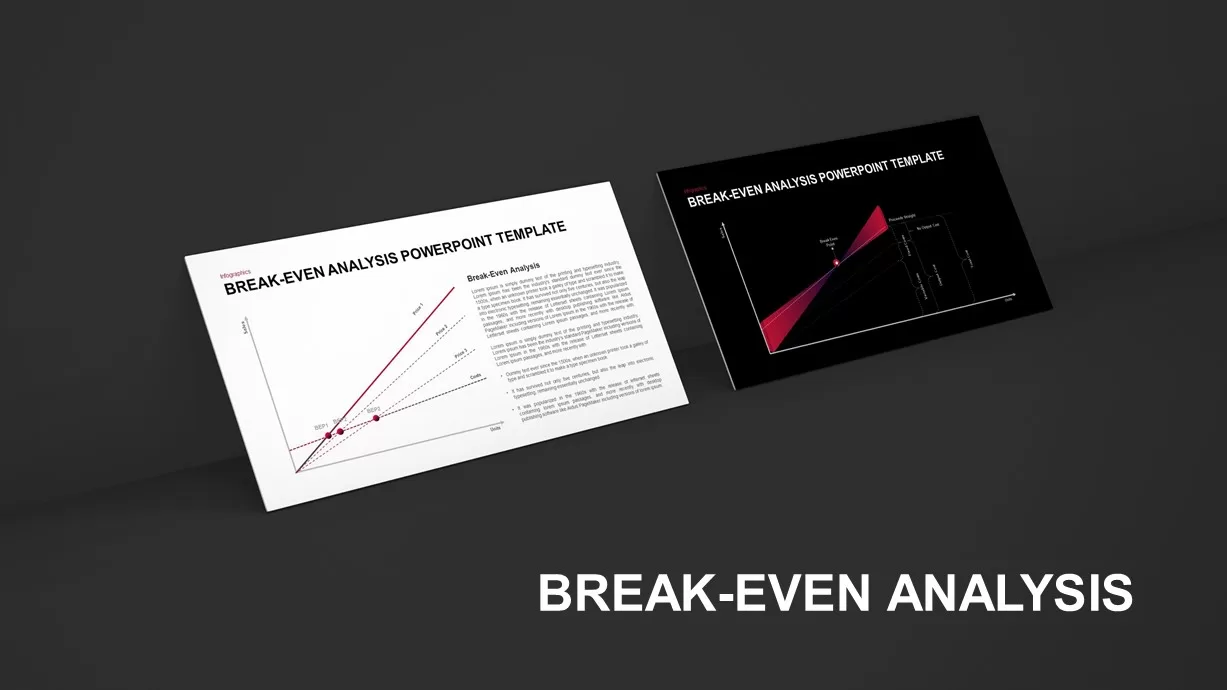
Break-Even Analysis template for PowerPoint & Google Slides
Process
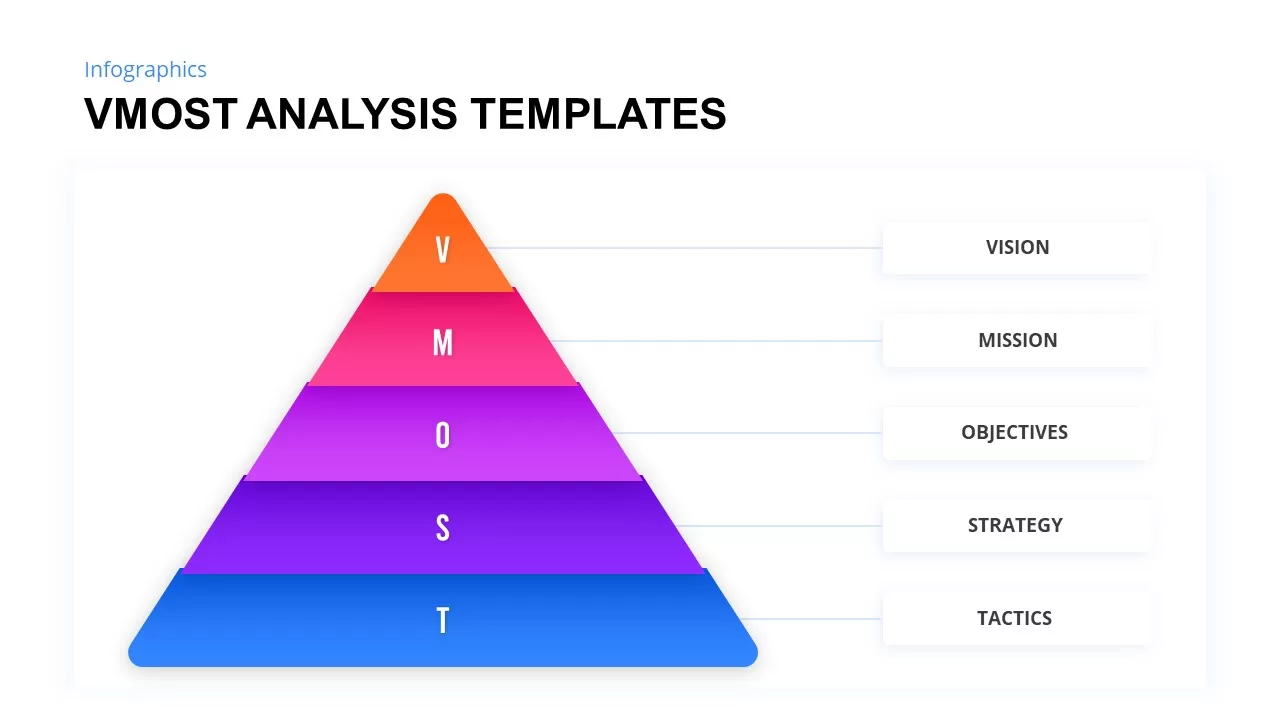
VMOST Analysis Template for PowerPoint & Google Slides
Business Strategy
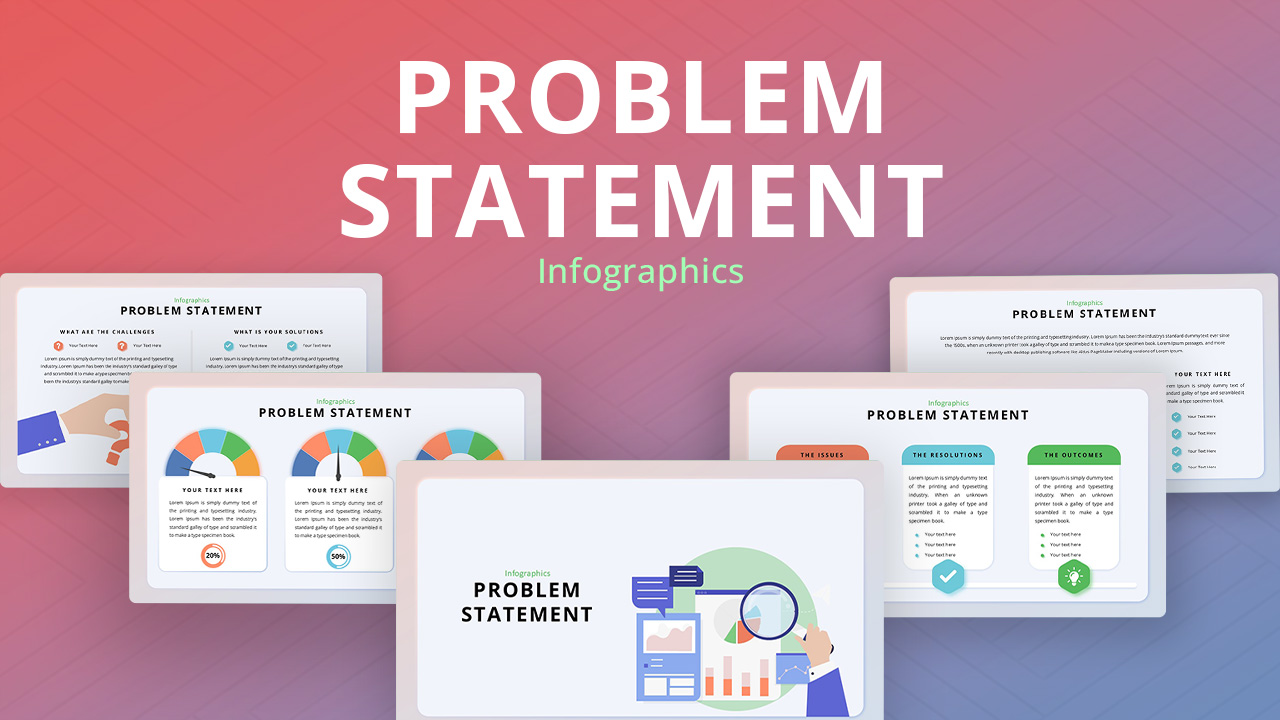
Problem Statement Analysis template for PowerPoint & Google Slides
Business Strategy
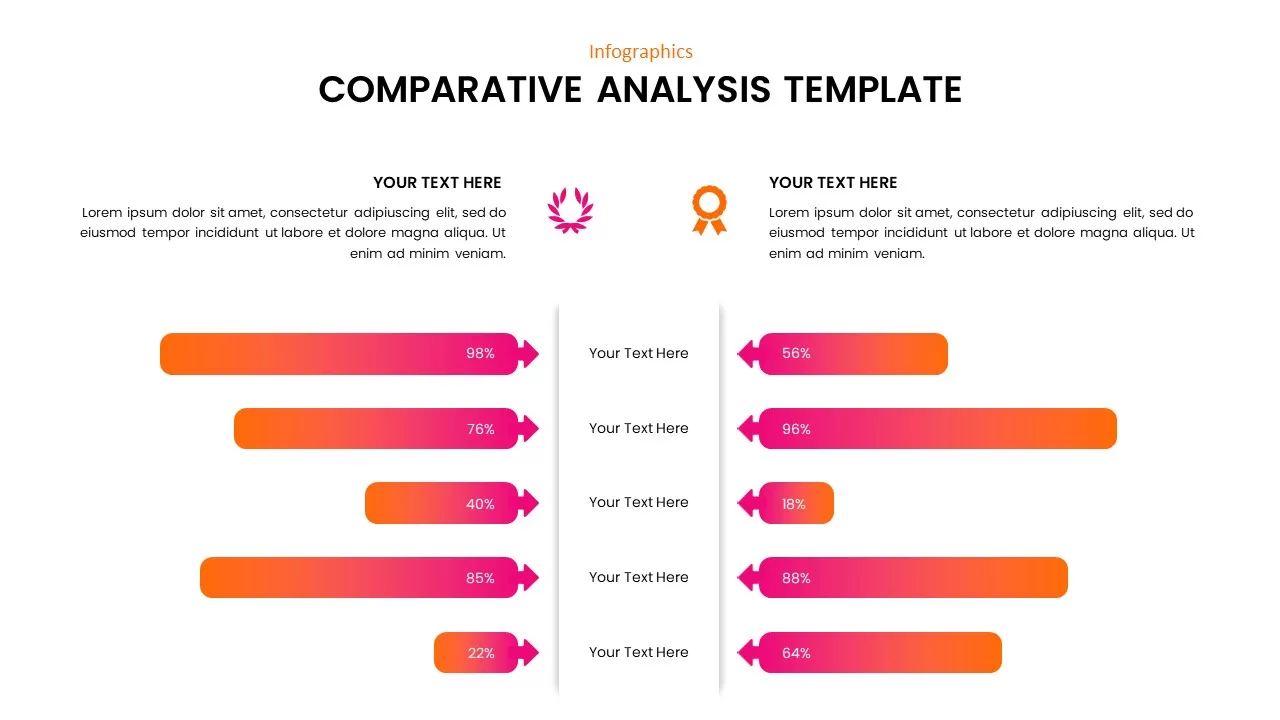
Comparative Analysis template for PowerPoint & Google Slides
Business Report
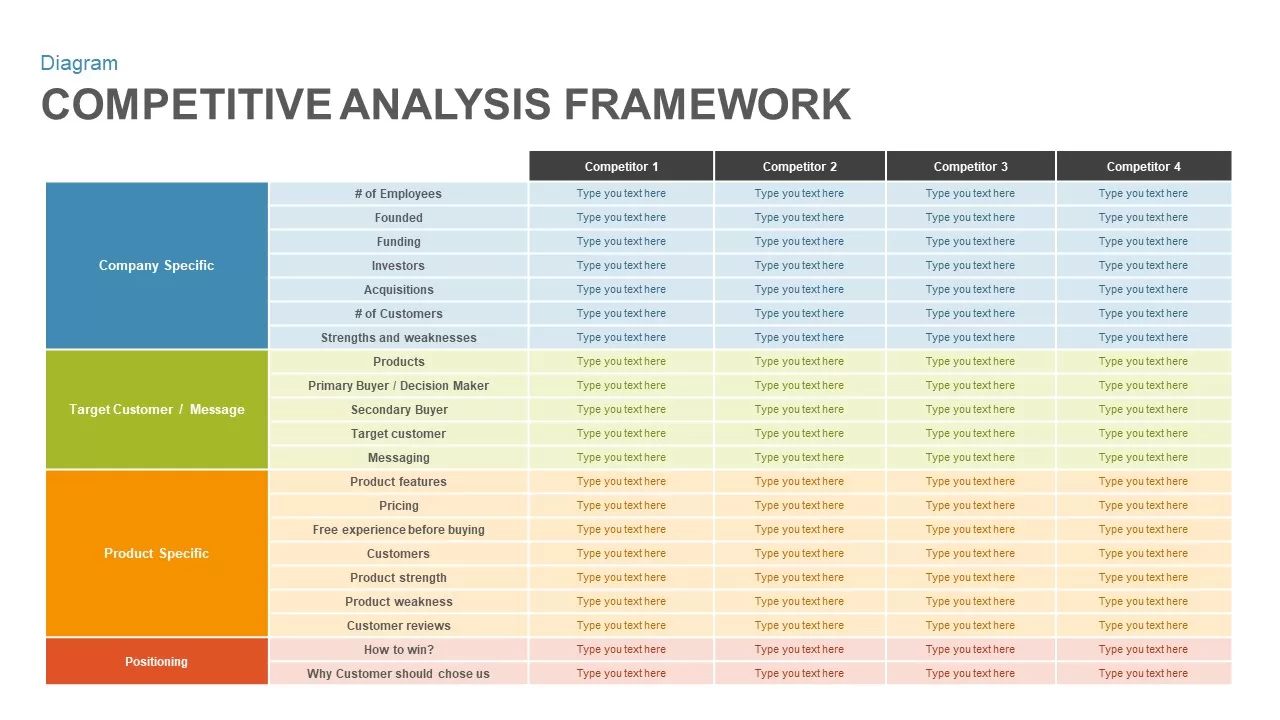
Competitive Analysis Framework template for PowerPoint & Google Slides
Business Report
Comprehensive Risk Impact Analysis Template for PowerPoint & Google Slides
Risk Management
Modern Colorful SWOT Quadrant Analysis Template for PowerPoint & Google Slides
SWOT
Colorful SWOT Analysis Quadrant Template for PowerPoint & Google Slides
SWOT
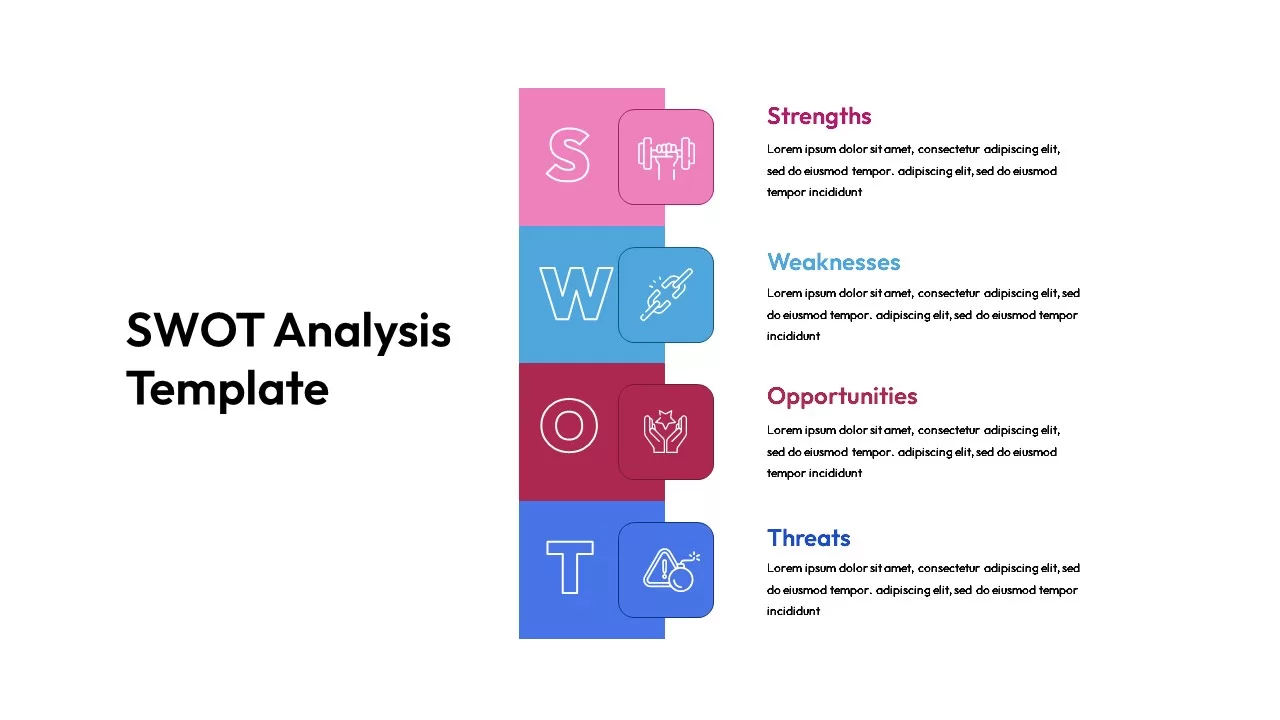
Colorful Vertical SWOT Analysis Layout Template for PowerPoint & Google Slides
SWOT
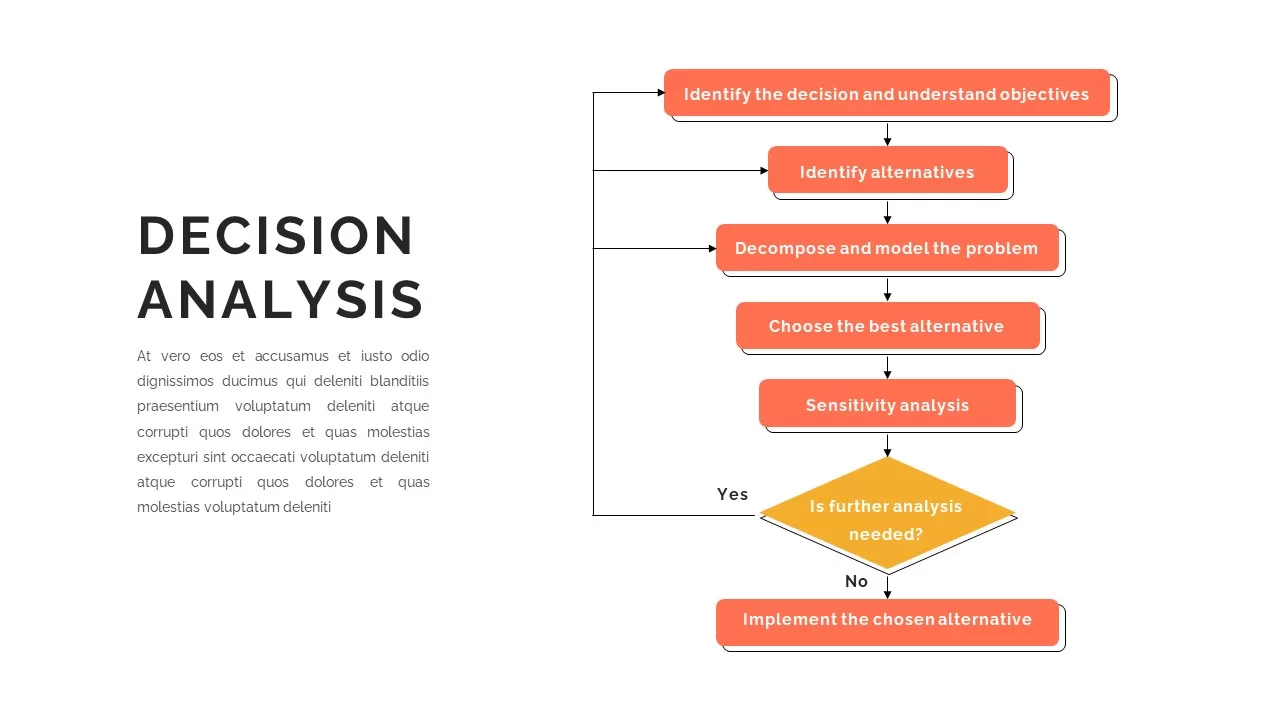
Decision Analysis Process Flowchart Template for PowerPoint & Google Slides
Flow Charts
SWOT Analysis Framework template for PowerPoint & Google Slides
SWOT
SWOT Analysis Overview template for PowerPoint & Google Slides
Business
SWOT Analysis Quadrant template for PowerPoint & Google Slides
Business Strategy
SWOT Analysis Template for PowerPoint & Google Slides
Business Strategy
SWOT Analysis template for PowerPoint & Google Slides
SWOT
SWOT Analysis template for PowerPoint & Google Slides
SWOT
Photo Personal SWOT Analysis Callouts Template for PowerPoint & Google Slides
SWOT
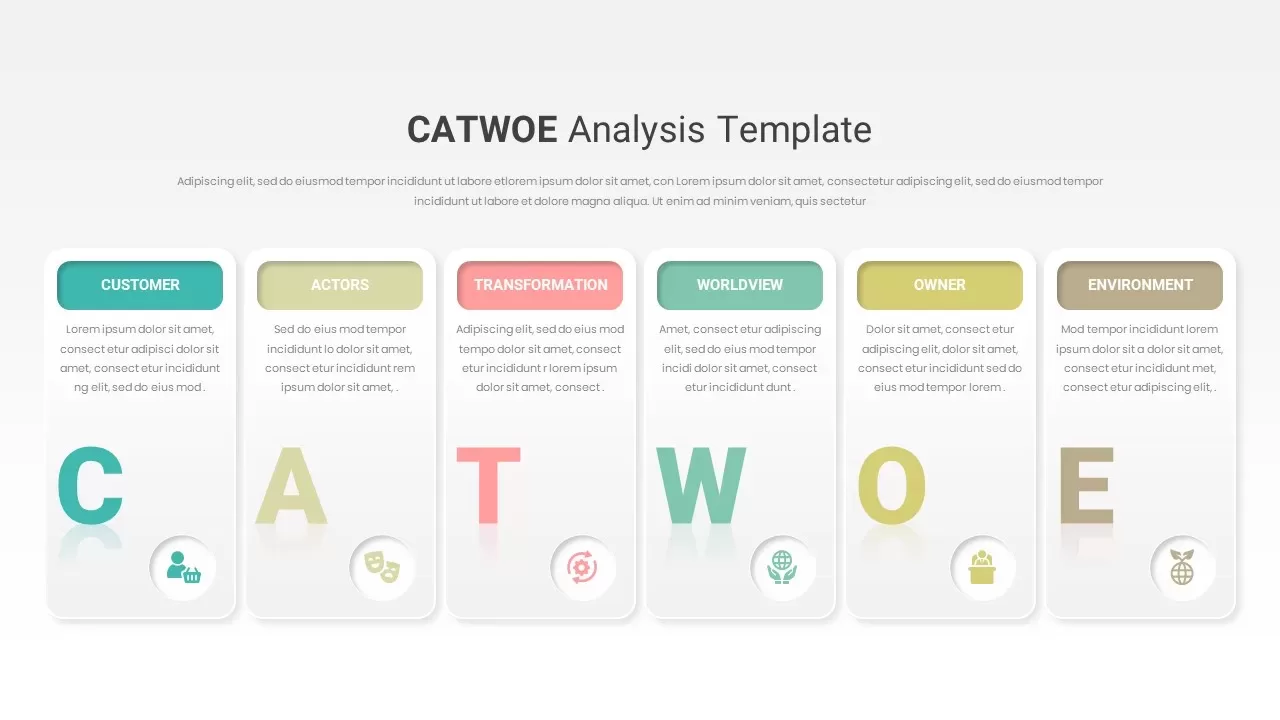
CATWOE Analysis Template for PowerPoint & Google Slides
Process
Vendor Comparison Analysis template for PowerPoint & Google Slides
Comparison Chart
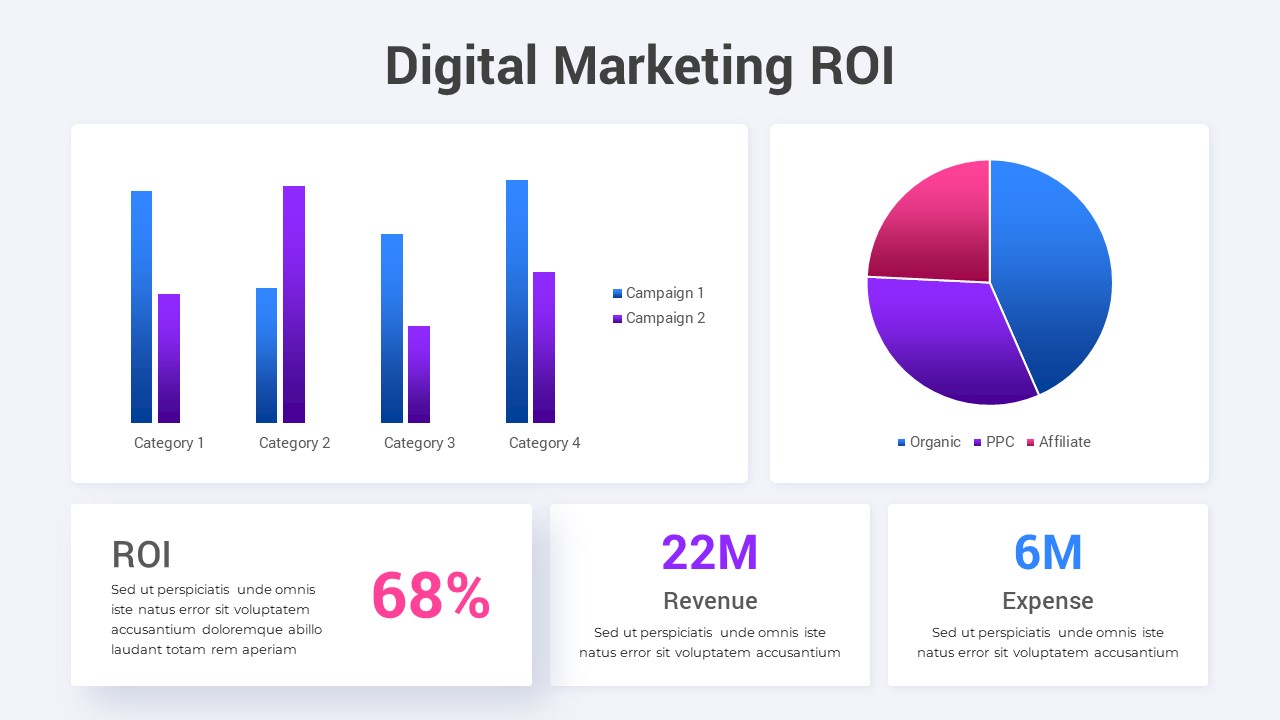
Digital Marketing ROI Analysis template for PowerPoint & Google Slides
Digital Marketing
Social Media Analysis Metrics Slide Deck Template for PowerPoint & Google Slides
Digital Marketing
Risk Pyramid Hierarchy Analysis Template for PowerPoint & Google Slides
Pyramid
Population Pyramid Chart Analysis Template for PowerPoint & Google Slides
Bar/Column
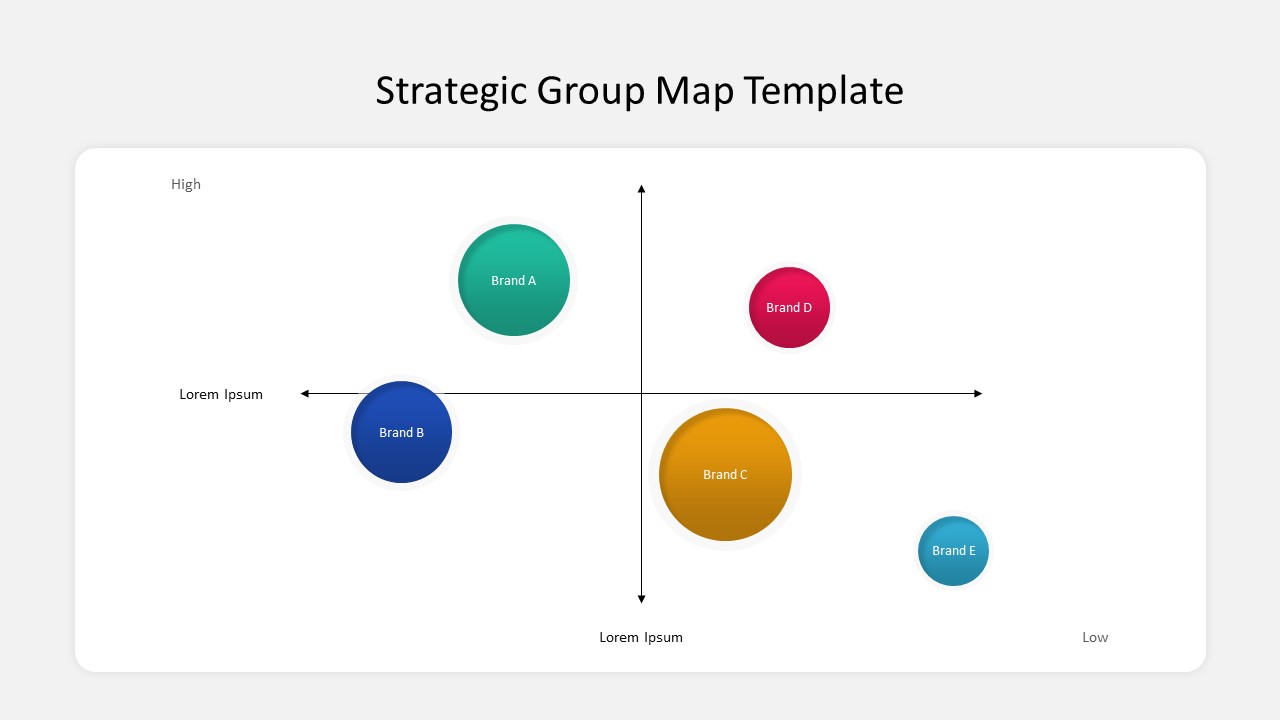
Business Strategic Group Map Analysis Template for PowerPoint & Google Slides
Competitor Analysis
Free
Waterfall Column Chart Analysis Template for PowerPoint & Google Slides
Bar/Column
Simple Scatter Chart Analysis Template for PowerPoint & Google Slides
Comparison Chart
Proportional Area Chart Analysis Template for PowerPoint & Google Slides
Comparison Chart
Free Comprehensive Gap Analysis Framework Template for PowerPoint & Google Slides
Opportunities Challenges
Free
Quarterly Network Volume Analysis Template for PowerPoint & Google Slides
Business Report
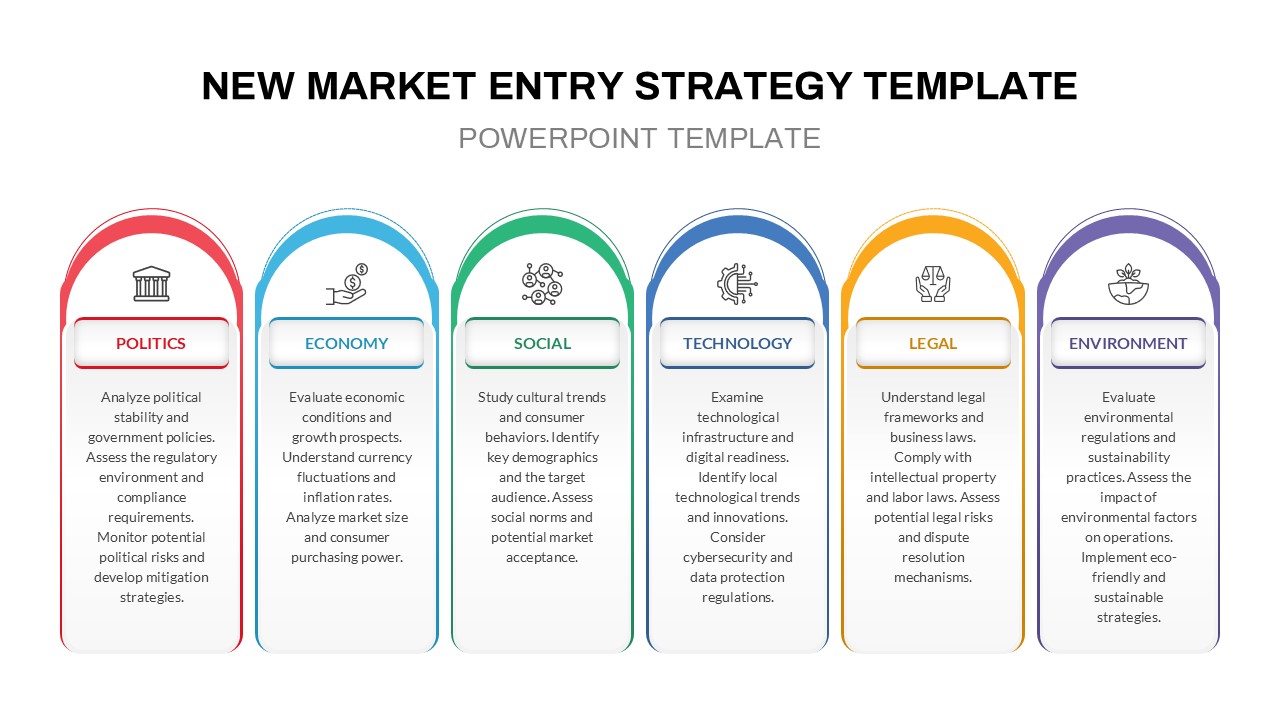
PESTLE Analysis for Market Entry Template for PowerPoint & Google Slides
PEST
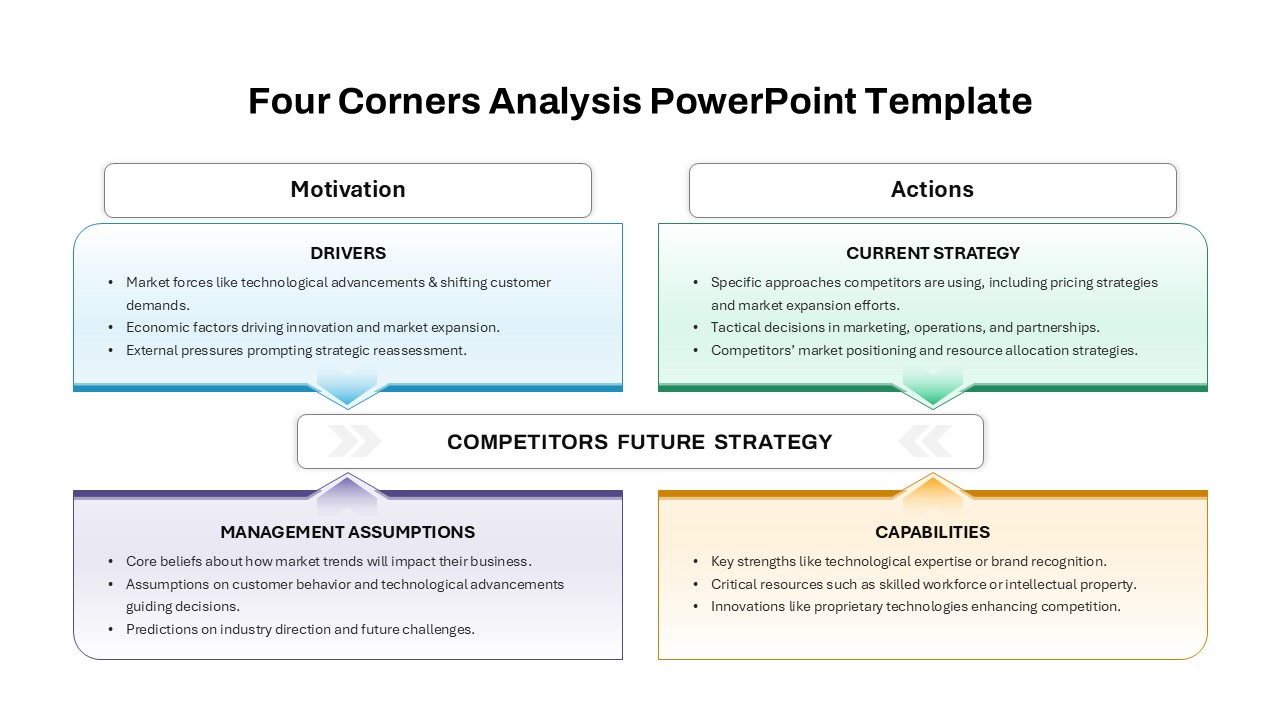
Four-Corners Strategic Analysis Quadrant Template for PowerPoint & Google Slides
SWOT
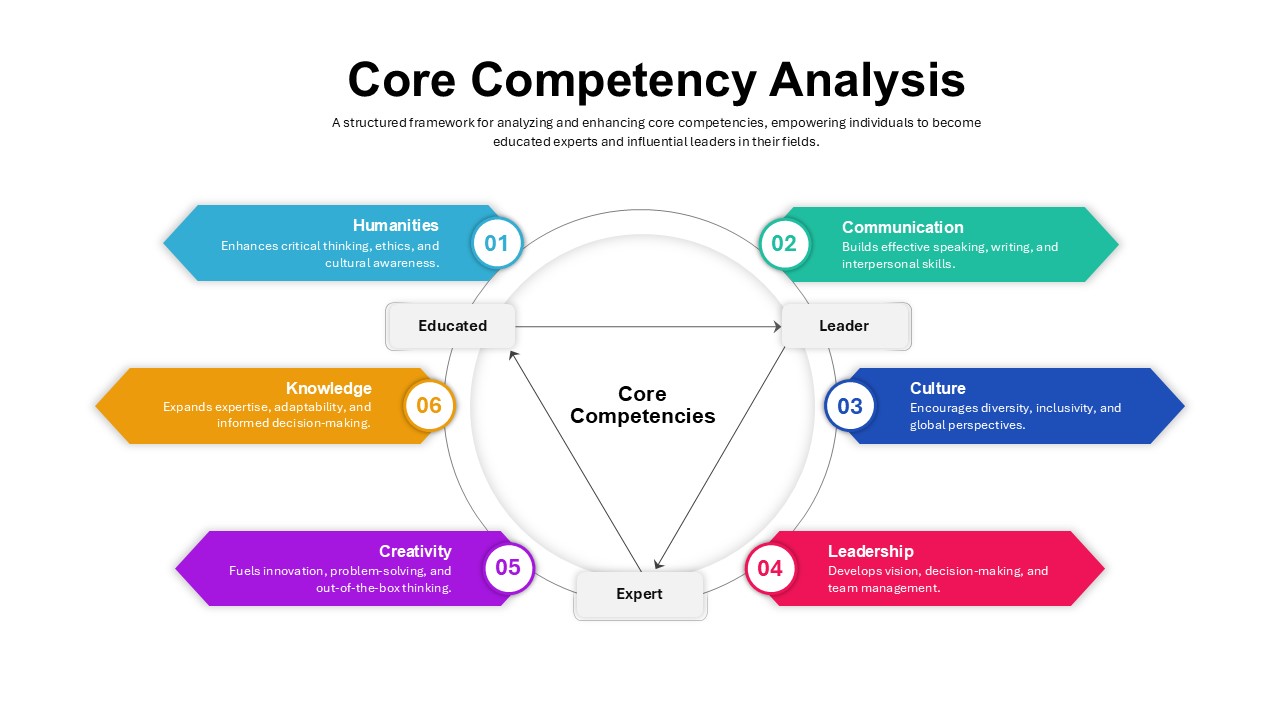
Core Competency Analysis Circular Template for PowerPoint & Google Slides
Circular
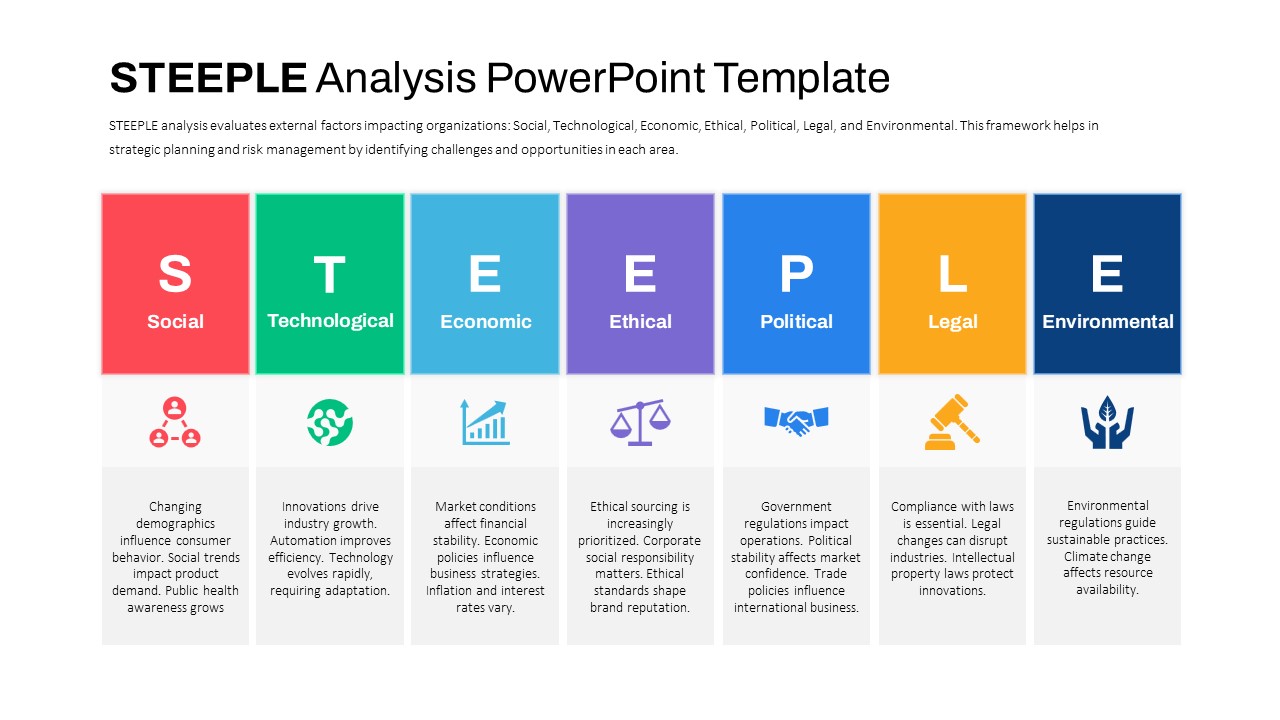
STEEPLE Analysis framework template for PowerPoint & Google Slides
Business Strategy
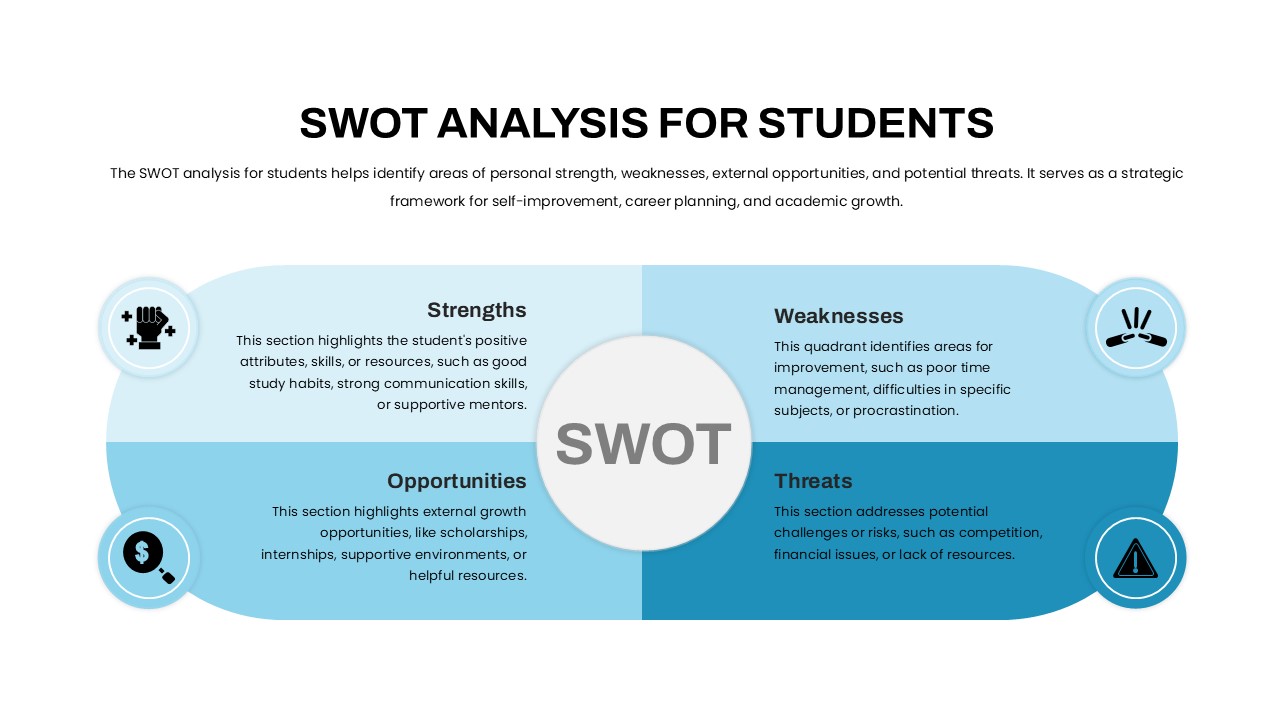
Student SWOT Analysis Framework Template for PowerPoint & Google Slides
SWOT
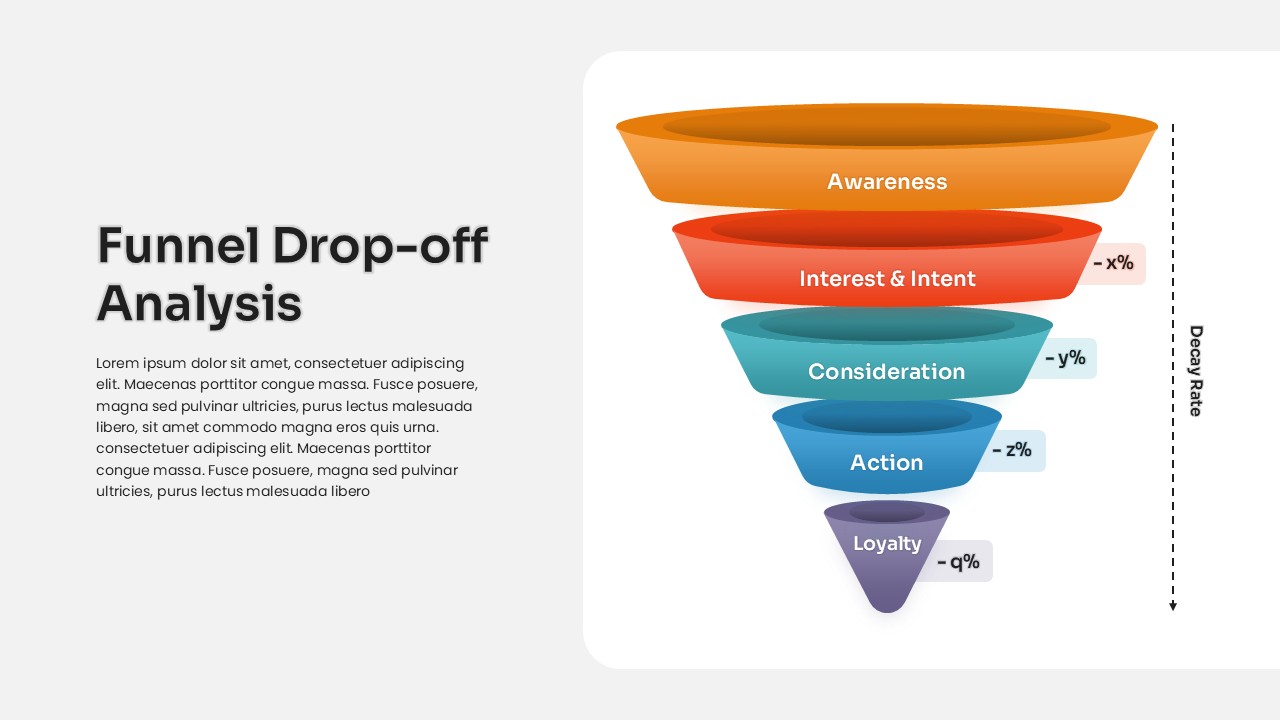
Funnel Drop-off Analysis template for PowerPoint & Google Slides
Business
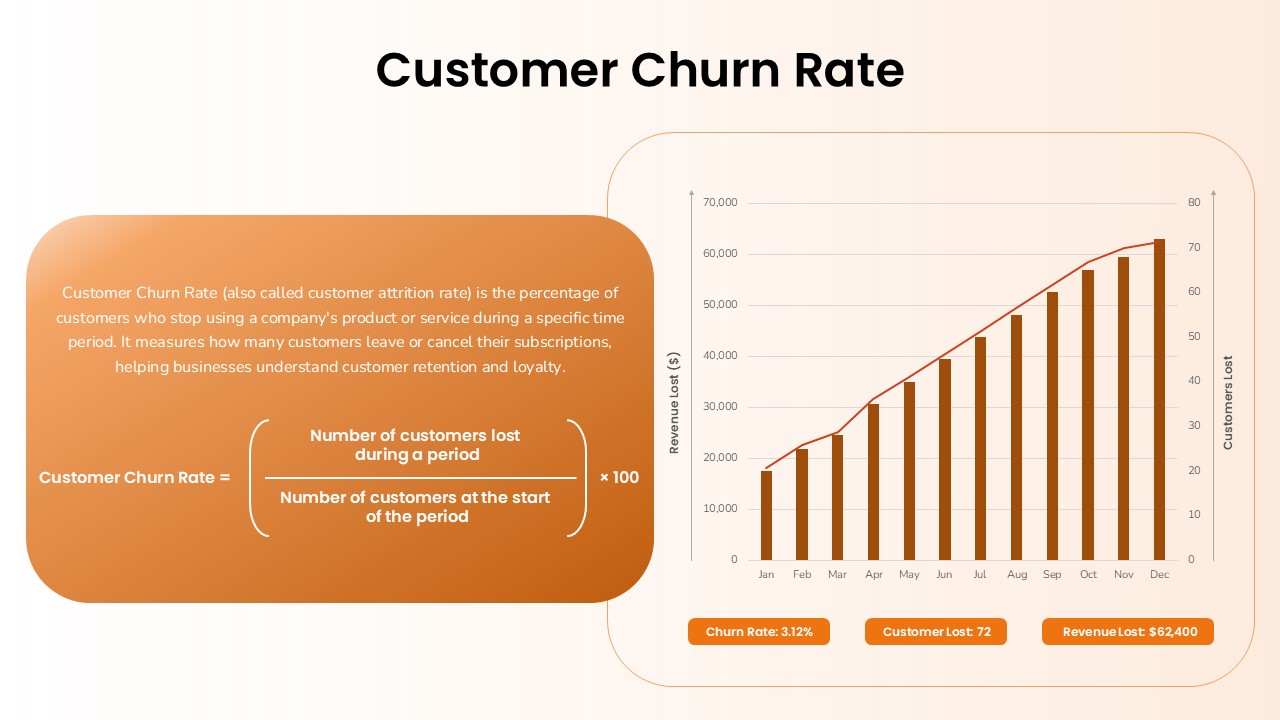
Customer Churn Rate Analysis template for PowerPoint & Google Slides
Business Report
Quantitative Risk Analysis Matrix template for PowerPoint & Google Slides
Risk Management
Colorful SWOT Analysis Quadrant Template for PowerPoint & Google Slides
SWOT
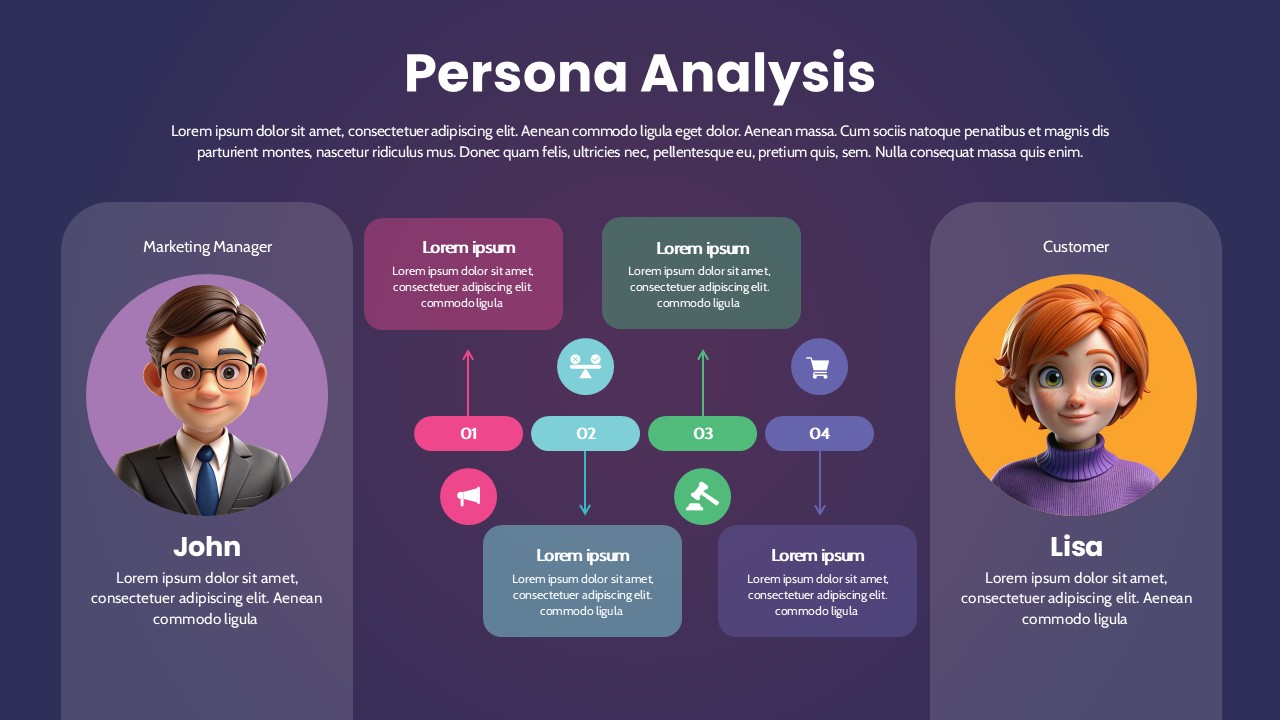
Persona Analysis Template for PowerPoint & Google Slides
Infographics
Multi Color SWOT Analysis Quadrant Template for PowerPoint & Google Slides
SWOT
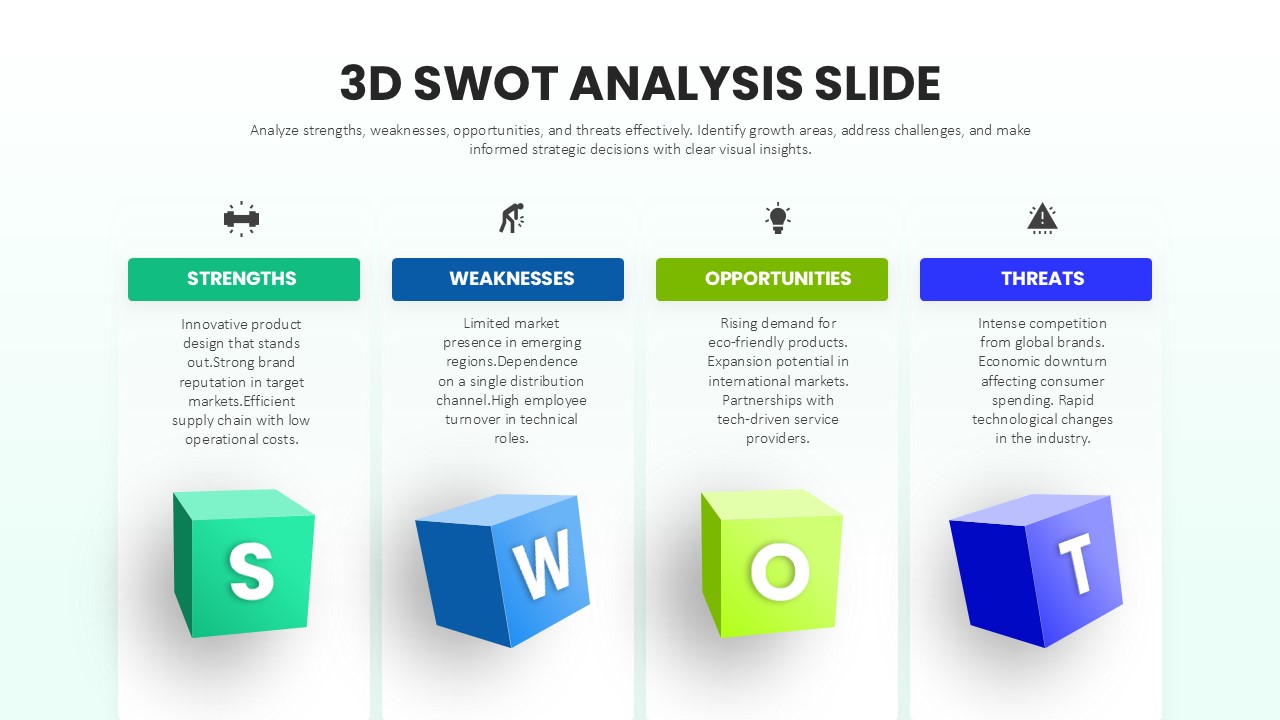
3D SWOT Analysis Template for PowerPoint & Google Slides
SWOT
Personal SWOT Analysis Matrix Cards Template for PowerPoint & Google Slides
SWOT
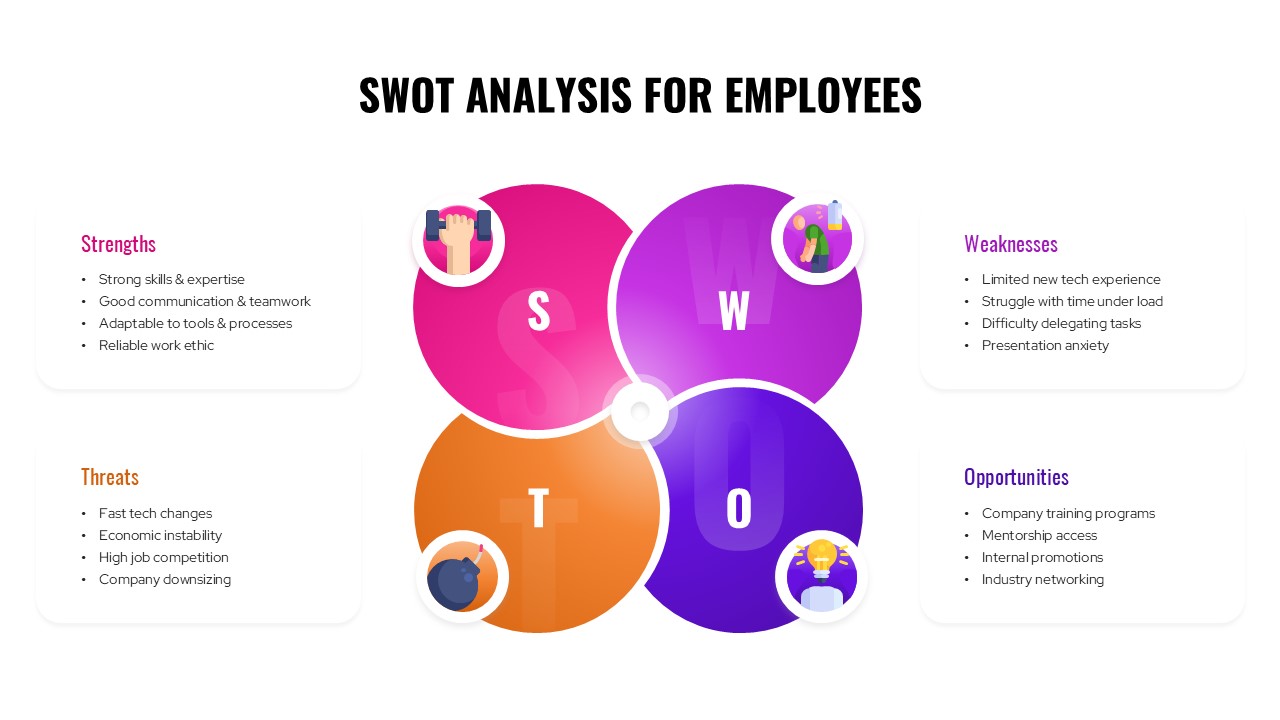
SWOT Analysis For Employees Template for PowerPoint & Google Slides
SWOT
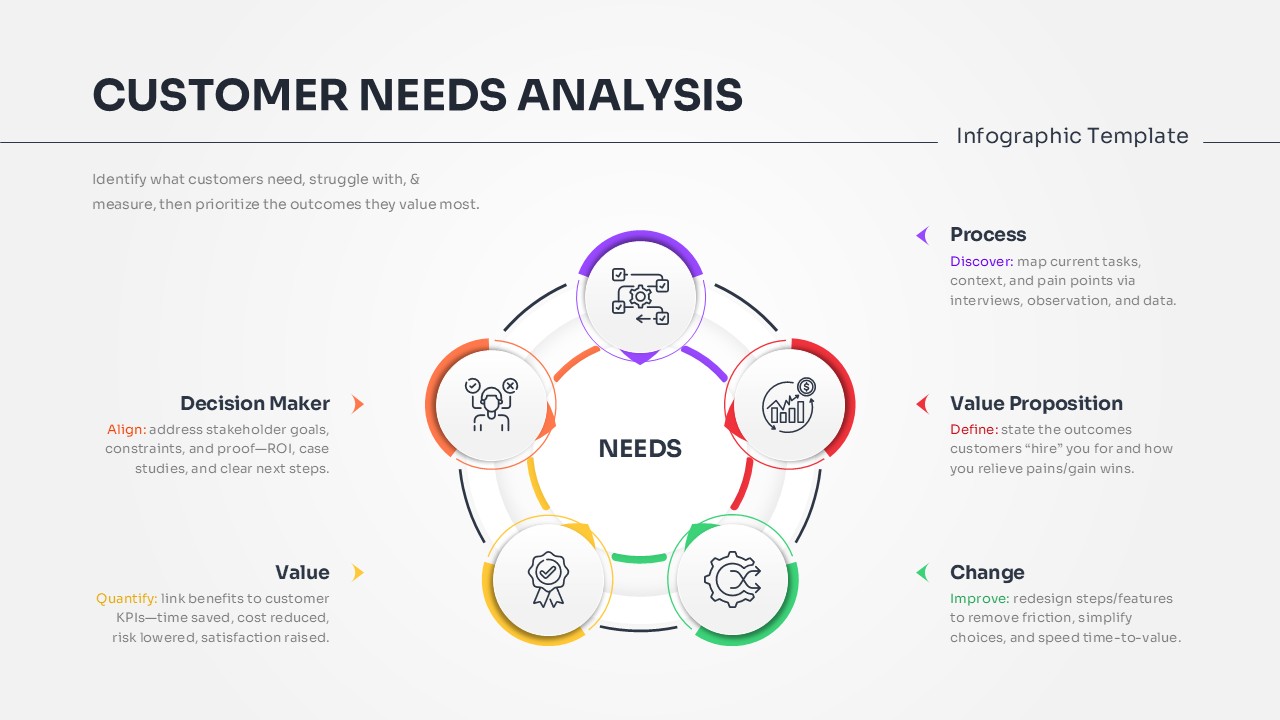
Customer Needs Analysis Template for PowerPoint & Google Slides
Customer Experience
Data Gap Analysis Template for PowerPoint & Google Slides
Business