Timeline Comparison Slide PowerPoint Template


Description
Timeline comparison PowerPoint template contains three variant formats in six slides. Usually, a comparison slide perfectly highlights contrasting ideas. The same will be tuned out with this timeline PowerPoint comparison chart. It enables users to effectively report the gaps between their organization’s current and future states.
With its visually appealing design, the timeline template emphasizes contrasting ideas, allowing for clear comparisons. By incorporating relevant data, users can explore various concepts such as before and after analysis, Dos and Don’ts and pros and cons. Additionally, this versatile template can be used to present PowerPoint product comparisons, different management or administrative plans, and other related ideas in business presentations. Its flexibility and professional design make it valuable for professionals seeking to communicate complex information effectively.
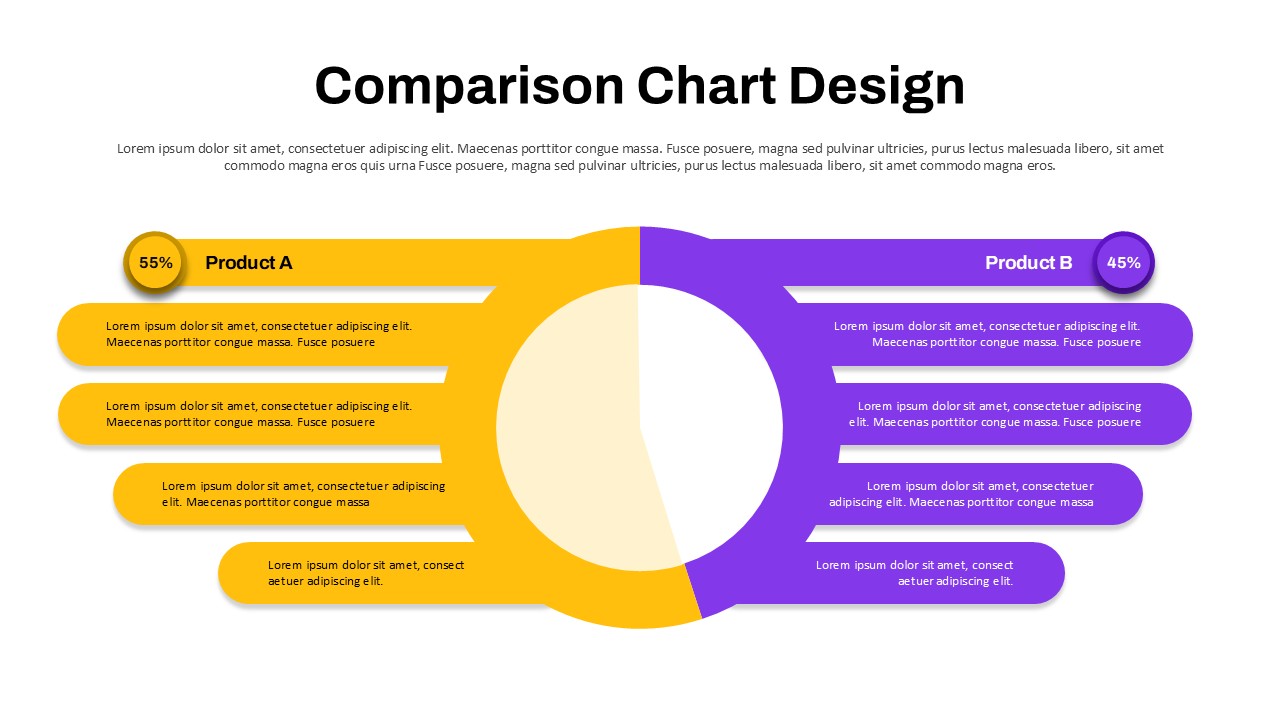
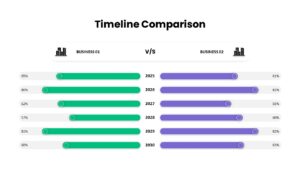
The comparison PowerPoint timeline presentation has three diagrams for checking similarities and differences. The first version is a perfect comparison chart placed on two sides. It will show the contrast between Business 01 and Business 02. This is a typical slide for comparison in most use cases. The layout is ideal for product comparisons, dos and don’ts presentations, and before and after slideshows. Besides, each line in blue and green has differences in size, so it conveys your message impeccably.
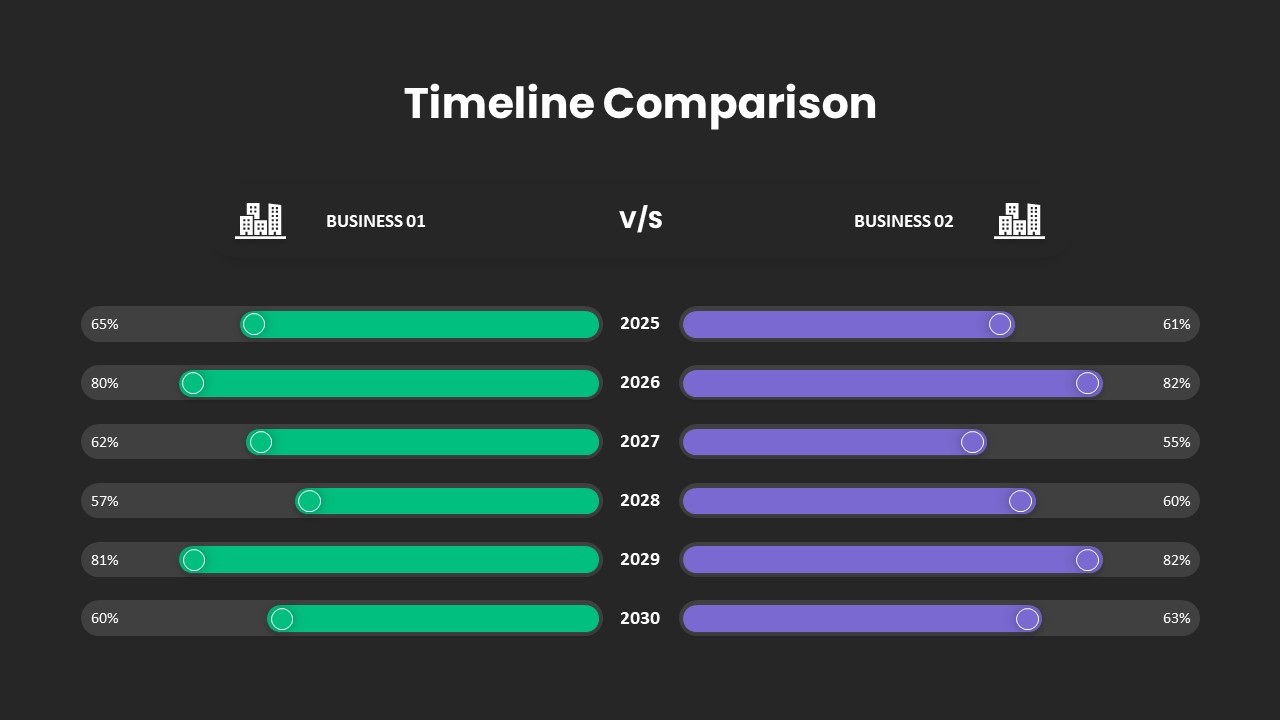
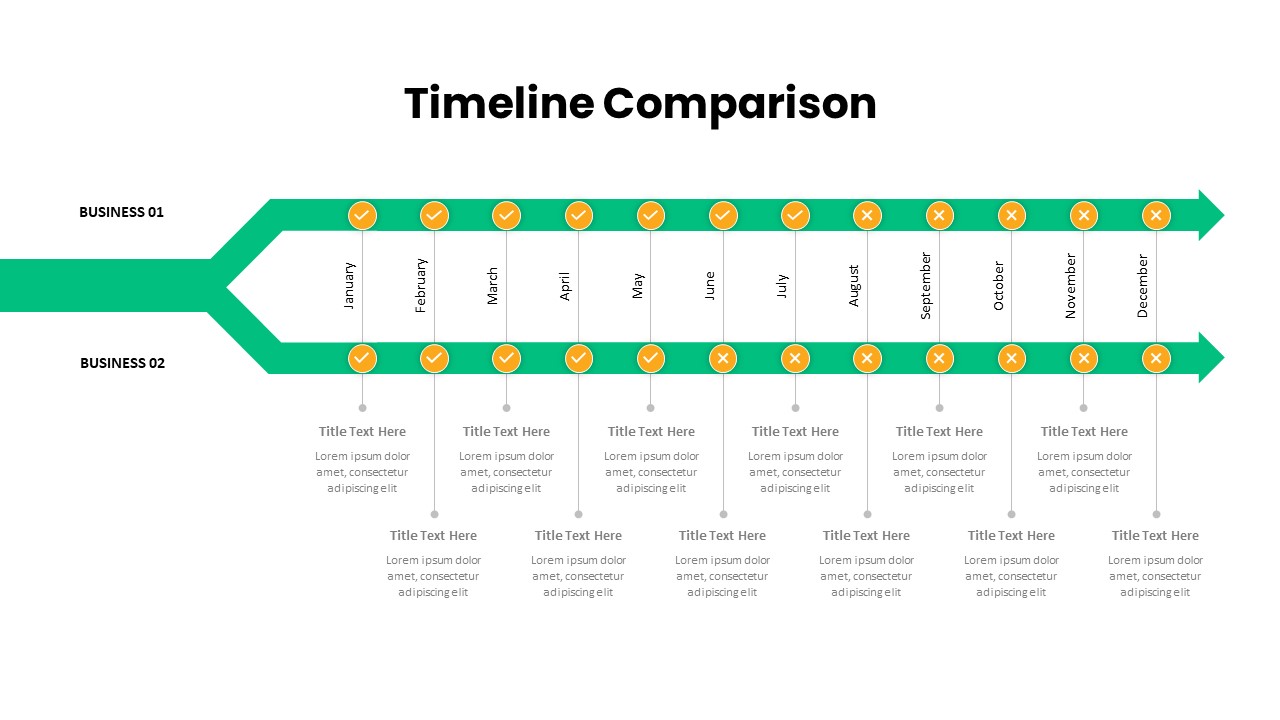
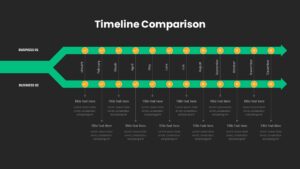
The second version of the timeline comparison ppt comprises two horizontal timelines with 12 touch points. It is ideal for a yearly comparison of sales with descriptive text boxes. You can make a tick and wrong mark while you speak about sales comparison. This type of parallel timeline is also useful for reviewing financial outcomes by comparing the previous year’s income and expenditure chronologically.
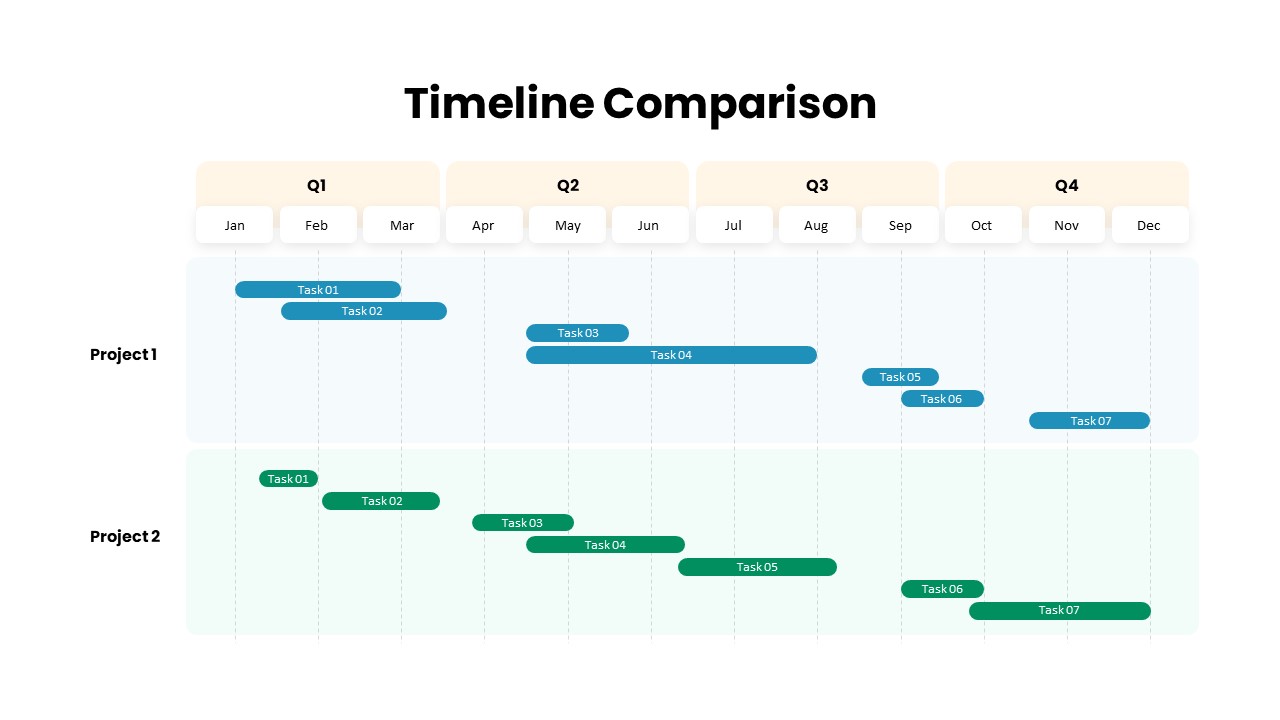
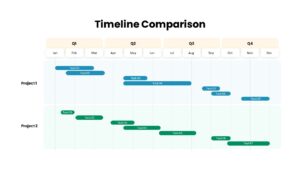
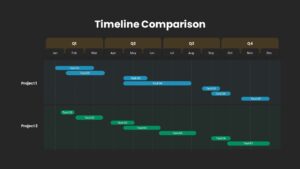
The third slide of the timeline PowerPoint comparison presents a Gantt chart illustrating the project’s milestones and achievements. This chart serves as a valuable tool for clearly outlining the different phases of product development and enables effective comparisons with past projects.
Download and edit our extensive collection of comparison templates for your presentations.
Login to download this file

Item ID
SB03647
Related Templates

Comparison Roadmap PowerPoint Template
Comparison
Arrow Timeline Infographic Timeline Template
Timeline

Clean Mobile Service Comparison Slide Template for PowerPoint & Google Slides
Comparison
Tornado Chart Data Comparison Slide Template for PowerPoint & Google Slides
Bar/Column
Fact and Figures Comparison Slide Template for PowerPoint & Google Slides
Business Report
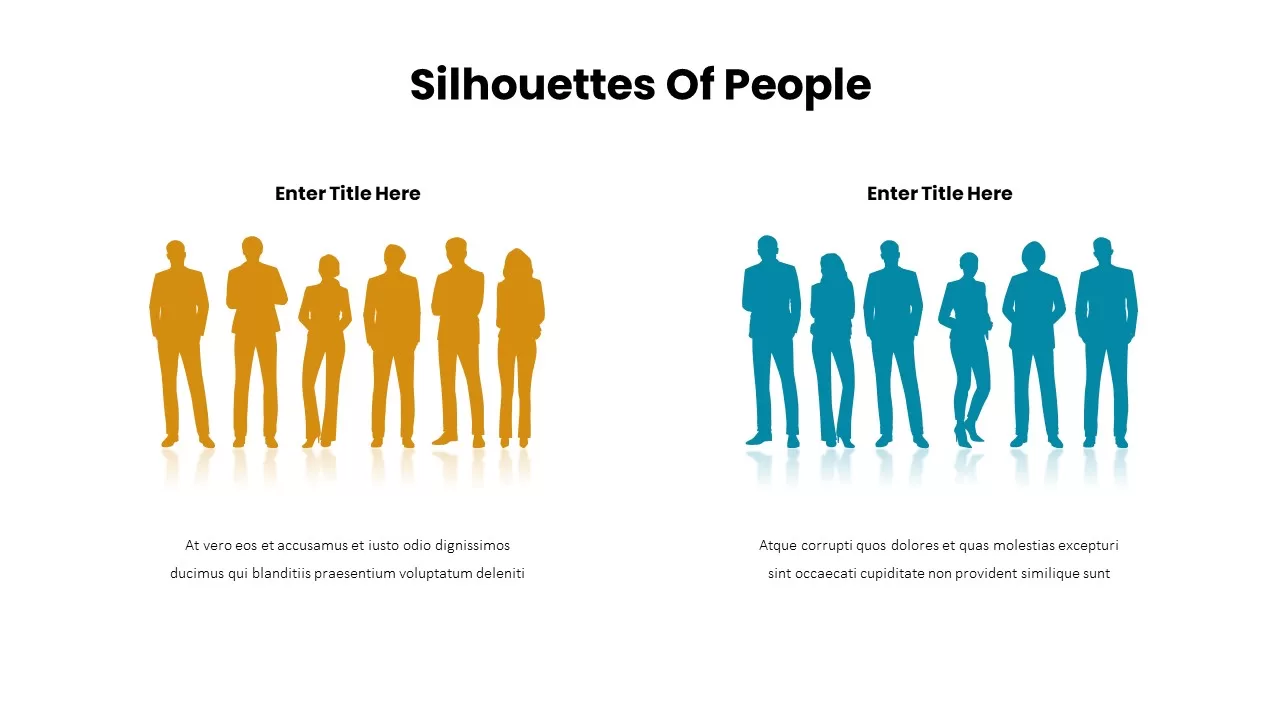
Business Silhouettes Comparison Slide Template for PowerPoint & Google Slides
HR
Current vs Future State Comparison Slide Template for PowerPoint & Google Slides
Comparison Chart
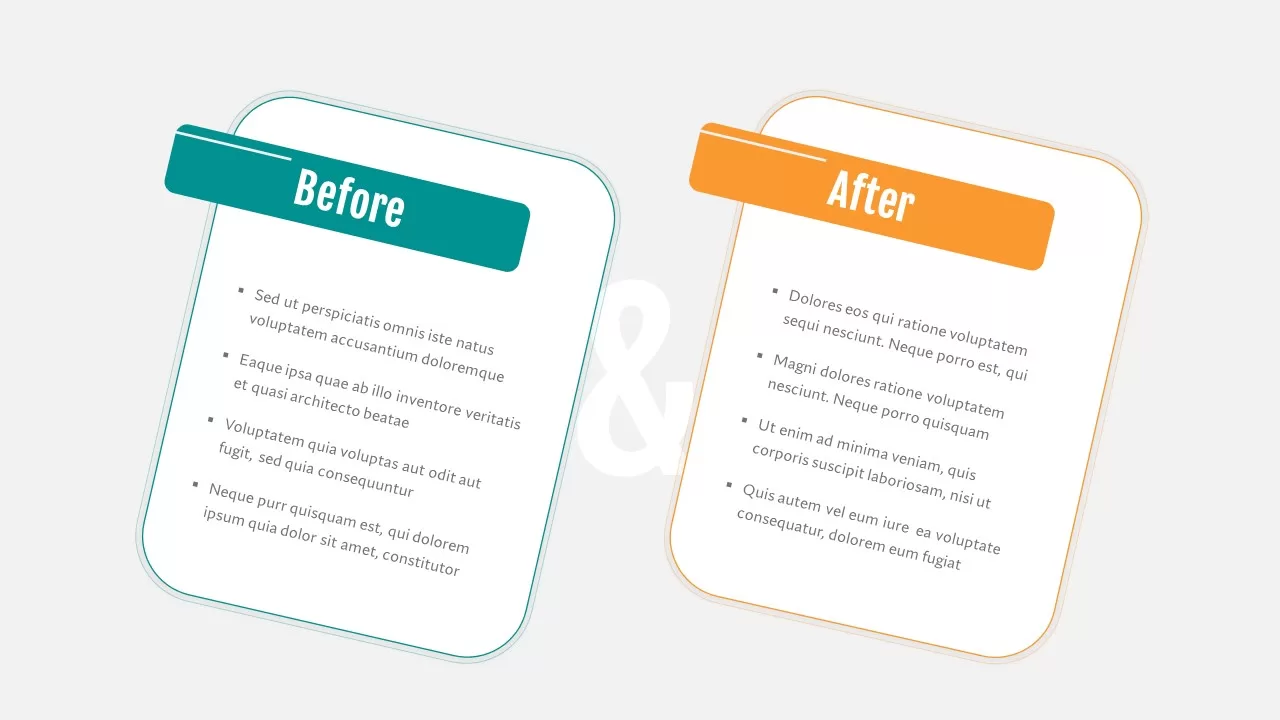
Before and After Comparison Slide Template for PowerPoint & Google Slides
Comparison
Benchmarking Metrics Comparison Slide Template for PowerPoint & Google Slides
Pie/Donut
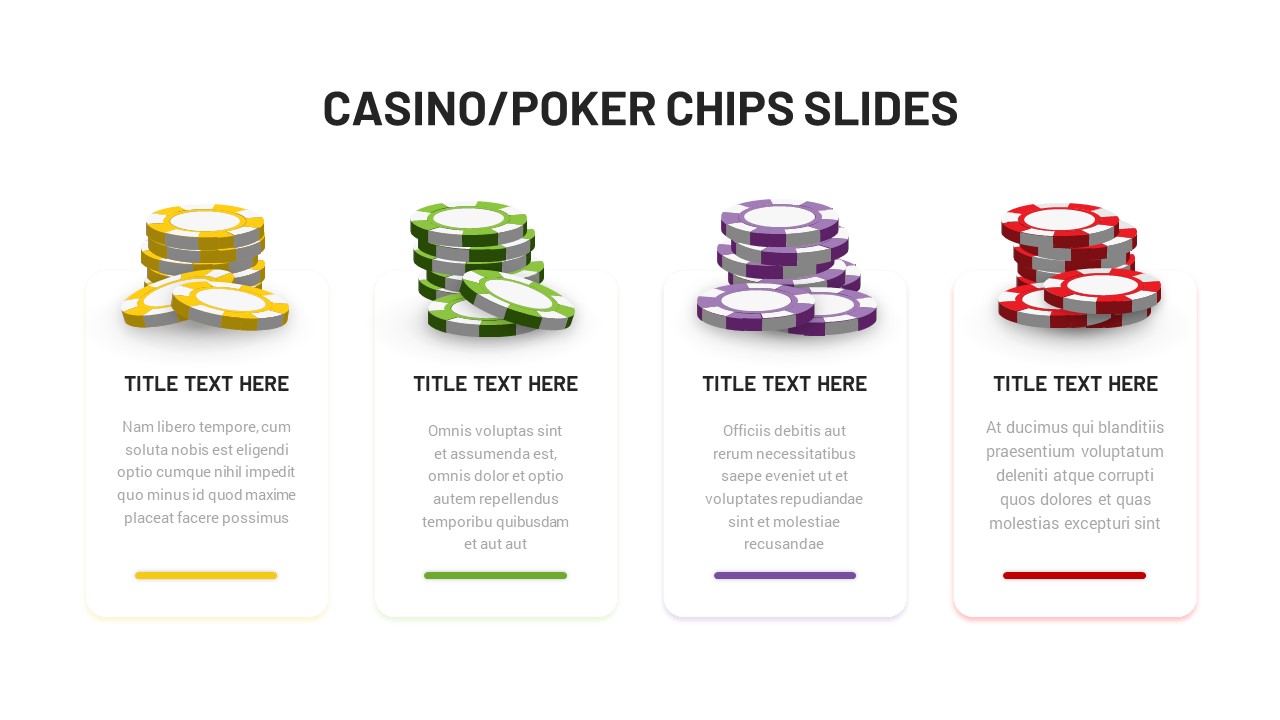
Casino Poker Chips Comparison Slide Template for PowerPoint & Google Slides
Comparison
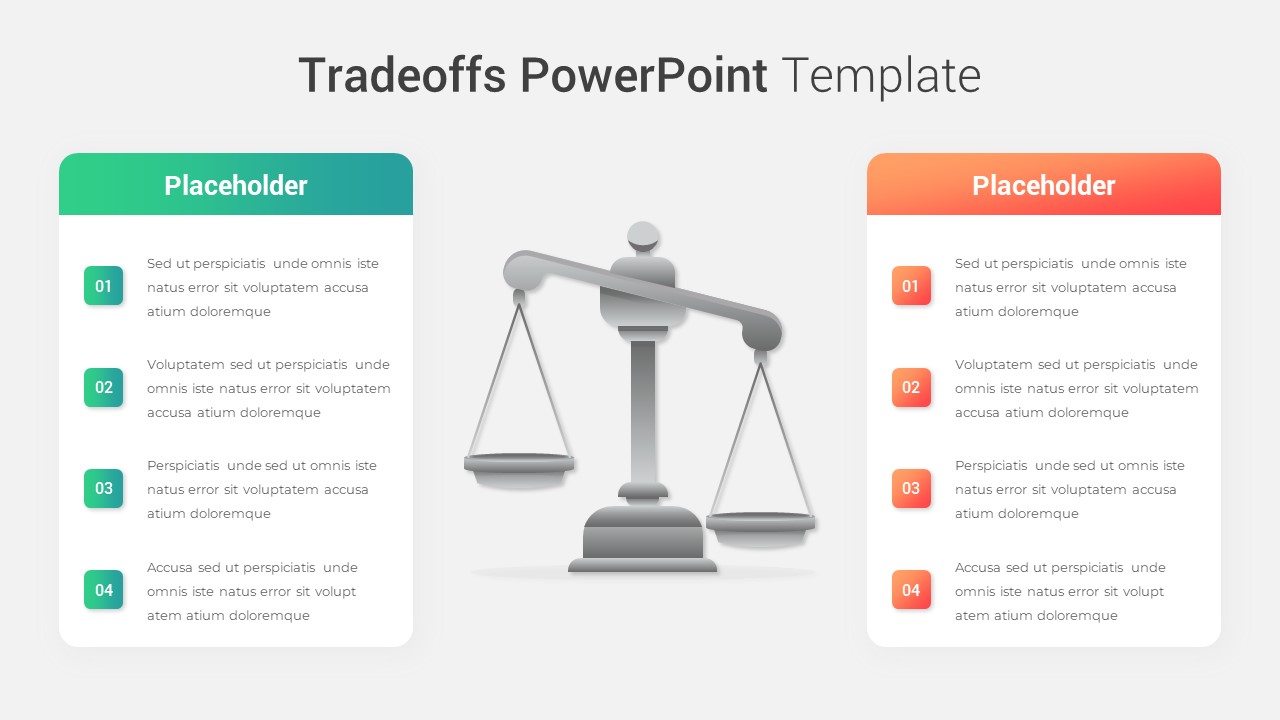
Modern Tradeoffs Comparison Slide Template for PowerPoint & Google Slides
Comparison
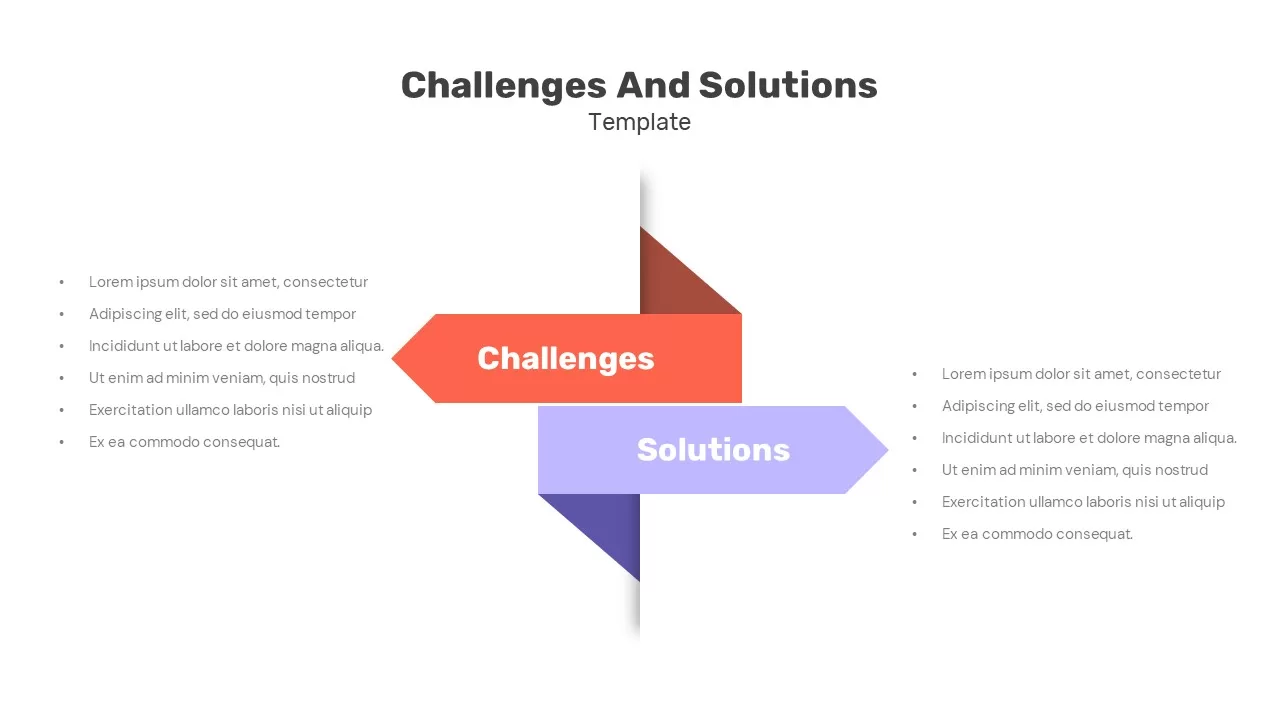
Challenges and Solutions Comparison Slide for PowerPoint & Google Slides
Opportunities Challenges
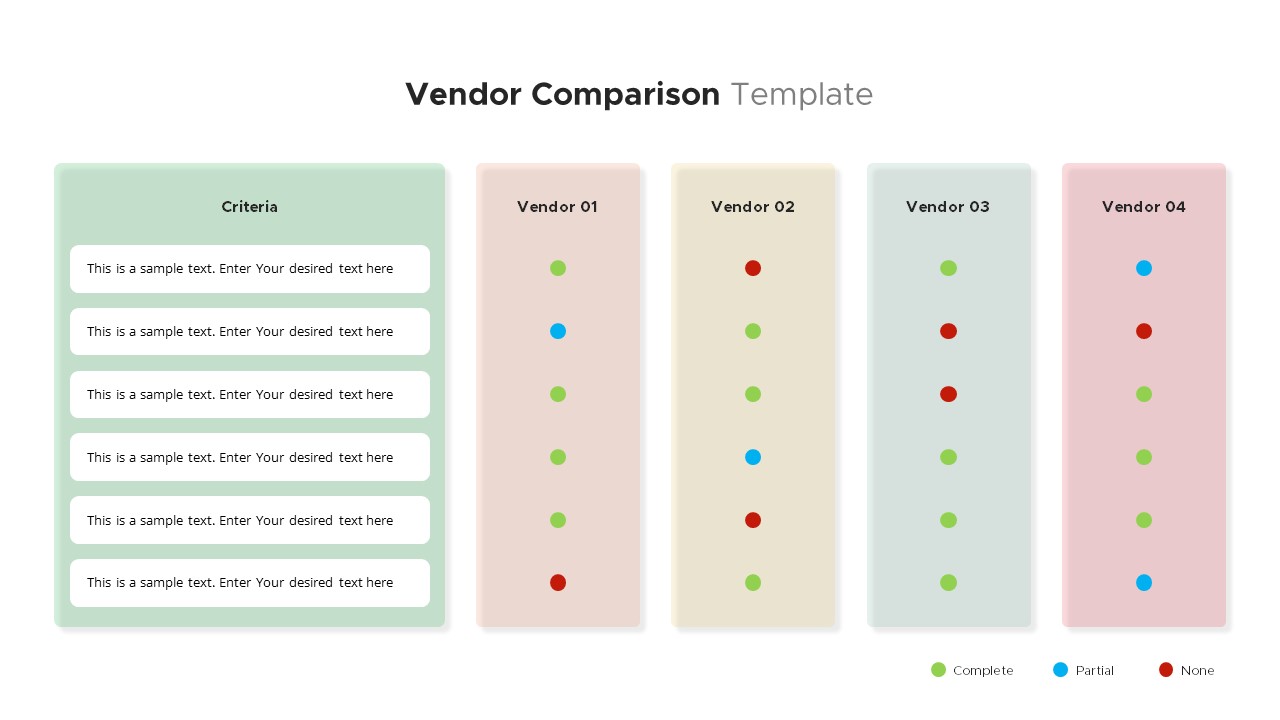
Vendor Comparison Slide for PowerPoint & Google Slides
Comparison
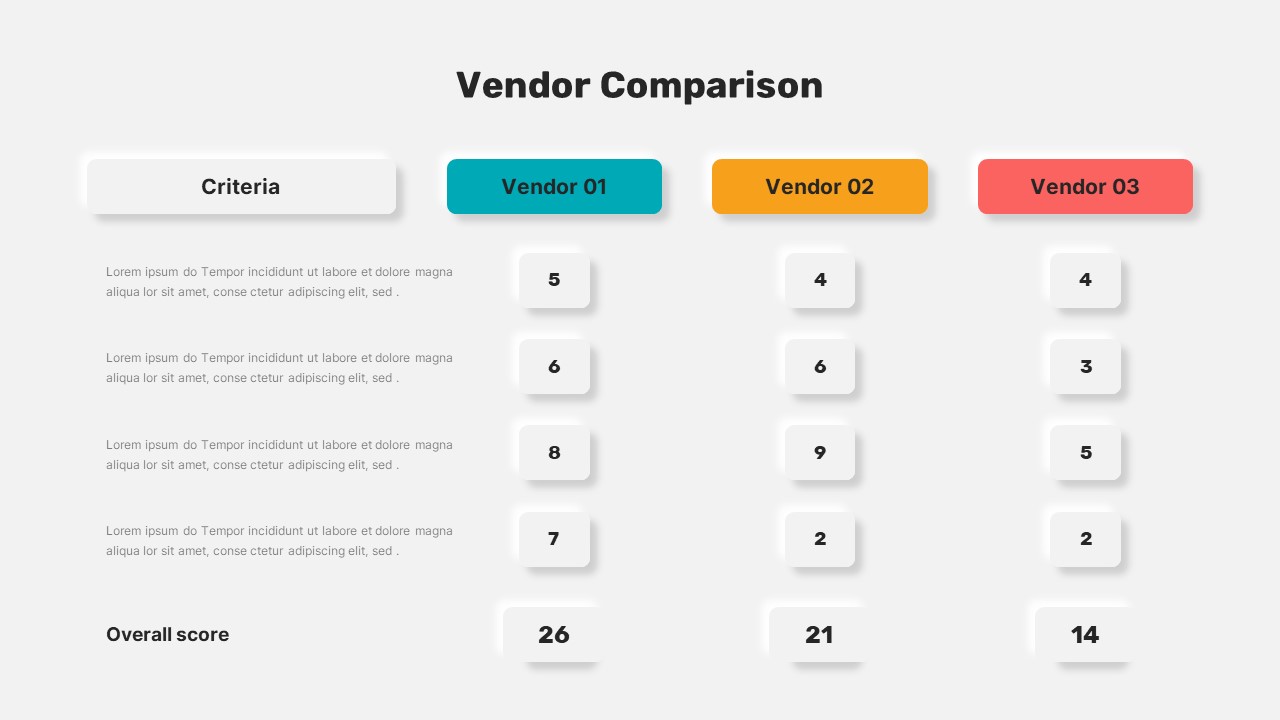
Vendor Comparison Slide for PowerPoint & Google Slides
Business Proposal
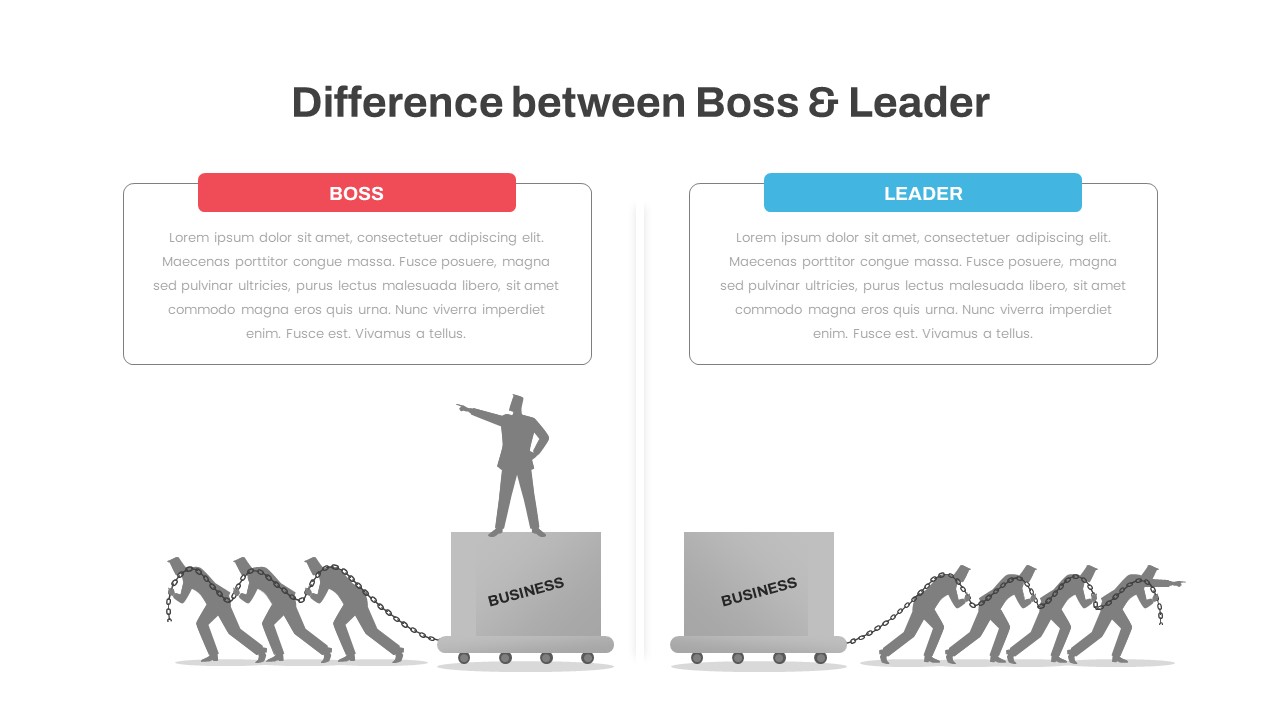
Leader Boss Difference PowerPoint Template
Leadership
Comparison Chart Design Slide for PowerPoint & Google Slides
Infographics
Comparison Slide Presentation Template
Comparison
Radar Chart Product Comparison Template for PowerPoint & Google Slides
Comparison Chart
Seller Portals Comparison Infographic Template for PowerPoint & Google Slides
Process
People Demographic Comparison Chart Template for PowerPoint & Google Slides
Comparison