Break-Even Analysis Infographic Template for PowerPoint & Google Slides


Description
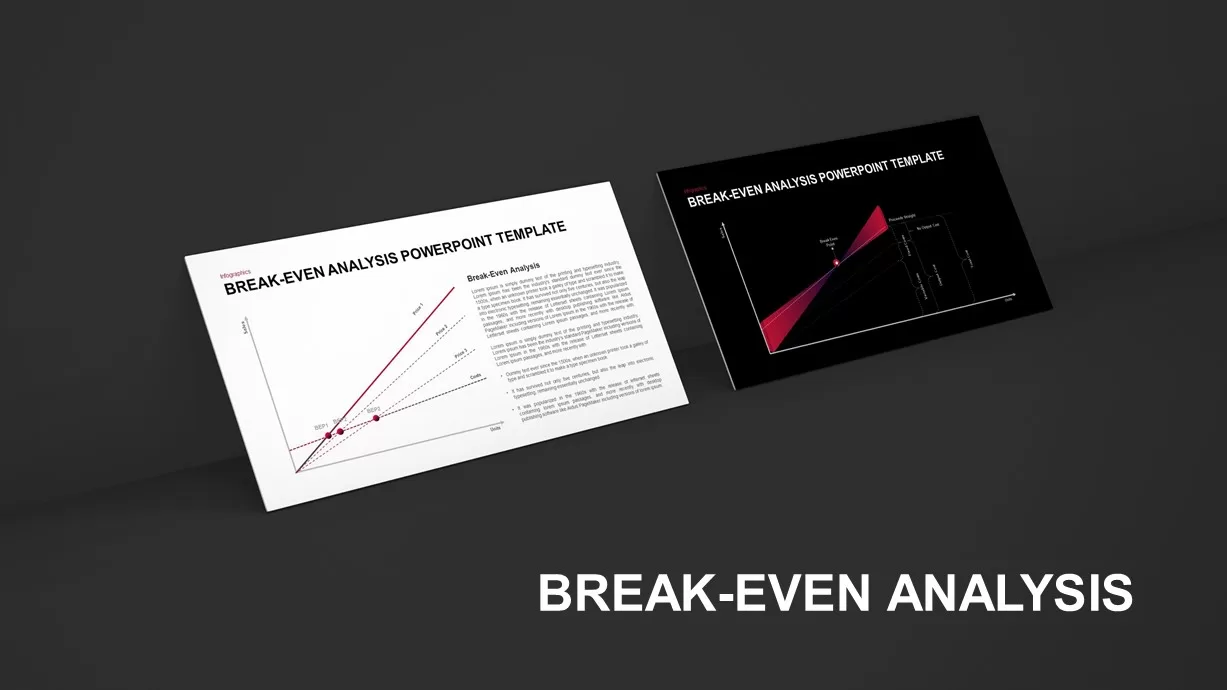
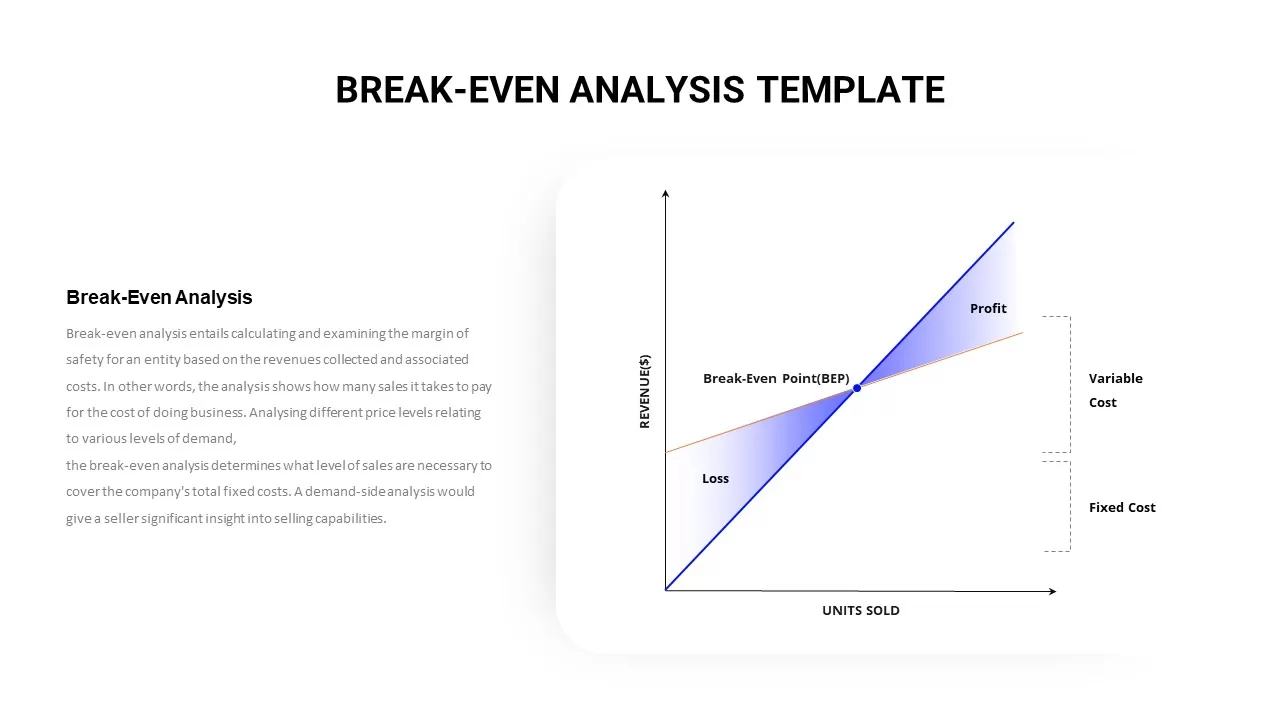
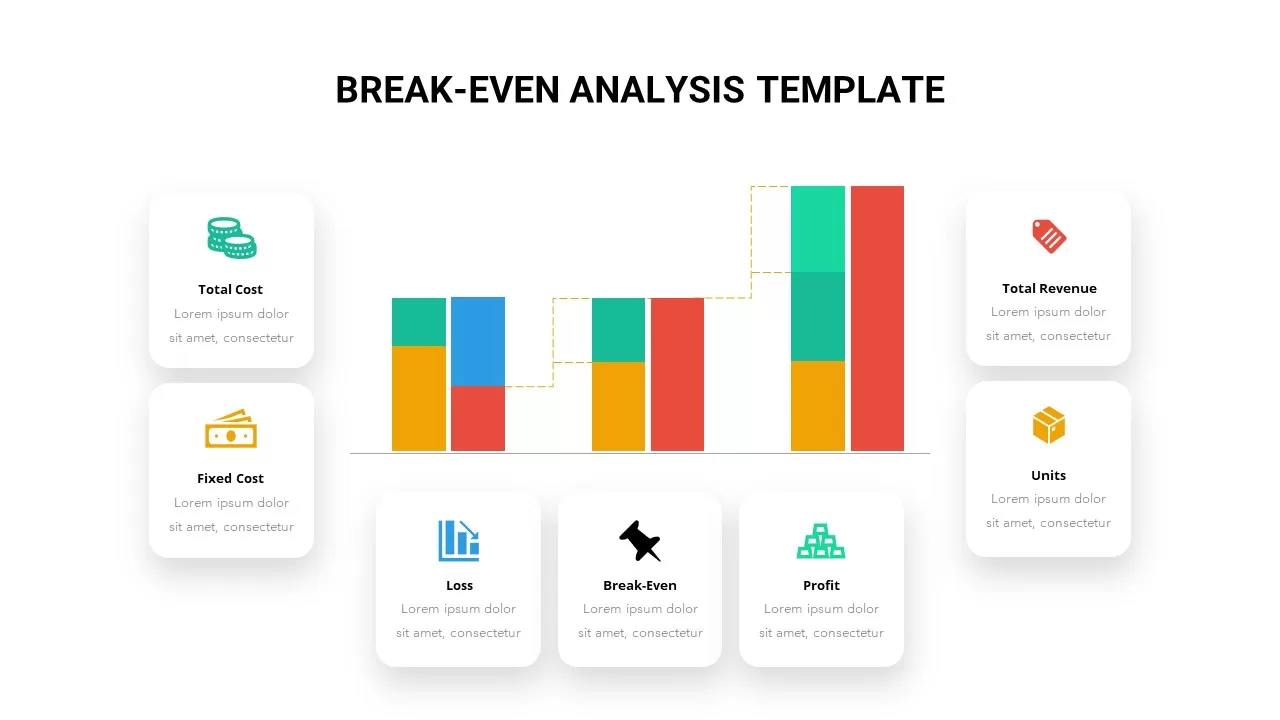
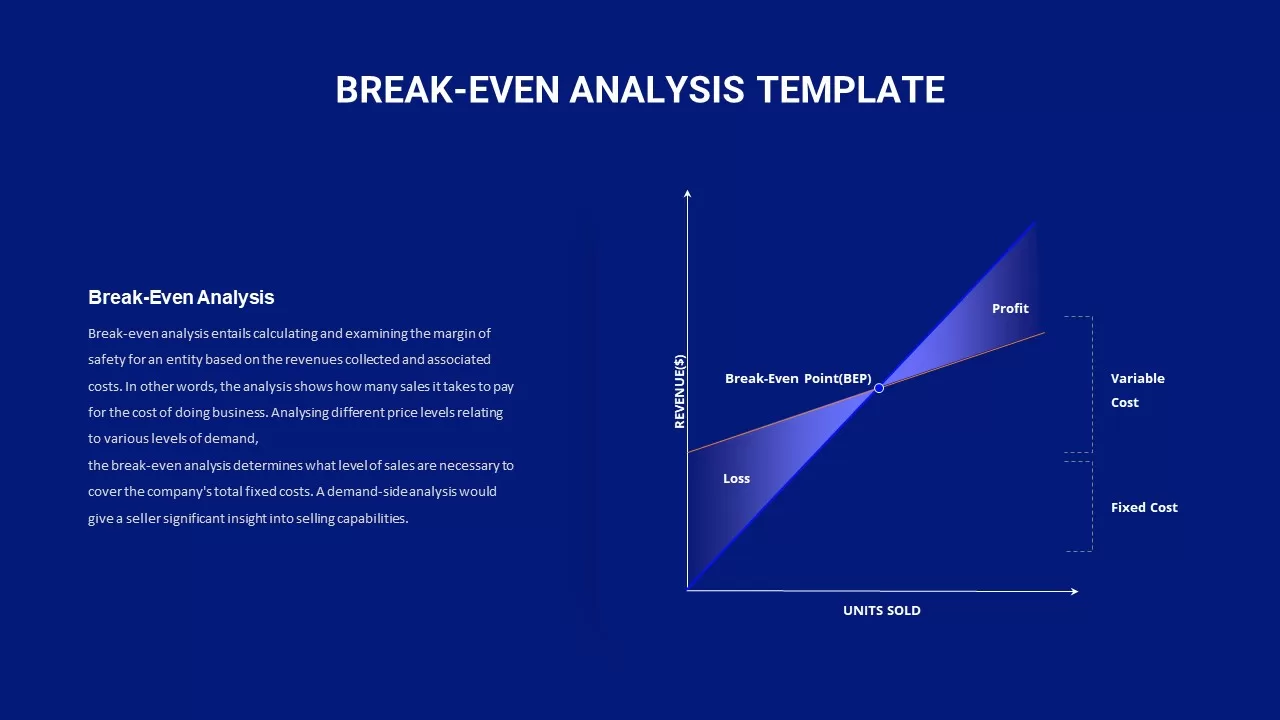
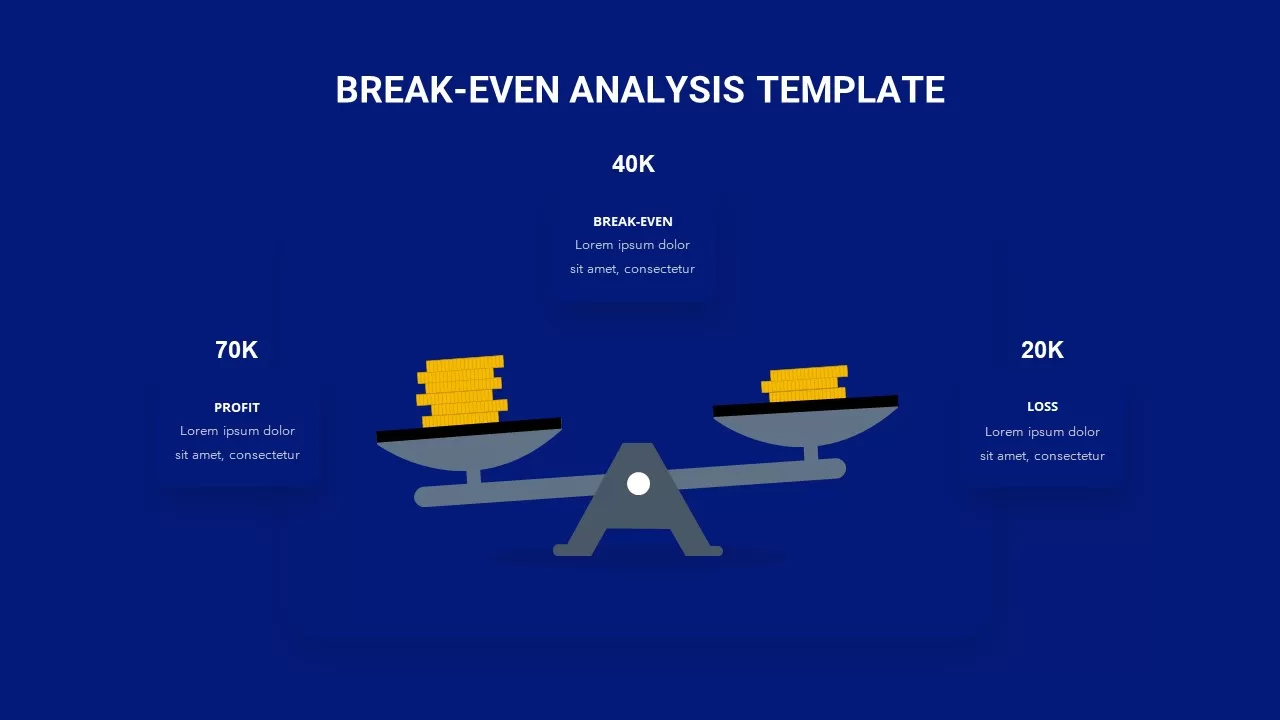
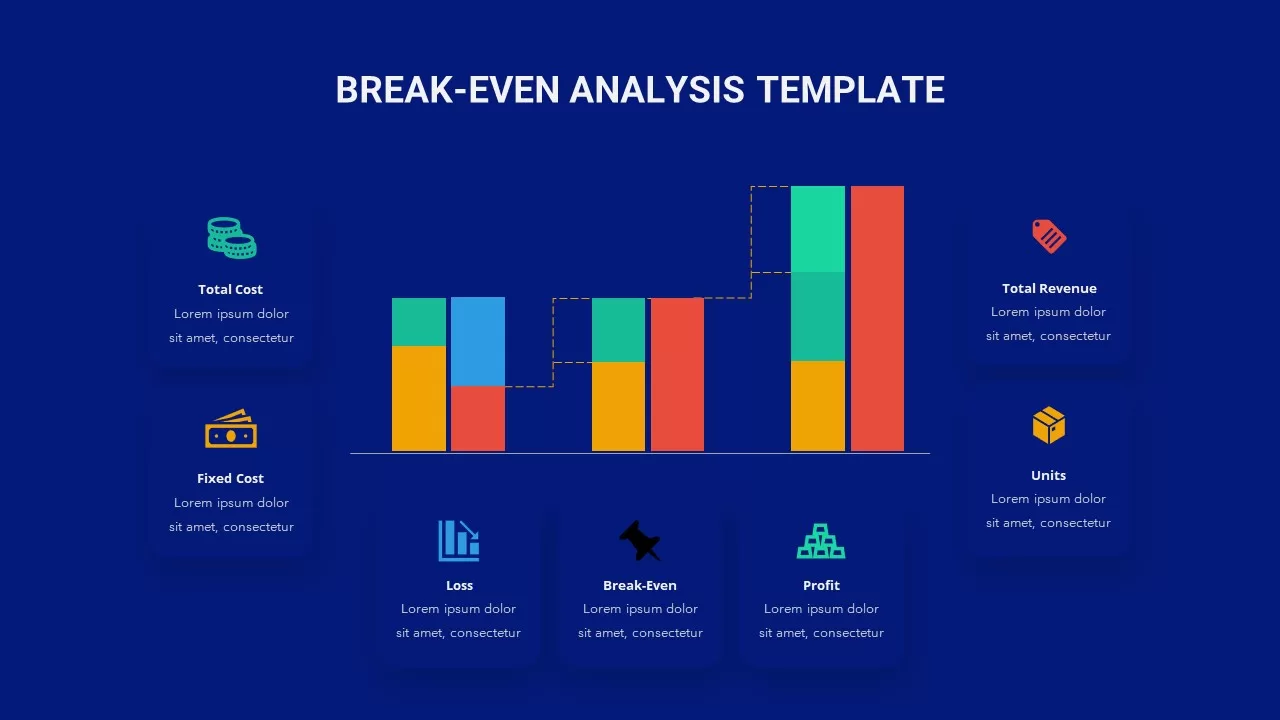
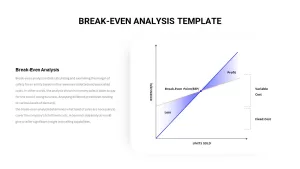
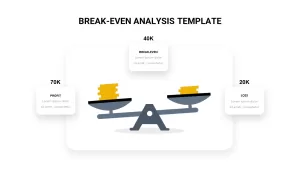
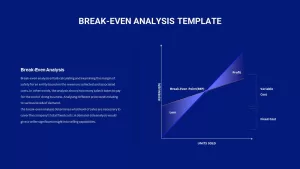
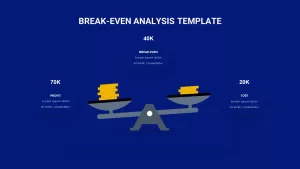
Leverage this comprehensive pack of three break-even analysis infographics to clearly illustrate the relationship between cost, revenue, profit, and loss across diverse visualization styles. The first slide presents a stacked bar chart with distinct color-coded segments for fixed cost, variable cost, total cost, and total revenue, linked by a dotted line to pinpoint the break-even threshold. The second slide employs a balanced scale graphic to juxtapose profit and loss values with a highlight on the break-even point, reinforcing the concept of cost versus revenue equilibrium. The third slide offers a classic linear break-even chart with shaded areas for loss and profit, annotated axes for units sold and revenue, and labeled cost components for insightful margin-of-safety analysis.
Each infographic is designed with fully editable vector elements, intuitive placeholders, and crisp iconography that ensure seamless customization in both PowerPoint and Google Slides. Master slide layouts allow quick color adjustments, text updates, and icon swaps, while high-resolution visuals guarantee clear display in boardroom presentations, financial reports, or online webinars. Consistent typography and clean layouts maintain visual cohesion across all slides, enabling you to craft a compelling narrative around cost structure and revenue projections.
Who is it for
Financial analysts, accountants, and business strategists will benefit from these infographics to illustrate cost-versus-revenue relationships, break-even thresholds, and profitability scenarios. Startup founders, project managers, and educators can use these slides to streamline financial presentations in boardrooms, client meetings, or classroom settings.
Other Uses
Beyond break-even analysis, repurpose these graphics for budget planning, cost-benefit assessments, and performance dashboard development. Use the bar chart infographic for comparative cost-revenue breakdowns, the scale graphic for equilibrium demonstrations, and the linear chart for pricing strategy workshops, financial training sessions, or investor pitch enhancements.
Login to download this file

Item ID
SB02247
Related Templates

Break-Even Analysis template for PowerPoint & Google Slides
Process

Free Coffee Break Slide with Circular Text for PowerPoint & Google Slides
Graphics
Free

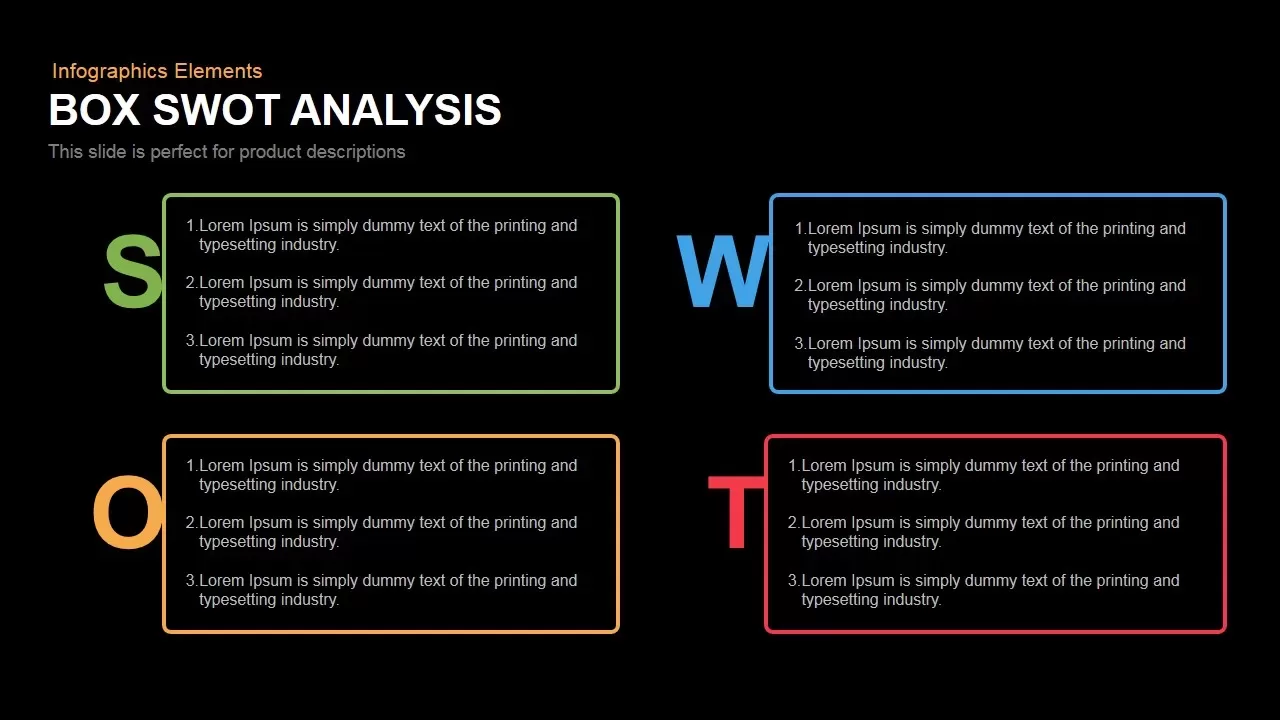
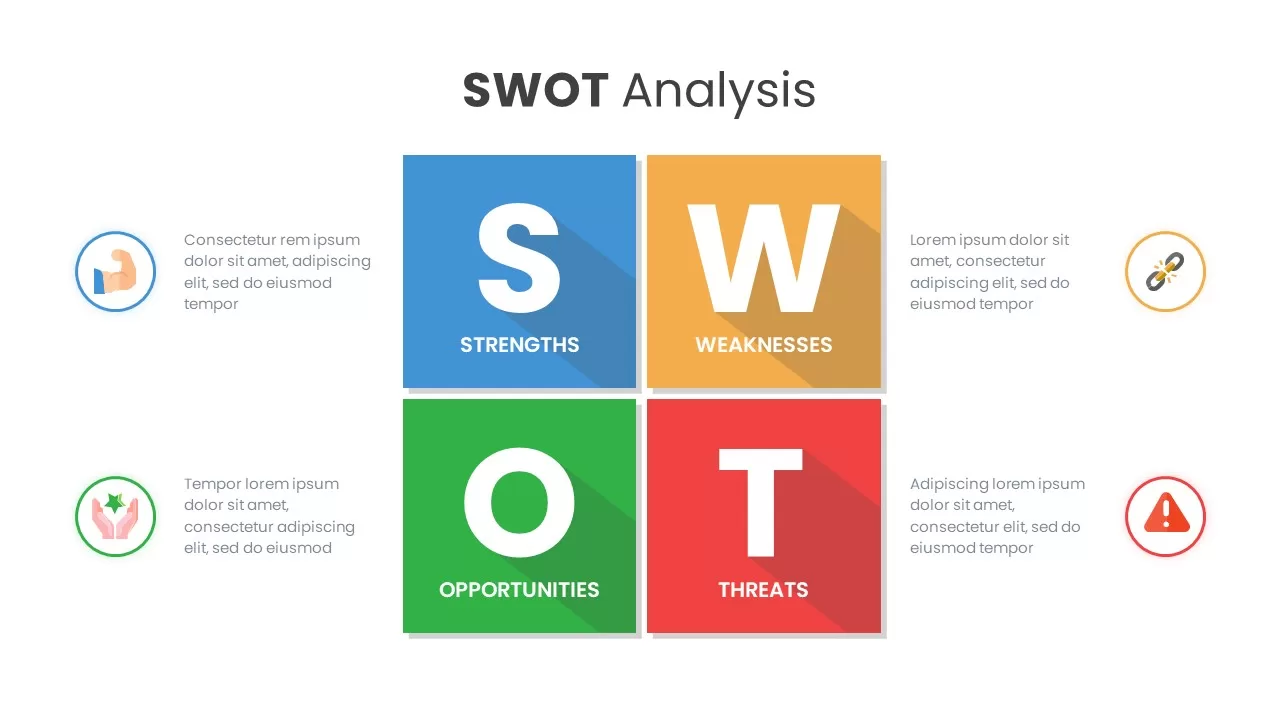
Box SWOT Analysis Infographic Template for PowerPoint & Google Slides
SWOT
Cluster Analysis Infographic Diagram Template for PowerPoint & Google Slides
Business
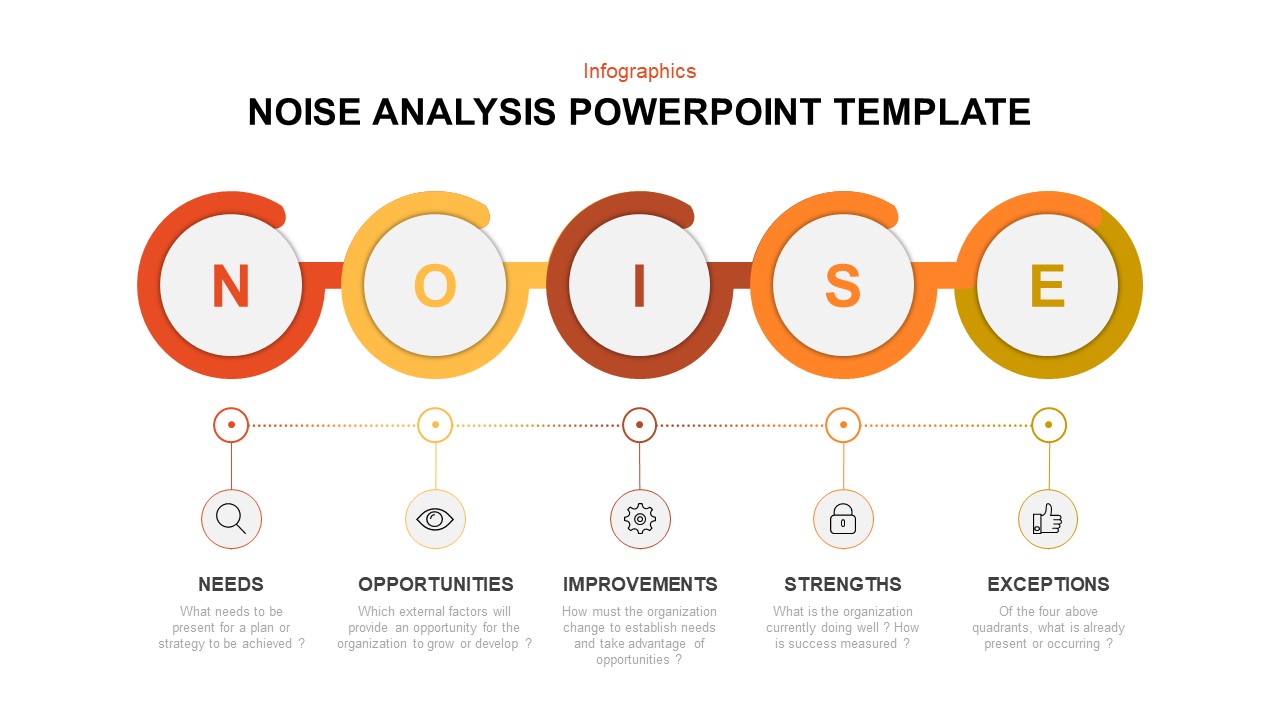
Modern Noise Analysis Infographic Template for PowerPoint & Google Slides
Process
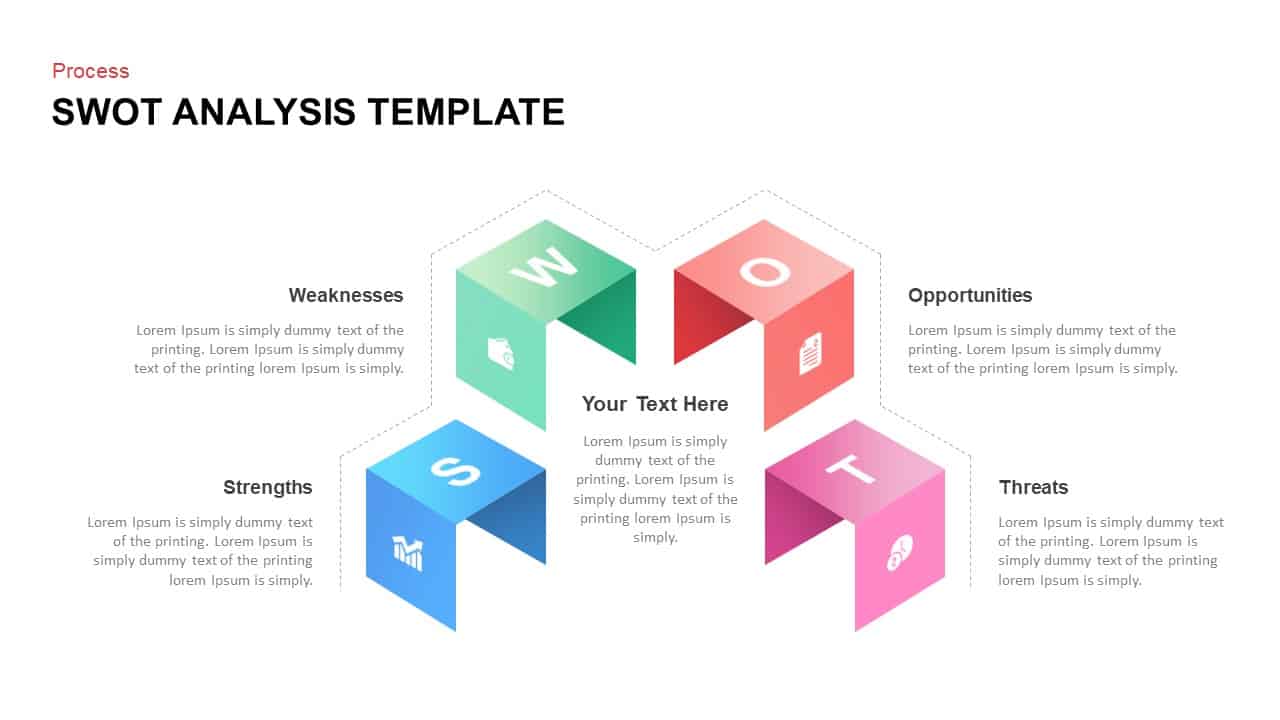
3D Cube SWOT Analysis Infographic Template for PowerPoint & Google Slides
SWOT
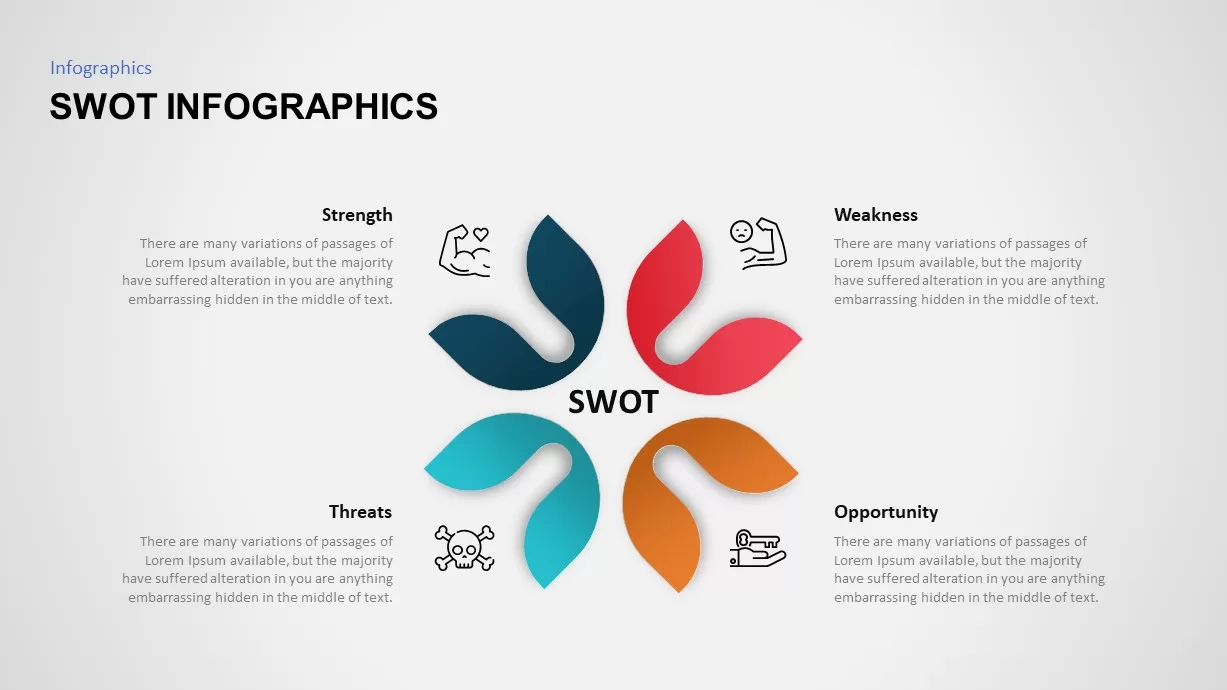
SWOT Analysis Petal Infographic Template for PowerPoint & Google Slides
SWOT
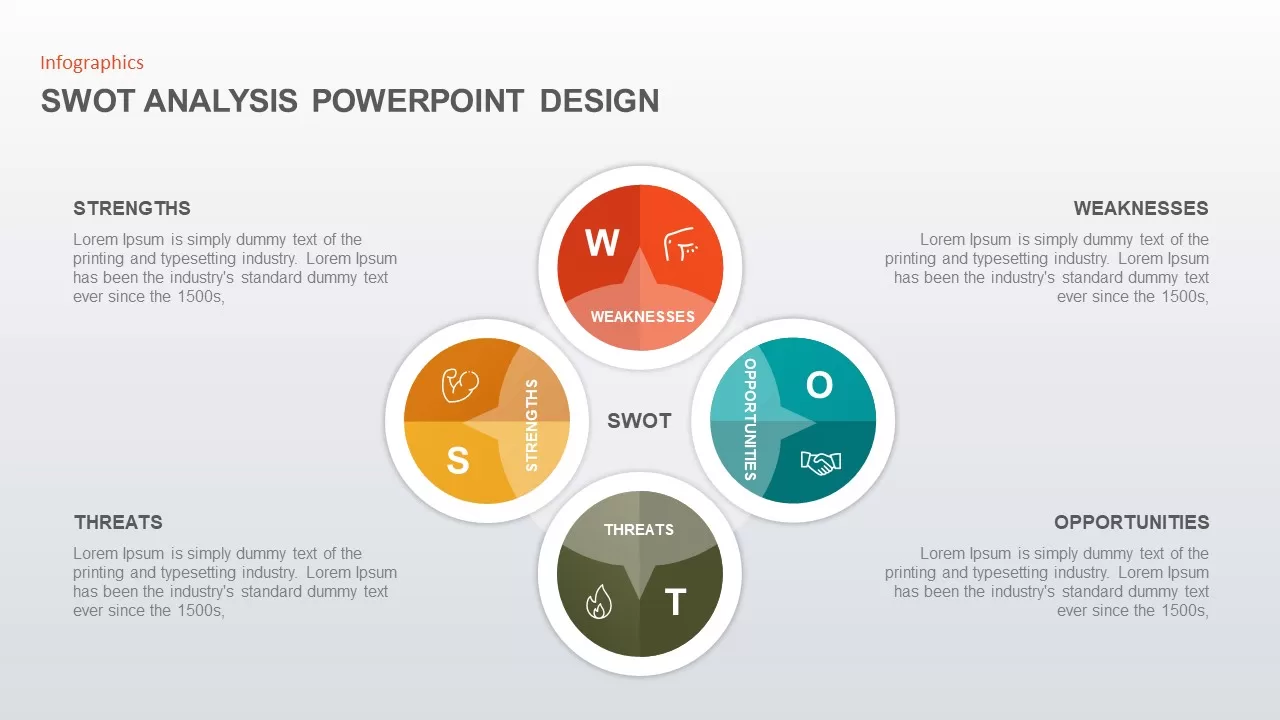
SWOT Analysis Circular Infographic Template for PowerPoint & Google Slides
SWOT
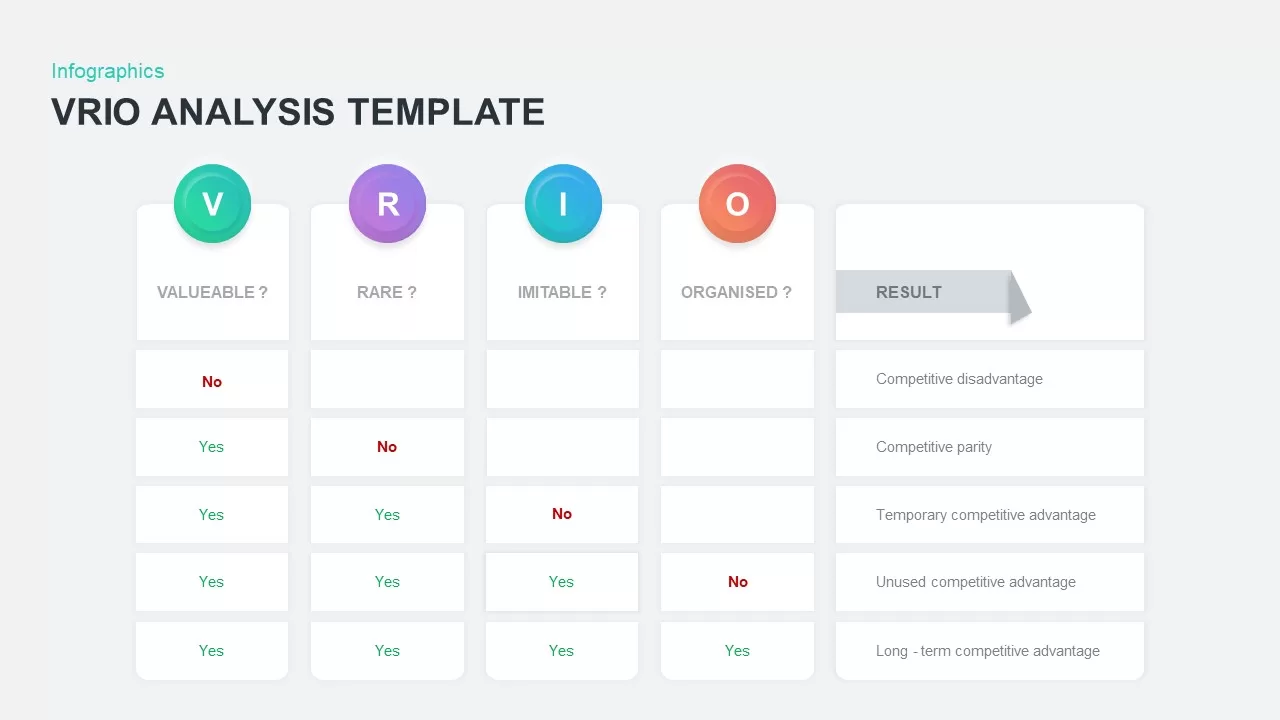
VRIO Analysis Infographic Template for PowerPoint & Google Slides
Business Strategy
SWOT Analysis Grid Infographic Template for PowerPoint & Google Slides
SWOT
Root Cause Analysis Infographic Pack Template for PowerPoint & Google Slides
Process
Category Analysis Comparison Infographic Template for PowerPoint & Google Slides
Comparison
SWOT Analysis Infographic with Circular Icons Template for PowerPoint & Google Slides
SWOT
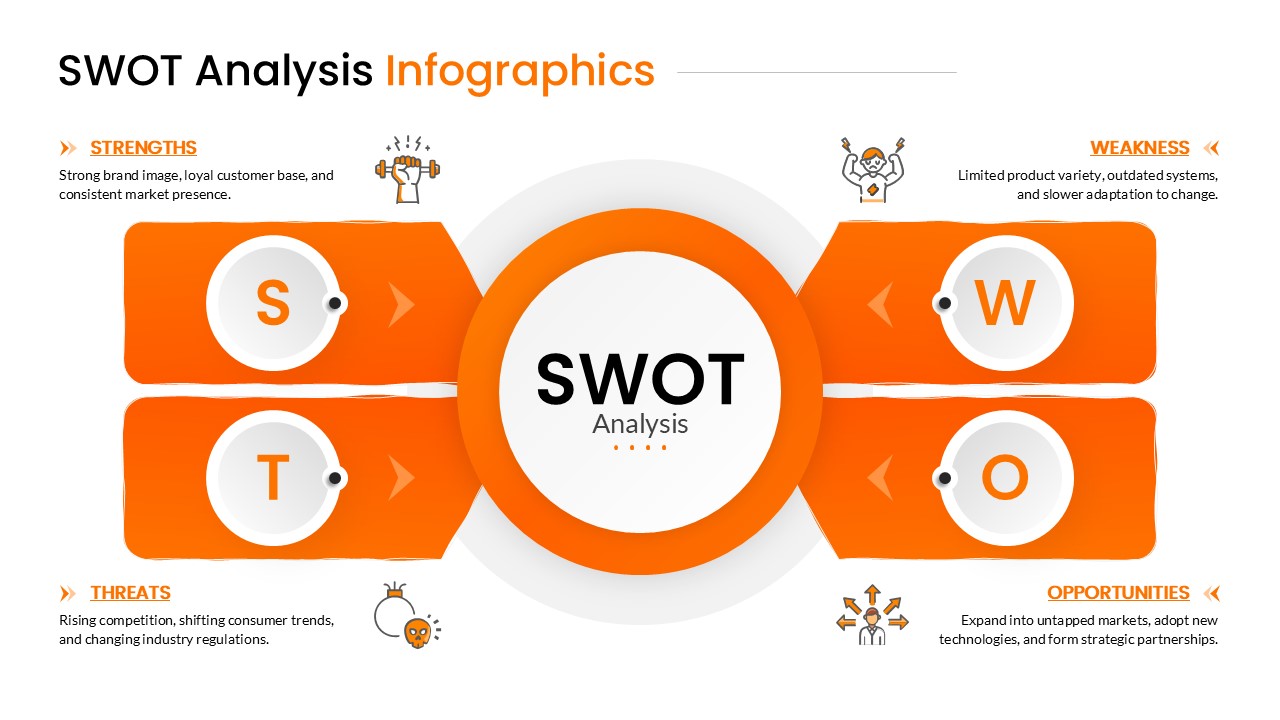
Orange SWOT Analysis Infographic Template for PowerPoint & Google Slides
SWOT
Mobile User Data Analysis Infographic for PowerPoint & Google Slides
Process
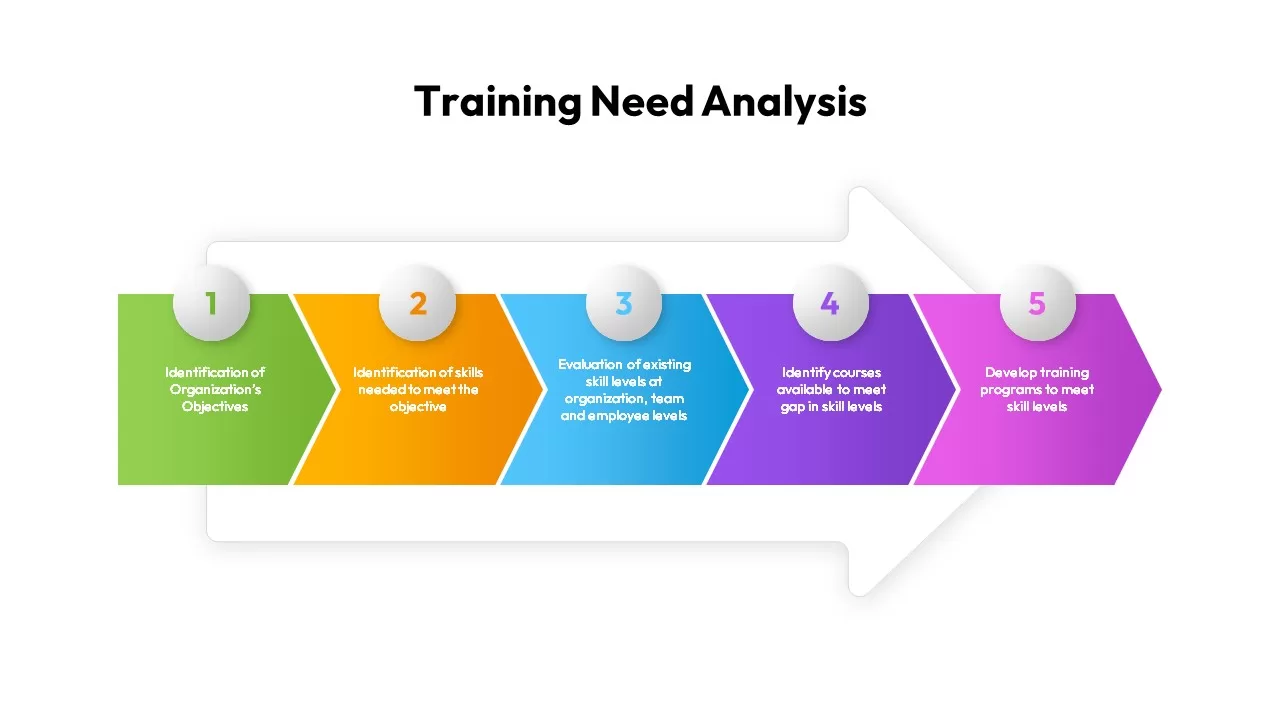
Training Need Analysis Process infographic for PowerPoint & Google Slides
Employee Performance
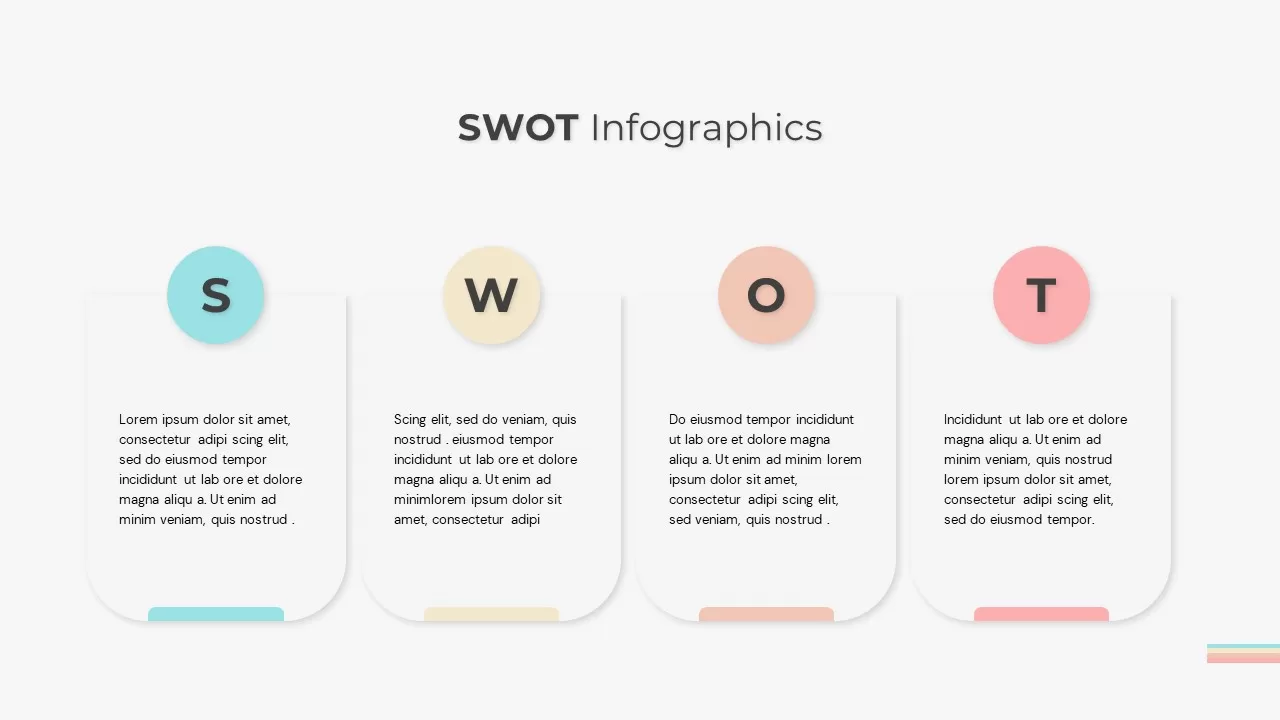
SWOT Analysis Infographic Slide for PowerPoint & Google Slides
SWOT
Heat Map Infographic Template For Risk Assessment and Priority Analysis
Comparison Chart
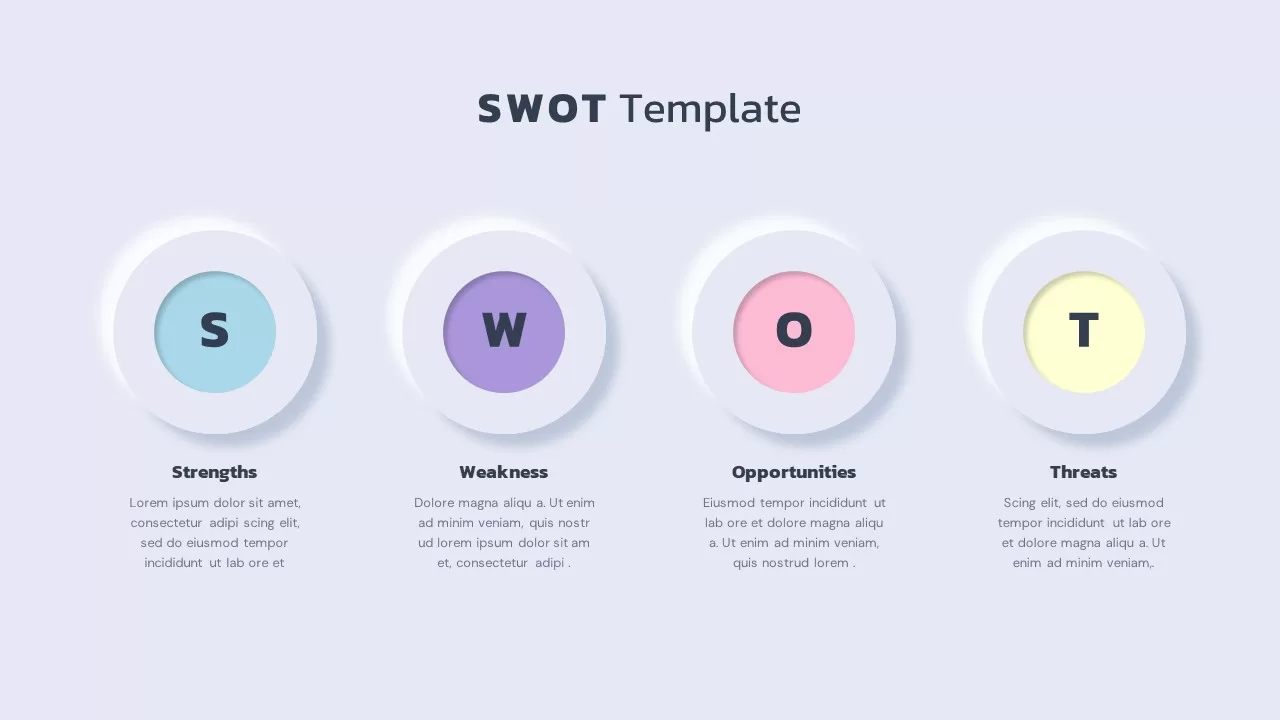
SWOT Analysis Infographic
SWOT
PEST Analysis PowerPoint Template for PowerPoint & Google Slides
Business Strategy