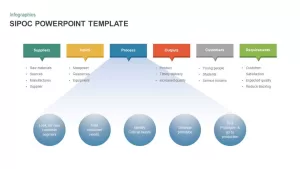


BCG Matrix Concept PowerPoint Template
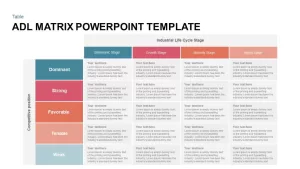
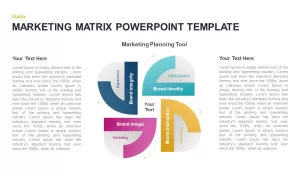
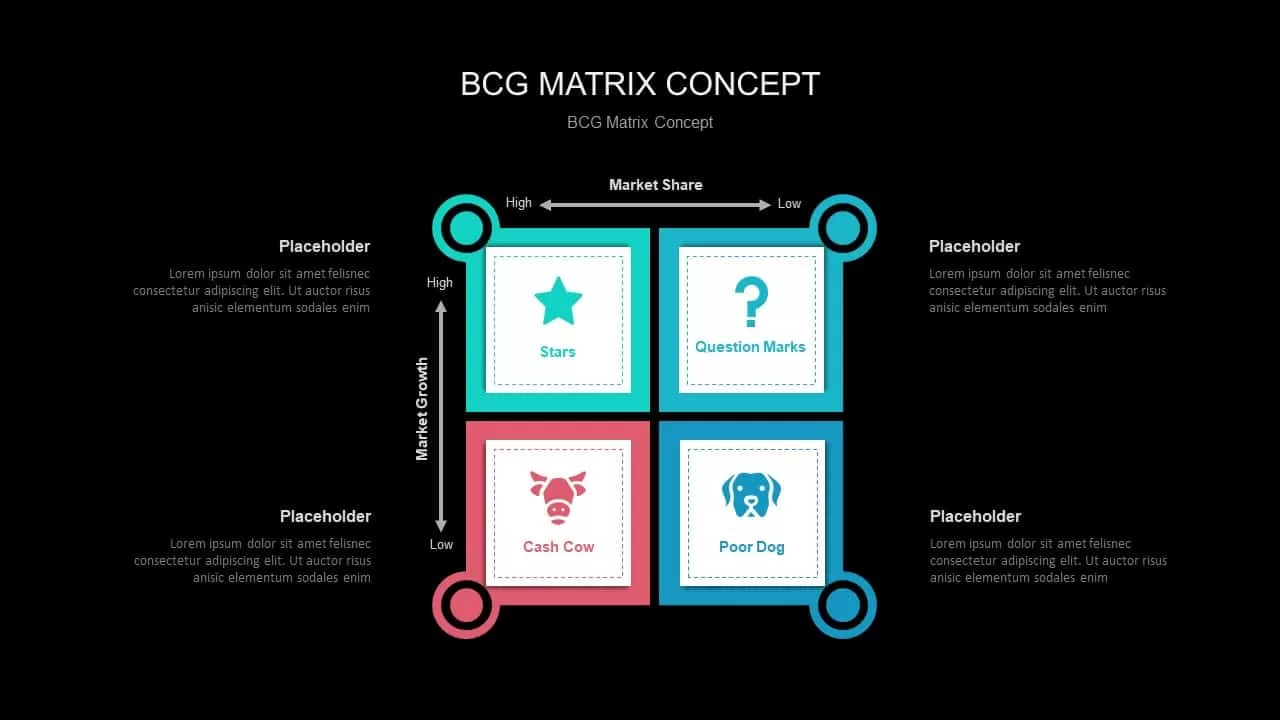
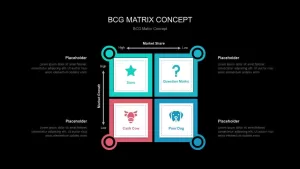
BCG matrix concept for PowerPoint is a business growth analyzing matrix. BCG stands for Boston Consulting Group Matrix is a method to analyze business strength. It is one of the popular corporate portfolio analyze tool. Here the designers attractively highlighting the visual graphics representation for an organization to analyze different businesses in its portfolio on the basis of their related market share and industry growth rates. BCG matrix PowerPoint is a comparative analysis of business potential and the evaluation of business environment. The business strength concept is illustrated on the four quadrant shapes. it include a star, question mark, cash cow and a poor dog. Each symbol has different meaning that conveys the current environment of a business in its growth perspective. This will enable the viewer to easy understand the business standing of a company and it potentials.
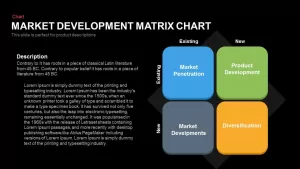
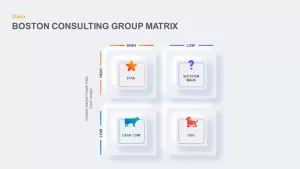
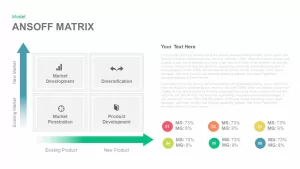
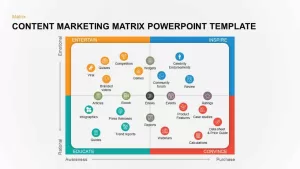
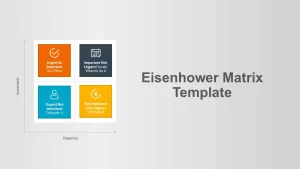
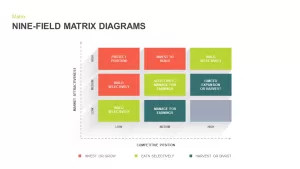
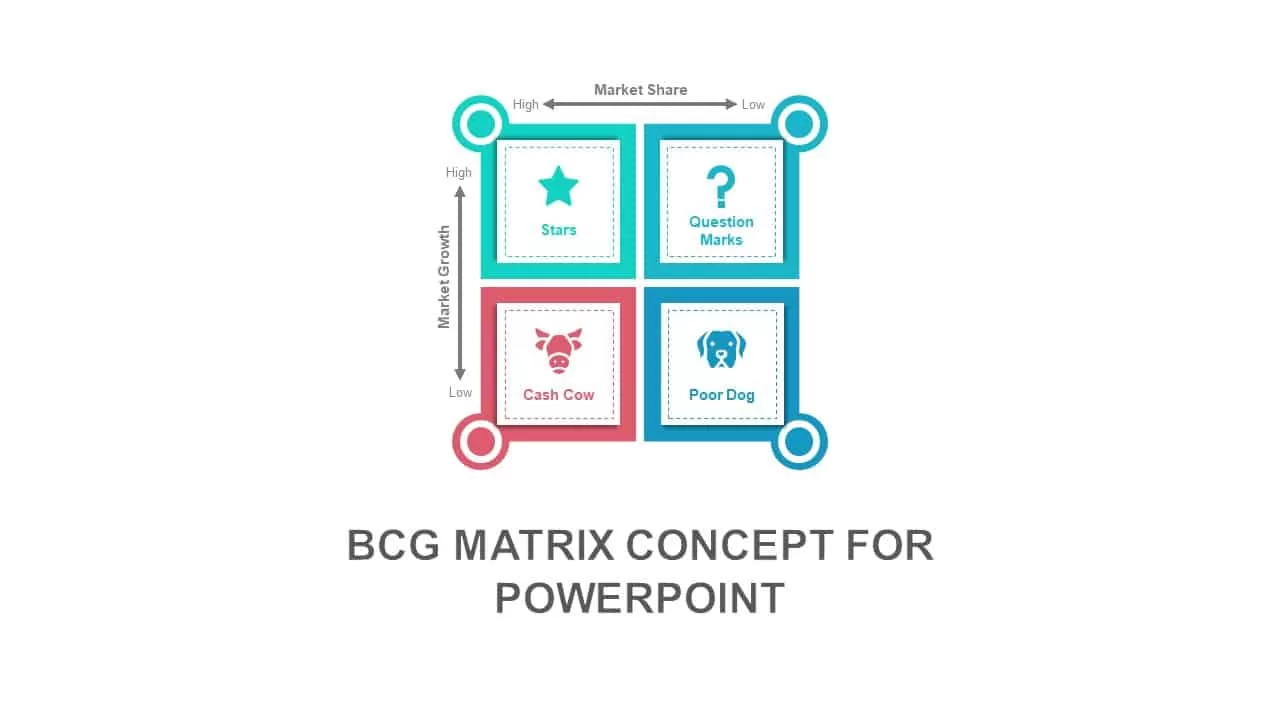
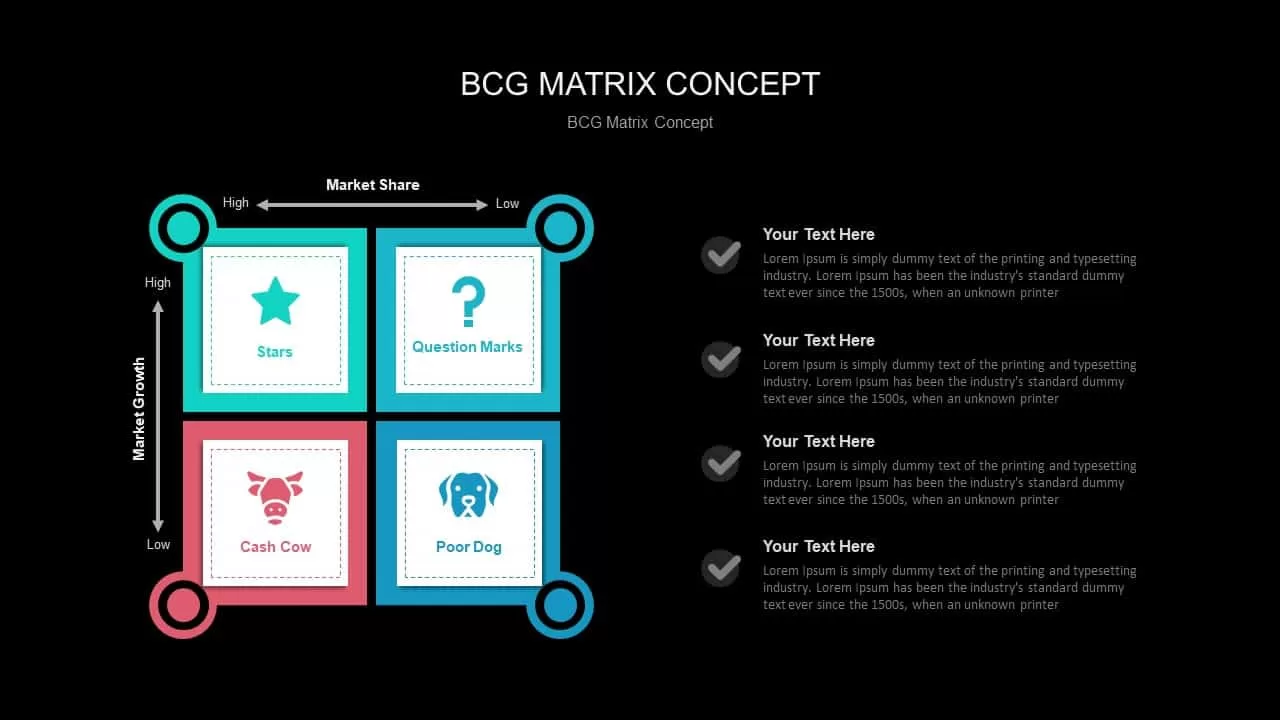
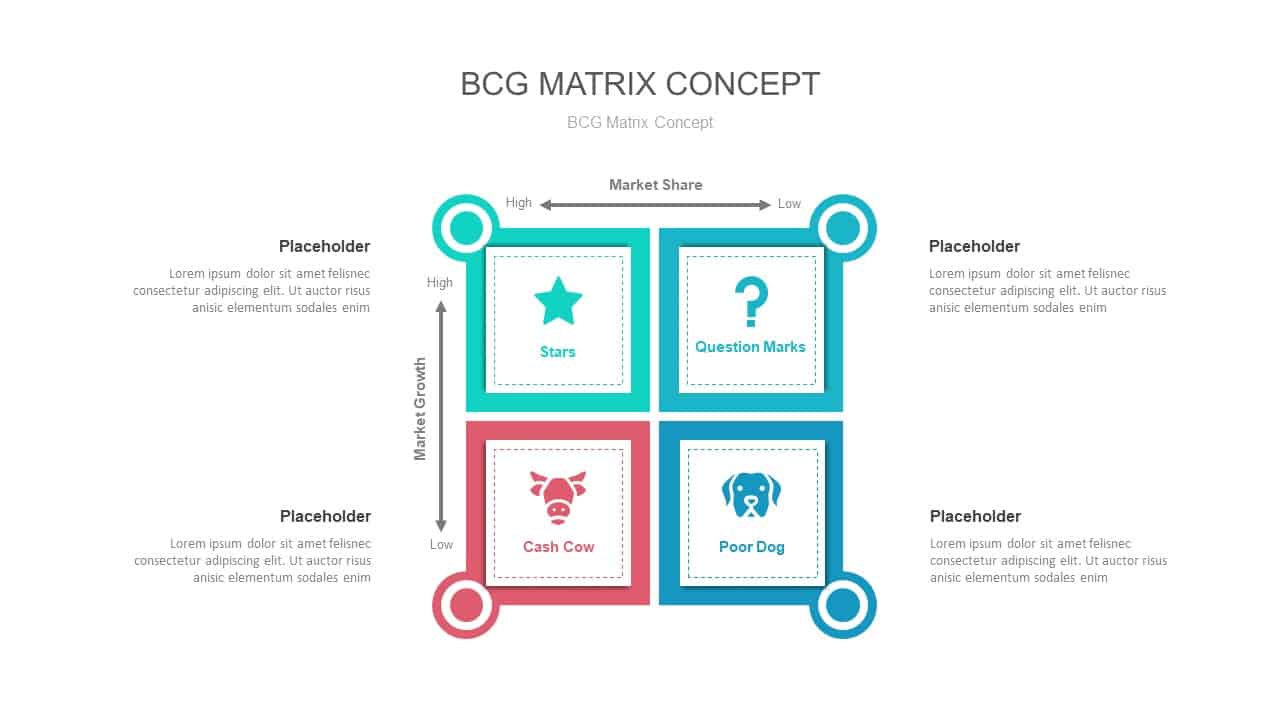
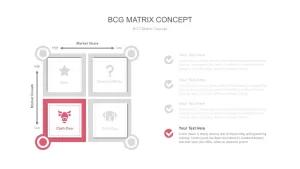
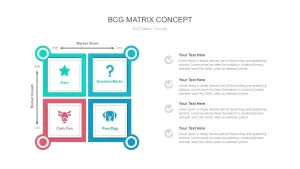
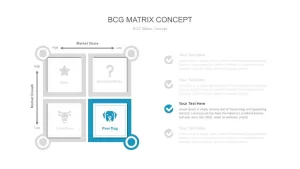
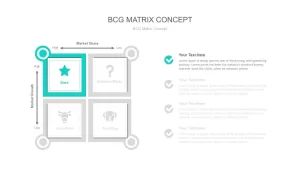
BCG matrix concept PowerPoint template contains four cells, with the horizontal axis indicating relative market shape and the vertical axing representing market growth rate. Each of the quadrant cells represents a particular type of business.
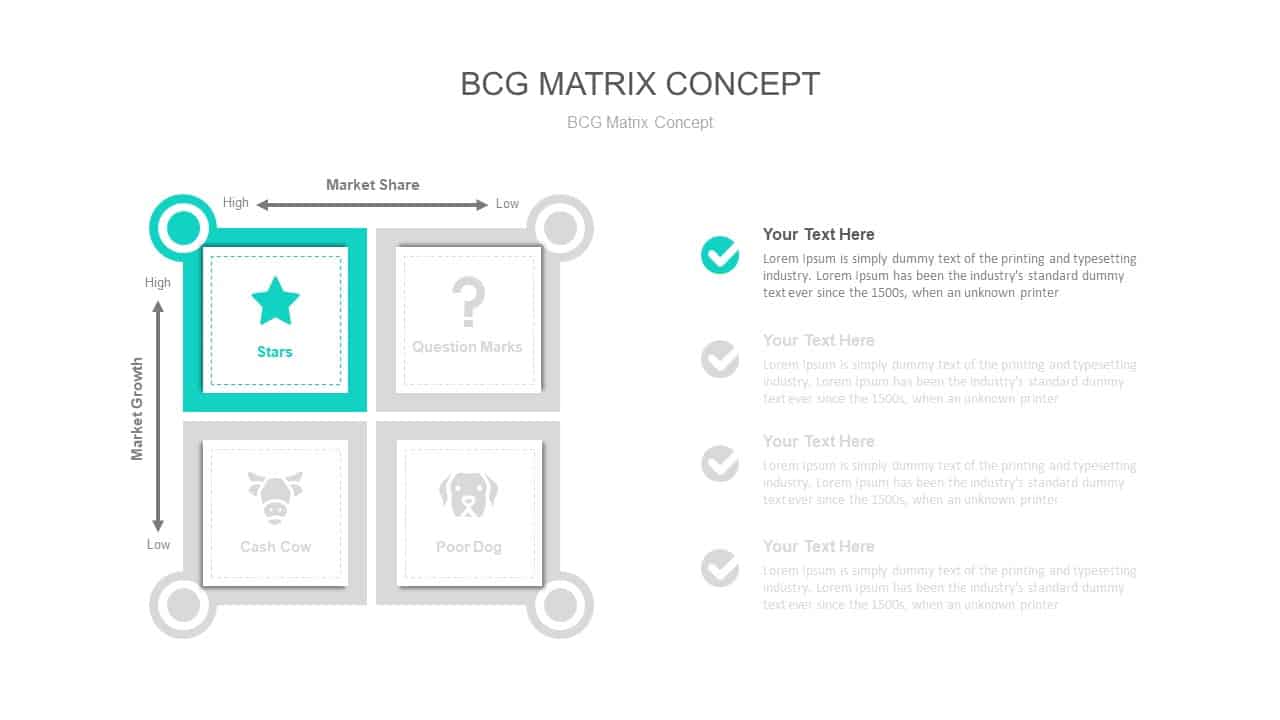
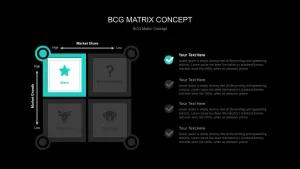
- Stars- Stars signify business units having large market share in a fast growing industry. They may produce cash but because of fast developing market, stars require massive investments to sustain their lead. Net cash flow is usually modest.
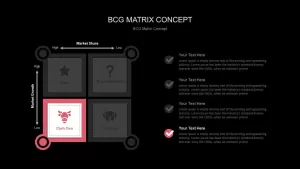
- Cash Cows- Cash Cows signifies commercial units having a great market share in a developed, slow mounting industry. Poor cow need little allocation of fund and generate cash that can be utilized for investment in other business units.
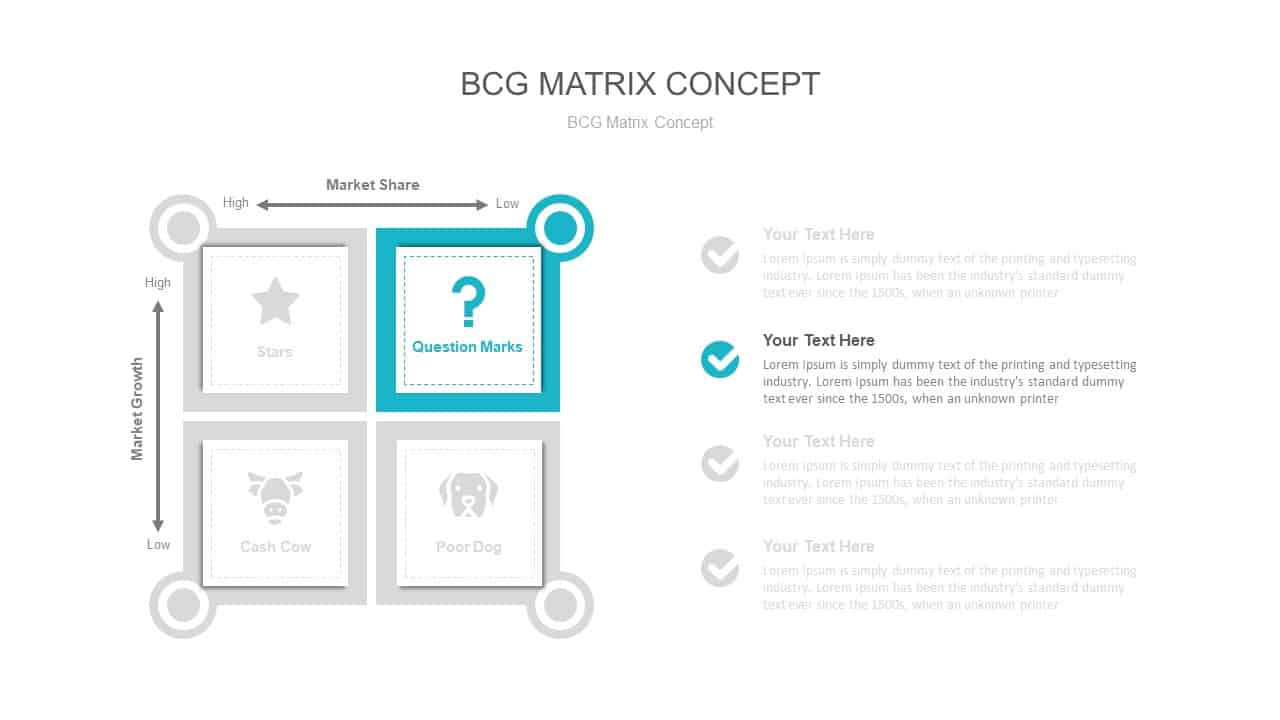
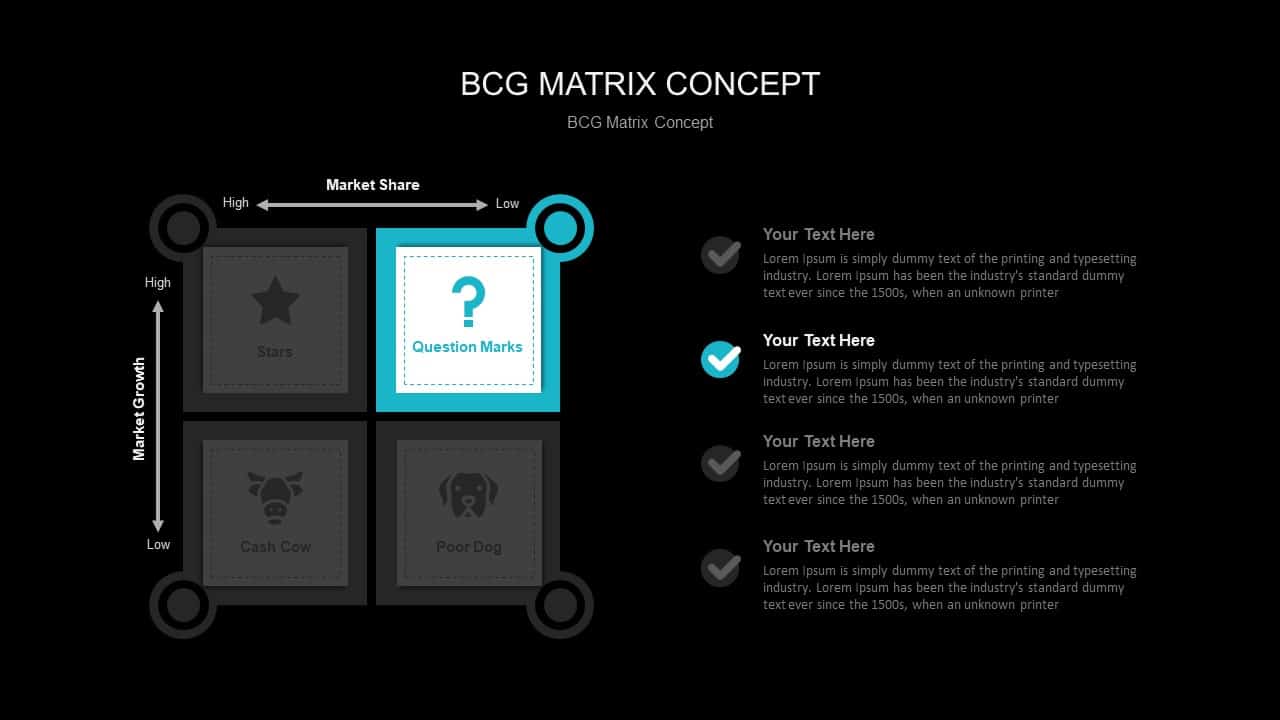
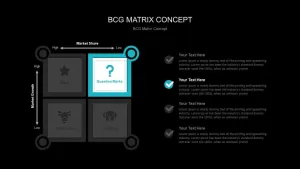
- Question Marks- Question marks denote business units having low relative market share and situated in a high growth industry. They need massive amount of money to preserve or gain market share. They require responsiveness to govern if the venture can be workable. Question marks are usually new goods and services which have a good commercial potential.
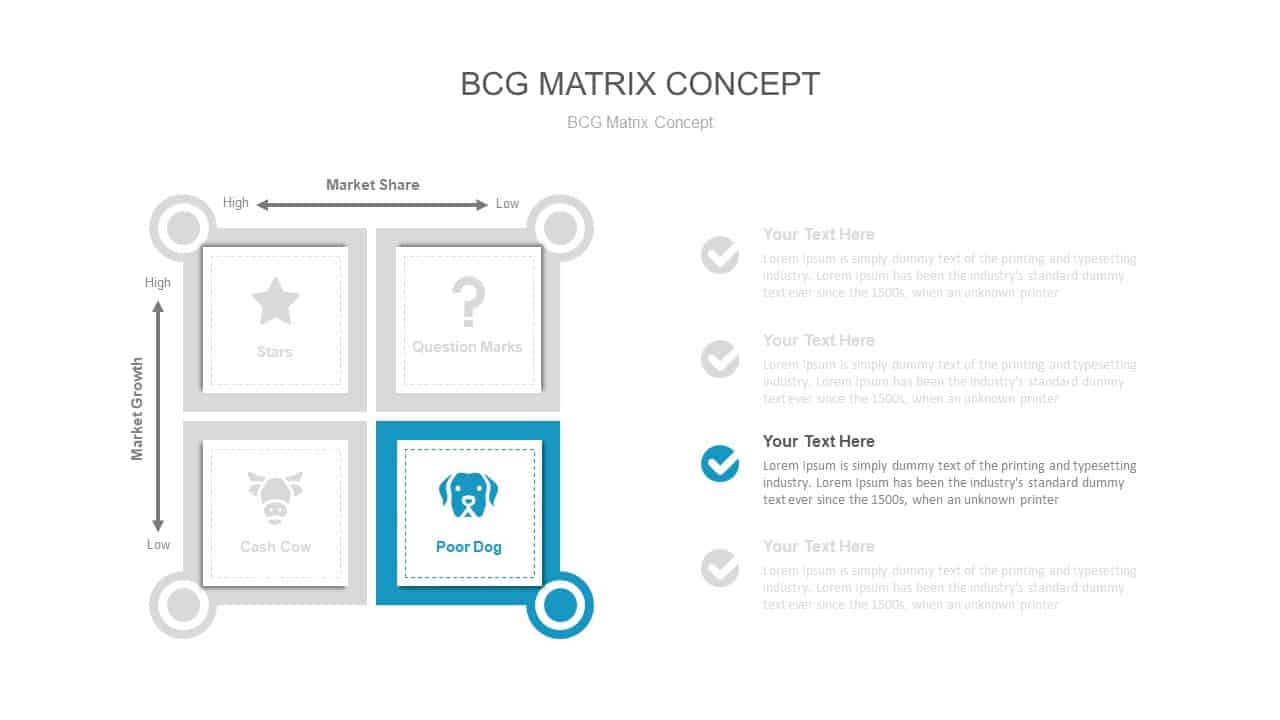
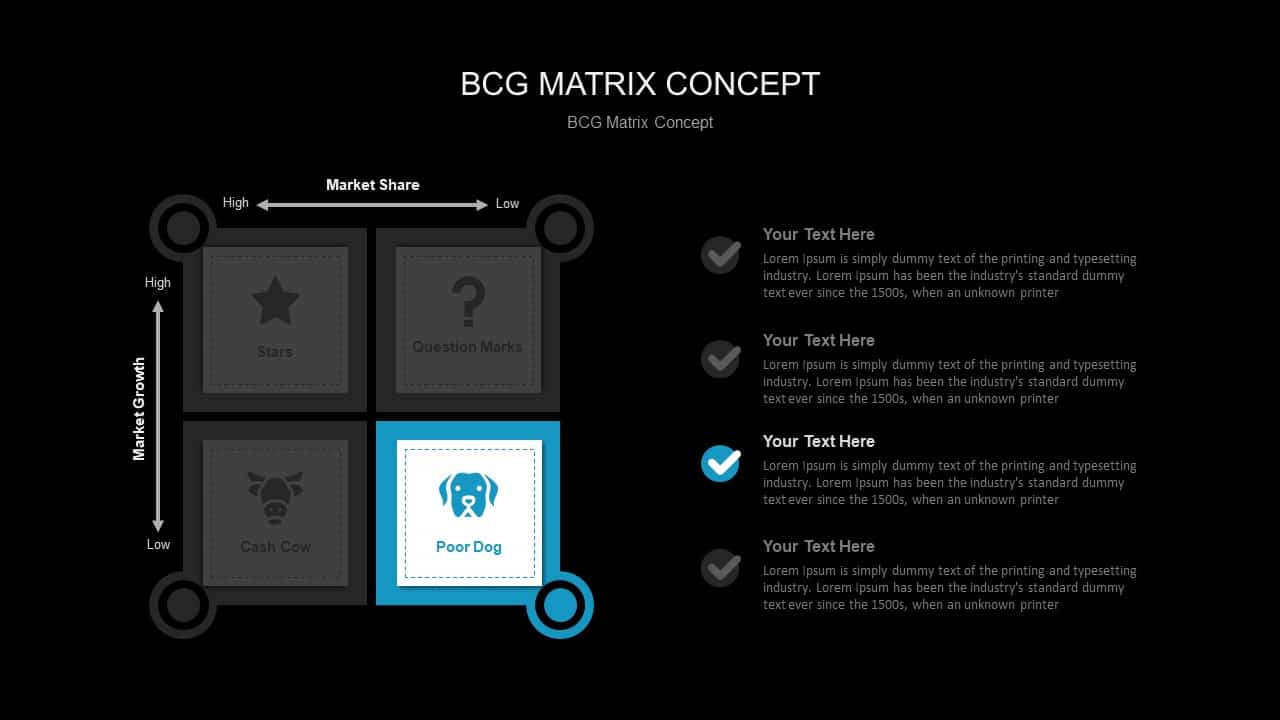
- Dogs- Dogs symbolize businesses having weak market shares in low-growth markets. They neither make cash nor necessitate huge amount of money. Due to low market share, these business entities face cost difficulties. Usually cost-cutting strategies are adopted because these firms can gain market share only at the expense of competitor’s/rival firms.
stock market analysis and portfolio managers can download BCG matrix PowerPoint slide to show the market share and growth rate of different companies and whether the company belongs to dog cell, question mark cell, star cell, or cash cow cell. This may enable both presenter and the viewer to comprehend each section in a easy to understand fashion.
You can access more PowerPoint Business Templates here Grab the free ppt now!