Boston Consulting Group Matrix Diagram Template for PowerPoint & Google Slides
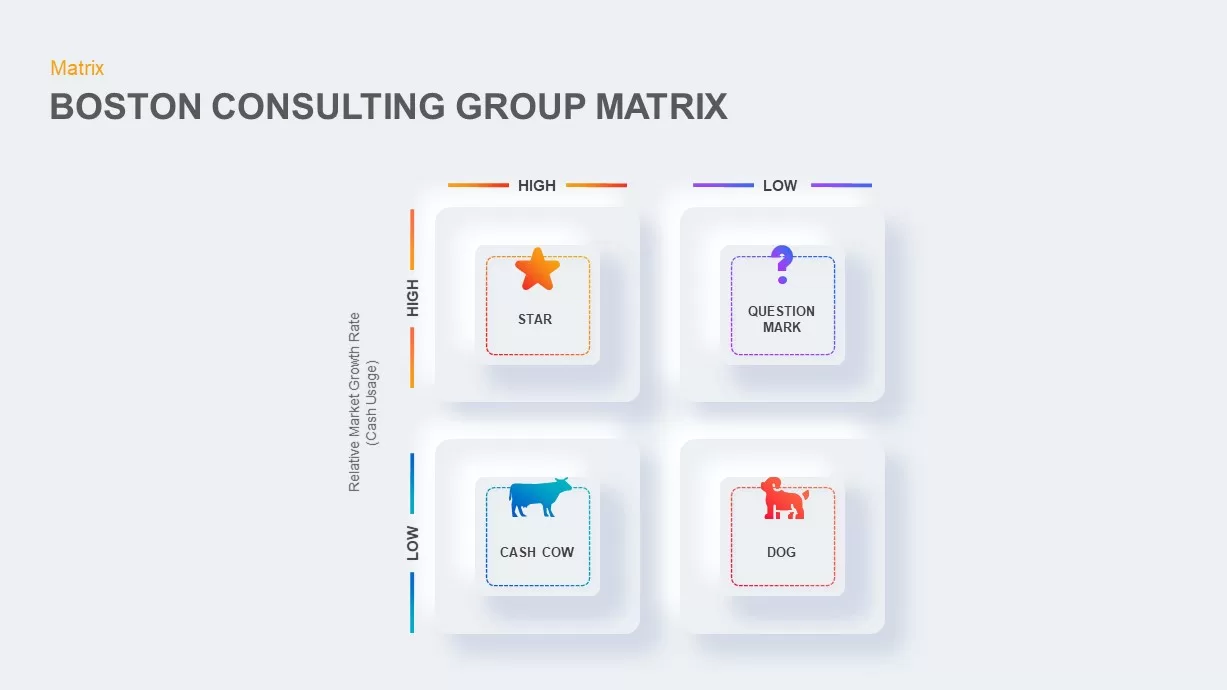
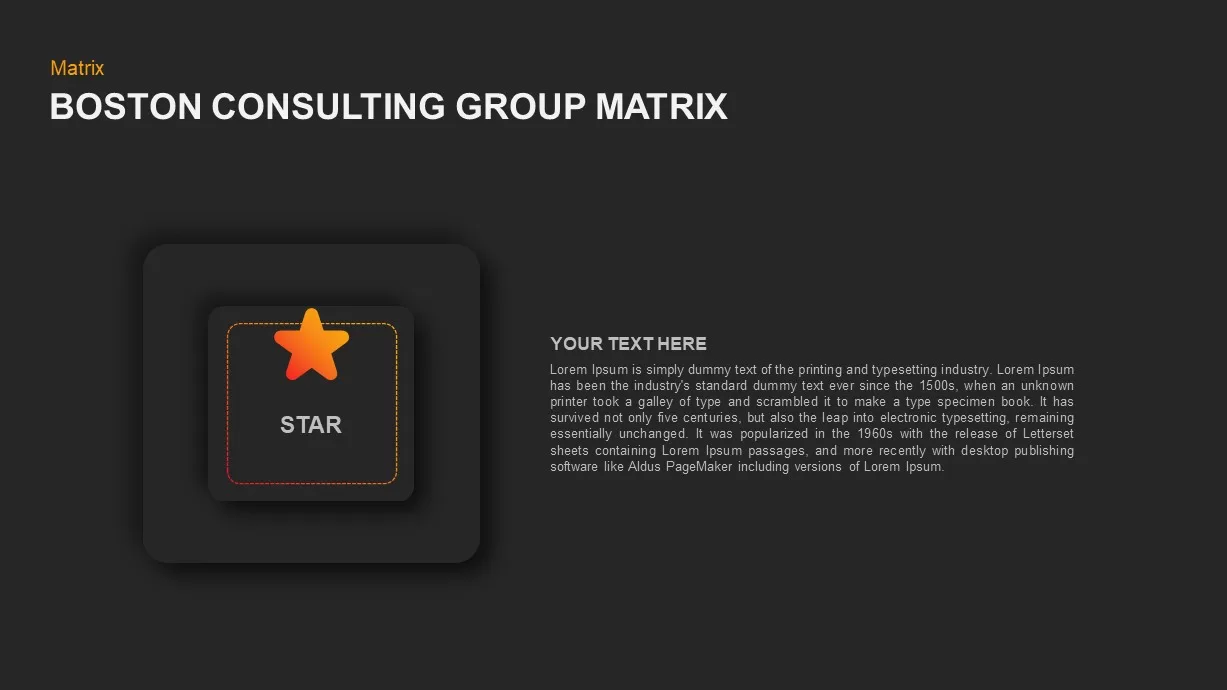
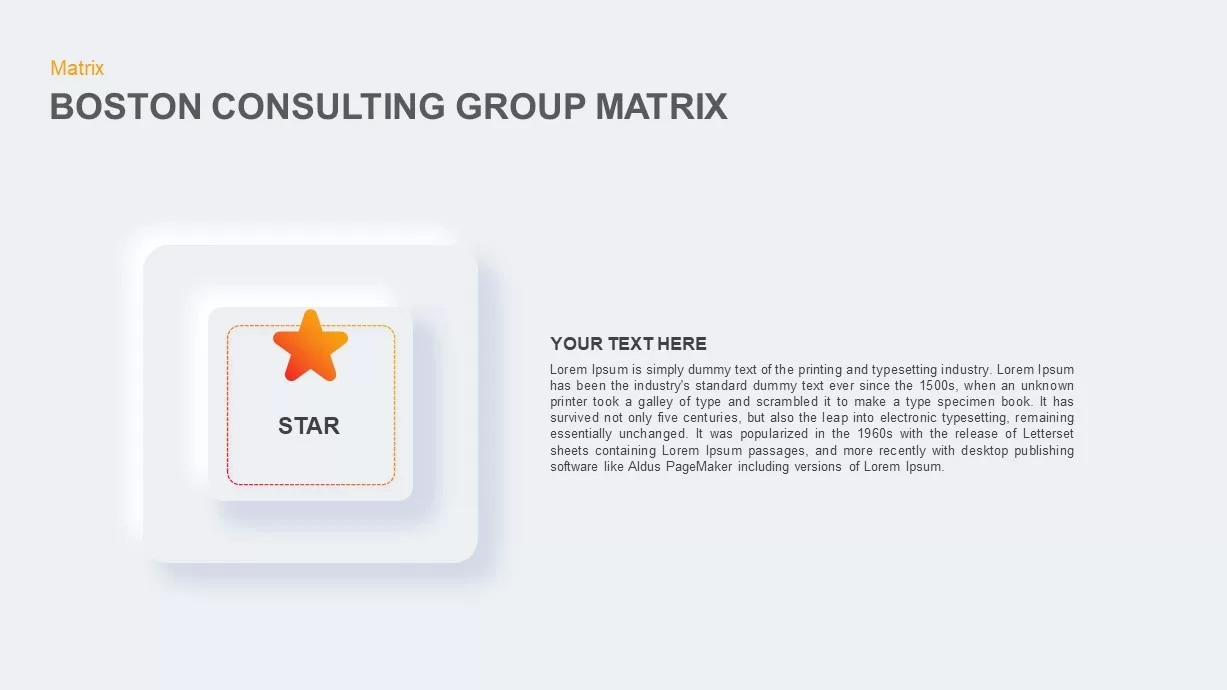
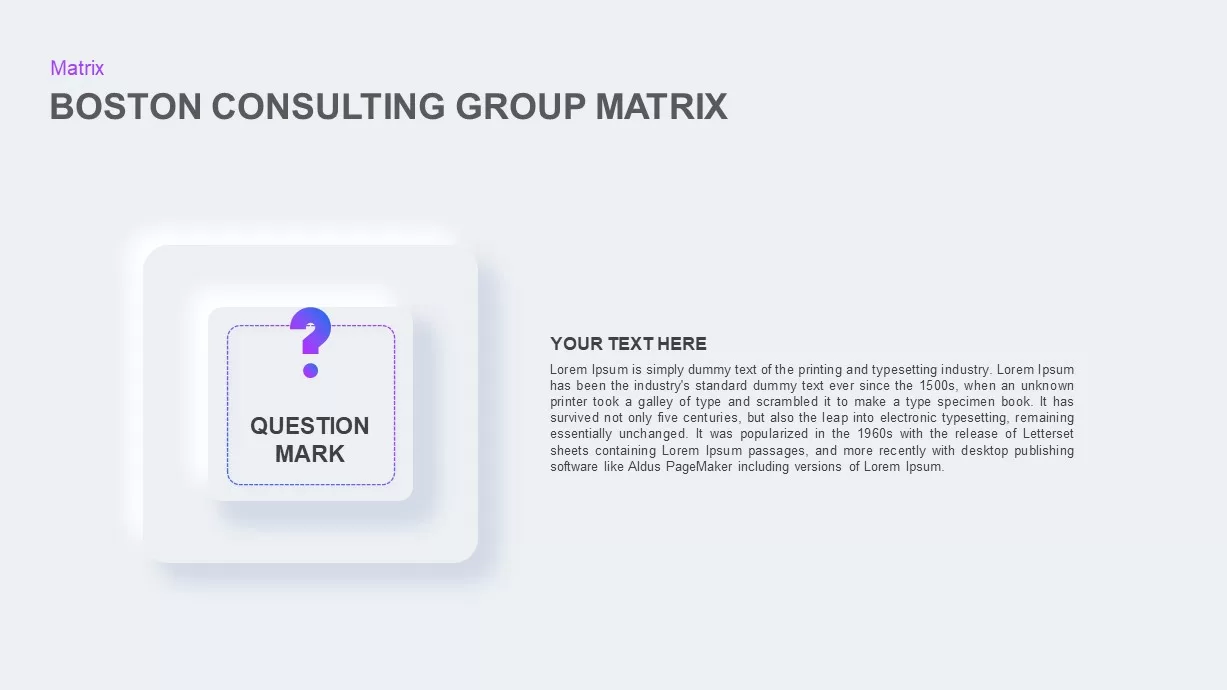
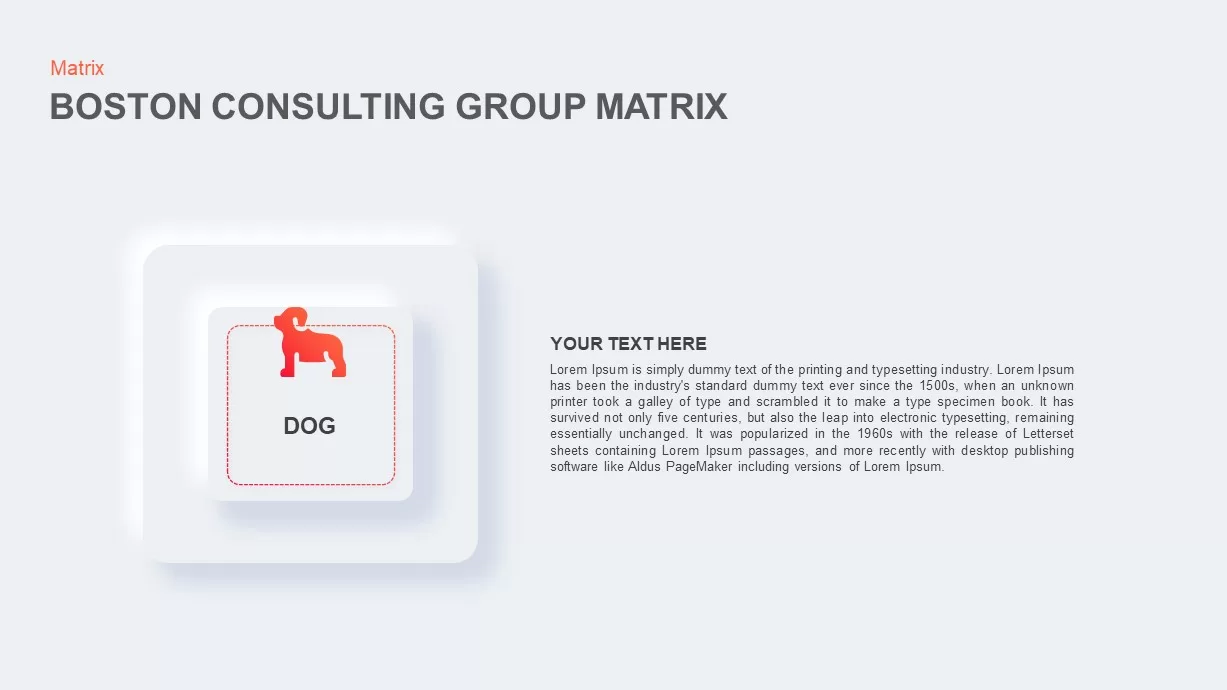
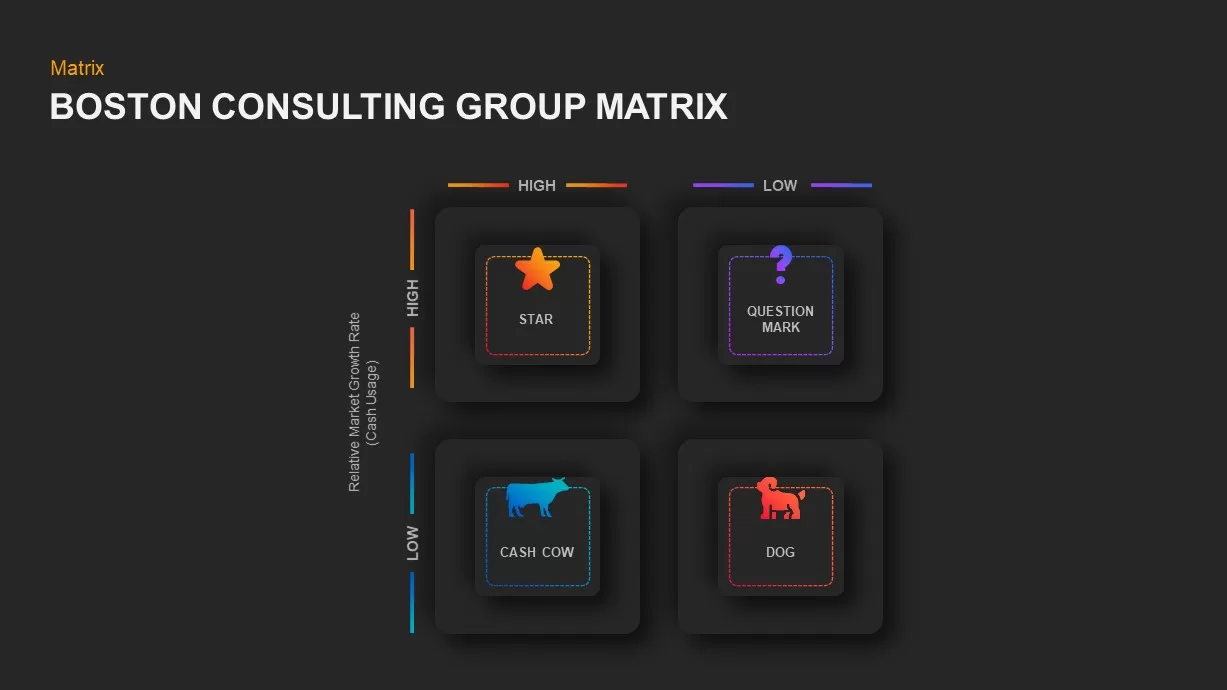
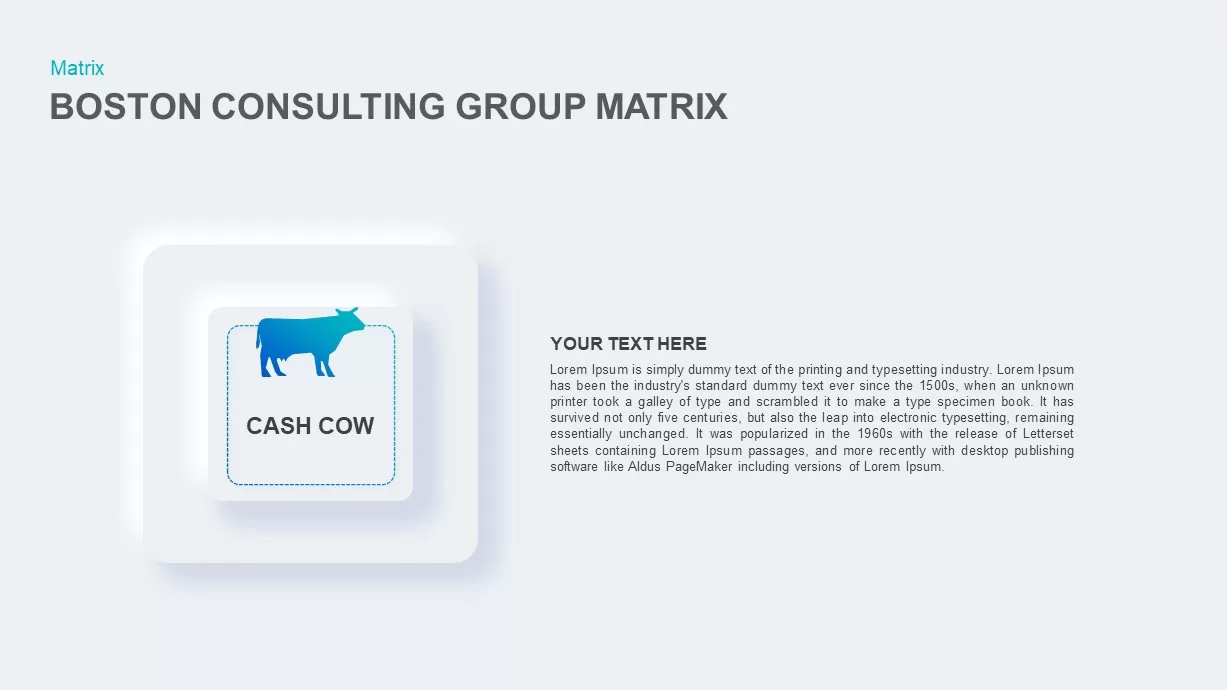
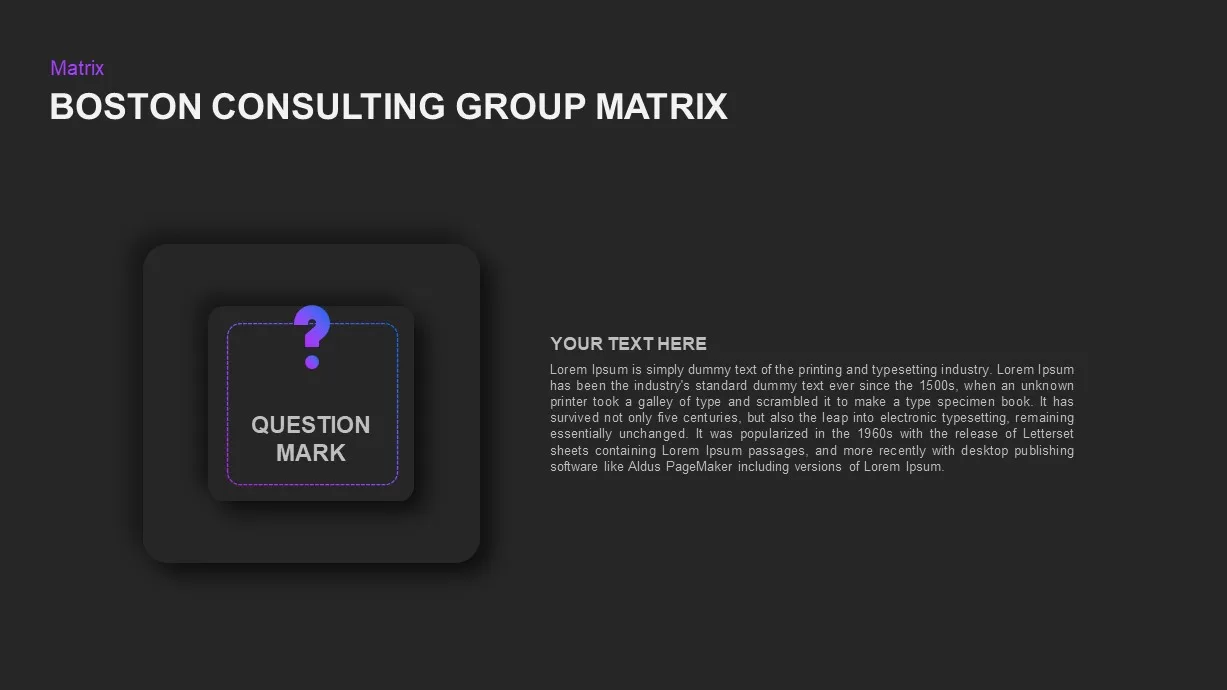
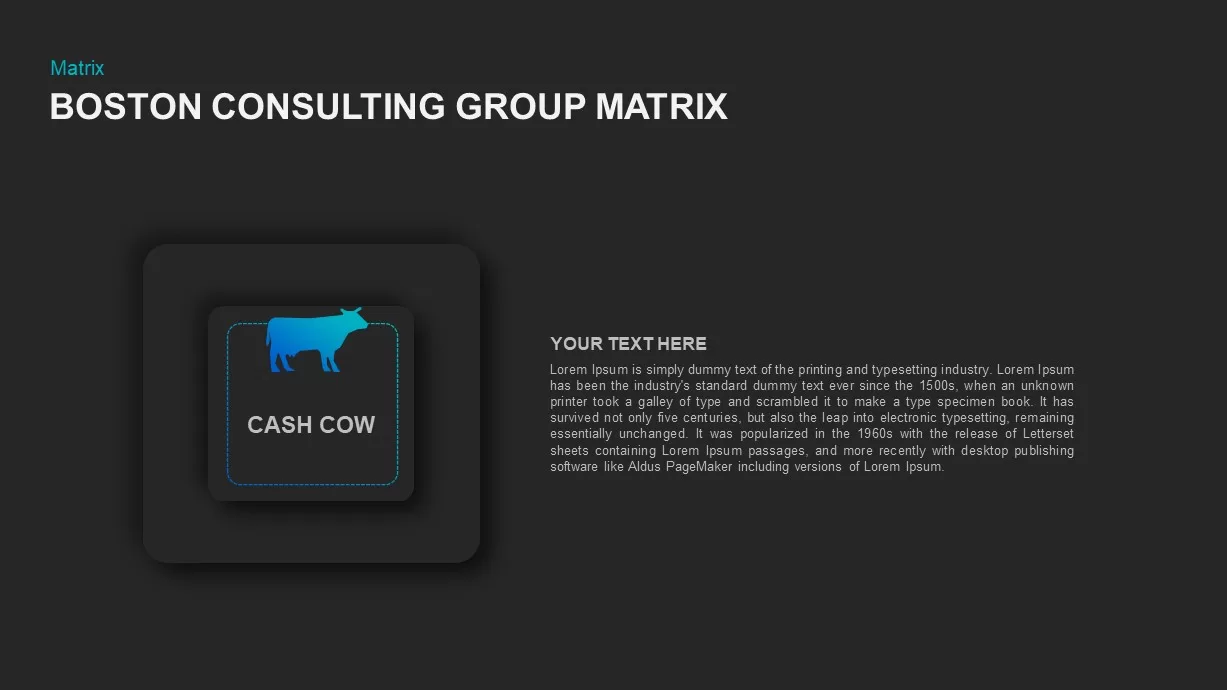
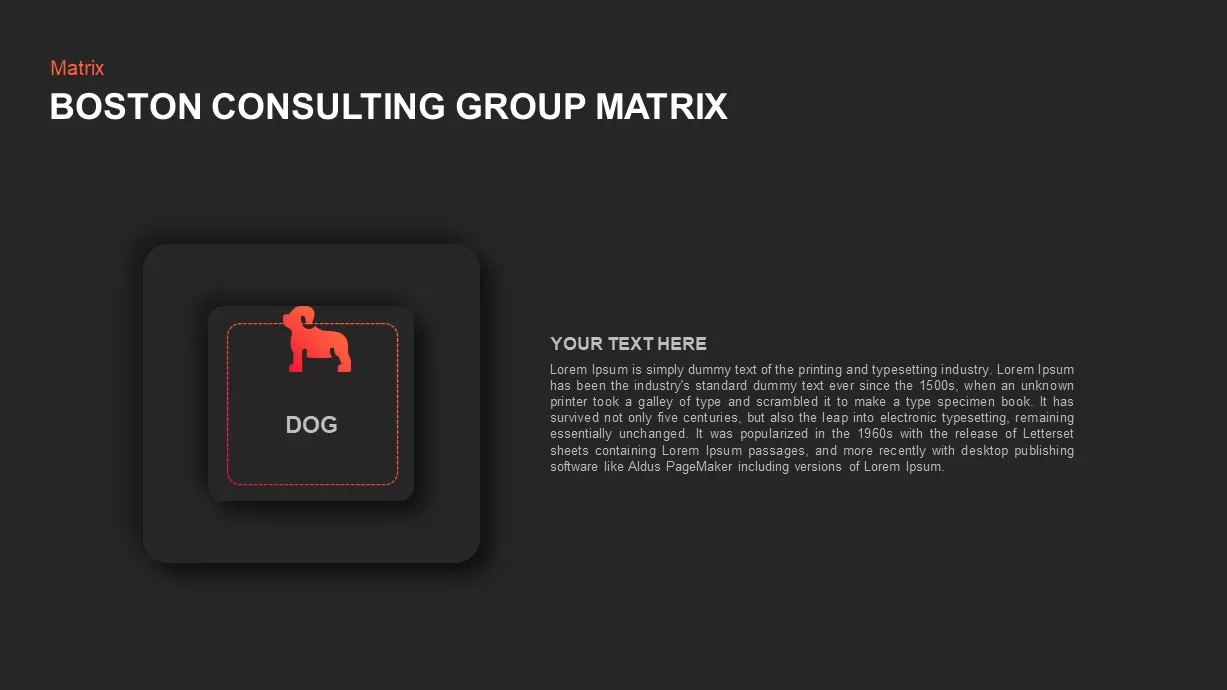
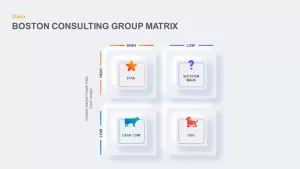
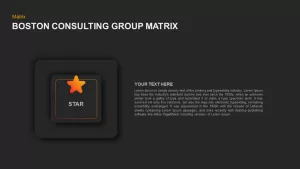
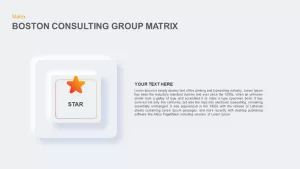
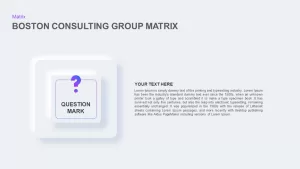
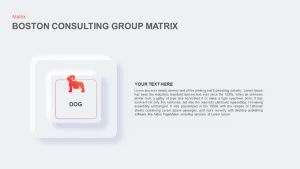
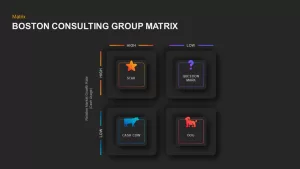
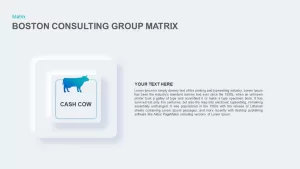
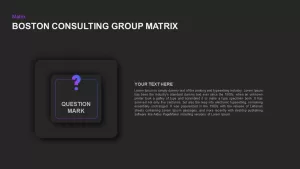
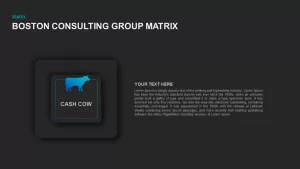
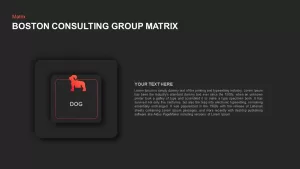
Leveraging dynamic yet minimalist design, this Boston Consulting Group (BCG) matrix slide empowers presenters to organize product portfolios or business units across four strategic quadrants: Stars, Cash Cows, Question Marks, and Dogs. Each quadrant is showcased within a softly raised white card frame, featuring a distinctive icon—an orange star for high-growth leaders, a purple question mark for uncertain prospects, a cyan cow for steady earners, and a red dog for underperformers. The high-contrast colored lines along the matrix axes clearly label “High” and “Low” for both market growth rate and relative market share, guiding audience focus and decision-making. A muted gradient background with subtle drop shadows adds depth without distracting from the content, supporting both PowerPoint and Google Slides flawlessly.
This fully editable template includes master slides, vector icons, and text placeholders for succinct quadrant titles and explanatory notes. Swap colors to align with your brand palette, adjust iconography, or resize the quadrant cards to emphasize key offerings. The layout’s modular structure ensures consistent alignment and spacing across your deck, eliminating common formatting challenges during collaborative editing. Sequential reveal animations are preconfigured, enabling you to introduce each quadrant one by one and facilitate interactive discussions during strategic planning sessions.
Ideal for portfolio analysis, resource allocation reviews, or executive presentations, this BCG matrix template streamlines complex data into an intuitive visual framework. Use it to compare product performance, assess investment priorities, or illustrate market positioning. The clean design and clear labeling guarantee that stakeholders immediately grasp performance differentials and strategic implications. Compatible with remote and on-site presentations, this slide enhances engagement and clarity in board meetings, investor pitches, and team workshops.
Who is it for
Product managers, brand strategists, and C-level executives will find this matrix invaluable for visualizing portfolio performance and prioritizing investments. Consultants, market analysts, and MBA students can leverage the slide to present case studies, strategy recommendations, or academic projects.
Other Uses
Beyond portfolio reviews, repurpose the matrix to map competitive landscapes, risk assessments, customer segmentation, or resource distribution. Use the four-quadrant format to showcase performance metrics, pricing strategies, or organizational health indicators. Duplicate and recolor quadrants to support workshop exercises, training modules, or stakeholder alignment activities.
Login to download this file

Item ID
SB01839
Related Templates

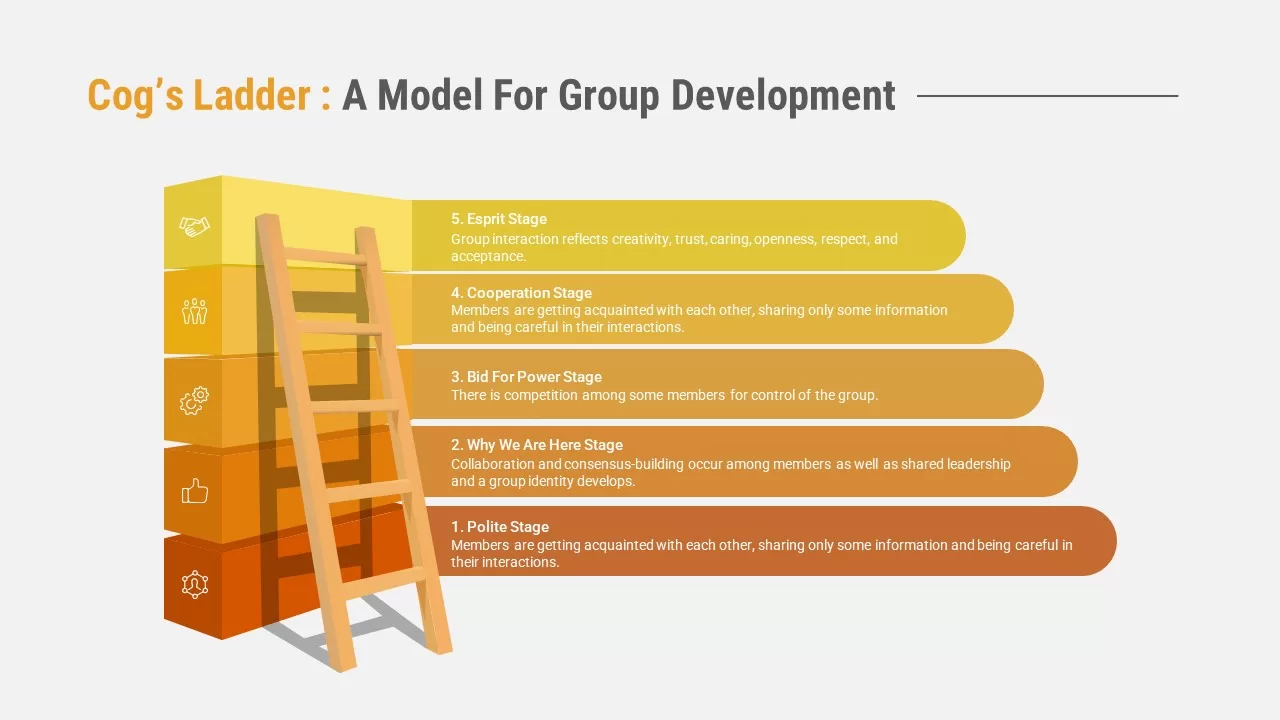
Cog’s Ladder Model for Group Development PowerPoint & Google Slides Template
Leadership
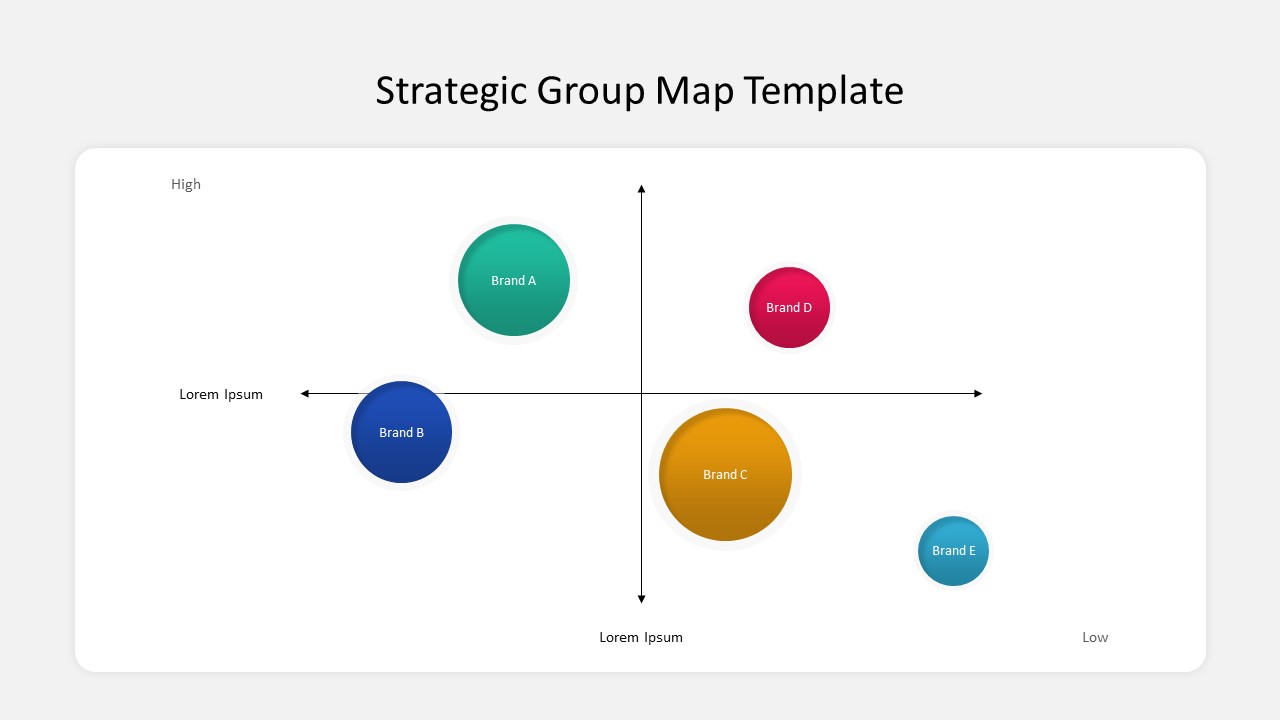
Free Strategic Group Map Template
Competitor Analysis
Free
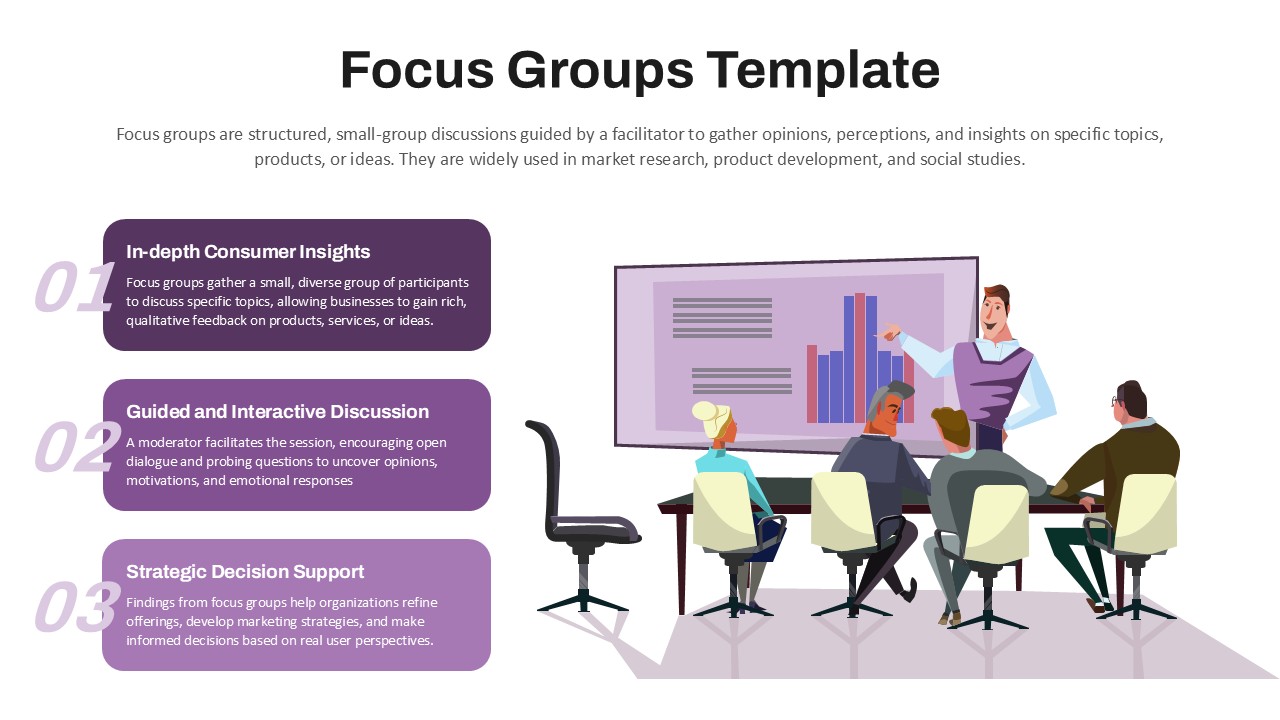
Focus Group Discussion and Insights Template for PowerPoint & Google Slides
Customer Experience

Ansoff Growth Matrix Strategy Diagram Template for PowerPoint & Google Slides
Business Strategy
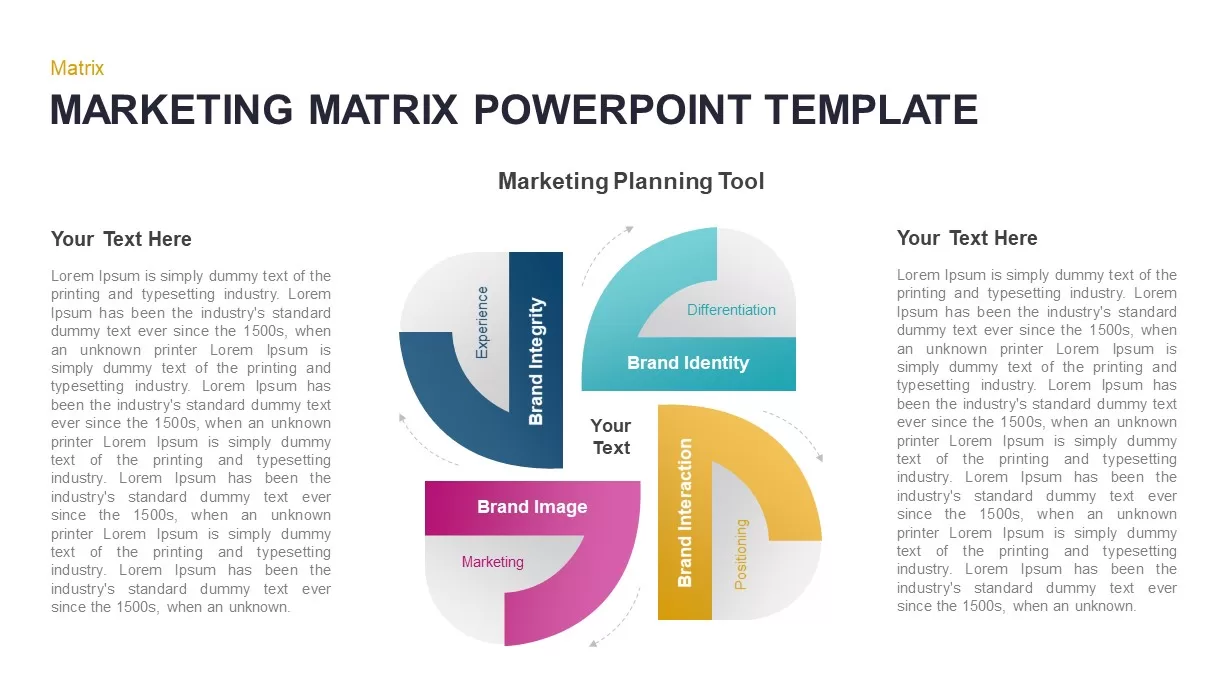
Marketing Matrix Brand Quadrant Diagram Template for PowerPoint & Google Slides
Process
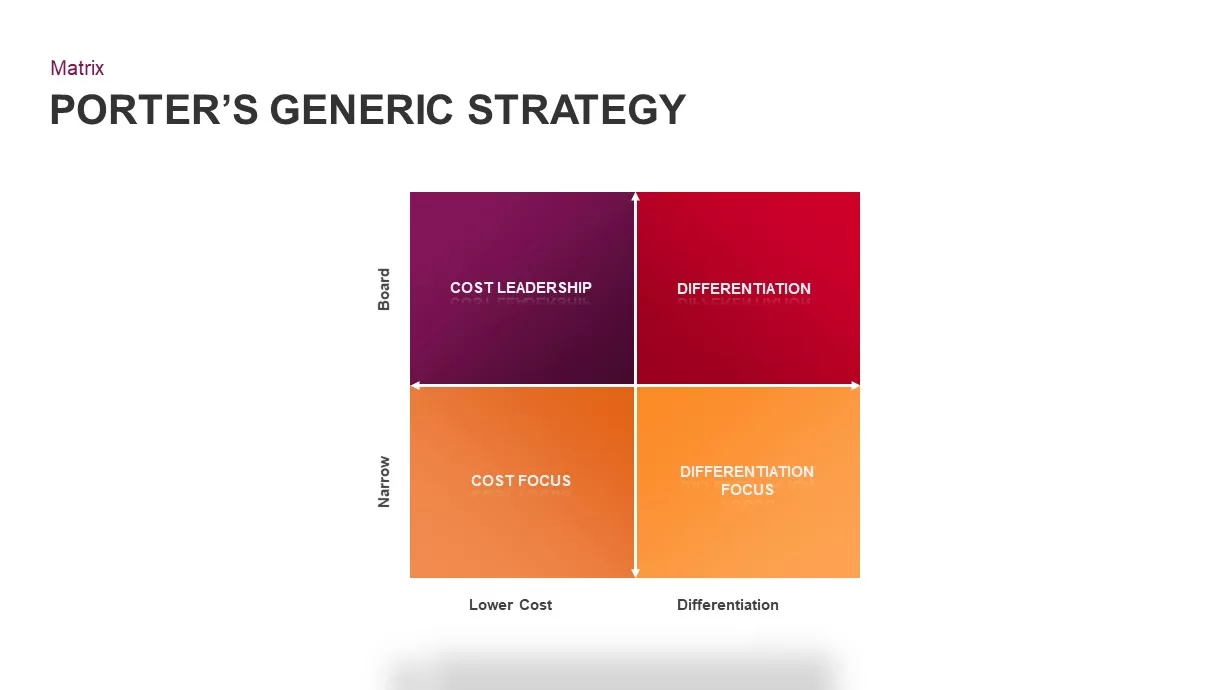
Porter’s Generic Strategy Matrix Diagram Template for PowerPoint & Google Slides
Competitor Analysis
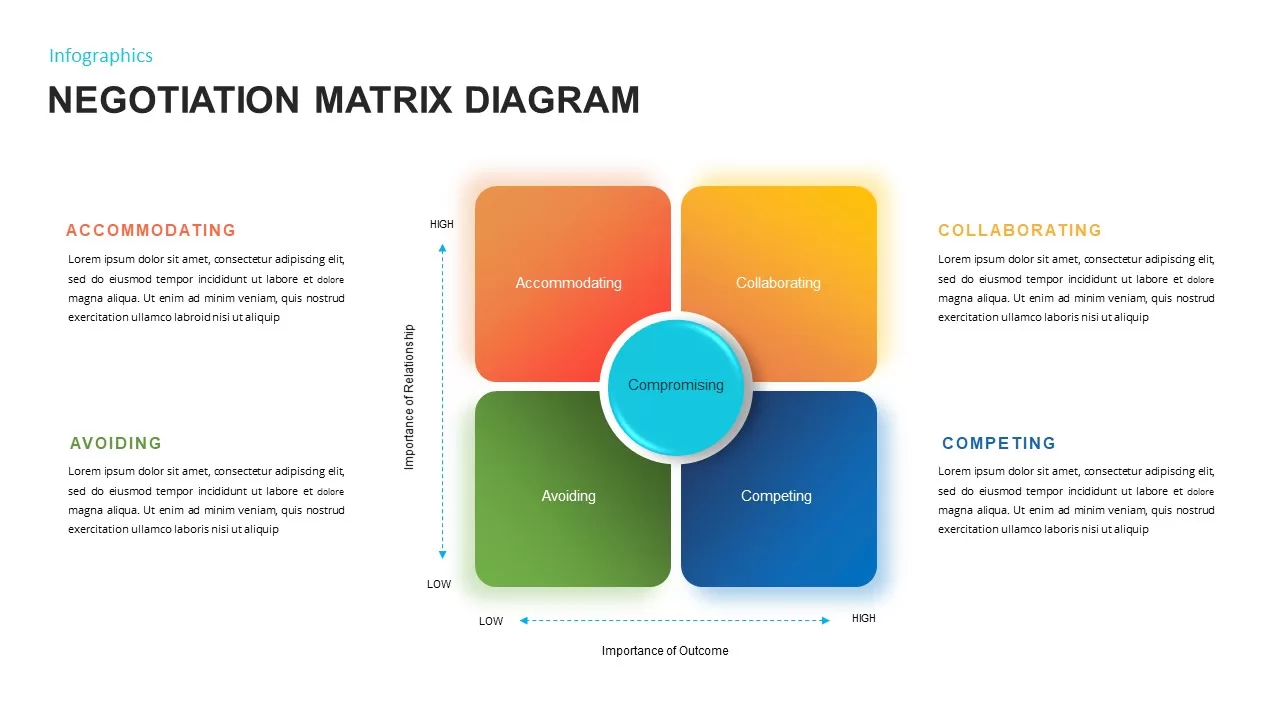
Negotiation Matrix Diagram Template for PowerPoint & Google Slides
Business
Bubble Chart Scatter, Diagram & Matrix Template for PowerPoint & Google Slides
Comparison Chart
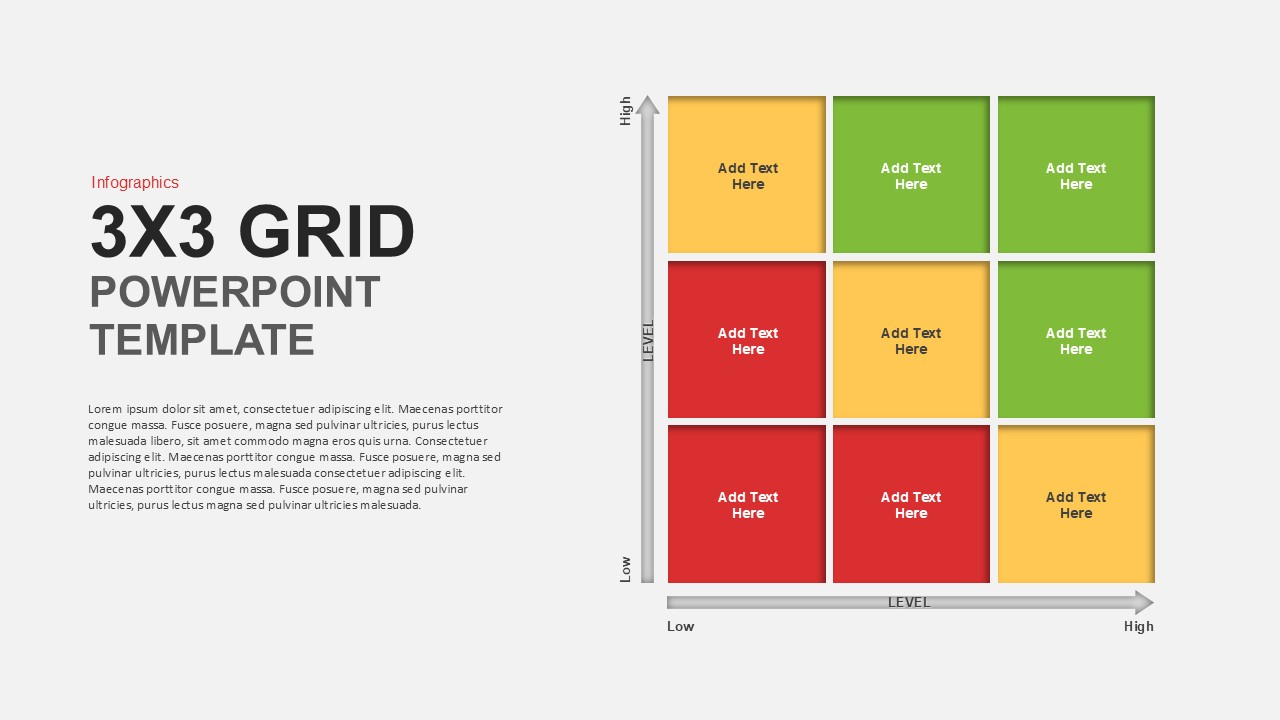
Matrix Grid Diagram Template for PowerPoint & Google Slides
Comparison
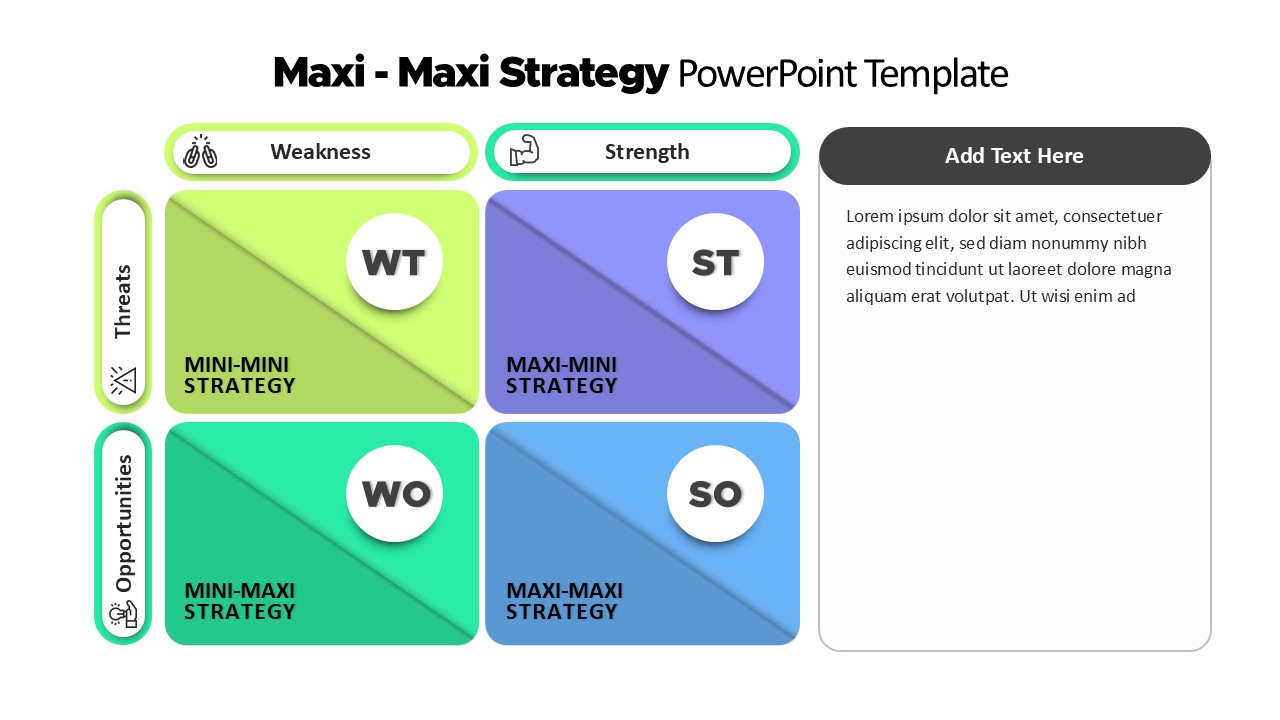
Maxi-Maxi Strategy Matrix SWOT Diagram Template for PowerPoint & Google Slides
SWOT
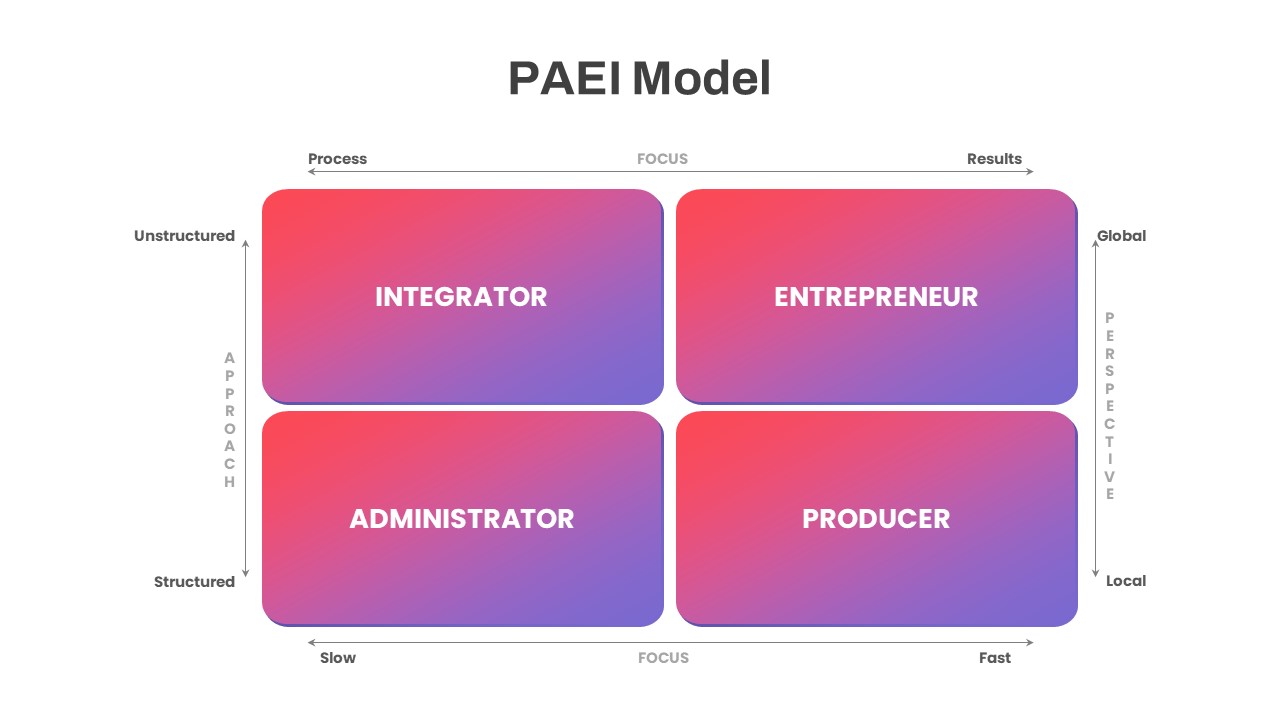
PAEI Leadership Roles 2×2 Matrix Diagram Template for PowerPoint & Google Slides
Business Models
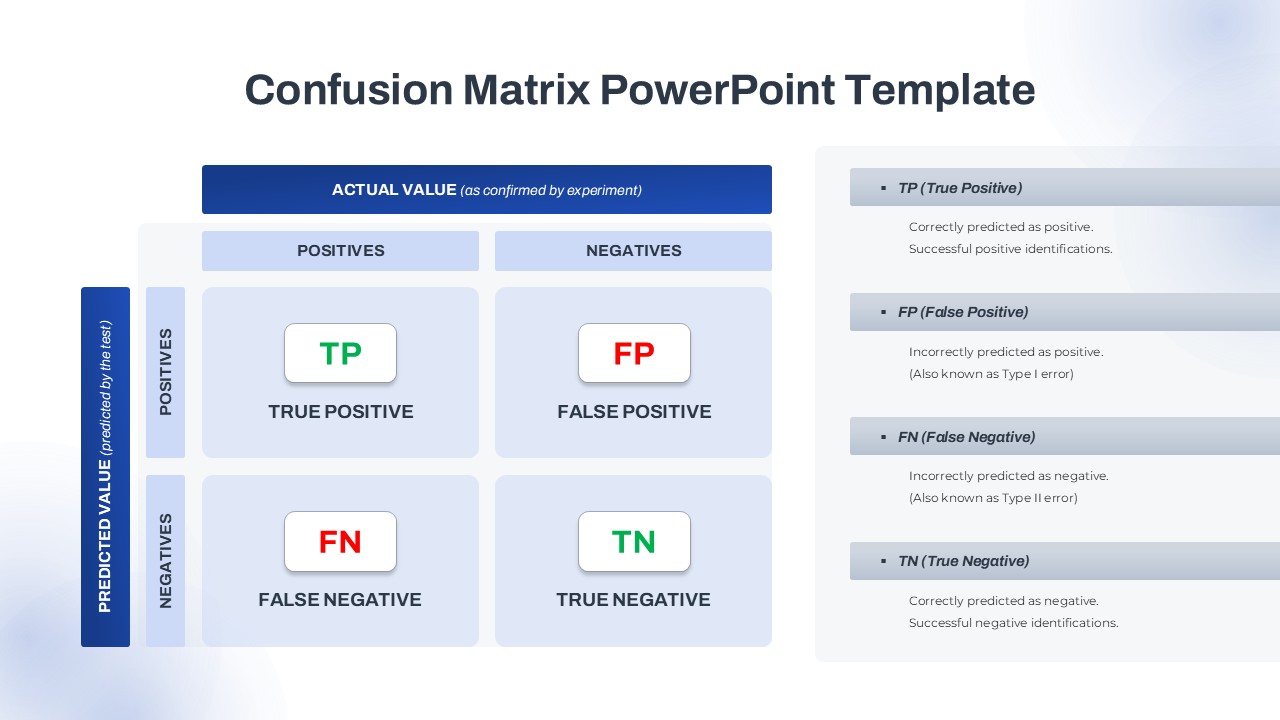
Confusion Matrix Diagram Overview Template for PowerPoint & Google Slides
Comparison
Materiality Assessment Matrix Diagram Template for PowerPoint & Google Slides
Risk Management
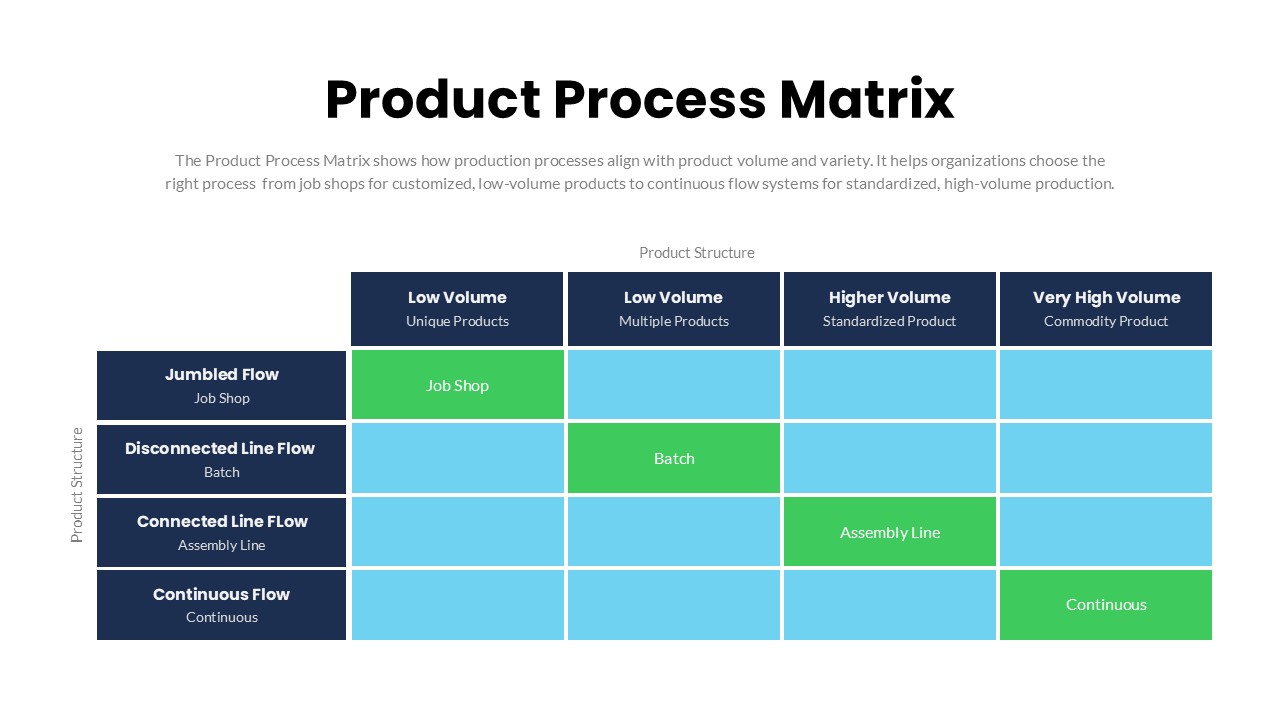
Product Process Matrix Diagram Template for PowerPoint & Google Slides
Business Strategy
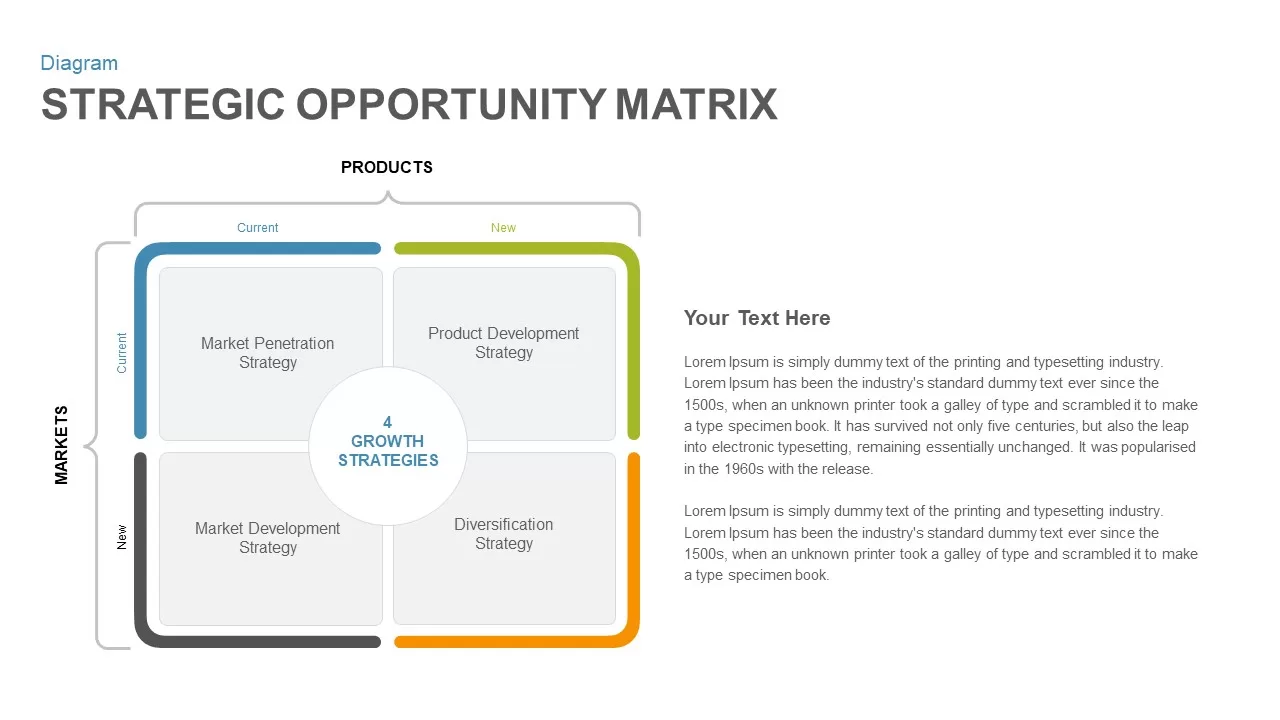
Strategic Opportunity Matrix Diagram for PowerPoint & Google Slides
Business Strategy
Innovation Ambition Matrix & Funnel Strategy Slides for PowerPoint & Google Slides
Process
Consulting Proposal Animated Presentation Template for PowerPoint & Google Slides
Business Proposal

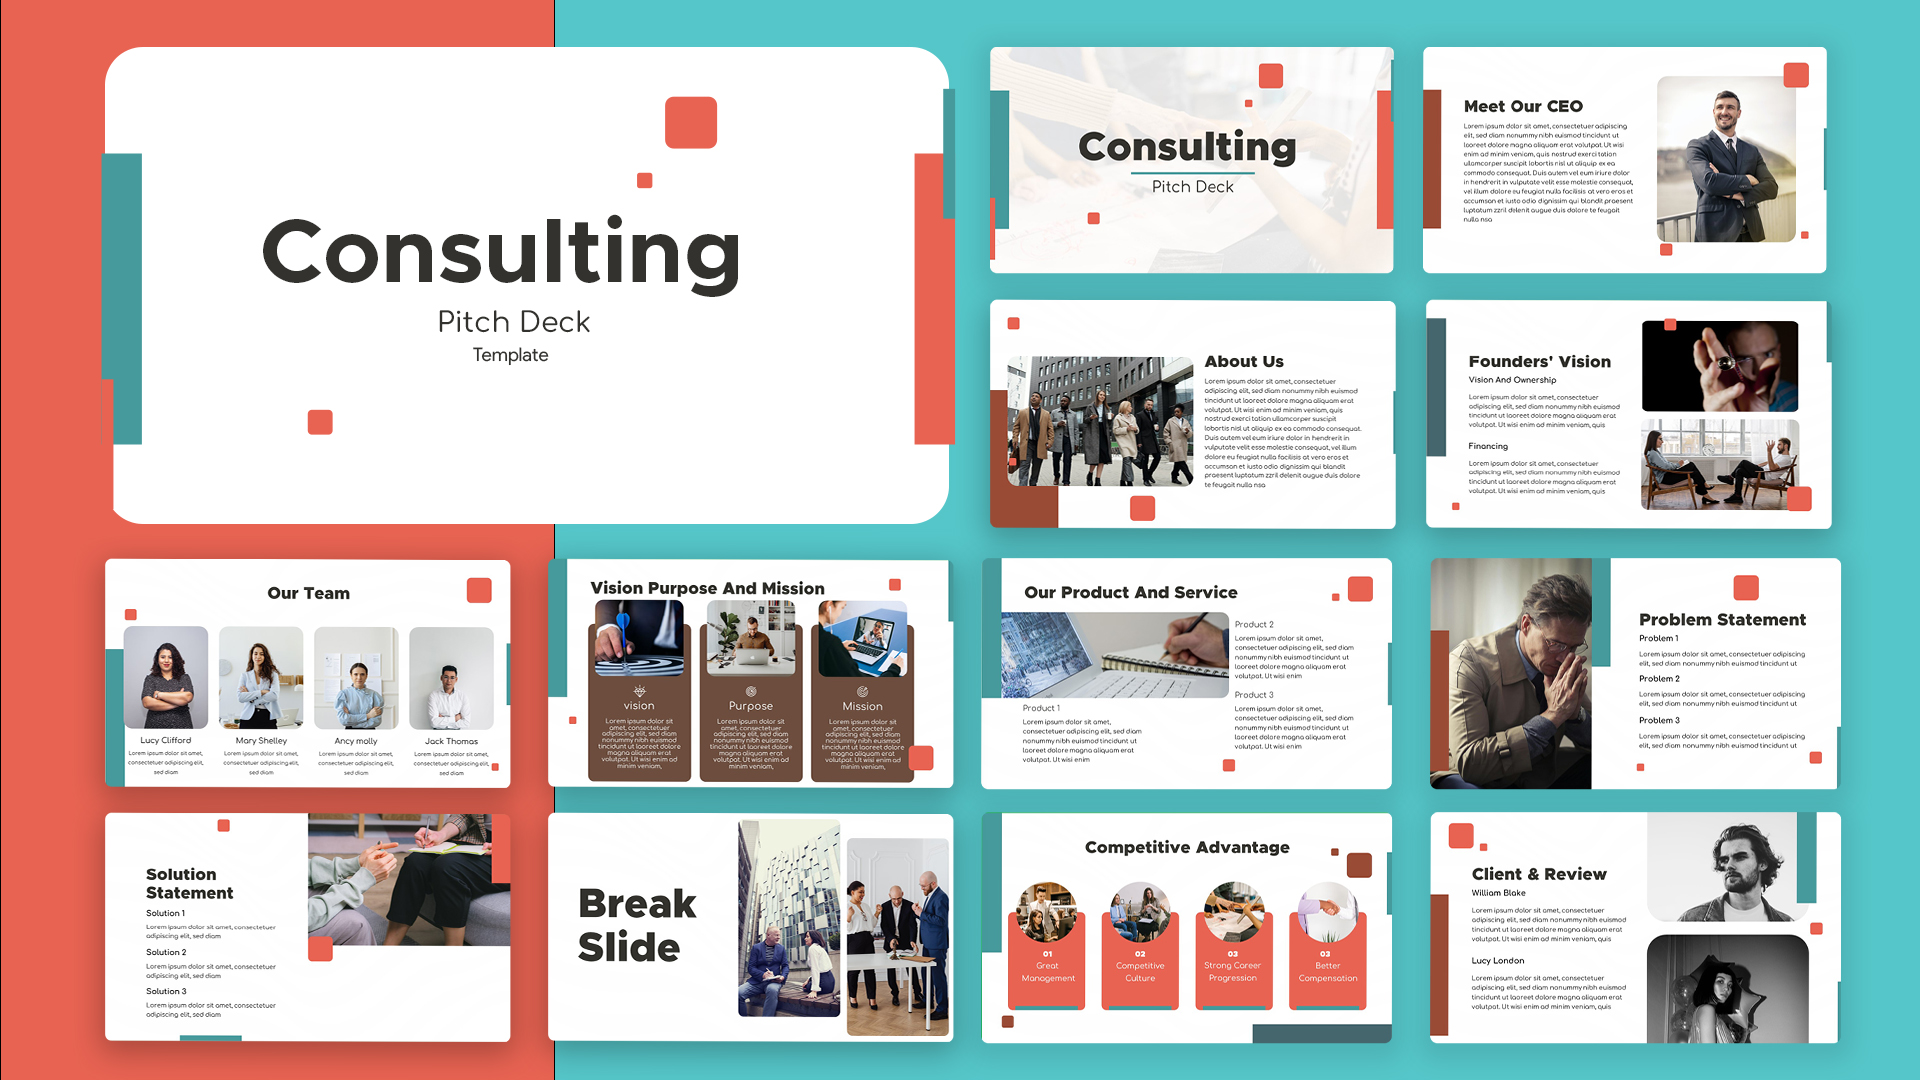
Professional Consulting Deck Presentation Template for PowerPoint & Google Slides
Pitch Deck
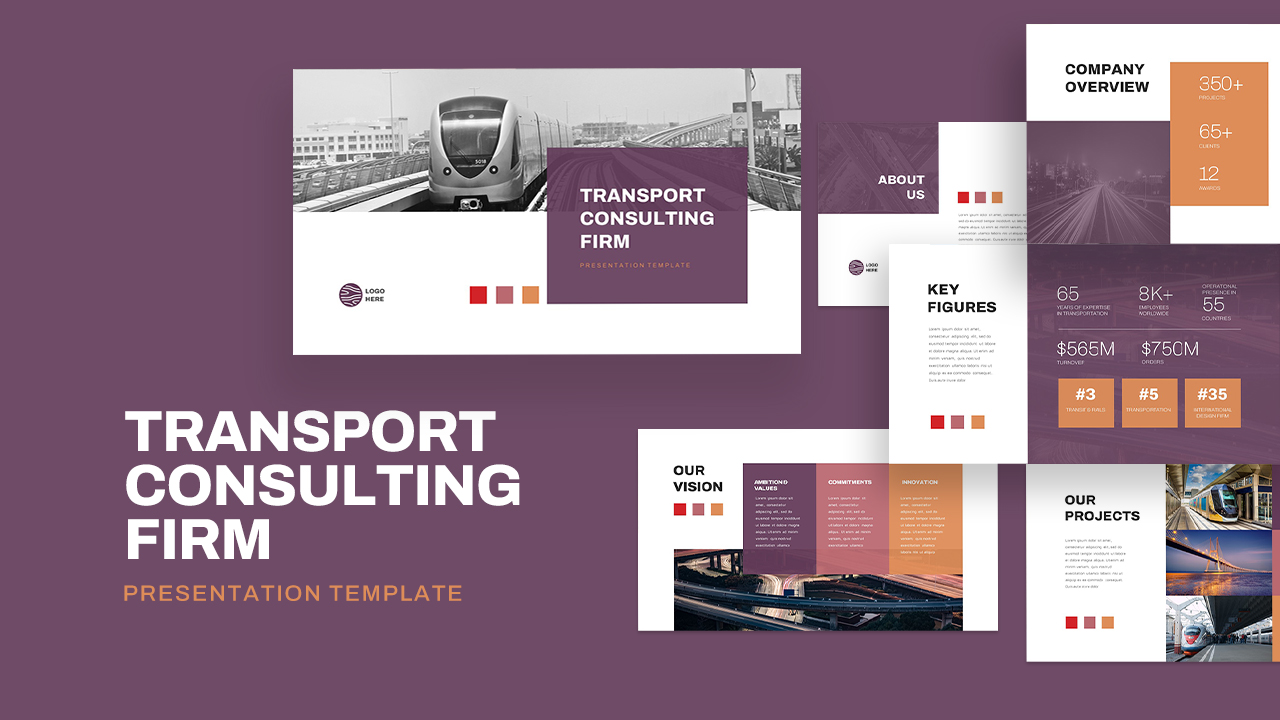
Transport Consulting Firm Presentation Template for PowerPoint & Google Slides
Company Profile
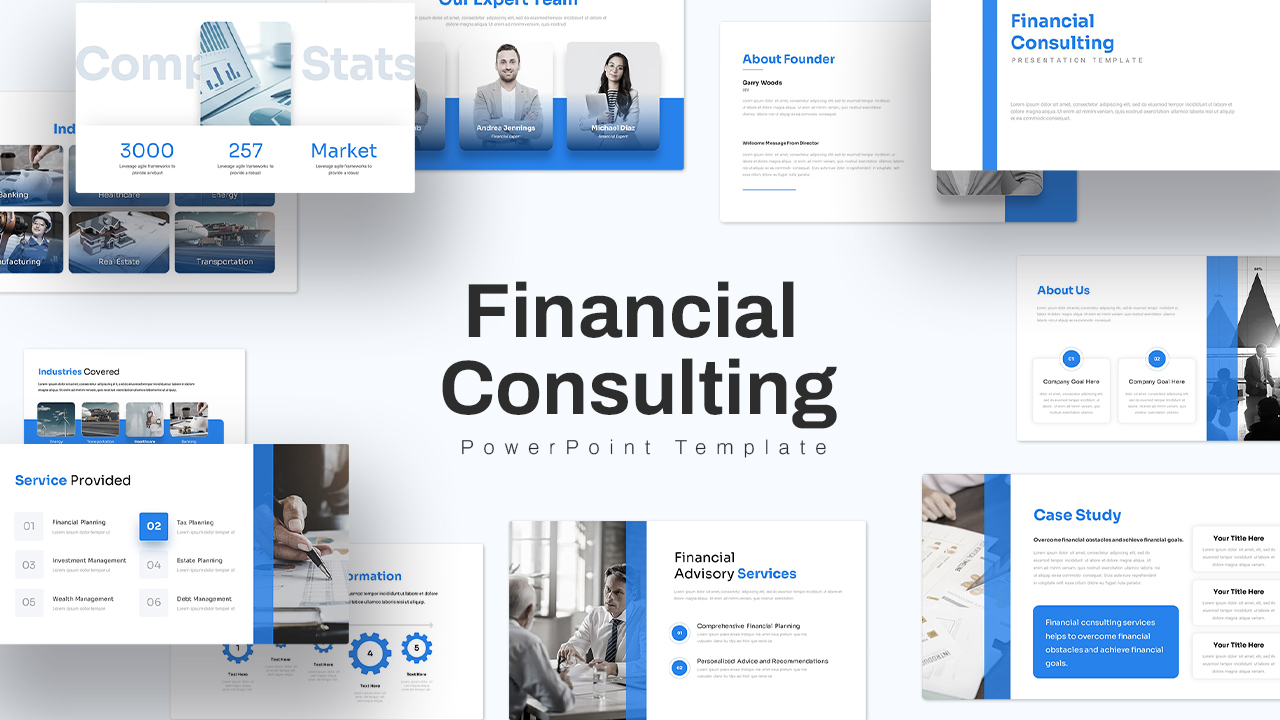
Financial Consulting Company Profile Template for PowerPoint & Google Slides
Finance
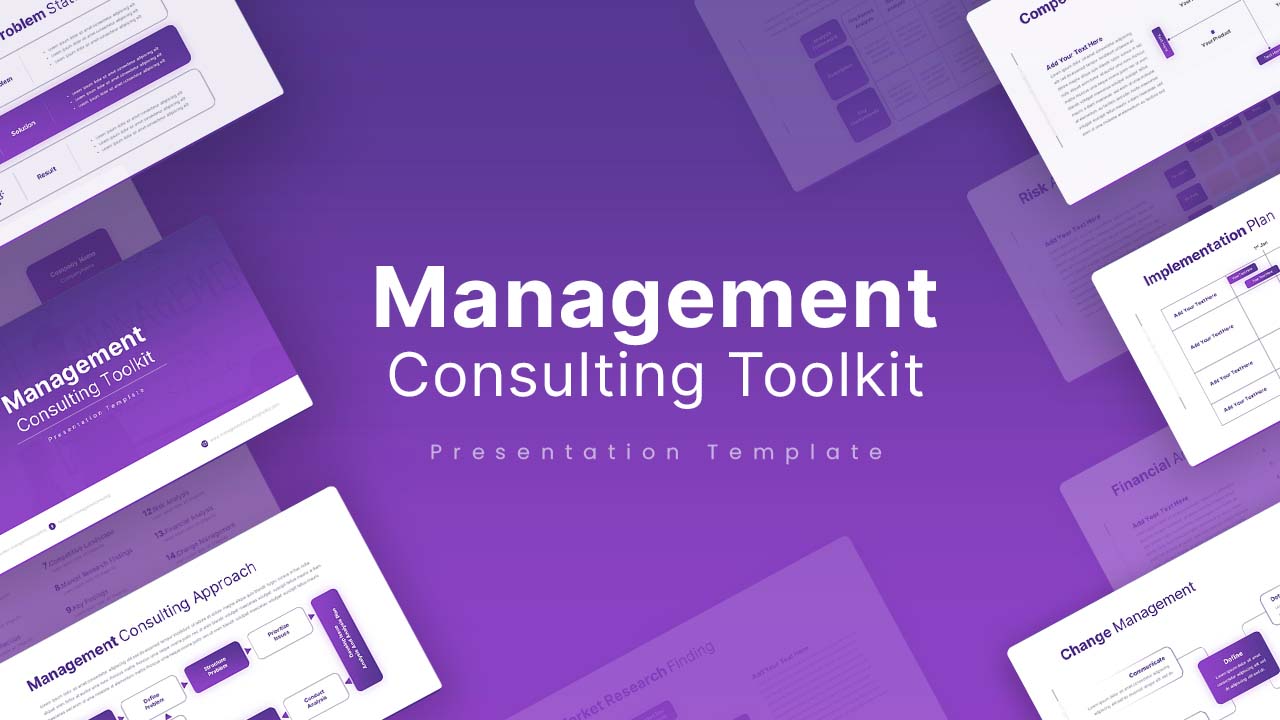
Management Consulting Toolkit Template for PowerPoint & Google Slides
Decks
Consulting Sales Presentation Pitch Deck Template for PowerPoint & Google Slides
Pitch Deck
Consulting Proposal Presentation Deck Template for PowerPoint & Google Slides
Pitch Deck

BCG Corporate Consulting Presentation Template for PowerPoint & Google Slides
Pitch Deck
Modern Corporate Consulting Theme Template for PowerPoint & Google Slides
Company Profile
Medical Consulting Presentation Template for PowerPoint & Google Slides
Health
Corporate Human Resource Consulting Template for PowerPoint & Google Slides
HR
Modern Tax Consulting Slide Deck Template for PowerPoint & Google Slides
Finance
Software Consulting Presentation Template for PowerPoint & Google Slides
Company Profile
Risk Management Consulting Deck Template for PowerPoint & Google Slides
Risk Management

Change Management Consulting template for PowerPoint & Google Slides
Company Profile
Strategic Planning Consulting Template for PowerPoint & Google Slides
Business Strategy
Digital Transformation Consulting Overview Template for PowerPoint & Google Slides
Information Technology
Consulting Overview & Capabilities Template for PowerPoint & Google Slides
Consulting
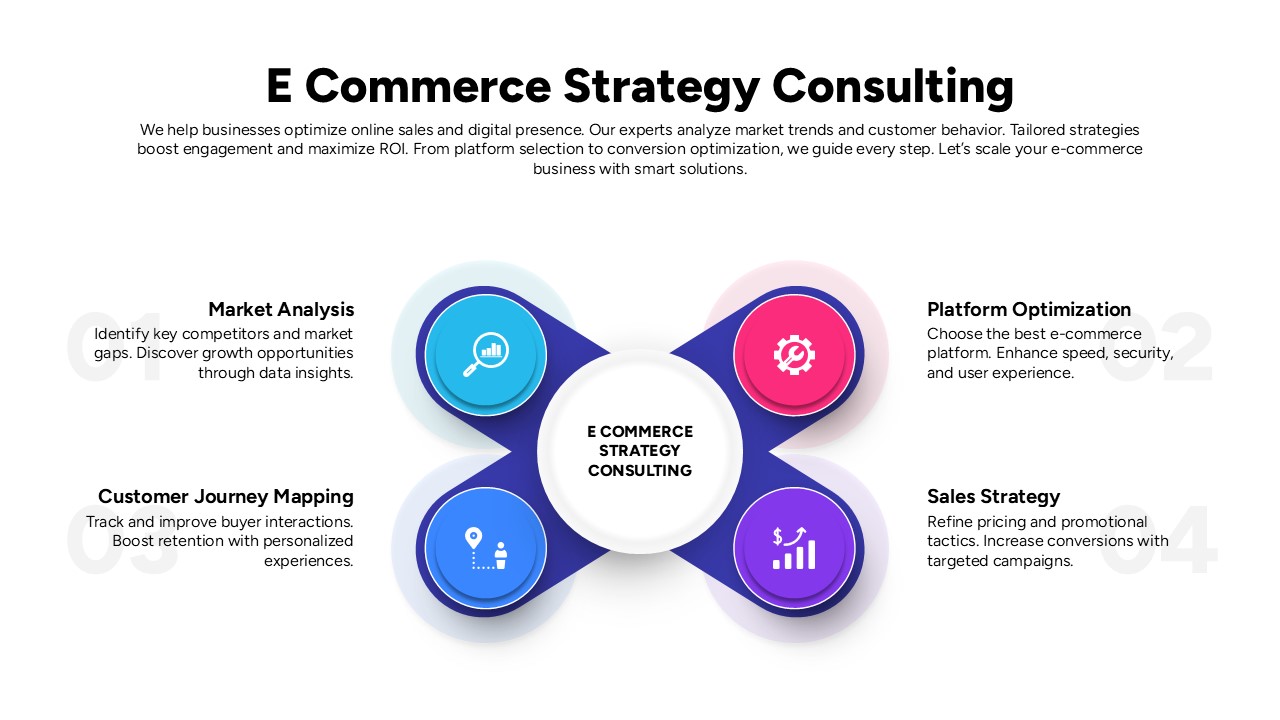
E-commerce Strategy Consulting Template for PowerPoint & Google Slides
Digital Marketing
HR Consulting Template for PowerPoint & Google Slides
Pitch Deck
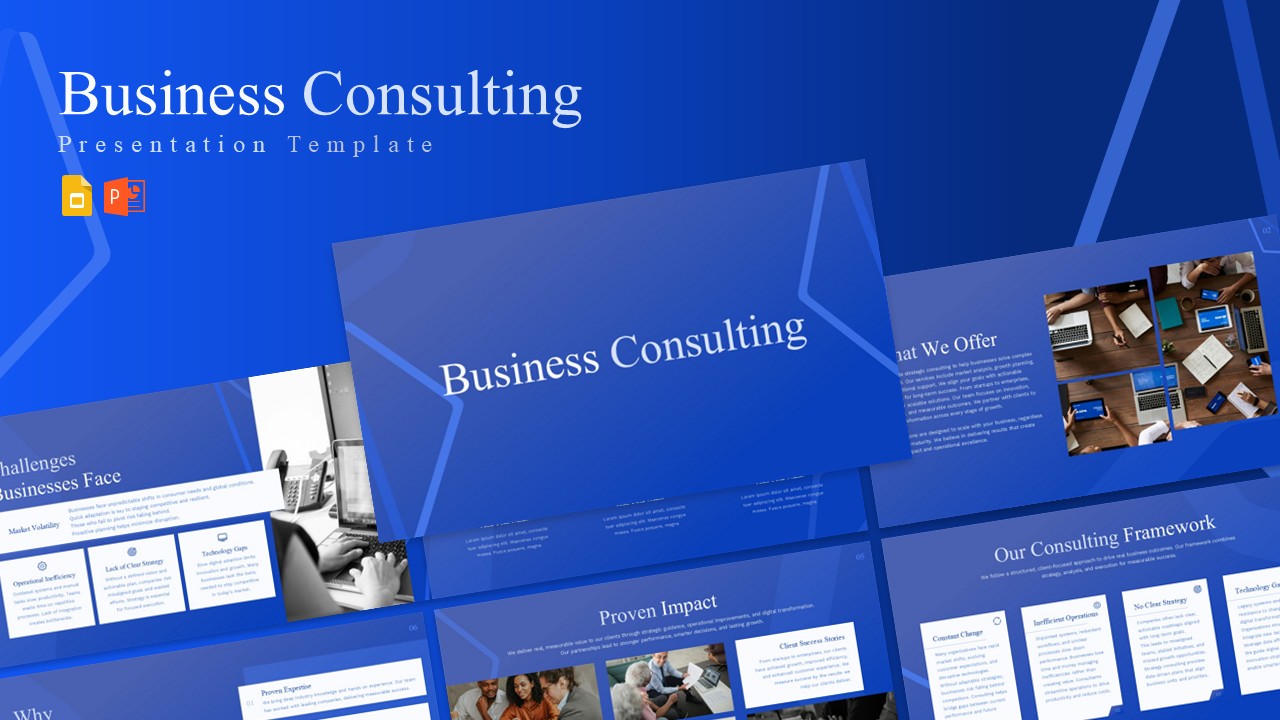
Business Consulting Company Profile Template for PowerPoint & Google Slides
Consulting
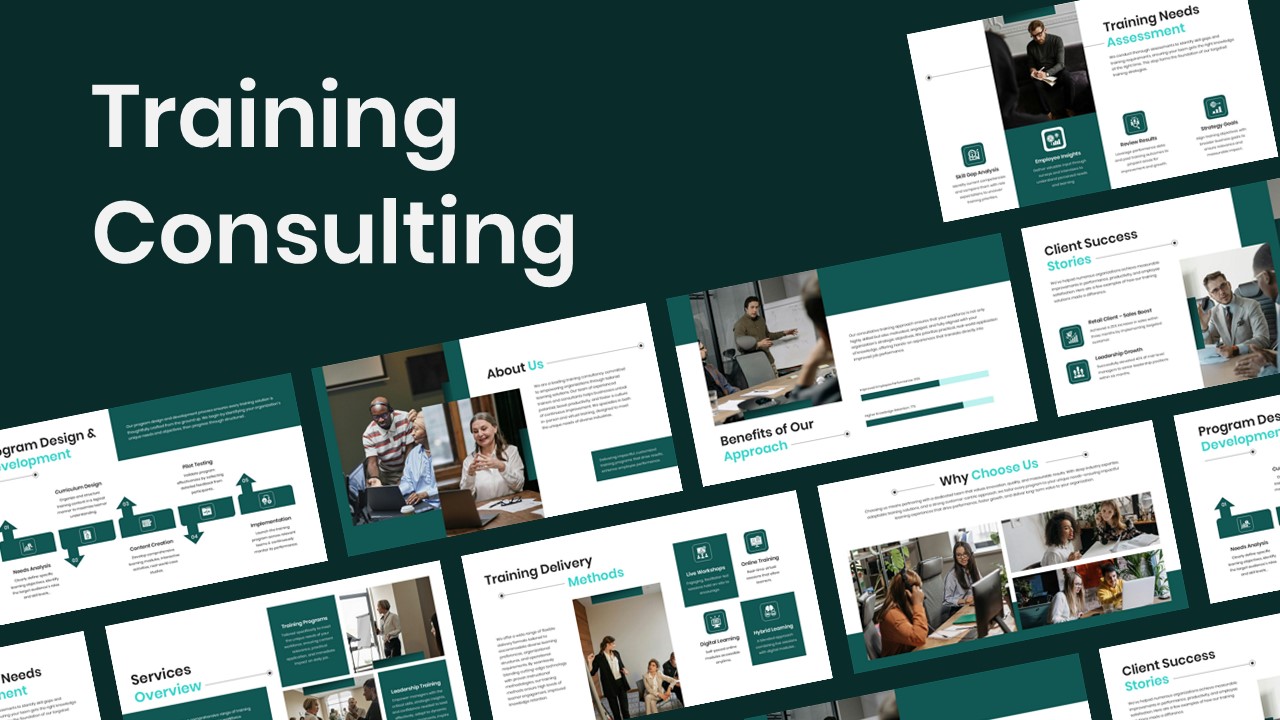
Training Consulting Company Profile Template for PowerPoint & Google Slides
Company Profile
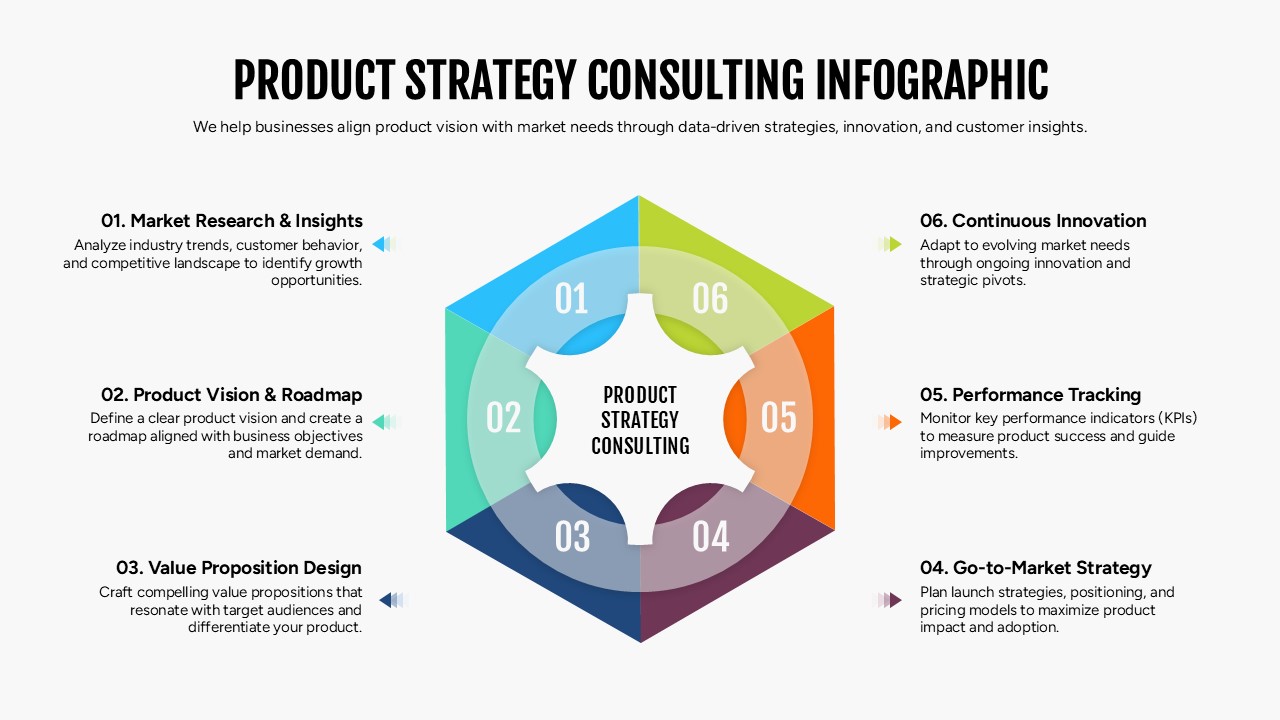
Product Strategy Consulting Infographic Template for PowerPoint & Google Slides
Consulting
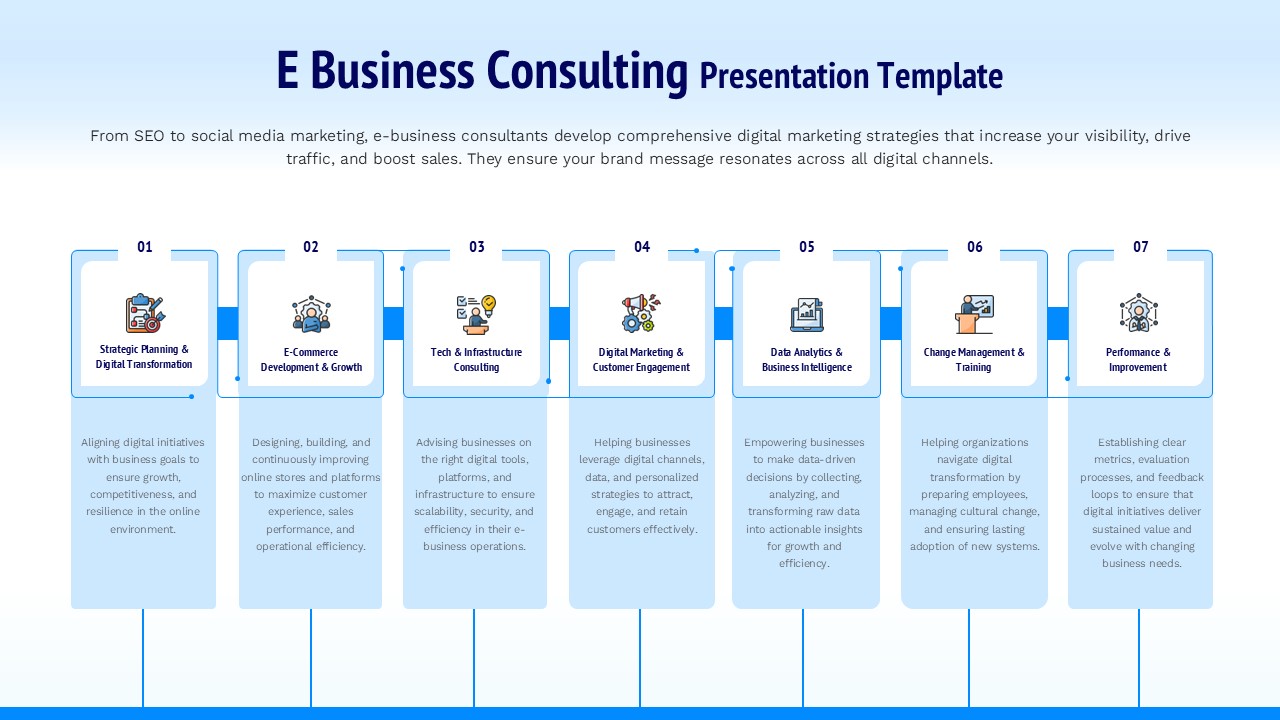
E Business Consulting Service Framework Template for PowerPoint & Google Slides
Business Strategy
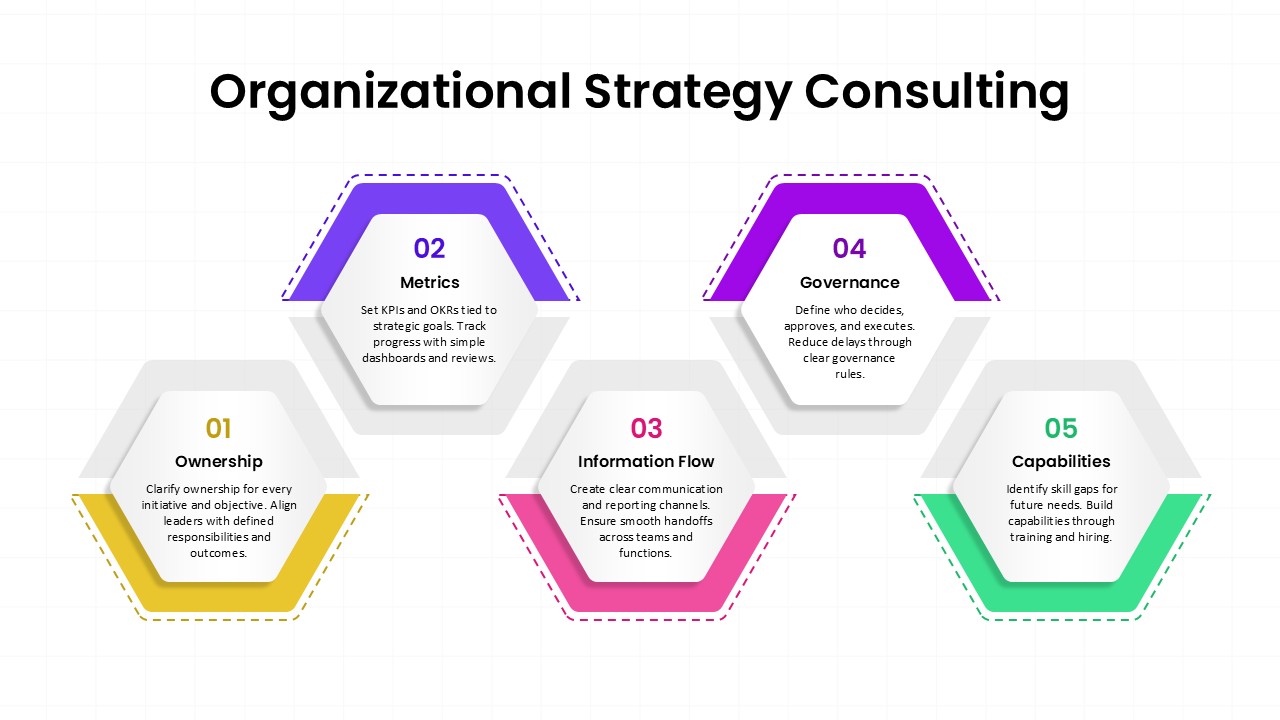
Organizational Strategy Consulting Framework Template for PowerPoint & Google Slides
Consulting
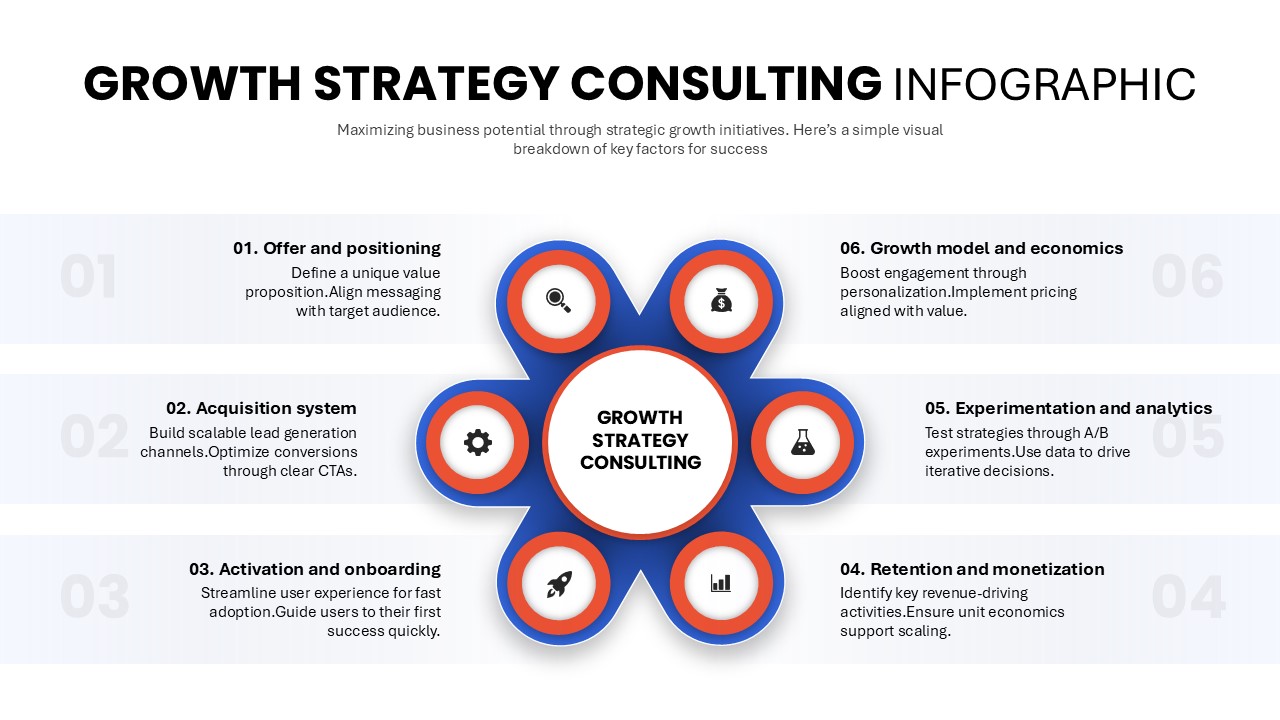
Growth Strategy Consulting Infographic Template for PowerPoint & Google Slides
Process
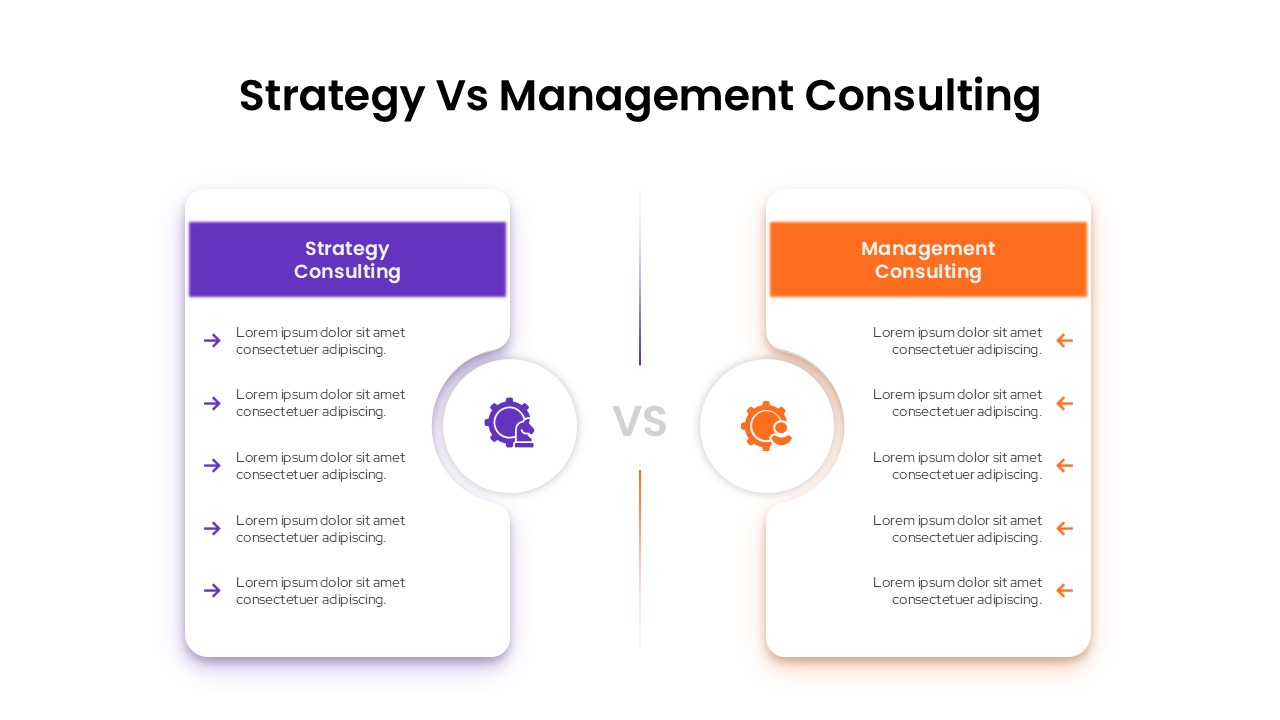
Strategy Vs Management Consulting Template for PowerPoint & Google Slides
Comparison
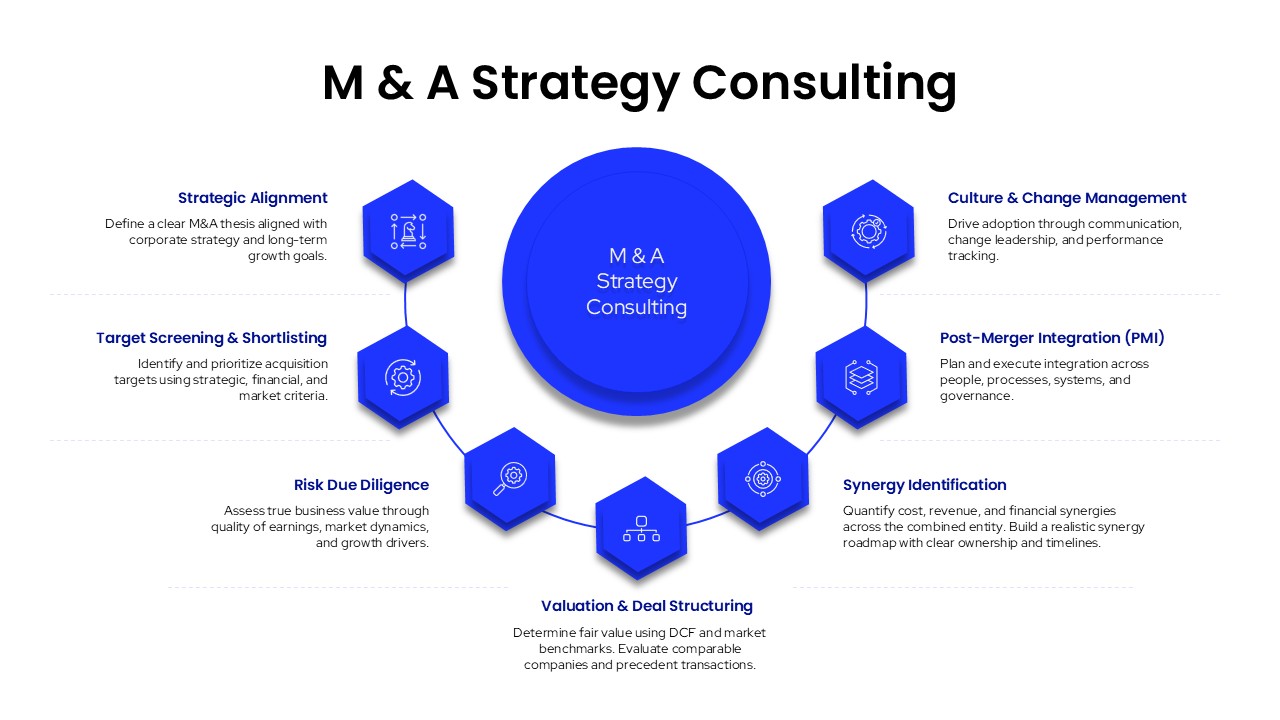
M&A Strategy Consulting Template for PowerPoint & Google Slides
Business Strategy
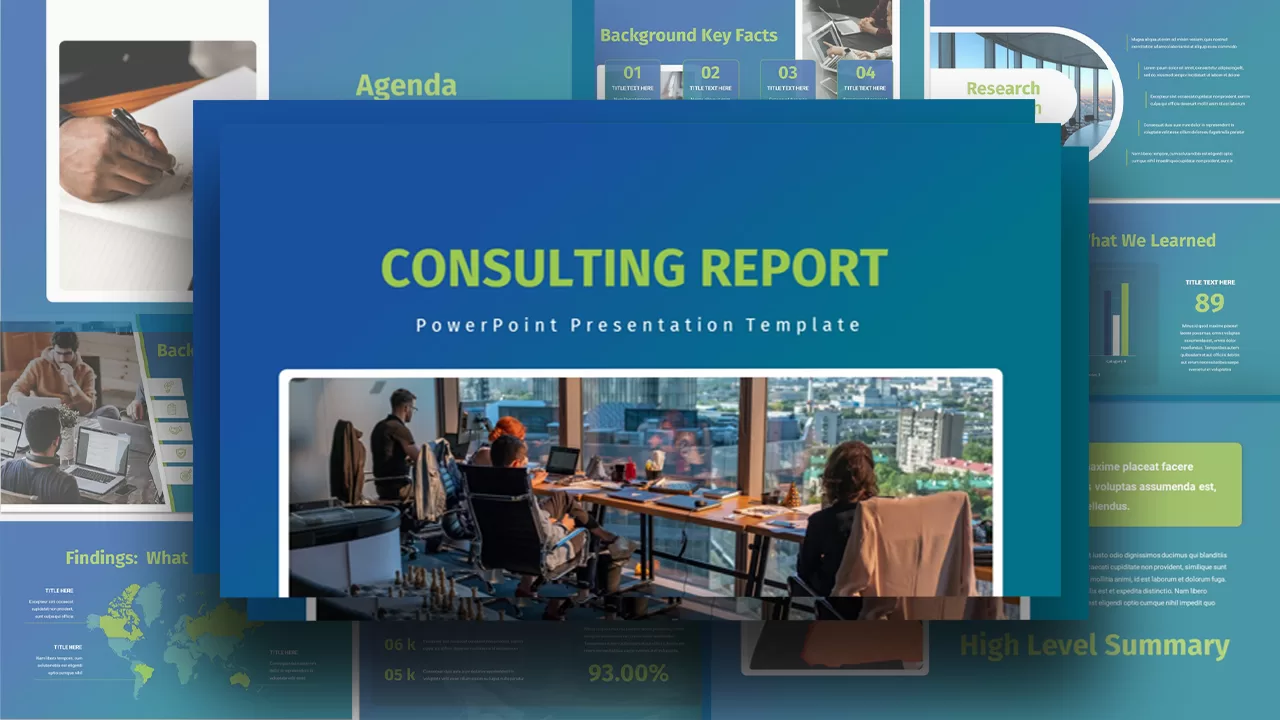
Consulting Report for PowerPoint & Google Slides
Business
Insurance Consulting Presentation Deck for PowerPoint & Google Slides
Decks
Consulting Pitch Deck Design for PowerPoint & Google Slides
Pitch Deck
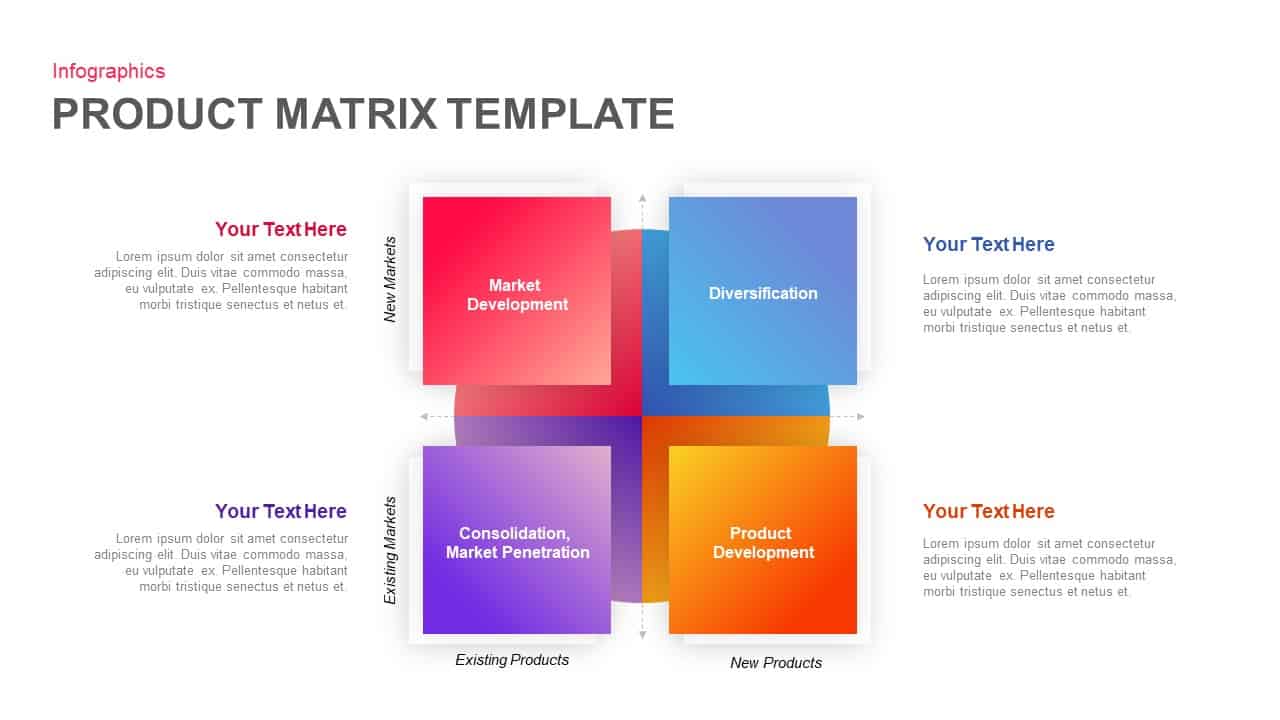
Market Development Matrix Chart Template for PowerPoint & Google Slides
Comparison Chart
Ansoff Matrix Growth Strategy Model Template for PowerPoint & Google Slides
BCG

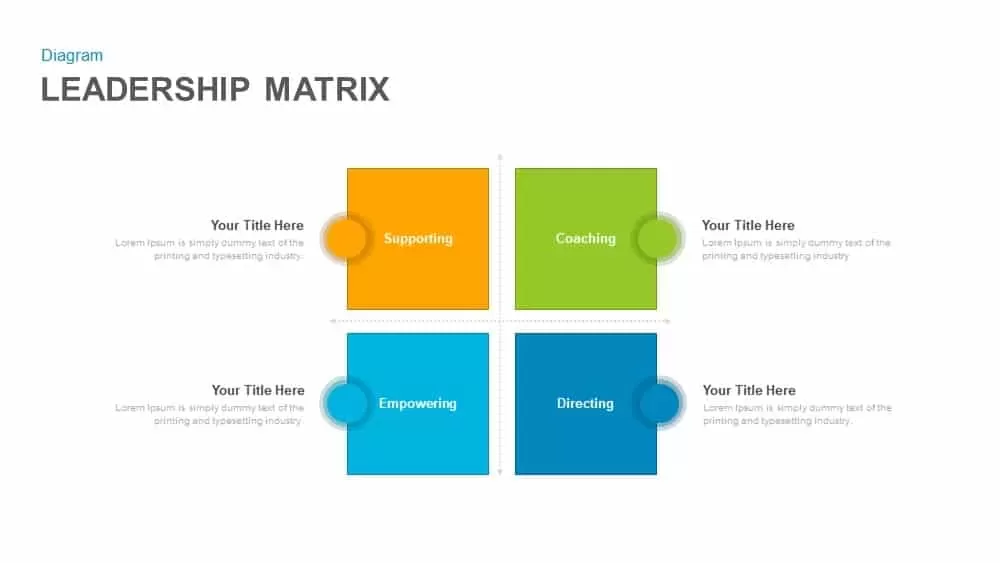
Leadership Matrix with Four Quadrants Template for PowerPoint & Google Slides
Comparison
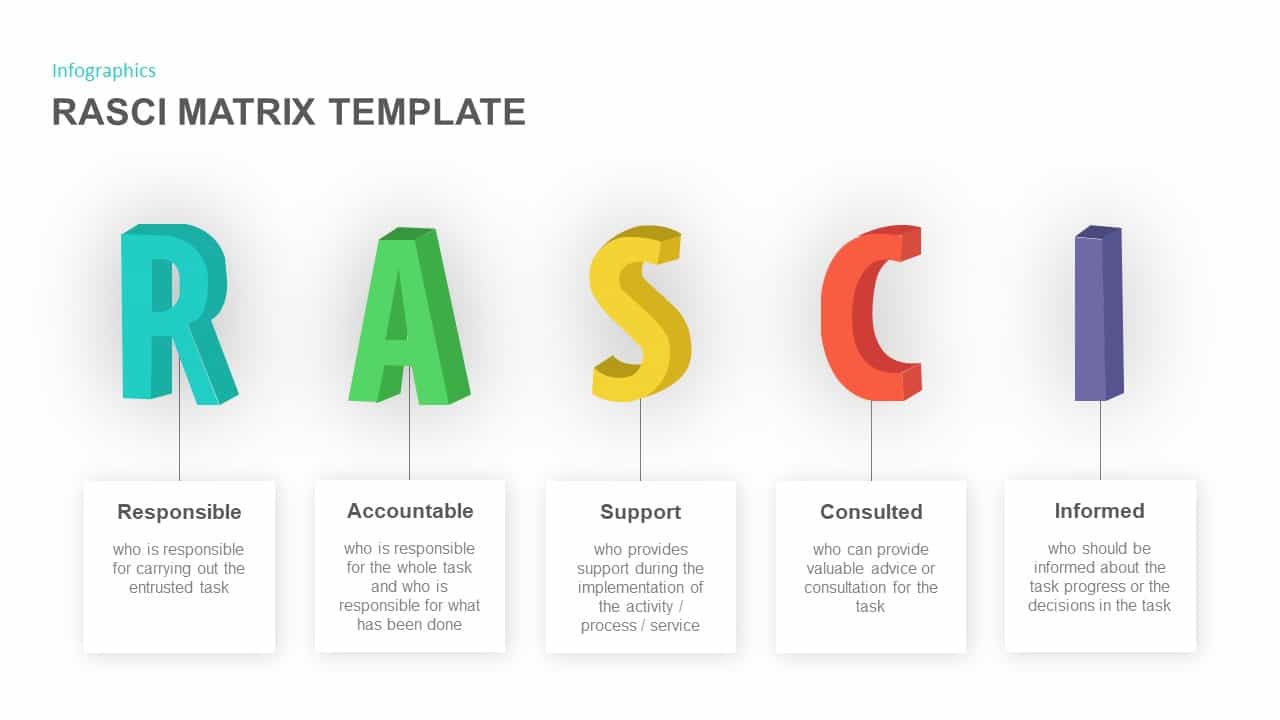
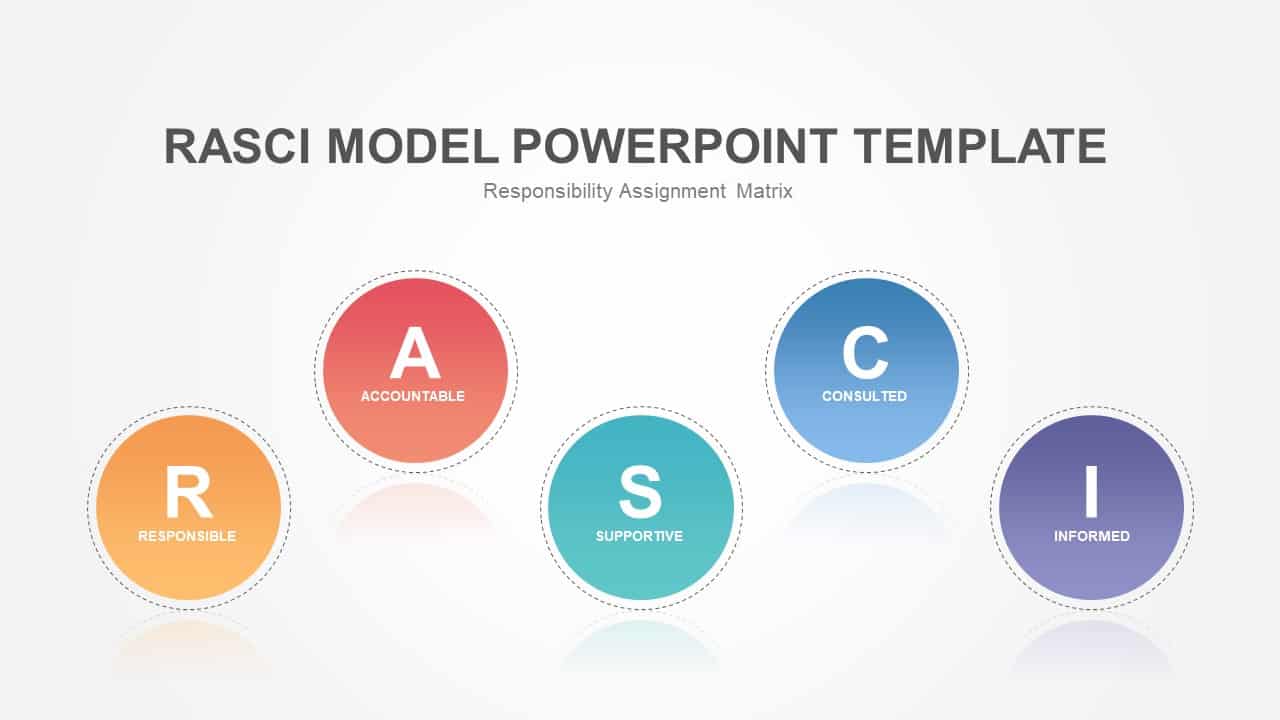
RASCI Assignment Matrix Infographic Template for PowerPoint & Google Slides
Infographics
Product Market Expansion Matrix Template for PowerPoint & Google Slides
Business
RASCI Responsibility Matrix Chart Template for PowerPoint & Google Slides
Business
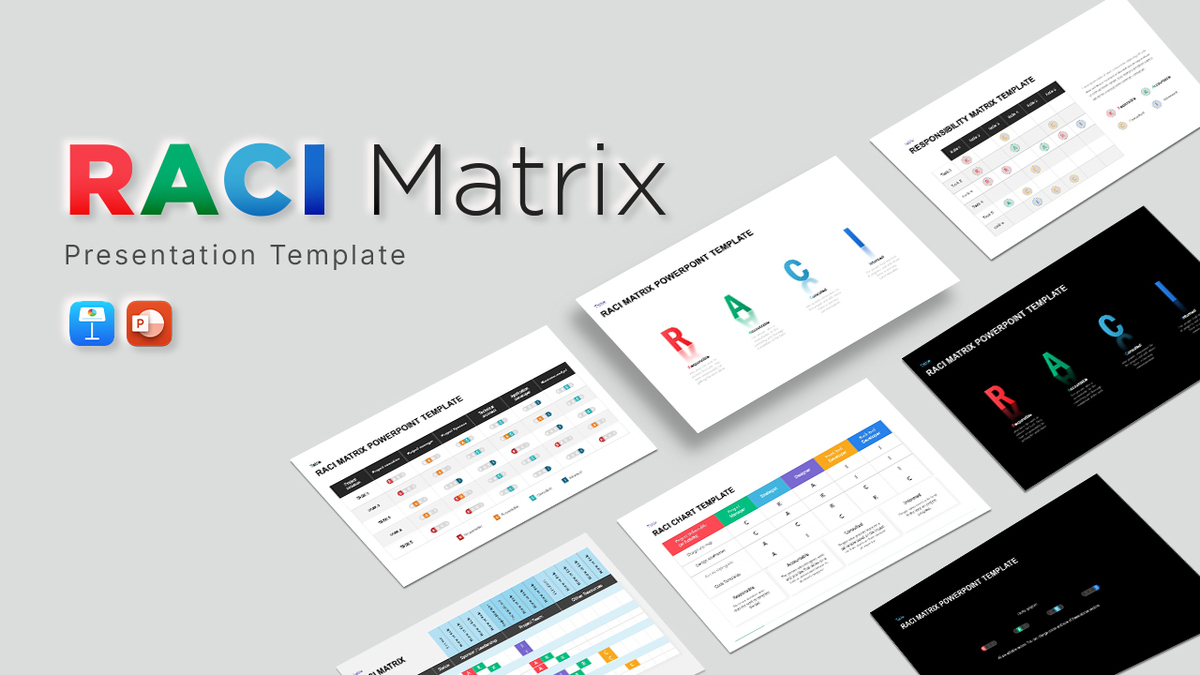
Interactive RACI Responsibility Matrix Template for PowerPoint & Google Slides
Project
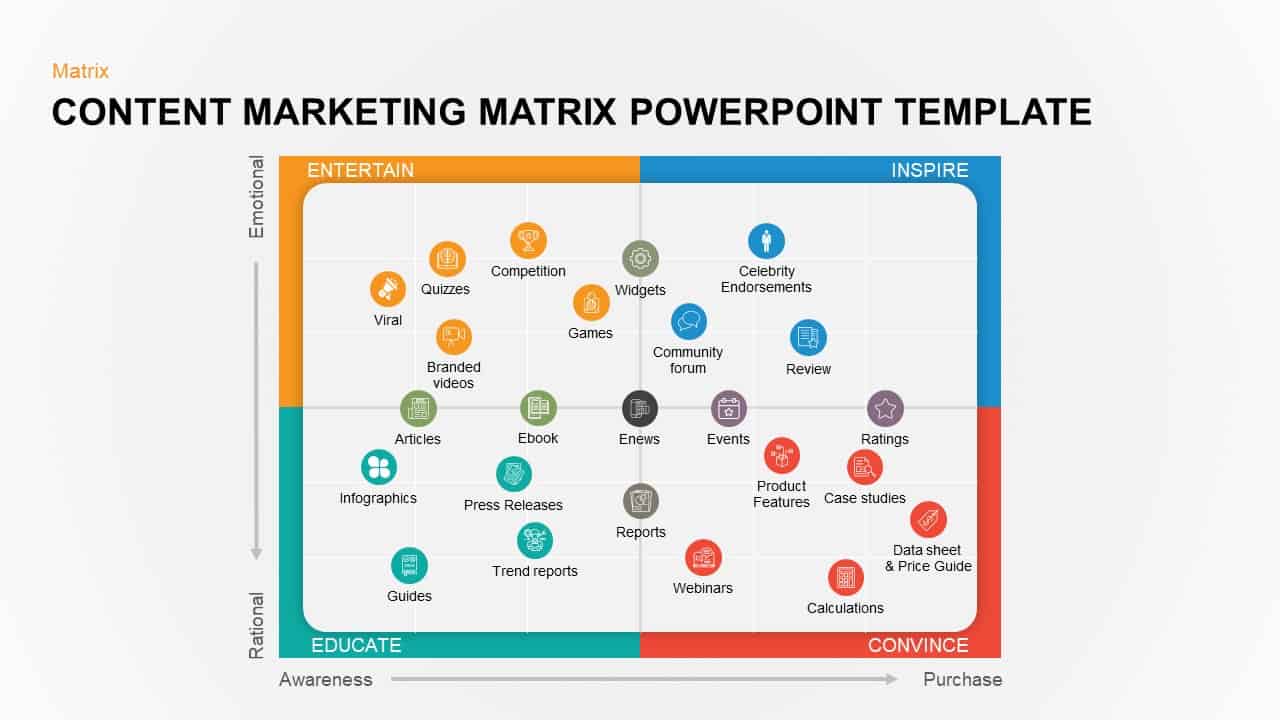
Colorful Content Marketing Matrix Template for PowerPoint & Google Slides
Comparison
3 Year Strategic Plan Template for PowerPoint & Keynote
Timeline
RASCI Responsibility Assignment Matrix Template for PowerPoint & Google Slides
Project
Strategic ADL Matrix by Industry Life Cycle & Position Template for PowerPoint & Google Slides
Business Strategy
Supply Positioning Model Matrix Template for PowerPoint & Google Slides
Comparison Chart
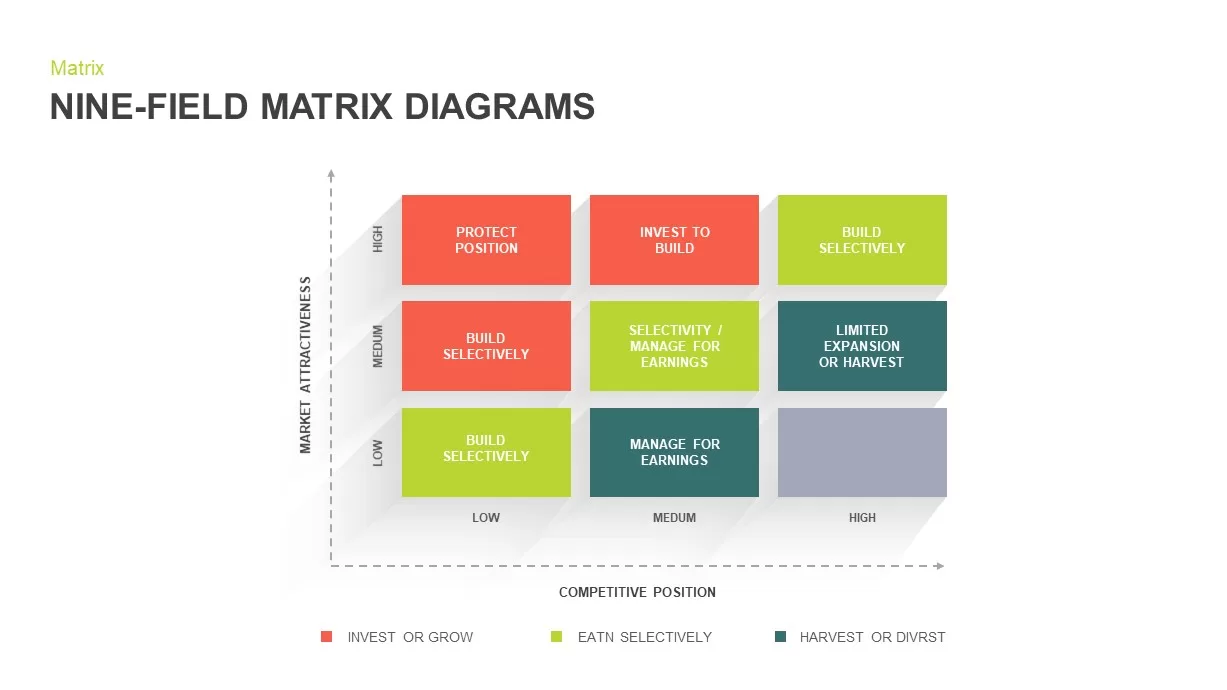
Nine-Field Matrix Diagrams Collection Template for PowerPoint & Google Slides
Comparison Chart
Editable Four-Quadrant TOWS Matrix Template for PowerPoint & Google Slides
Opportunities Challenges
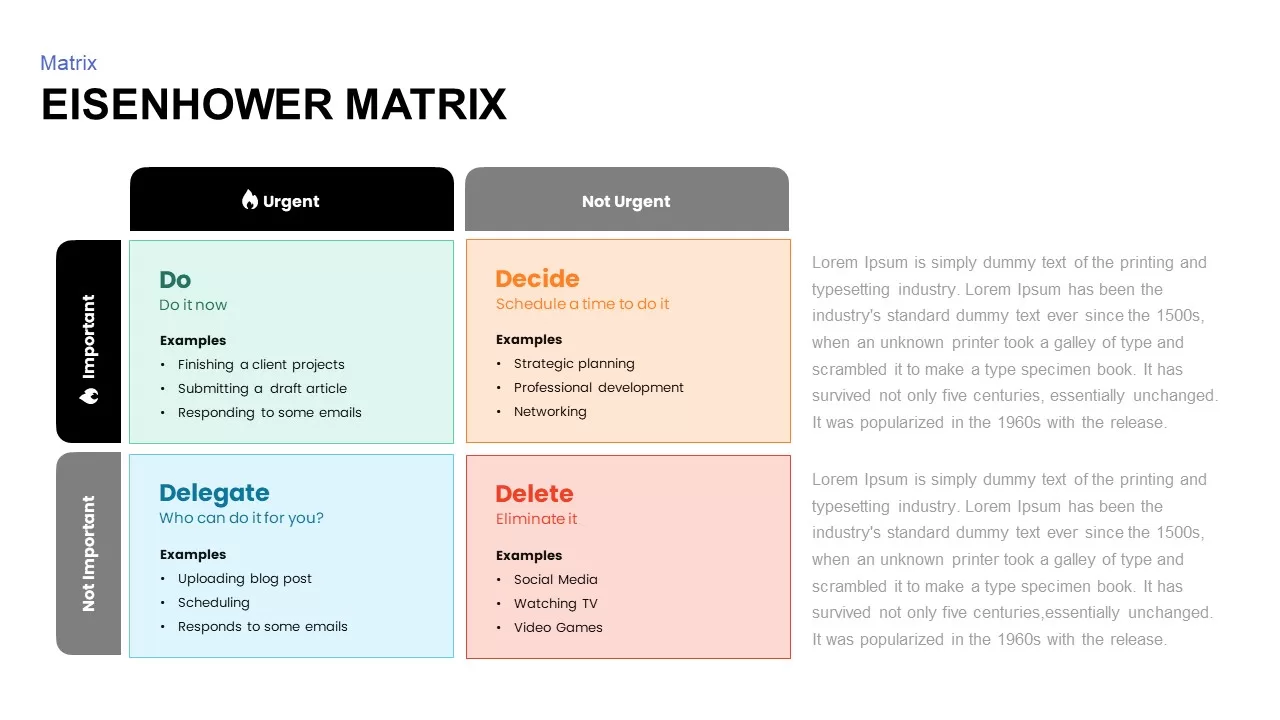
Eisenhower Matrix Decision-Making template for PowerPoint & Google Slides
Infographics
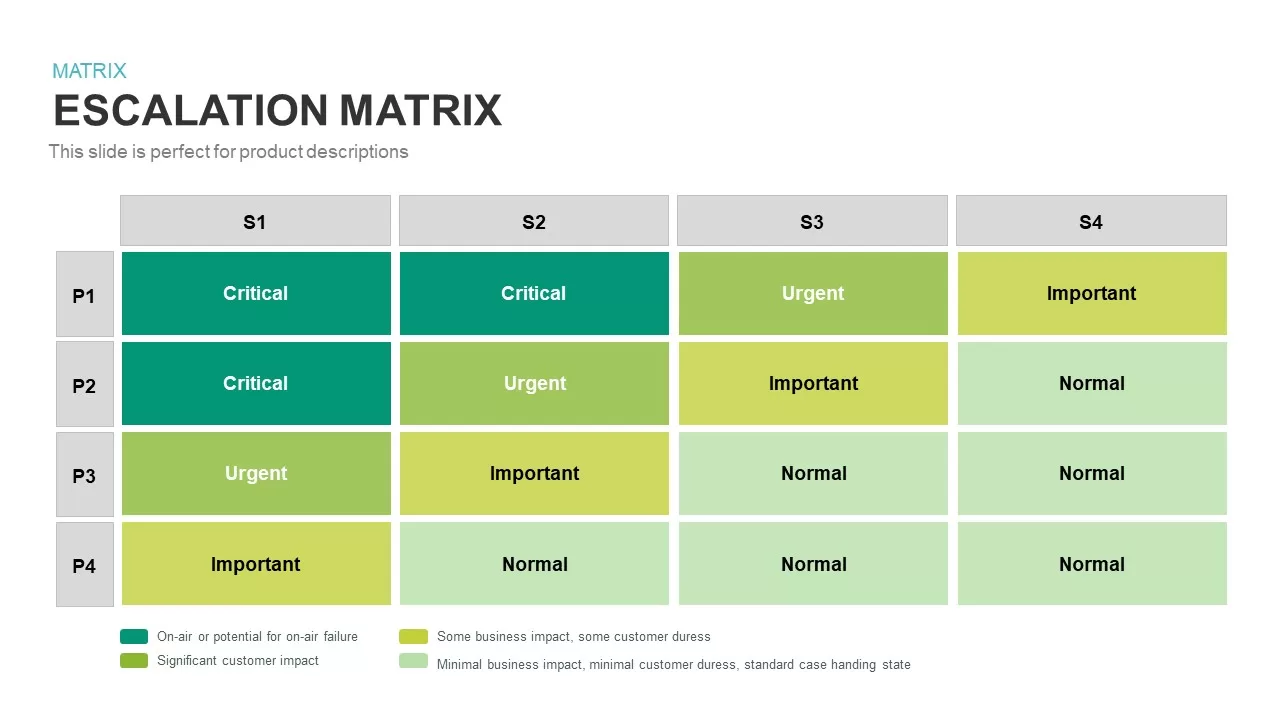
Escalation Matrix template
Business
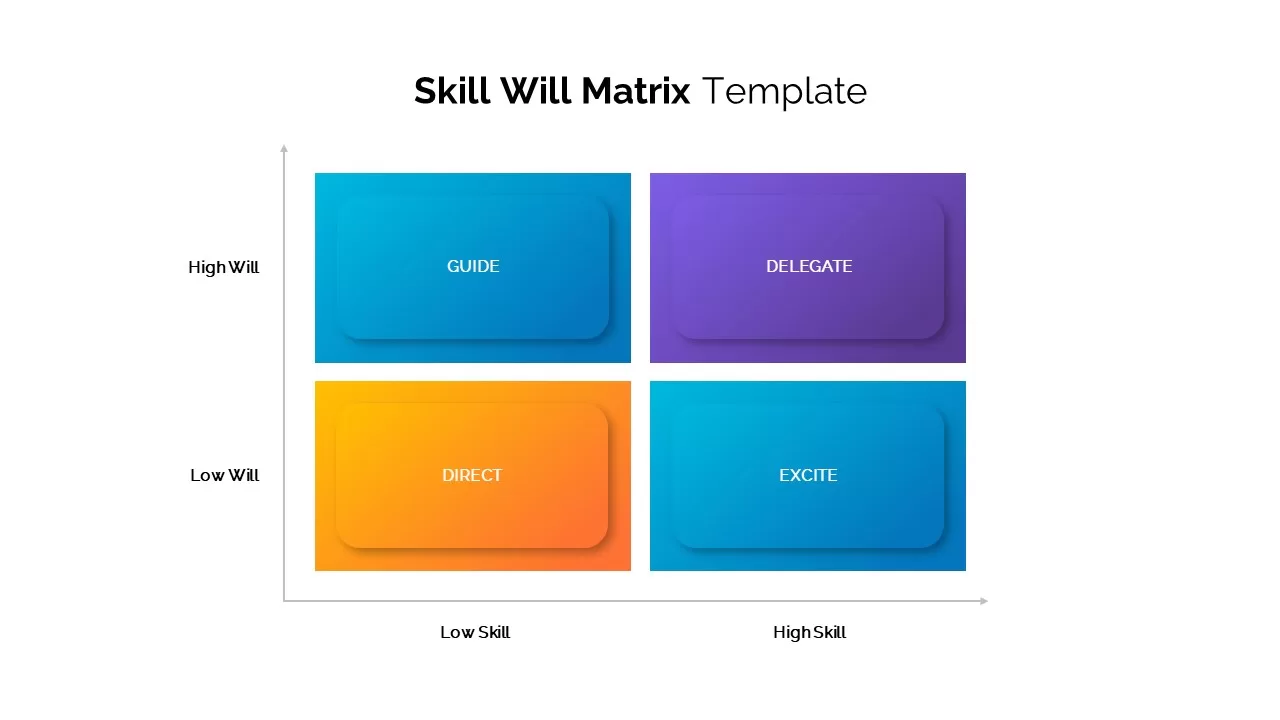
Skill Will Matrix Template for PowerPoint & Google Slides
Infographics
Pugh Matrix Decision Comparison Chart Template for PowerPoint & Google Slides
Comparison Chart
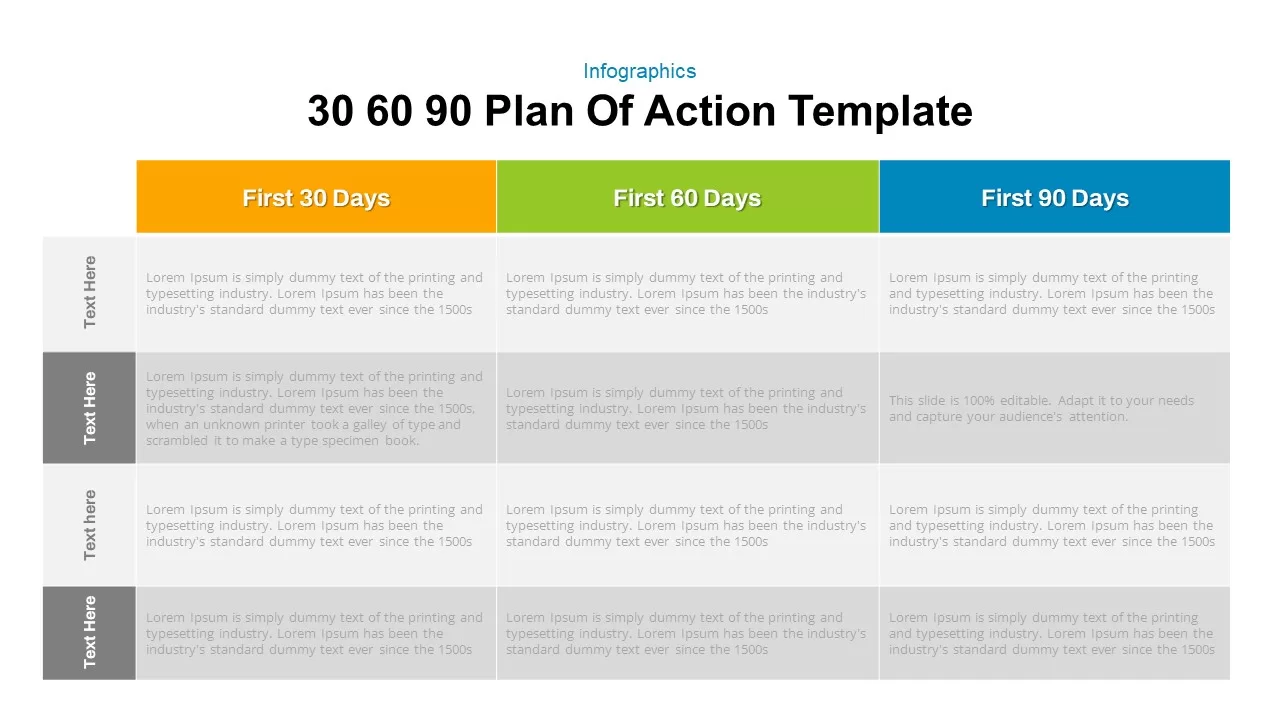
30 60 90 Day Plan Matrix Table Template for PowerPoint & Google Slides
Timeline
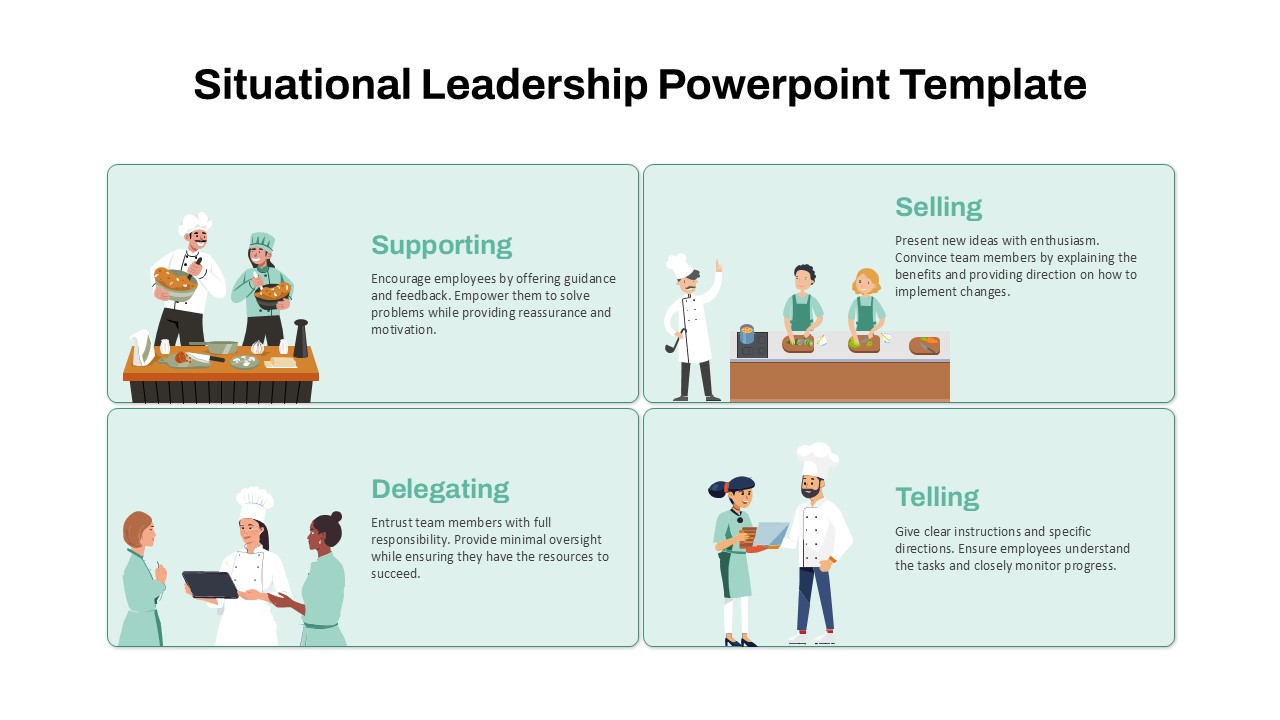
Situational Leadership Matrix Template for PowerPoint & Google Slides
Process
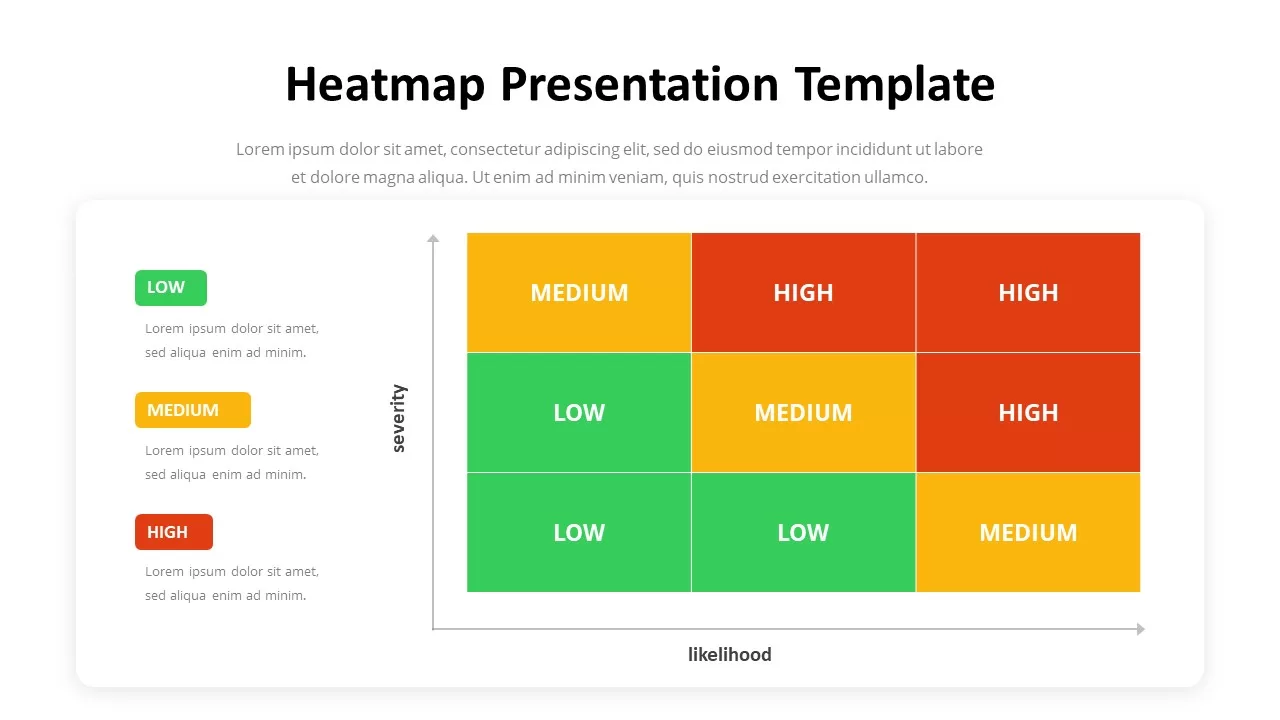
Heat Map Infographic Template For Risk Assessment and Priority Analysis
Comparison Chart
Heatmap Matrix Template for PowerPoint & Google Slides
Maps
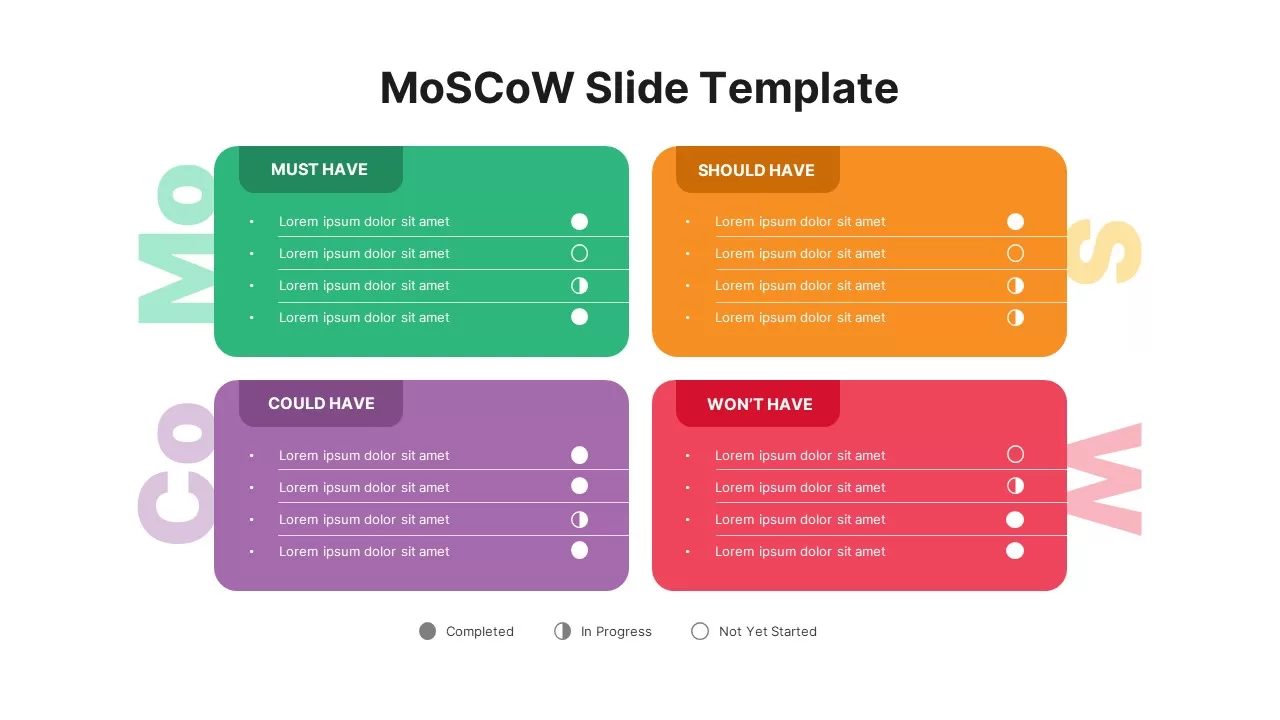
MoSCoW Prioritization Matrix Slide Template for PowerPoint & Google Slides
Business Strategy
Vendor Comparison Matrix with High-Level Requirements template for PowerPoint & Google Slides
Comparison Chart
MABA Attractiveness Matrix Chart Template for PowerPoint & Google Slides
Comparison Chart
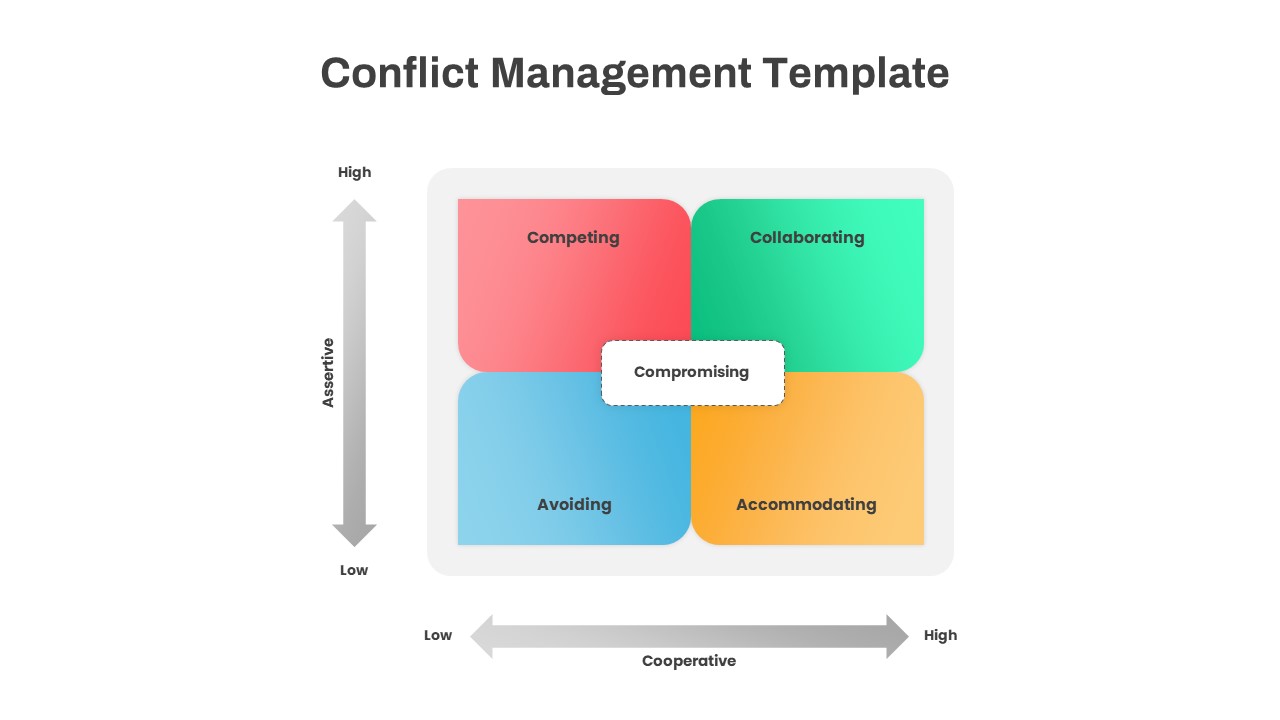
Conflict Management Matrix Template for PowerPoint & Google Slides
Leadership
Business Growth Strategies Matrix Template for PowerPoint & Google Slides
Comparison
Free Competitor Analysis Matrix Template for PowerPoint & Google Slides
Competitor Analysis
Free
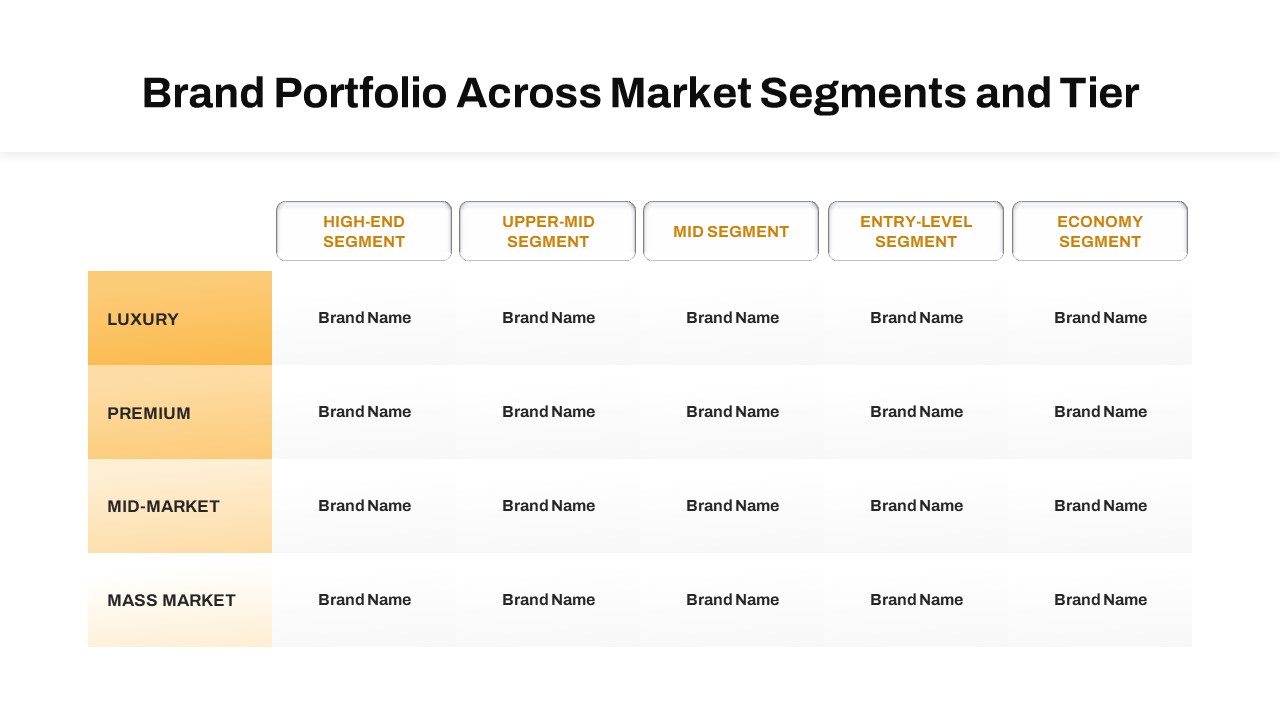
Brand Portfolio Matrix: Segments & Tiers Template for PowerPoint & Google Slides
Business Report
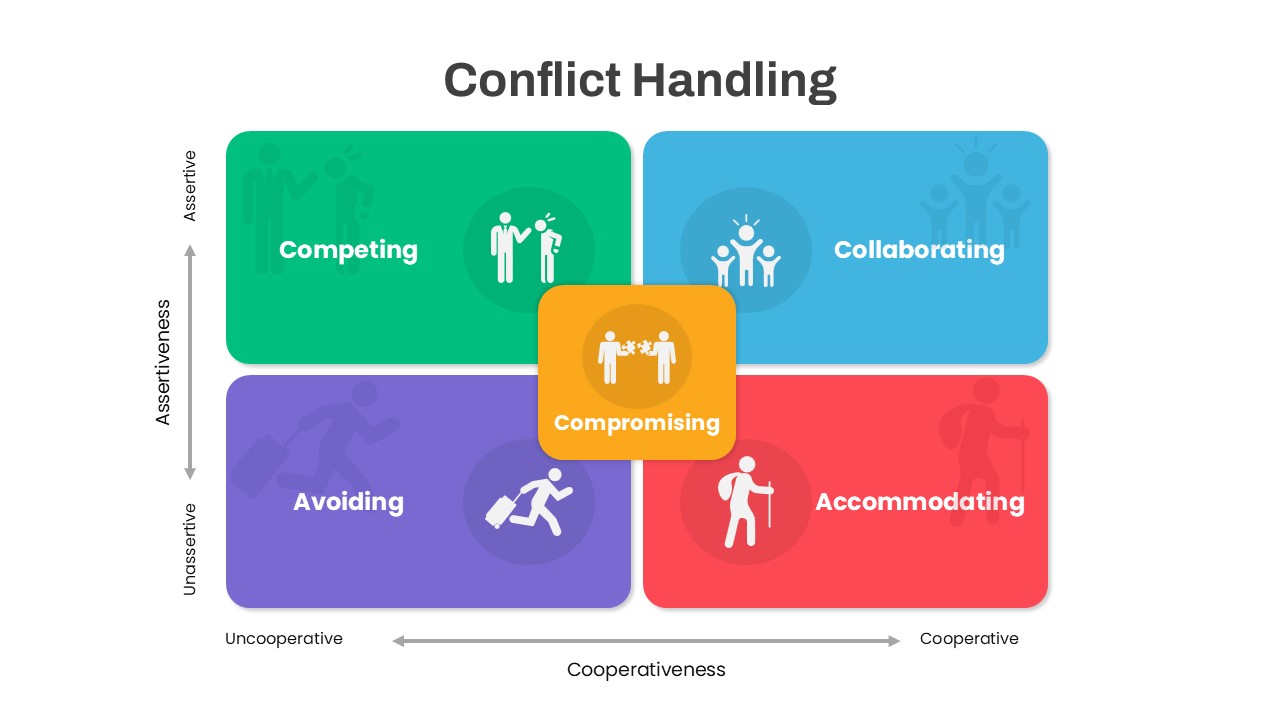
Colorful Conflict Handling Matrix Template for PowerPoint & Google Slides
Comparison
Decision Matrix & Prioritization Chart Template for PowerPoint & Google Slides
Comparison Chart
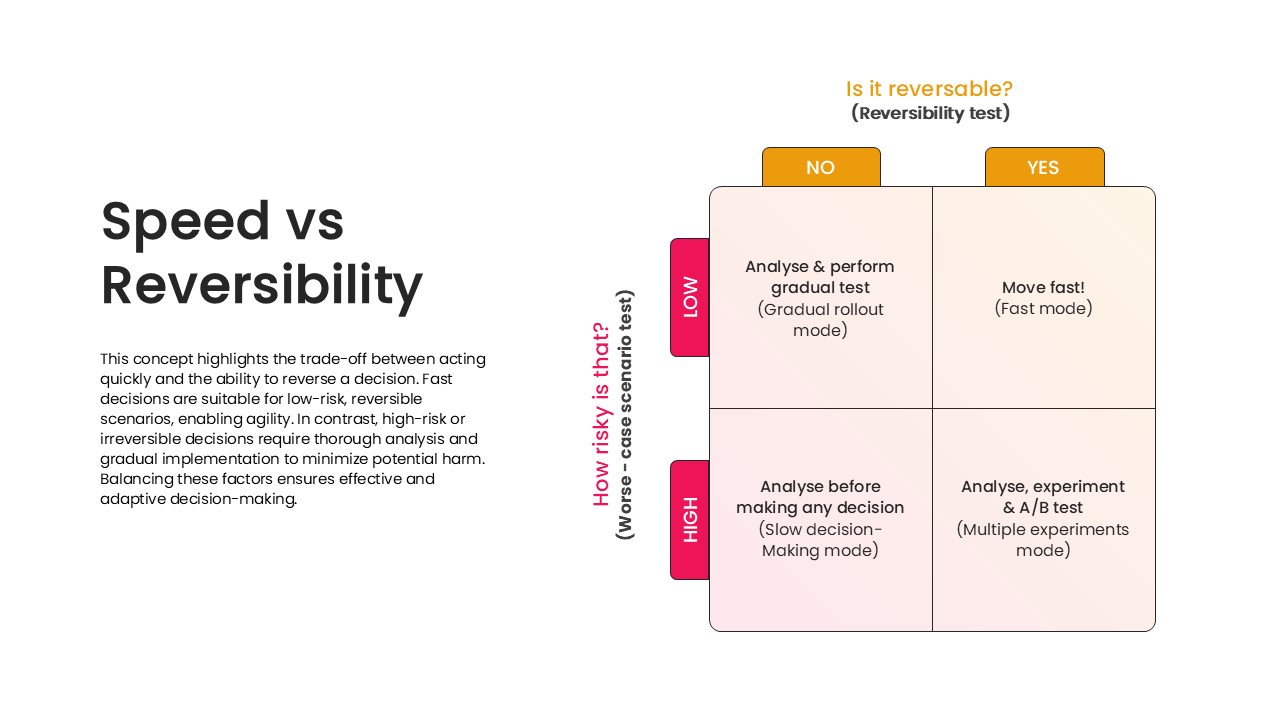
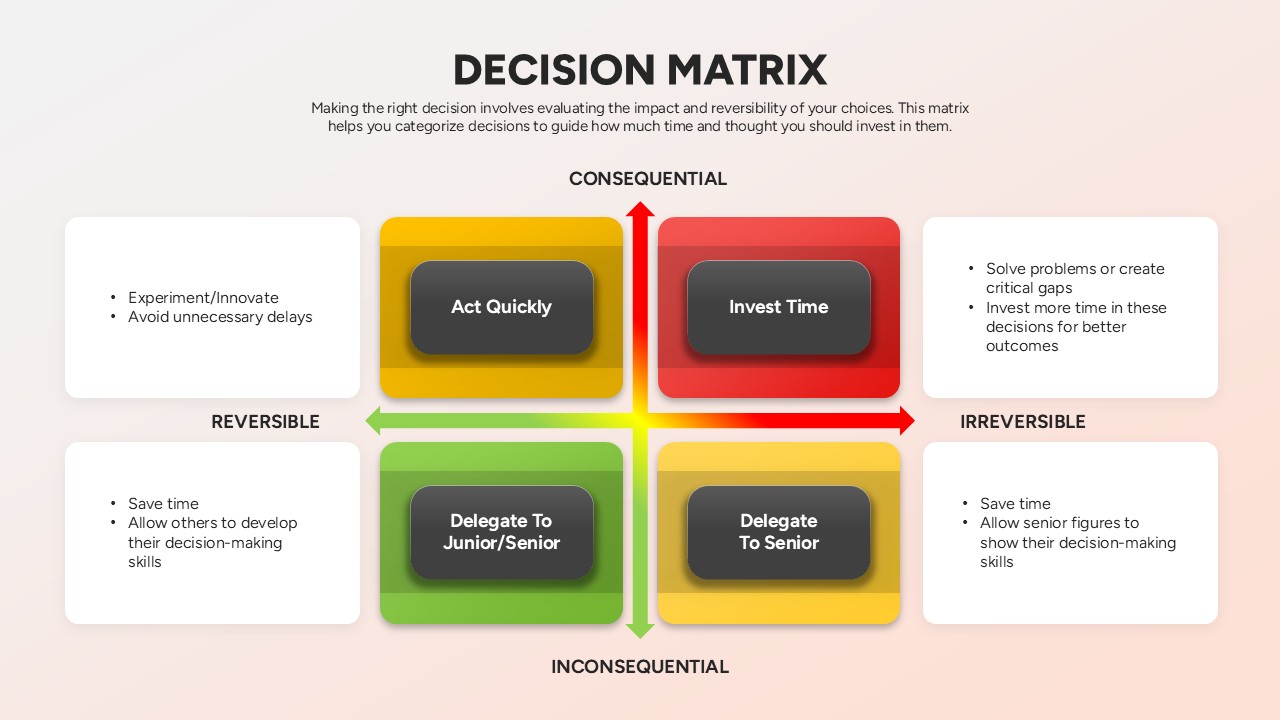
Speed vs Reversibility Decision Matrix Template for PowerPoint & Google Slides
Comparison
Ansoff Growth Matrix Professional Template for PowerPoint & Google Slides
Comparison
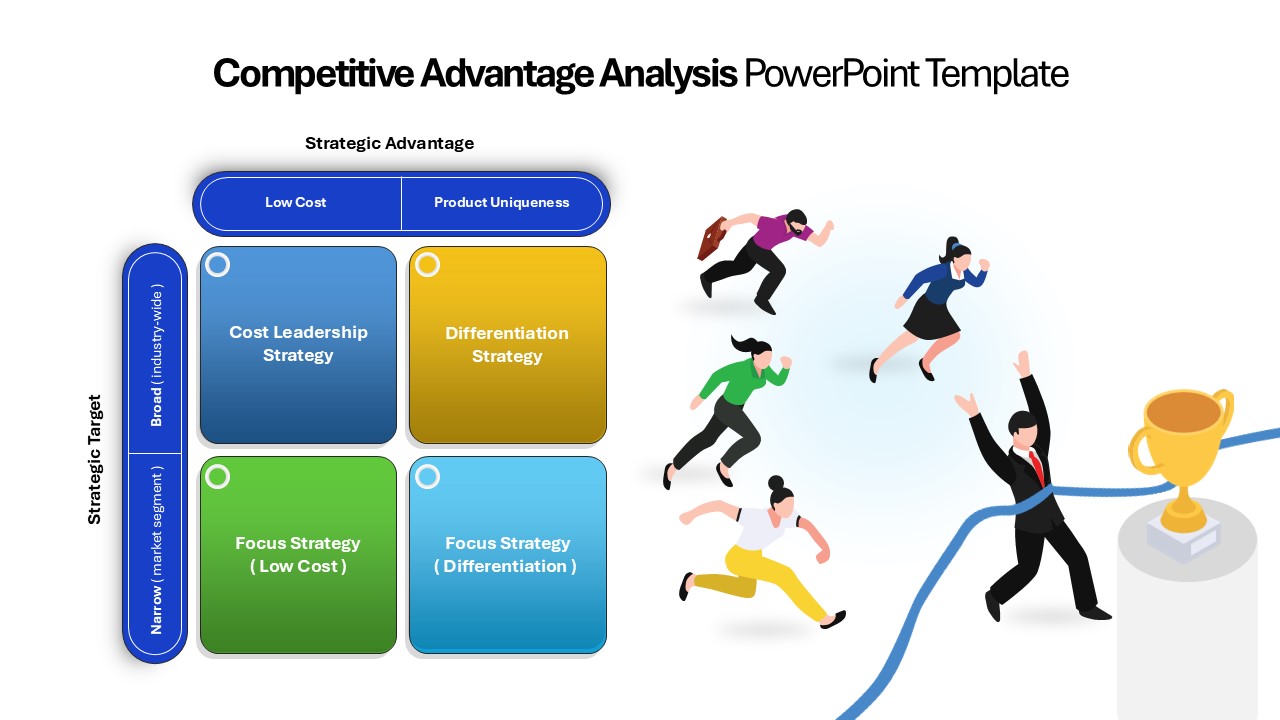
Porter’s Generic Strategies Matrix Template for PowerPoint & Google Slides
Business Strategy
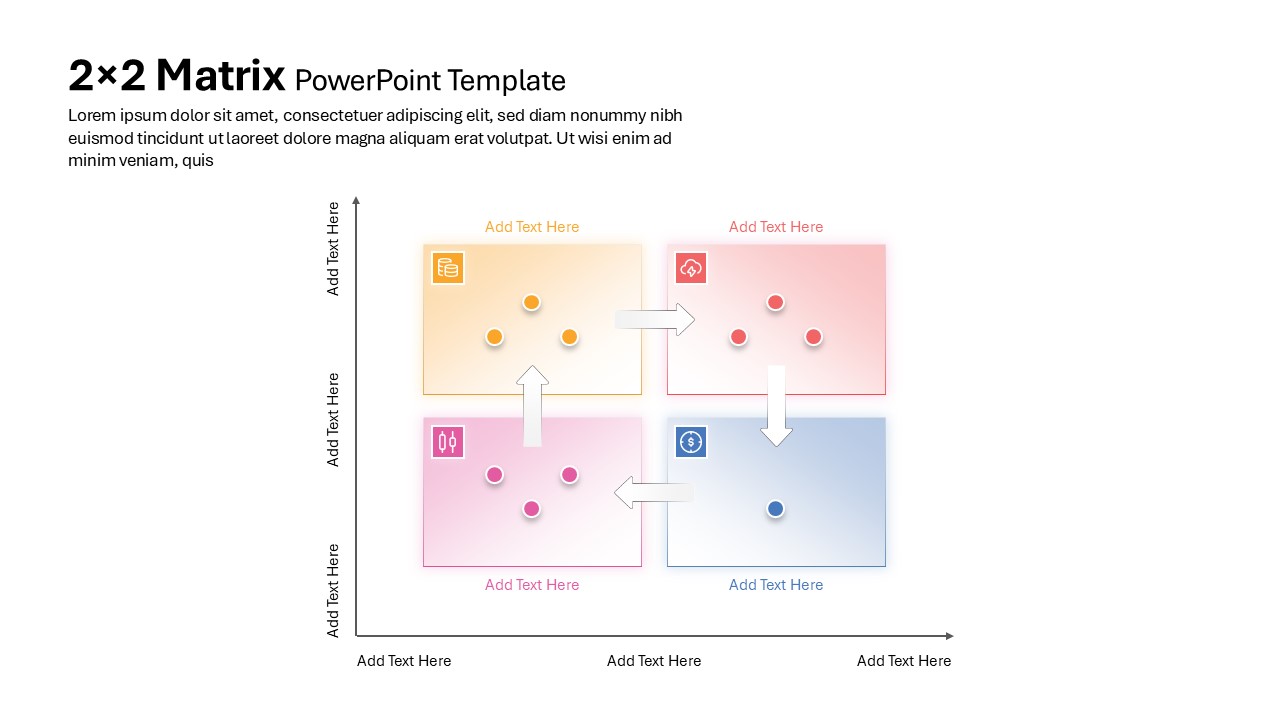
2×2 Matrix PowerPoint & Google Slides Template
Business Models
Competitor Profile Matrix Comparison Template for PowerPoint & Google Slides
Comparison Chart
Risk Scoring & Ranking Heatmap Matrix Template for PowerPoint & Google Slides
Risk Management
Feasibility Matrix Comparison Chart Template for PowerPoint & Google Slides
Comparison Chart
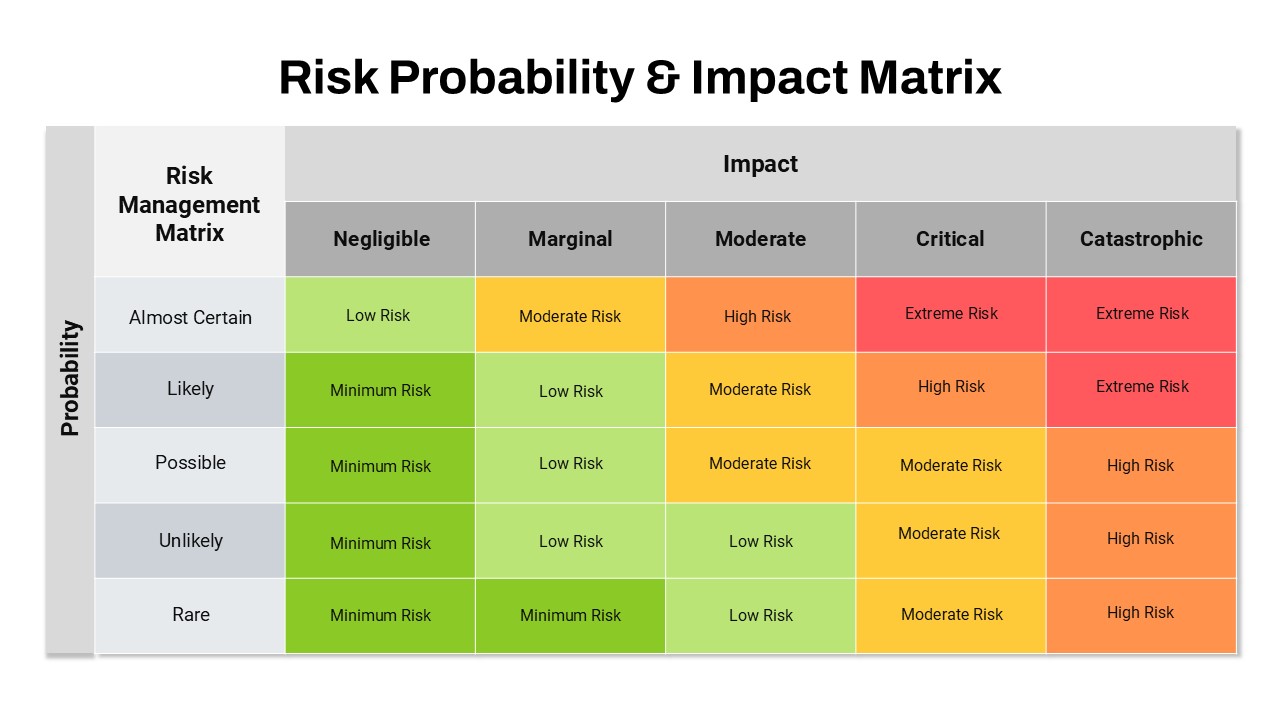
Risk Probability and Impact Matrix Template for PowerPoint & Google Slides
Risk Management
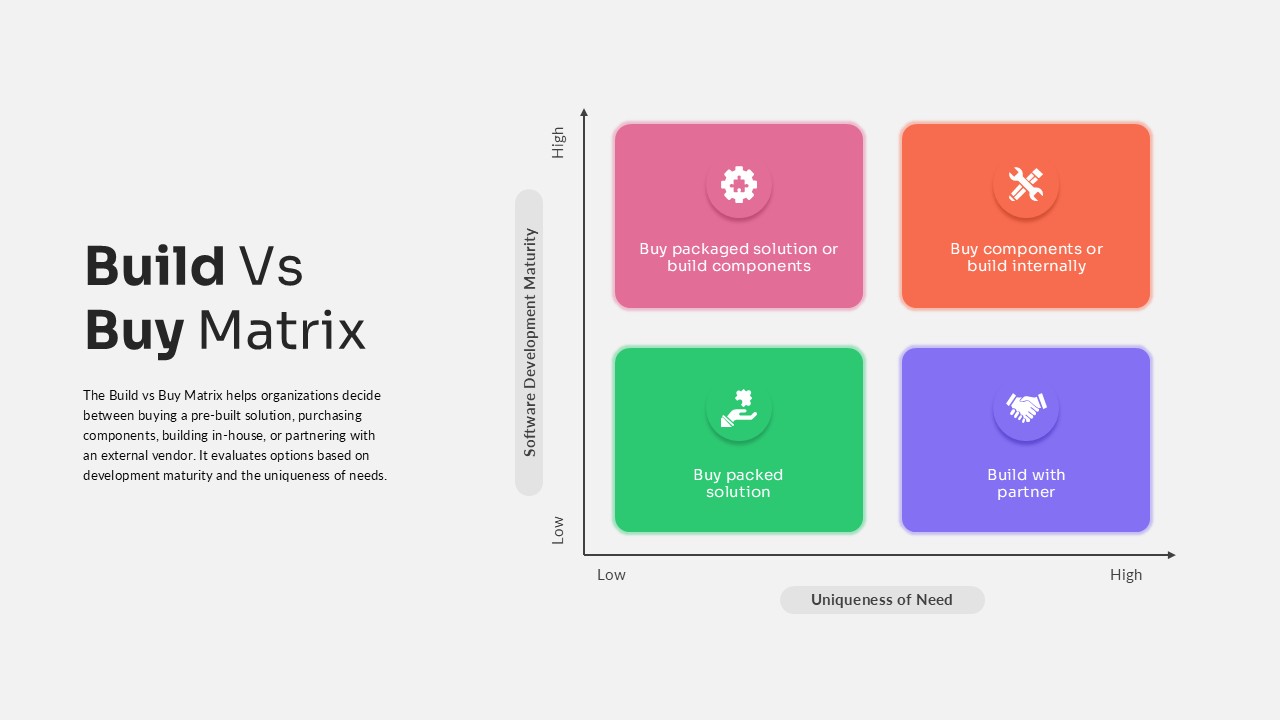
Build vs Buy Matrix Decision Framework template for PowerPoint & Google Slides
Business Strategy
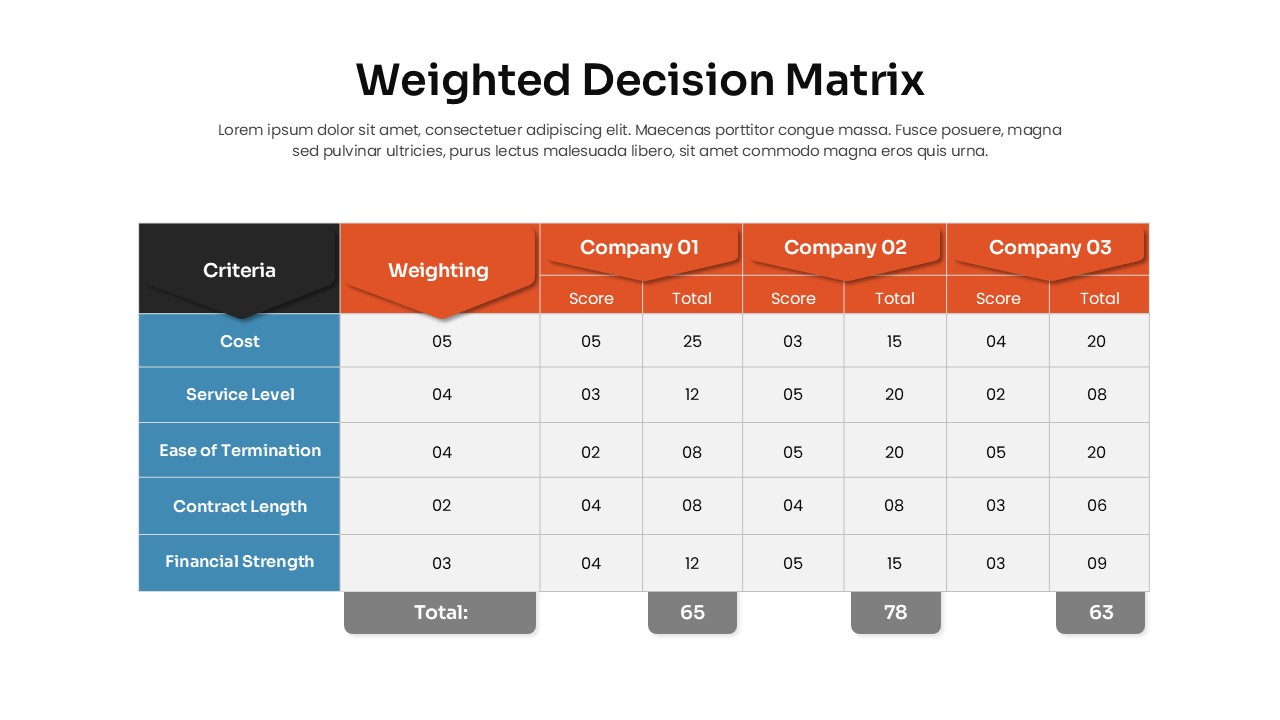
Weighted Decision Matrix template for PowerPoint & Google Slides
Business Models
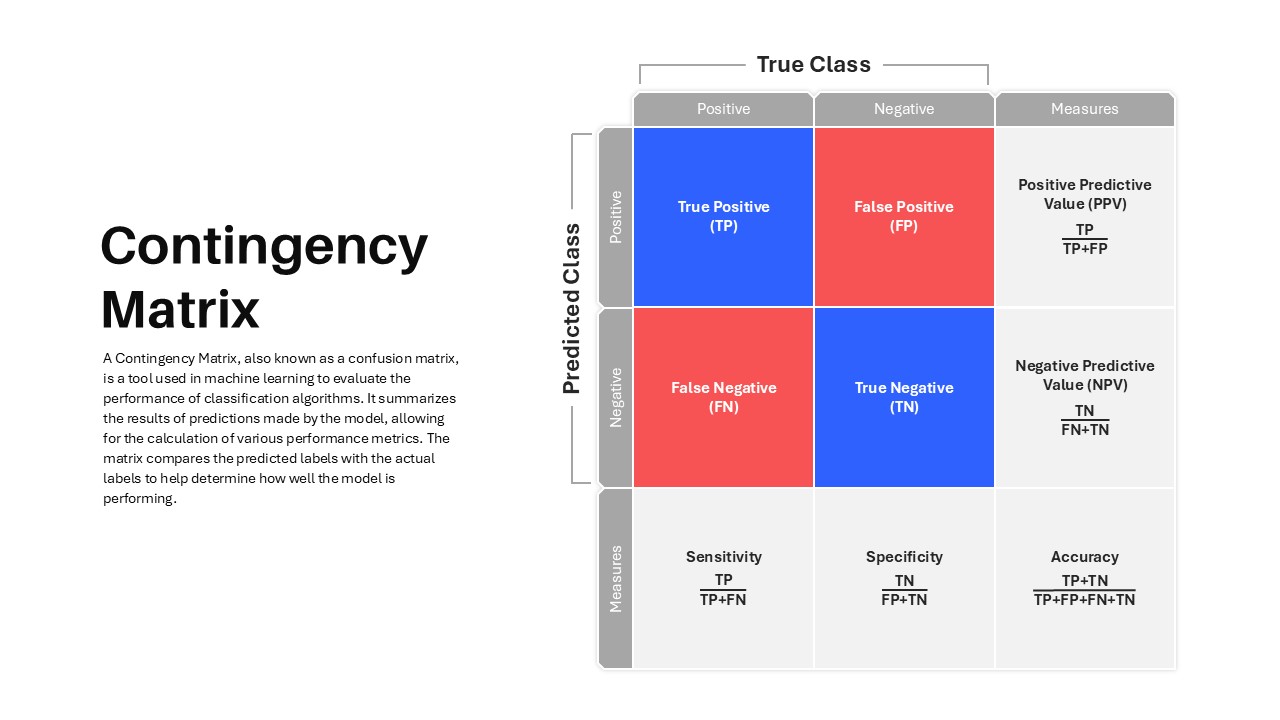
Contingency Matrix in Machine Learning template for PowerPoint & Google Slides
Technology
Disaster Response Role Matrix RACI Chart Template for PowerPoint & Google Slides
Project Status
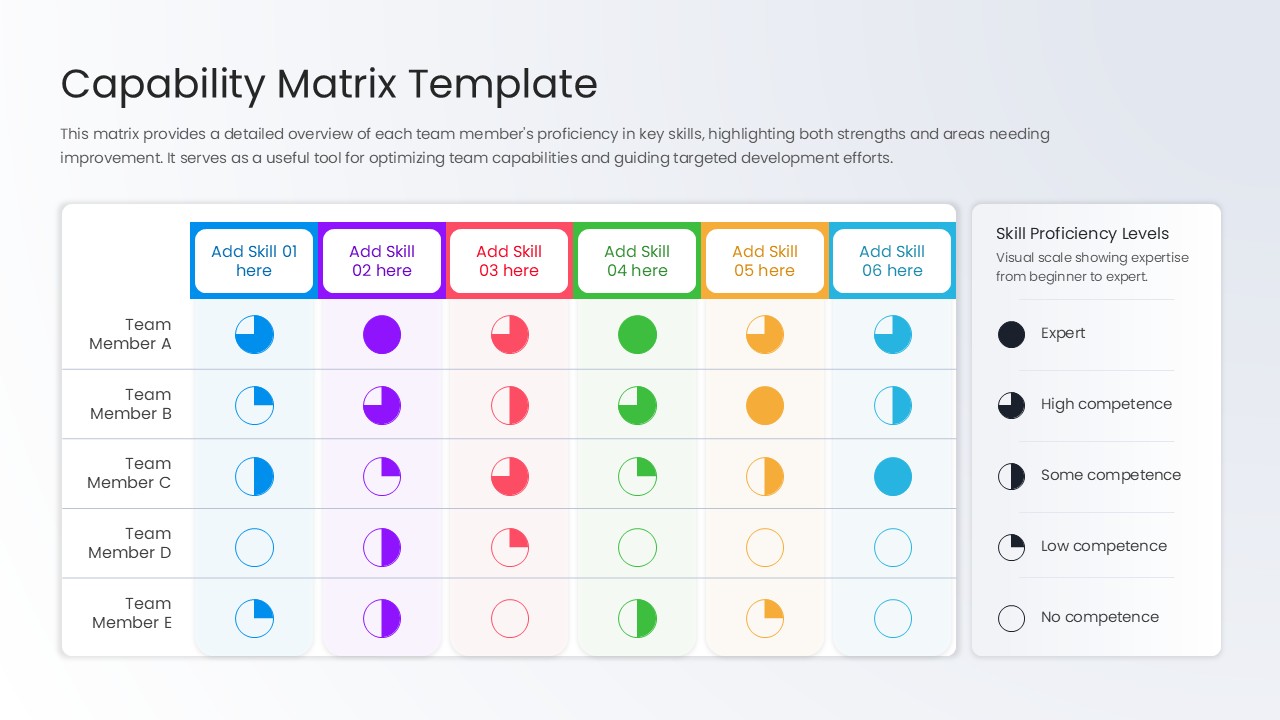
Capability Matrix Template for PowerPoint & Google Slides
HR
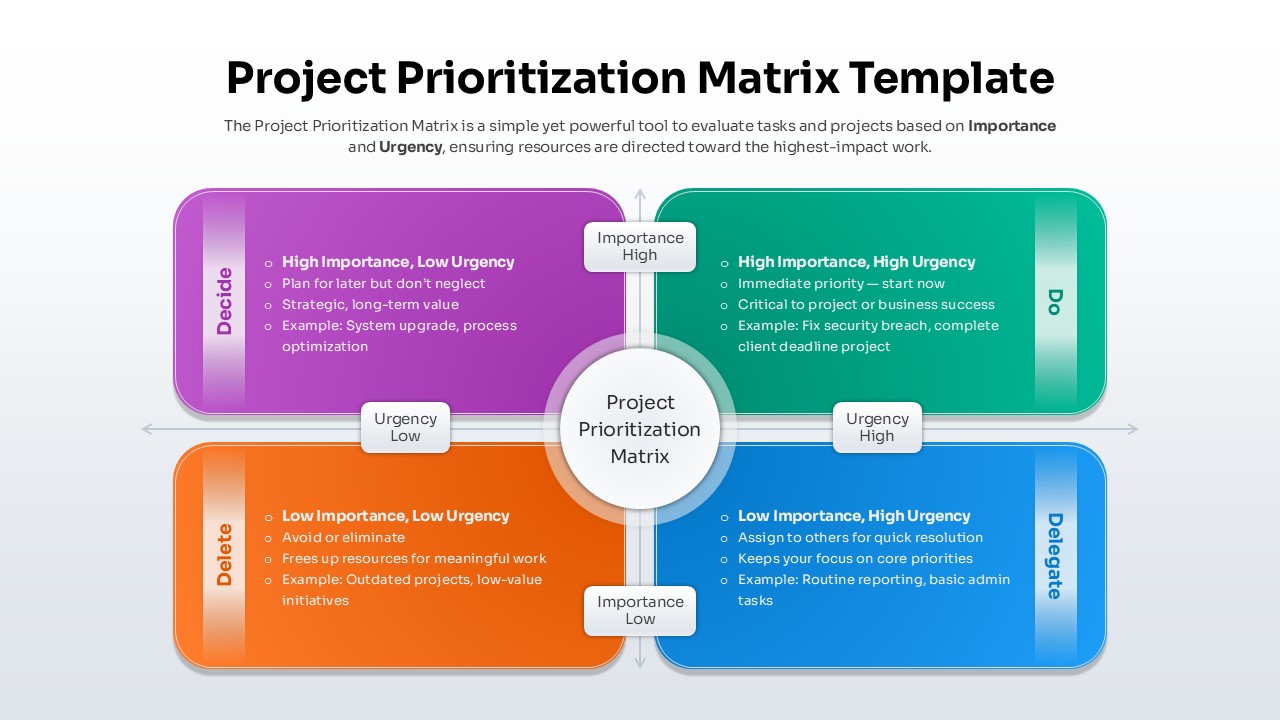
Project Prioritization Matrix Template for PowerPoint & Google Slides
Project
Decision Matrix Evaluation Framework Slide Template for PowerPoint & Google Slides
Leadership
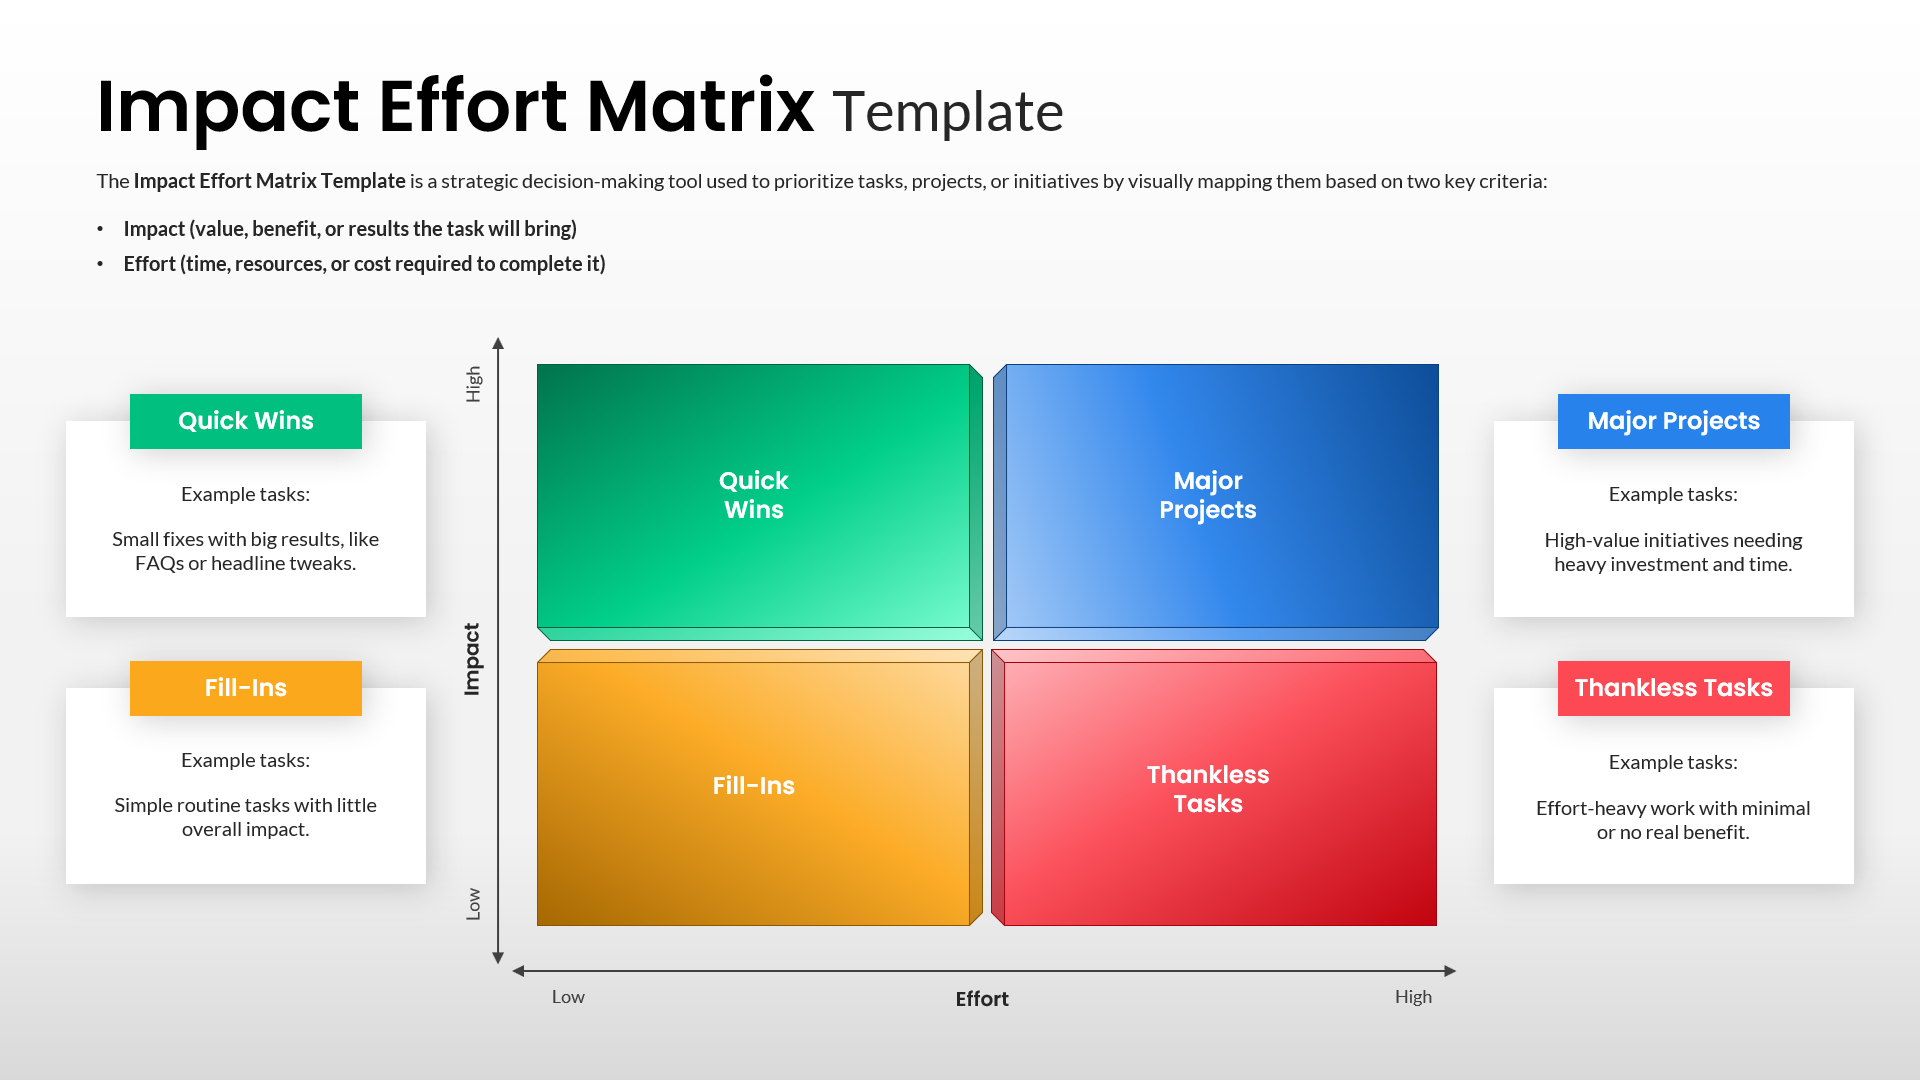
Impact Effort Matrix Template for PowerPoint & Google Slides
Comparison Chart
Ansoff Growth Matrix Template for PowerPoint & Google Slides
Business Strategy
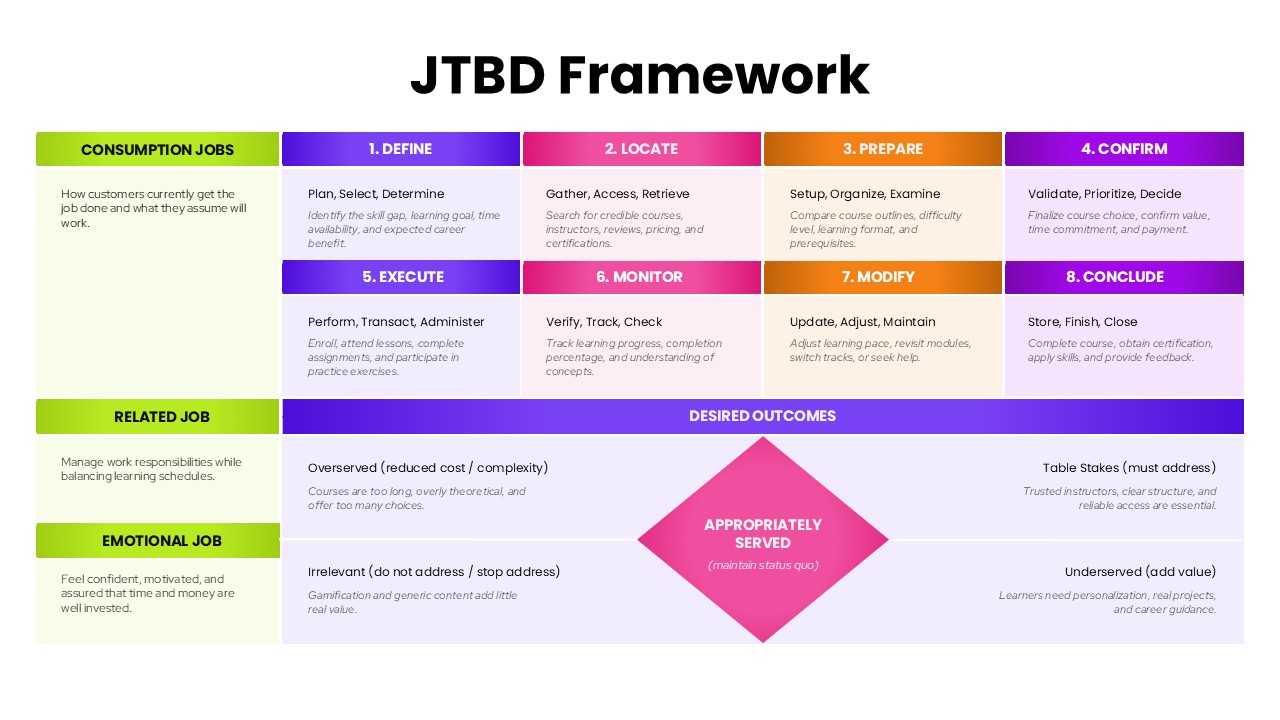
JTBD Framework Process and Outcomes Matrix Template for PowerPoint & Google Slides
Marketing
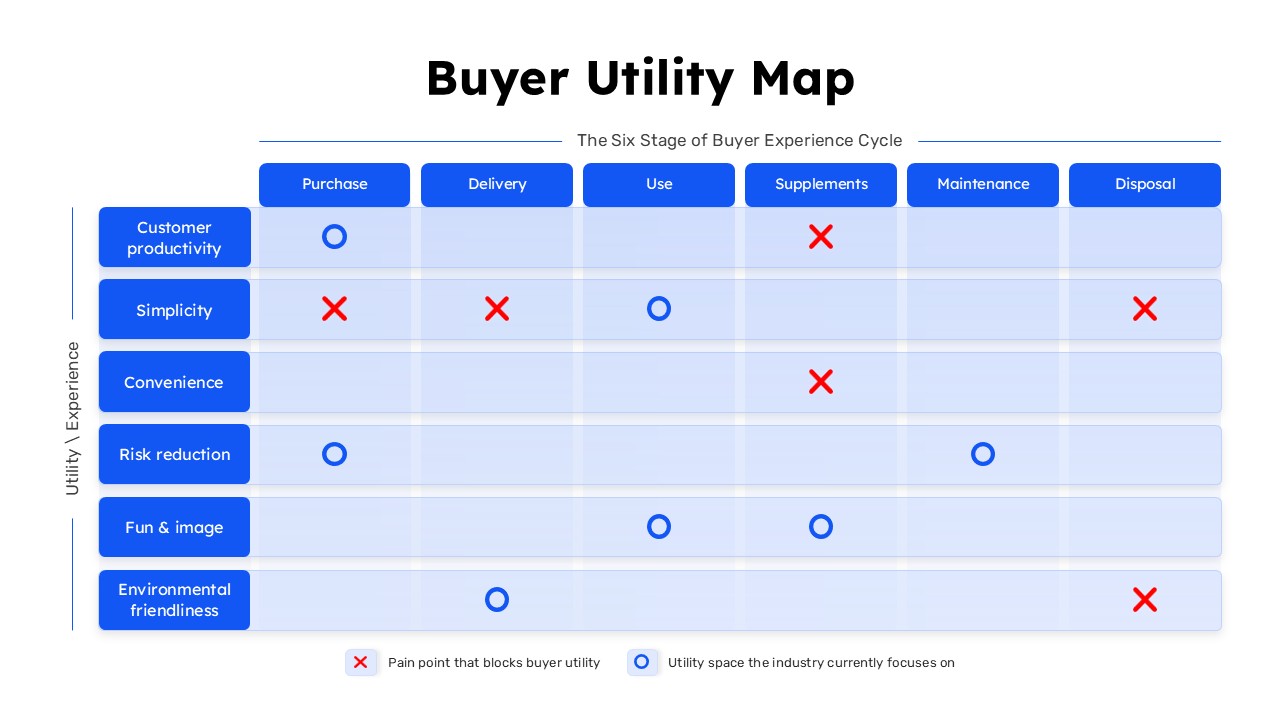
Buyer Utility Map Strategy Matrix Template for PowerPoint & Google Slides
Customer Journey
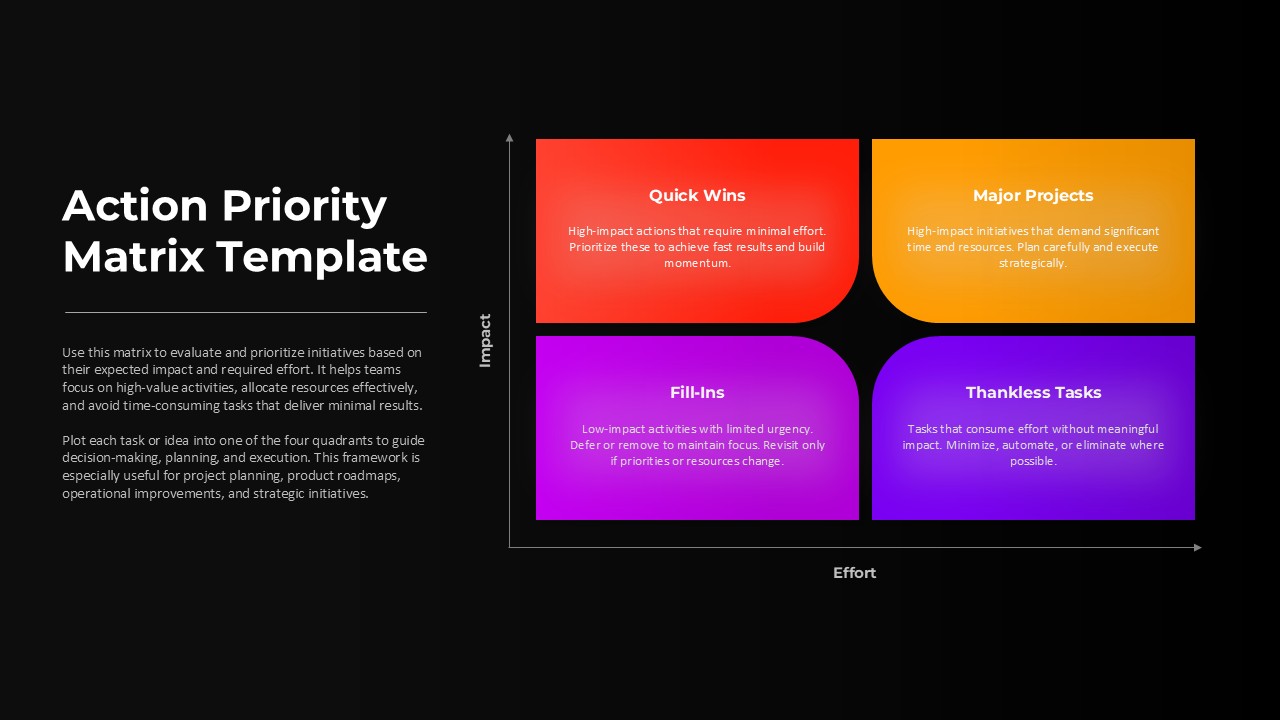
Action Priority Impact Effort Matrix Template for PowerPoint & Google Slides
Business Strategy
IT Gap Analysis Assessment Matrix Template for PowerPoint & Google Slides
Information Technology
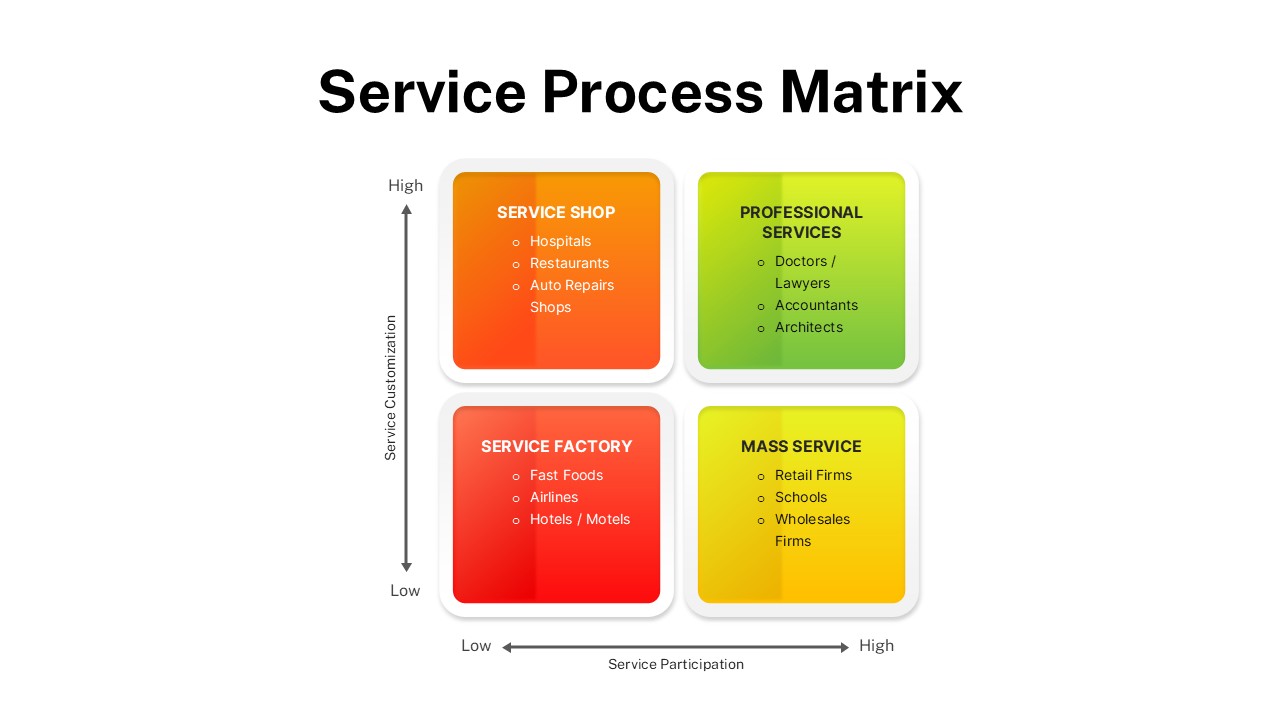
Service Process Matrix Template for PowerPoint & Google Slides
Business Strategy