Wheel Chart PowerPoint Templates


Download Wheel Diagram for PowerPoint Presentations.
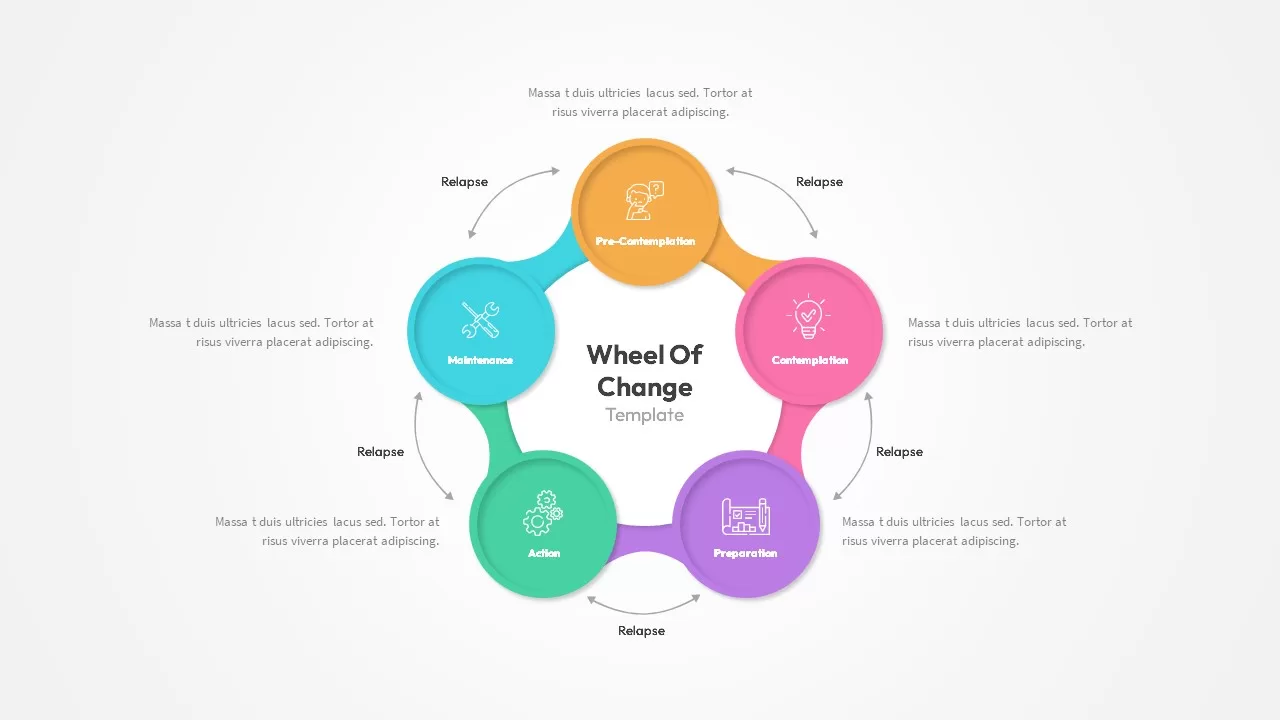
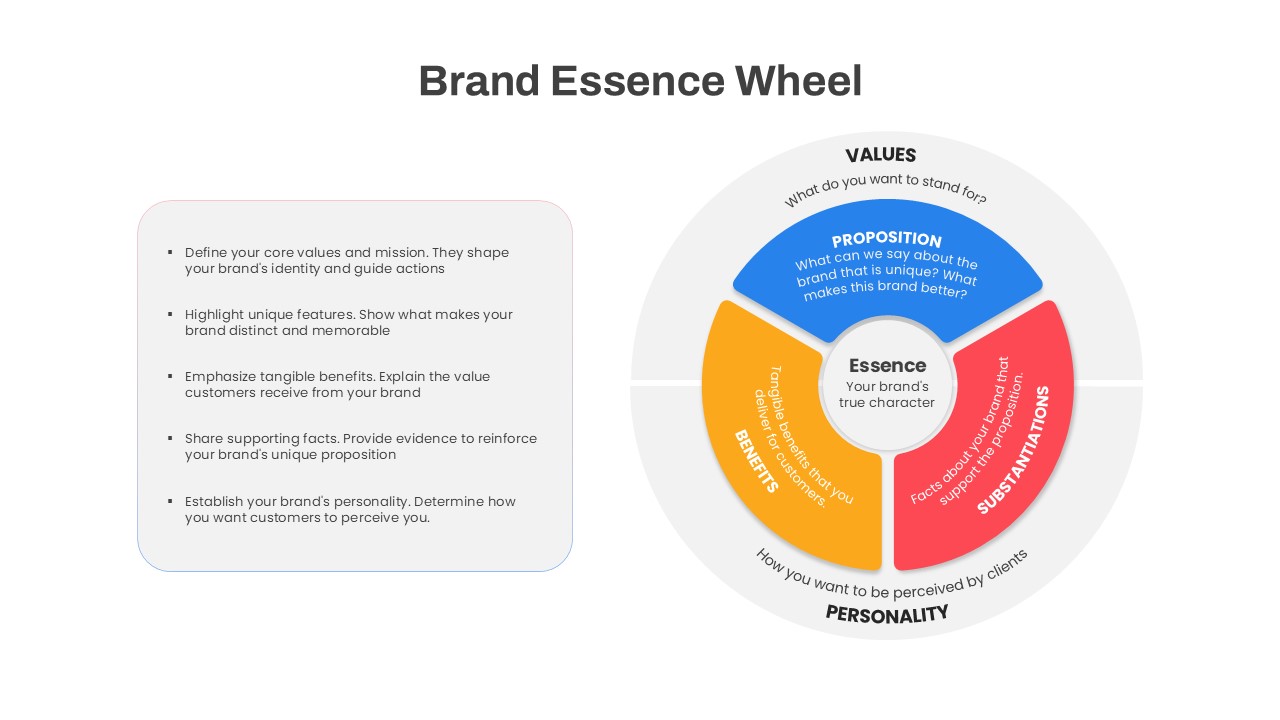
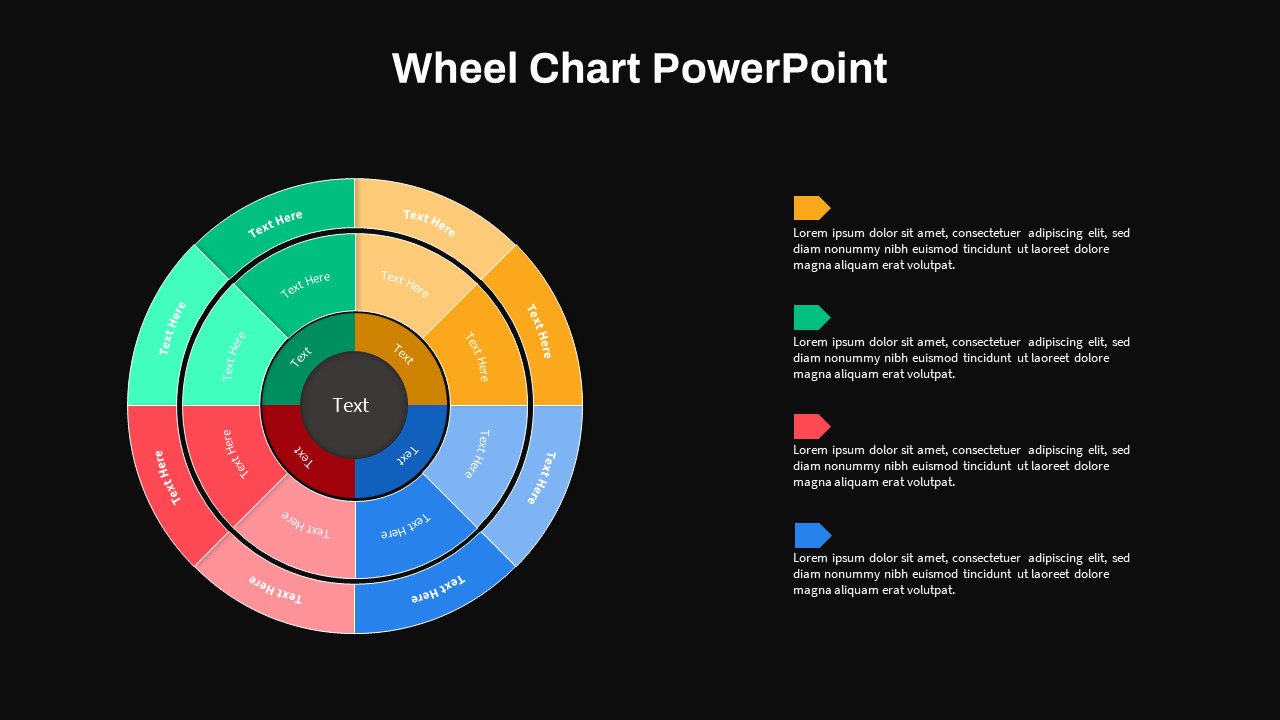
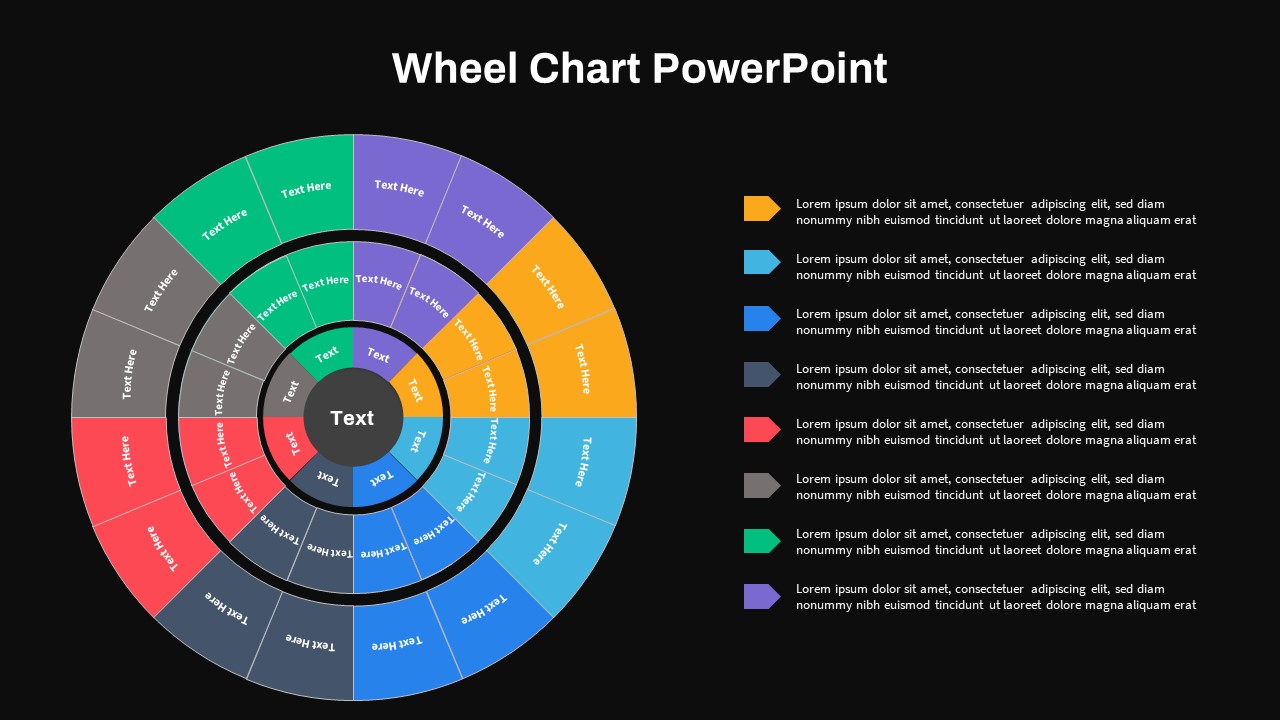
Our wheel chart PowerPoint template is designed to showcase complex processes and their sub-processes in a circular layout. It comes in a multi-layered format in two variant designs. These segmented layers allow the users to imprint their concepts and their processes within a colored division. This type of picturization enables the audience to easily grasp the core idea without any clutters. You can display business strategies, project timelines, future wheels, or comparative analysis with the wheel PowerPoint template & Google Slides. Choose from two distinctive designs, each tailored to add a unique flair to your content while maintaining the core circular layout.
What is a circular presentation?
A circular presentation is a visually engaging approach to conveying information, where content is organized, displayed, or navigated in a circular or radial layout. Unlike traditional linear presentations, a circular presentation allows for a flow of information around a central point. This format is often used to represent cyclical processes, interconnected concepts, or hierarchies. Circular diagrams enhance audience engagement by offering a more natural and visually stimulating progression, allowing presenters to highlight key elements efficiently. This format fosters a holistic understanding of complex topics, making it an ideal choice for showcasing interconnected ideas or illustrating processes with a cyclical nature.
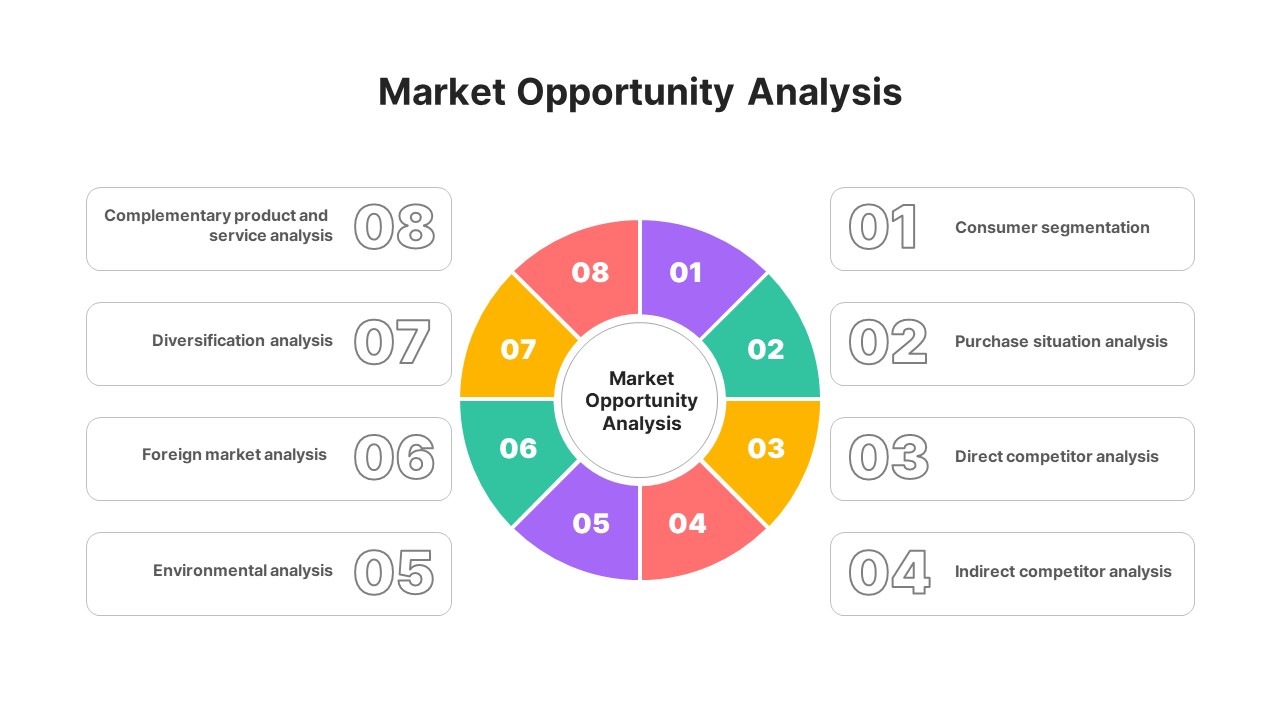
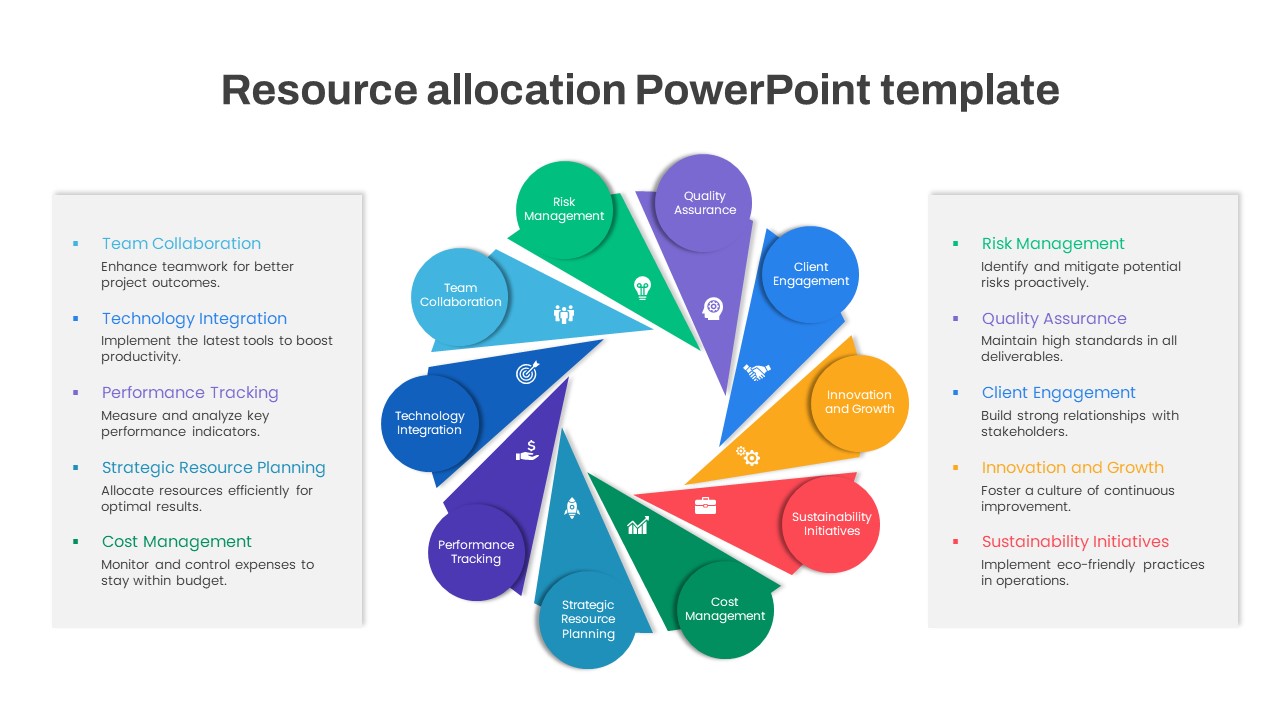
The Wheel Chart template for PowerPoint presentations serves as an effective tool for illustrating numerical proportions through its segmented layers. Opt for this wheel diagram to present project phases and milestones, offering a refreshing departure from conventional linear diagrams in team meetings. Leverage the color divisions to vividly showcase processes and workflows, providing a visually impactful representation. The template allows presenters to prioritize topics effortlessly using each column, ensuring a clear and engaging presentation format that captivates audiences. Elevate your presentations with this innovative Wheel Chart, bringing a distinctive touch to your content and enhancing the effectiveness of your communication.
The two variant wheel chart PPTs look entirely different because the second one has more layers and circular divisions compared to the first chart. However, each chart has used distinct color fills that would be the key highlight to frame one concept and its subdivisions using a single segmented division. The color fills have a predominant role during your topic insertion. So, carefully edit this wheel diagram for PowerPoint presentations. Also, check out our circle PowerPoint templates & Google Slides now!
Login to download this file

Item ID
SB03869
Related Templates

Colorful Four-Segment Wheel Chart Template for PowerPoint & Google Slides
Circular
Wheel of Fortune PowerPoint Template for PowerPoint & Google Slides
Business Proposal
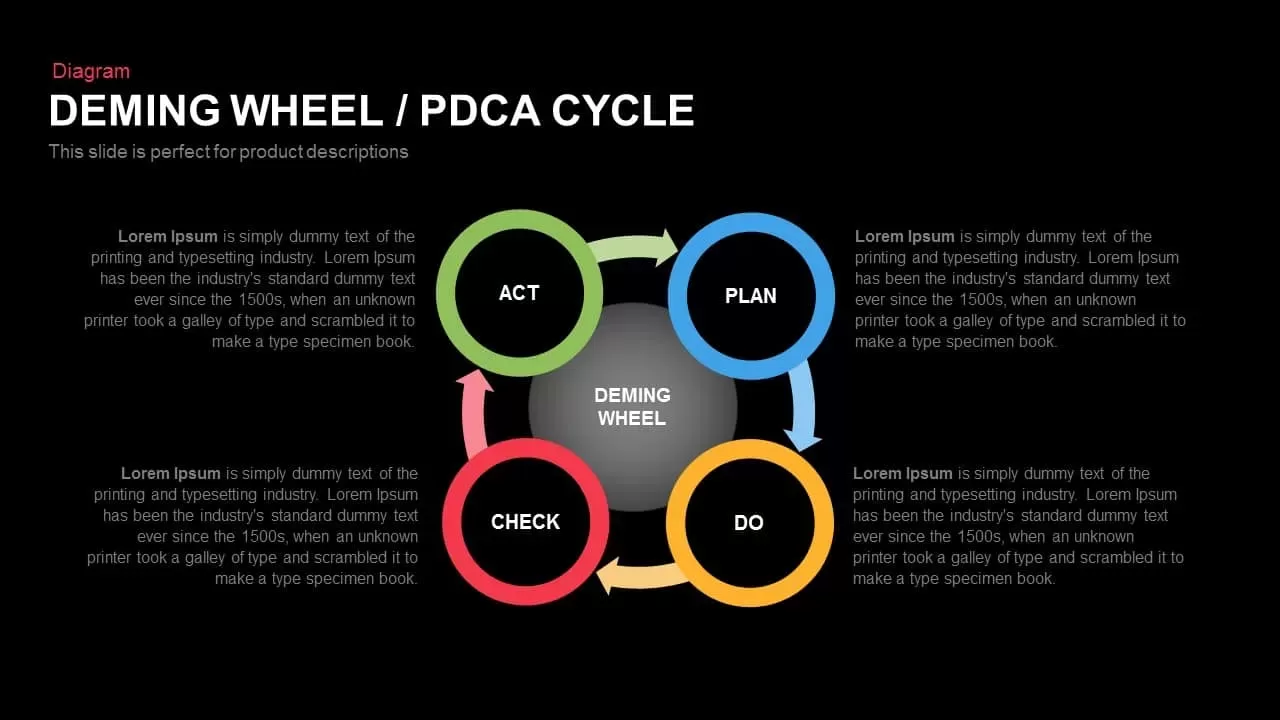
Deming Wheel PDCA Cycle Diagram Template for PowerPoint & Google Slides
Business Plan
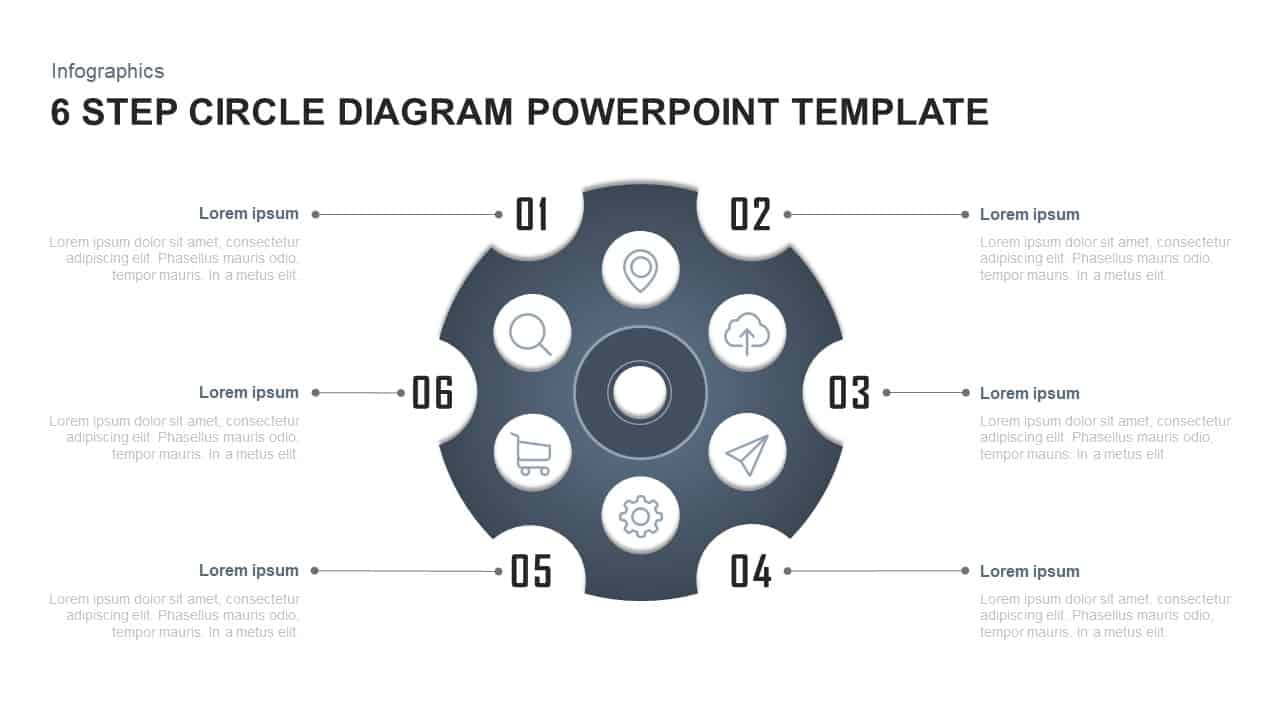
Six-Stage Gear Wheel Diagram Template for PowerPoint & Google Slides
Circular
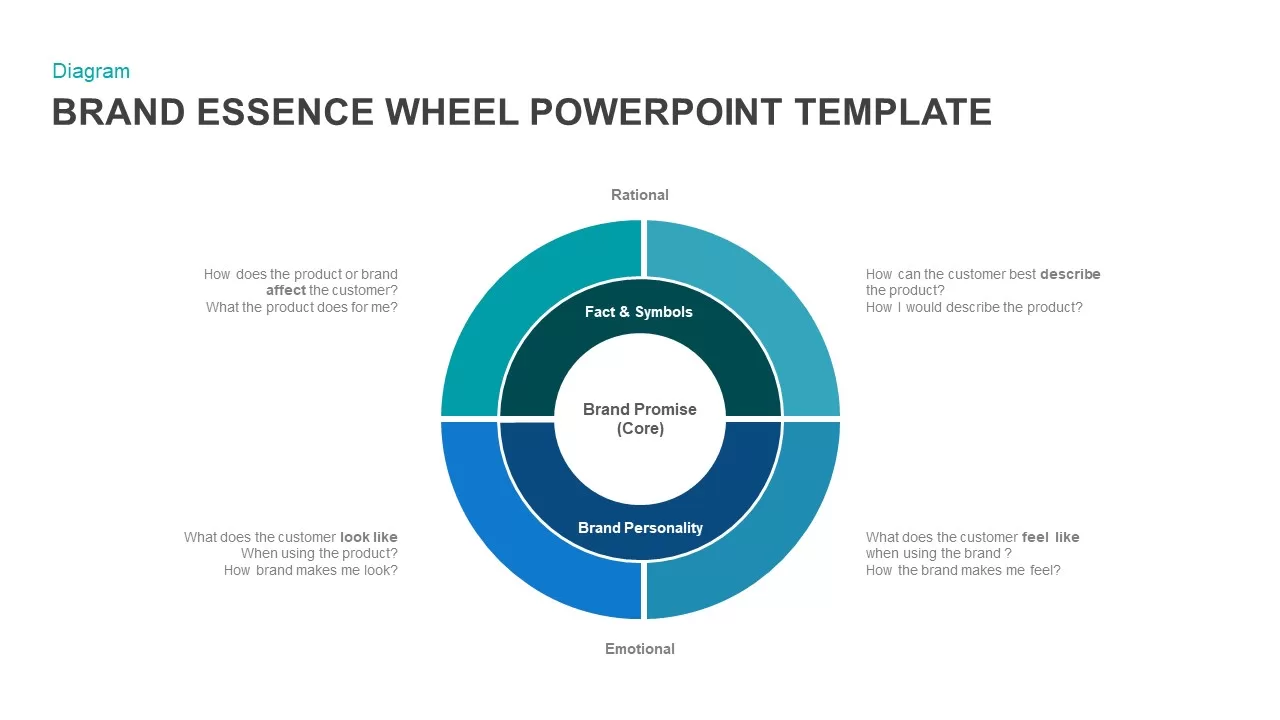
Brand Essence Wheel PowerPoint Template
Marketing
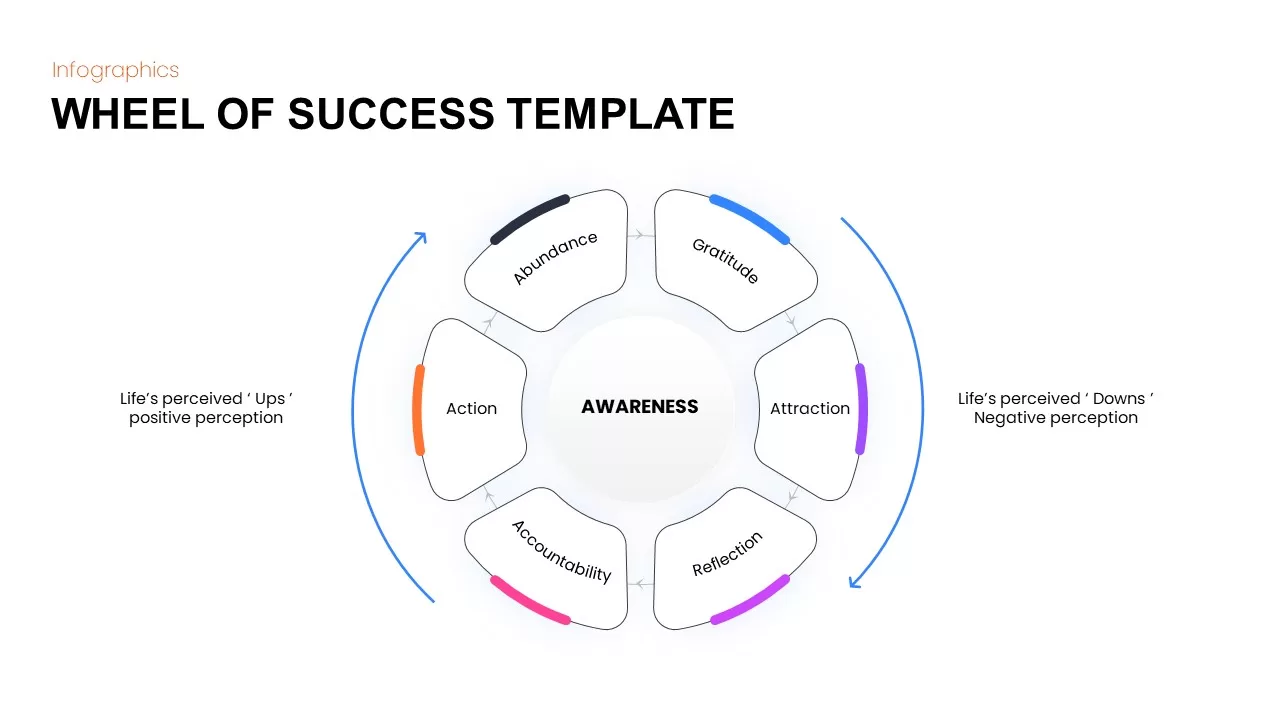
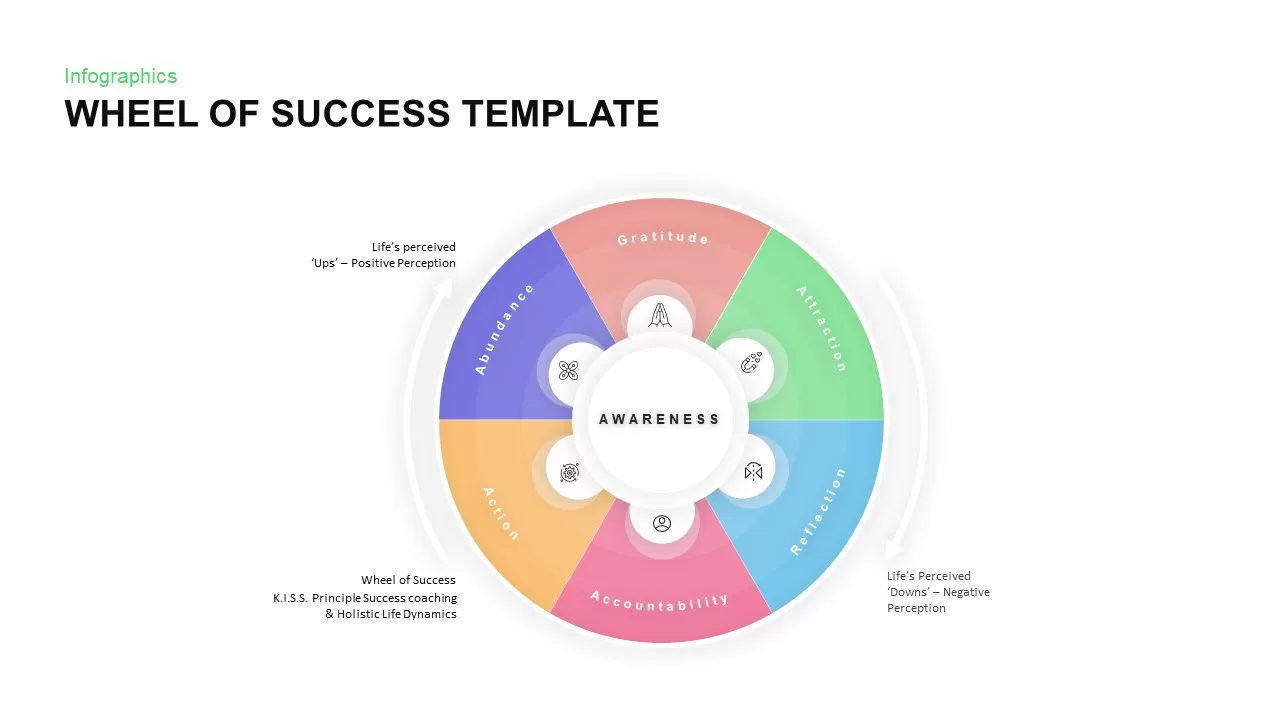
Wheel of Success Infographic template for PowerPoint & Google Slides
Circular
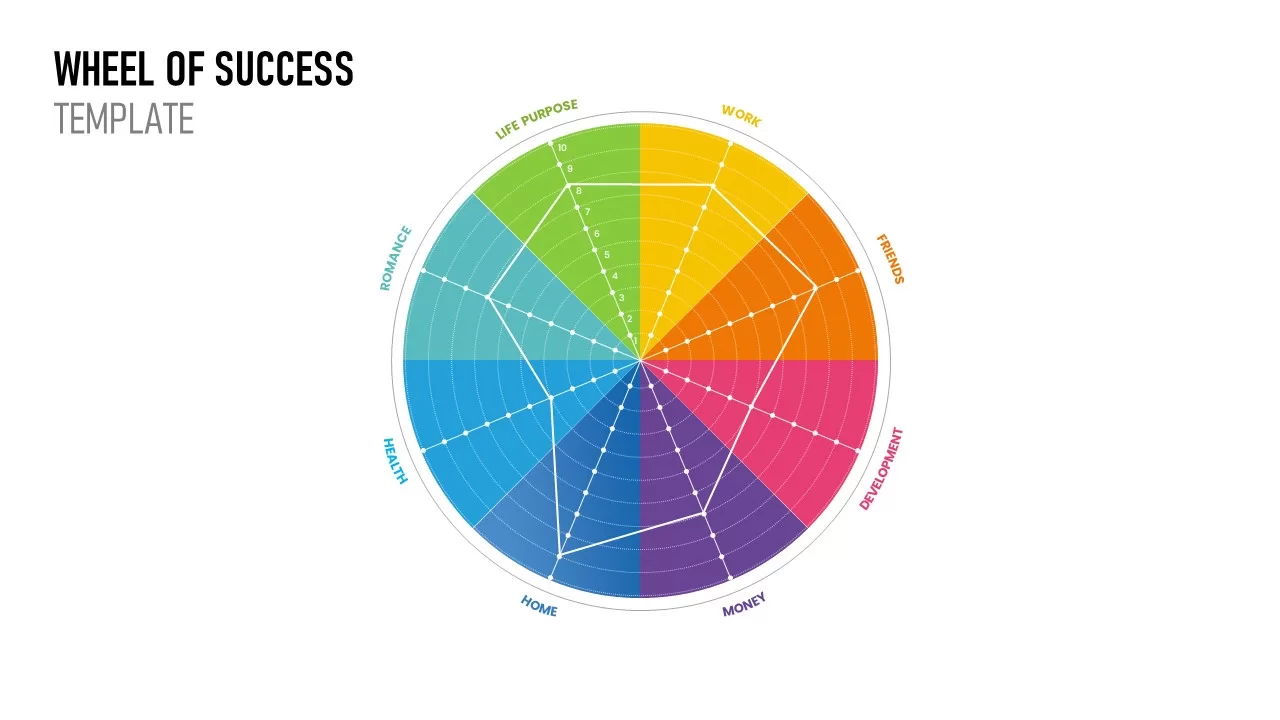
Wheel of Success Overview template for PowerPoint & Google Slides
Business Strategy
Wheel of Life template for PowerPoint & Google Slides
Business
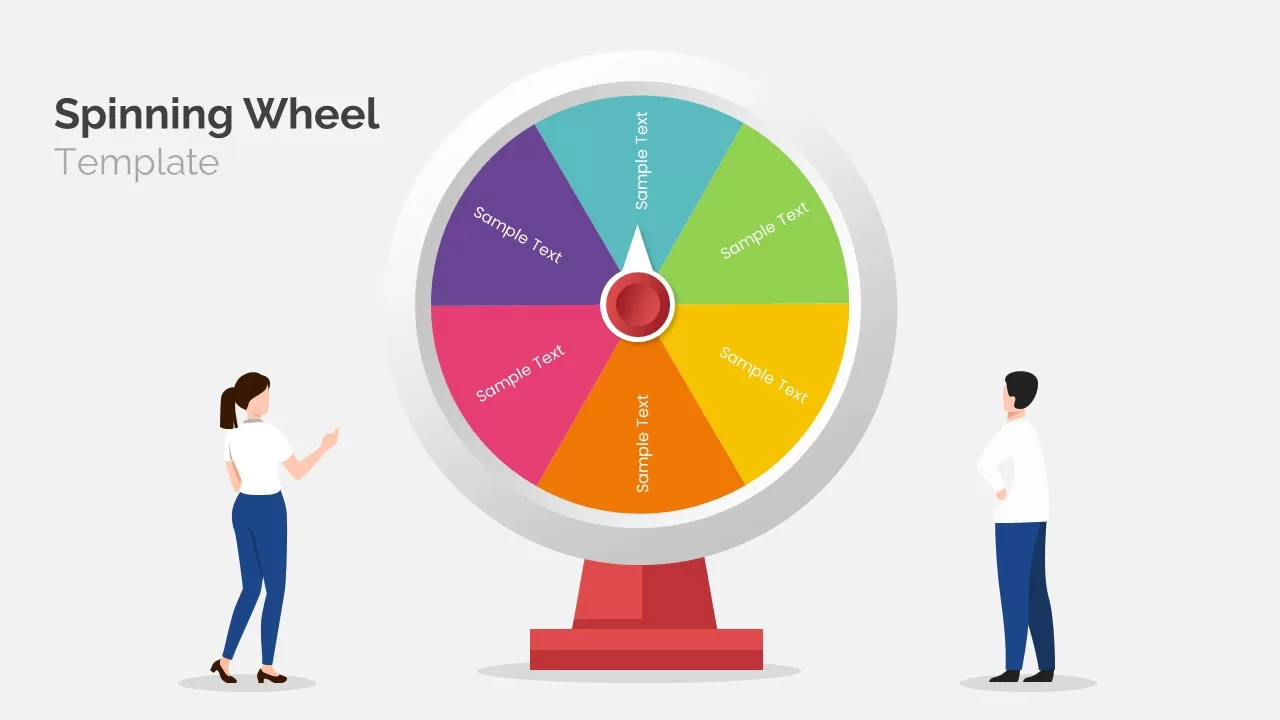
Animated spinning wheel PowerPoint Template
Circular
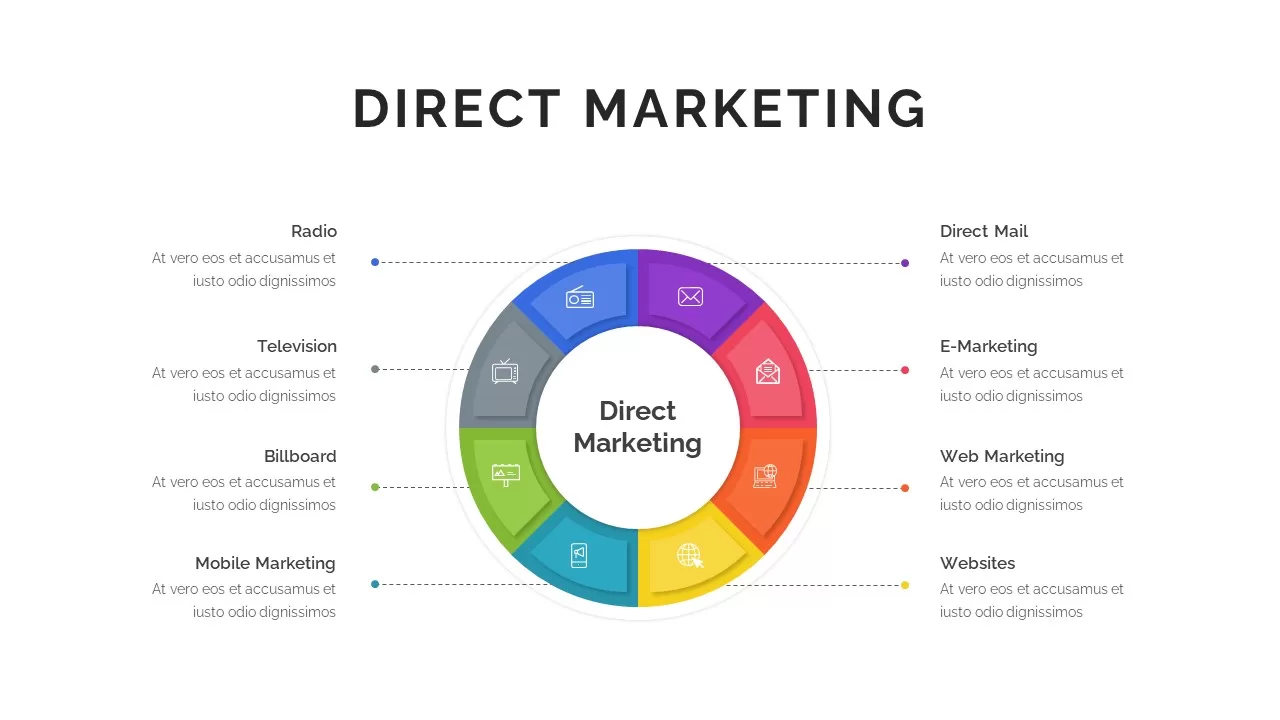
Eight-Segment Direct Marketing Wheel Template for PowerPoint & Google Slides
Circular
Wheel of Change Model template for PowerPoint & Google Slides
Business Strategy
Market Opportunity Analysis Wheel template for PowerPoint & Google Slides
Business Strategy
Resource Allocation Wheel Diagram Template for PowerPoint & Google Slides
Circular
Brand Essence Wheel Strategy Diagram Template for PowerPoint & Google Slides
Circular
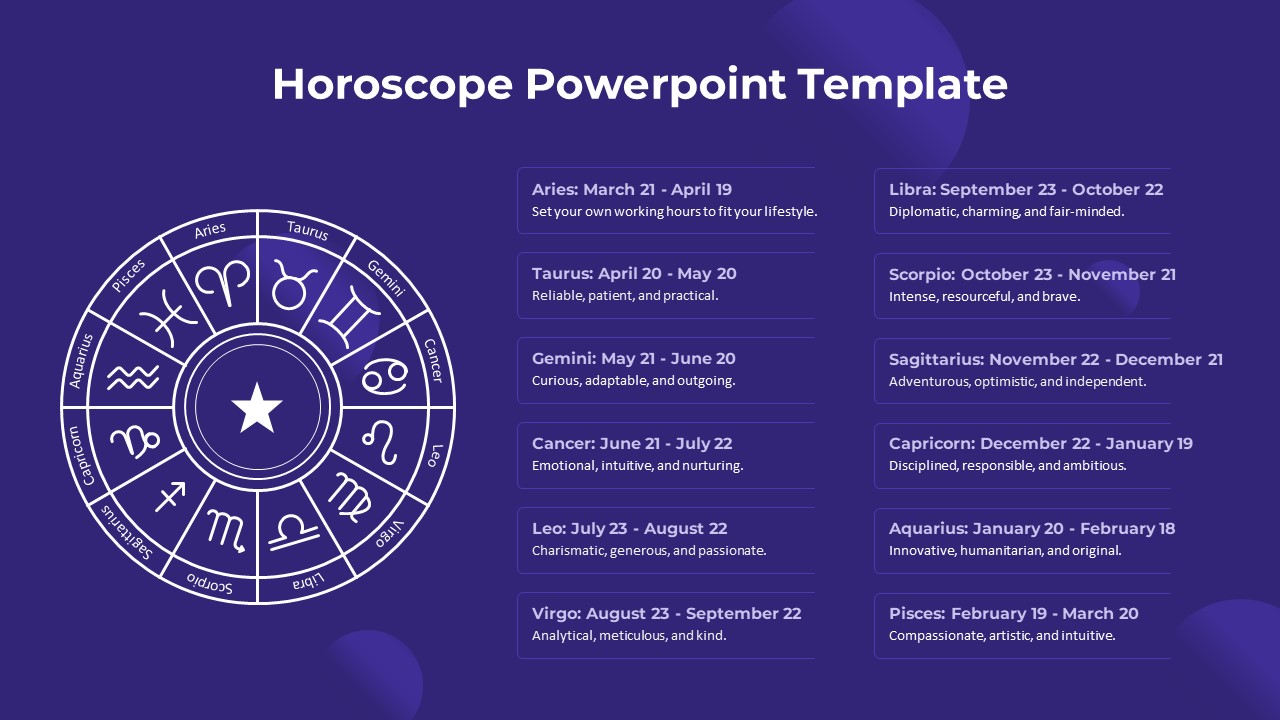
Free Zodiac Horoscope Wheel Diagram Template for PowerPoint & Google Slides
Circular
Free
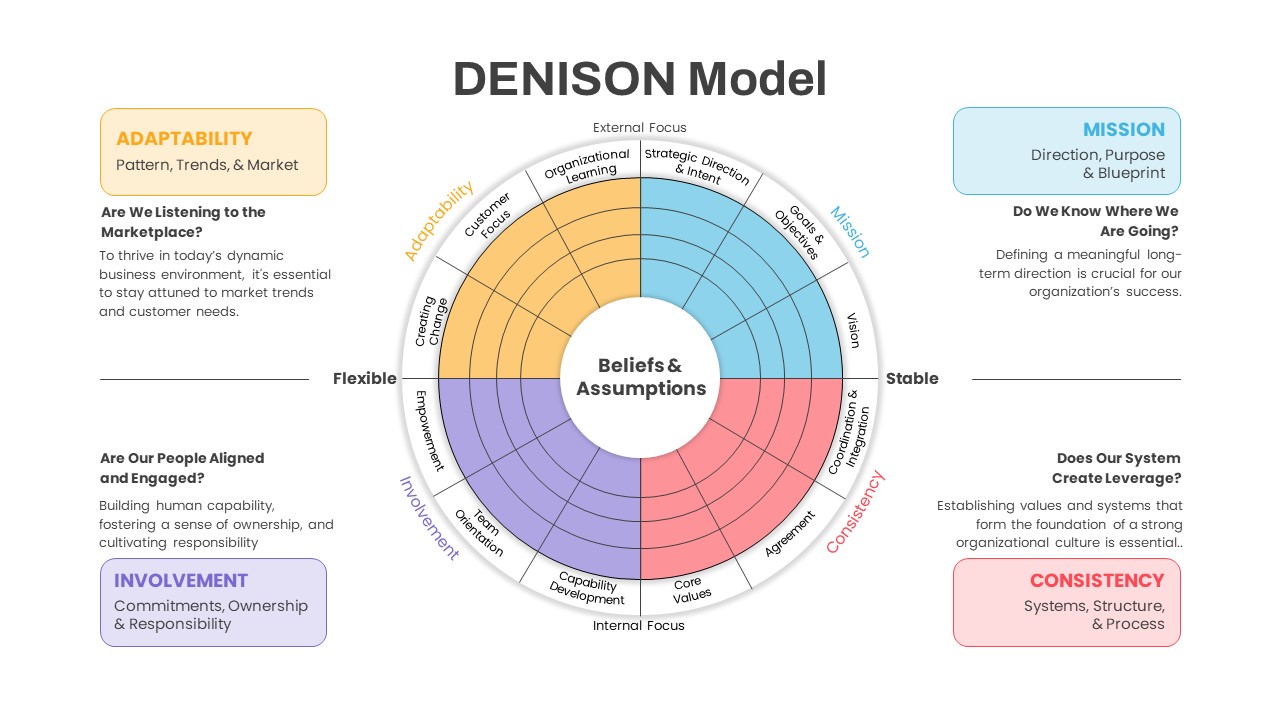
Denison Culture Model Wheel template for PowerPoint & Google Slides
Leadership
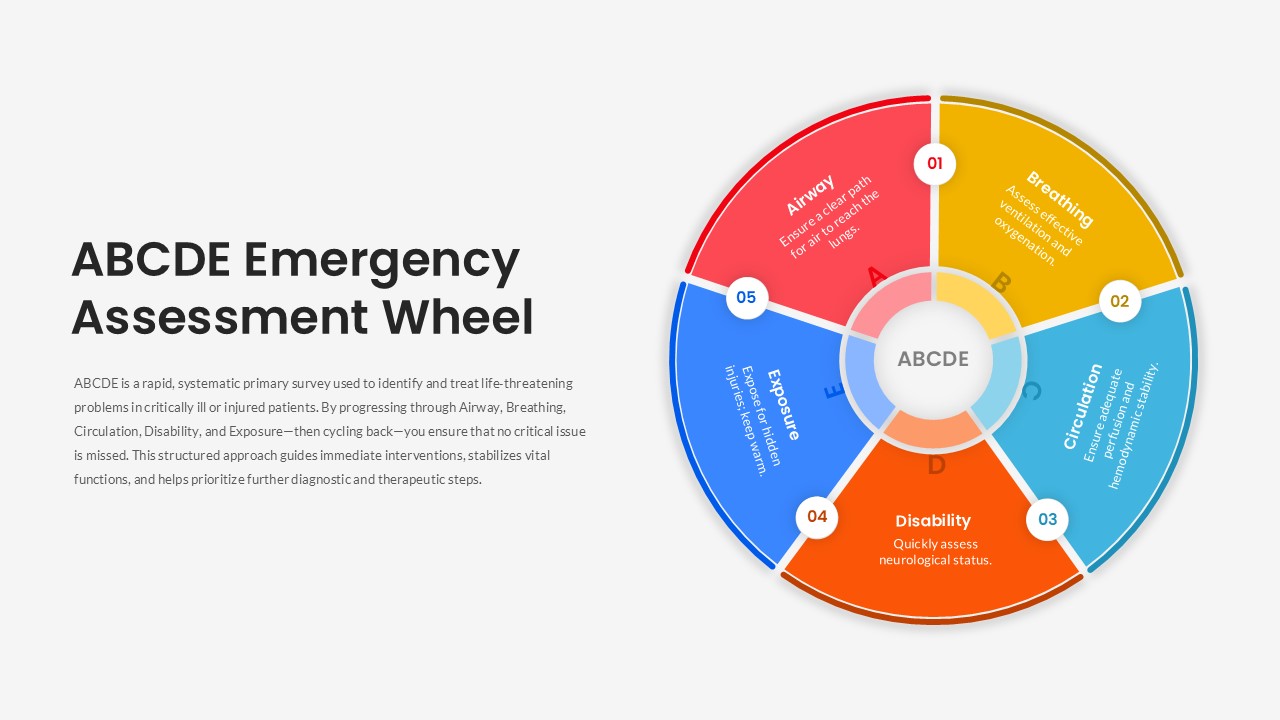
ABCDE Emergency Assessment Wheel Template for PowerPoint & Google Slides
Circular

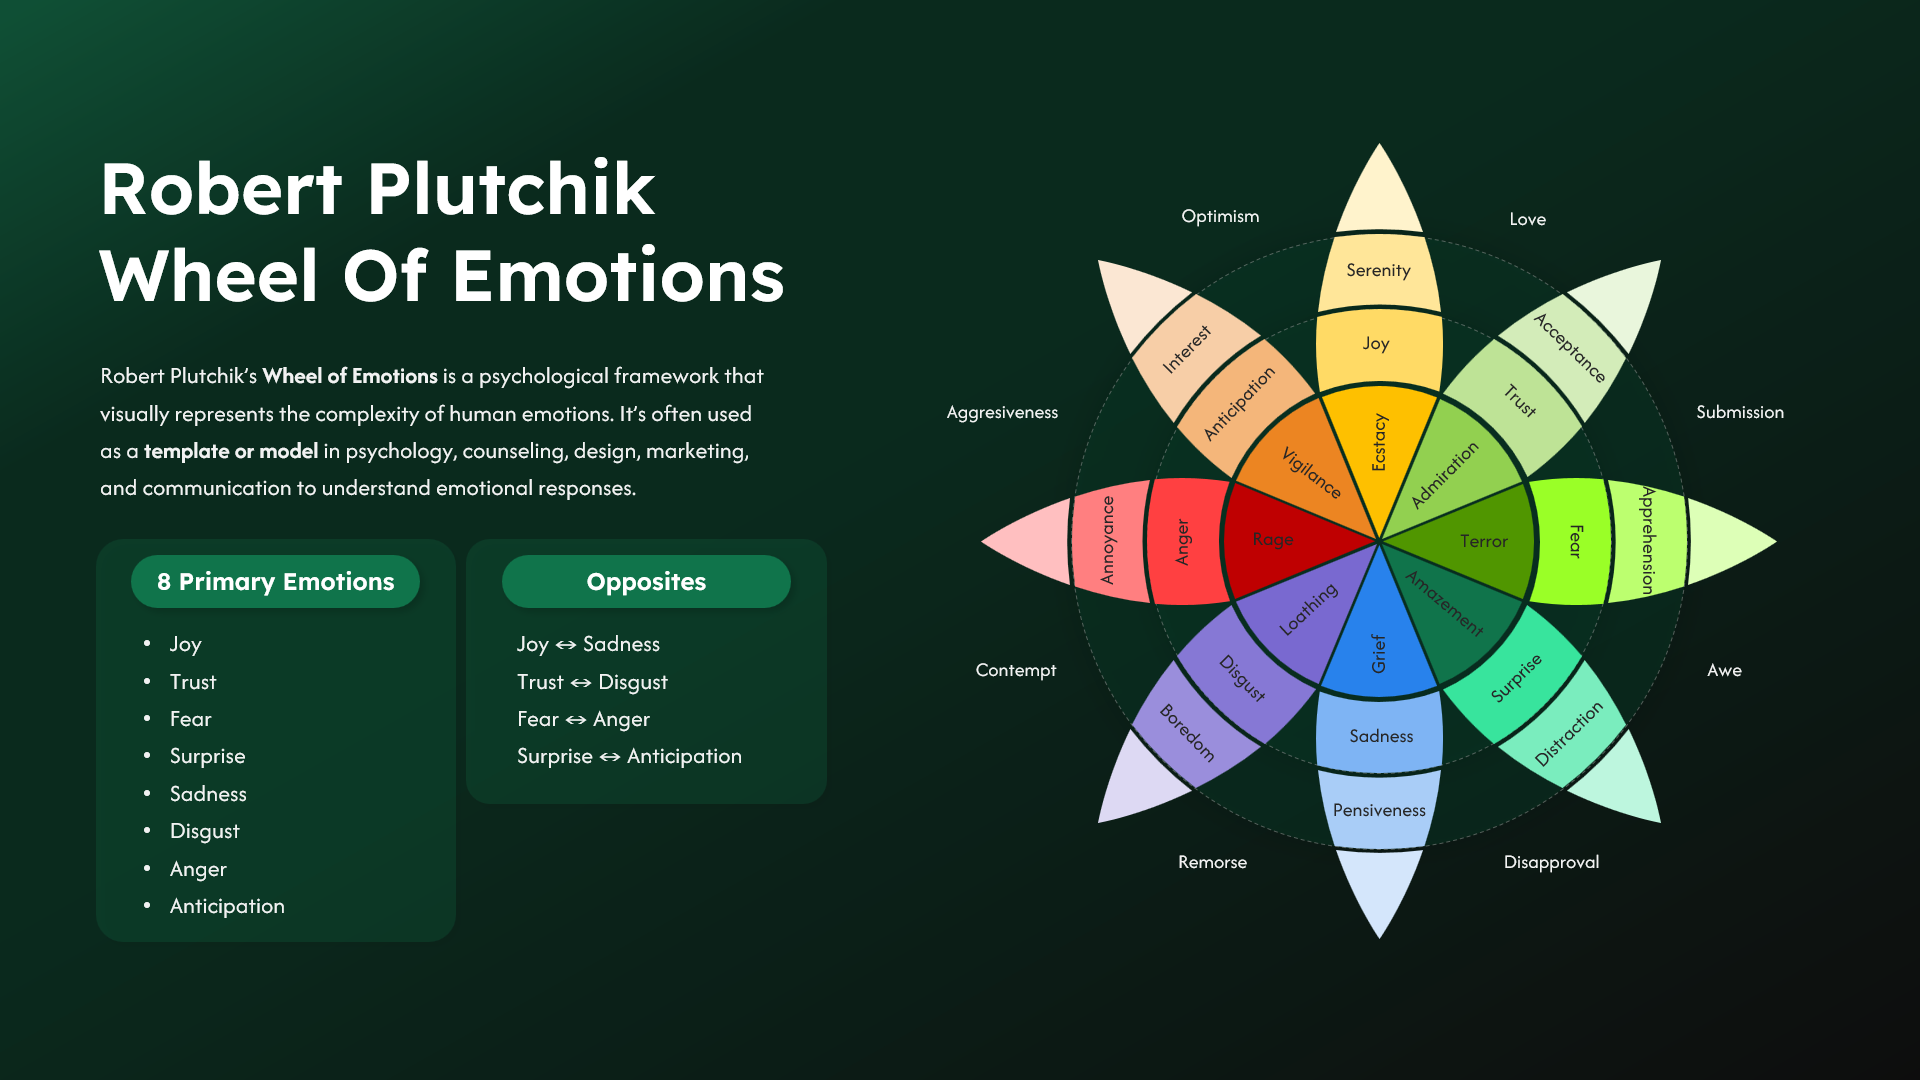
Robert Plutchik Wheel of Emotions Template for PowerPoint & Google Slides
Circular
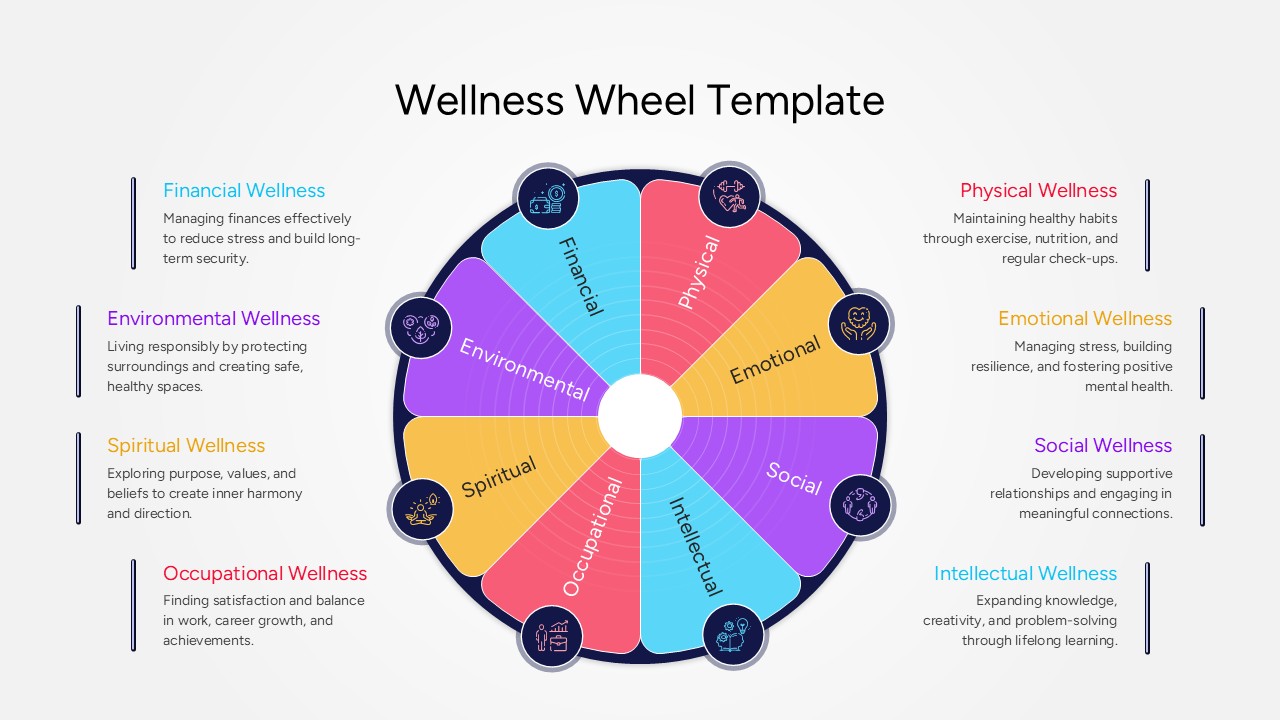
Wellness Wheel Concept Diagram Template for PowerPoint & Google Slides
Health
Free Spin the Wheel Interactive Game Template
Decks
Free