


PowerPoint Charts and Graphs for your Presentation
![]() Filter
Filter
Filter
-
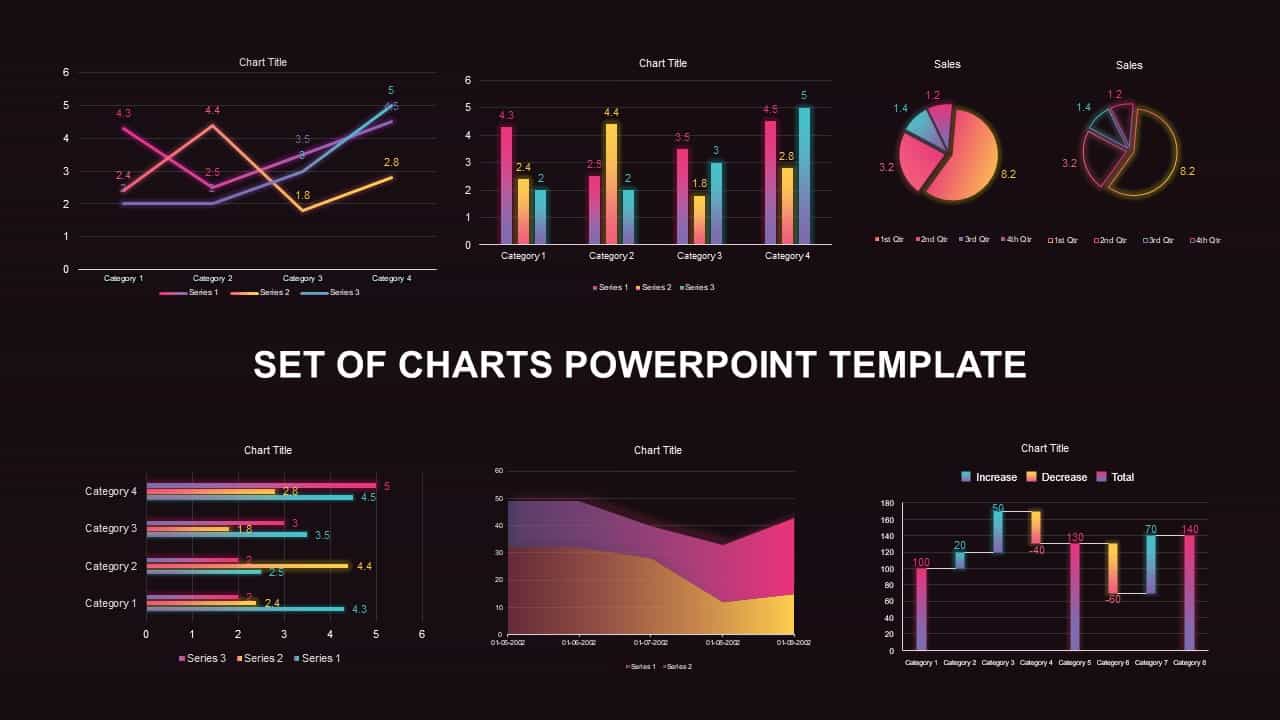
Set of Chart PowerPoint Template and Keynote Diagram
PowerPoint Charts
-
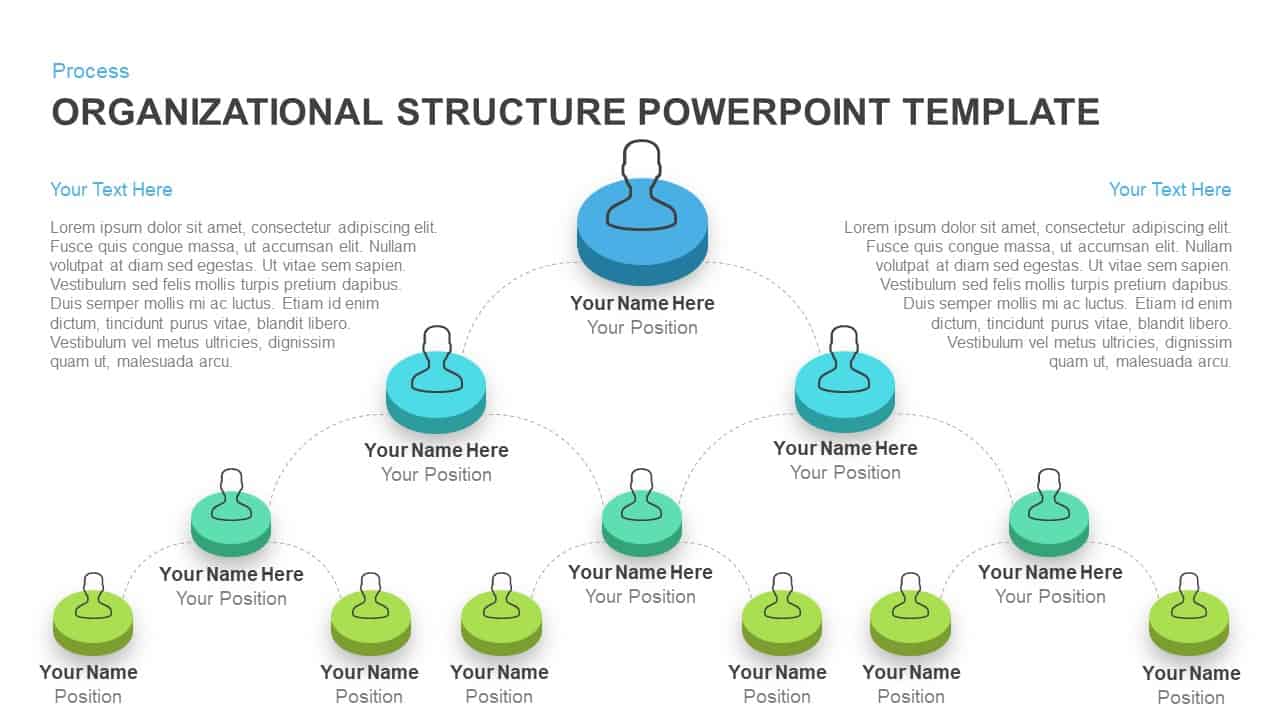
Organizational Structure Template for PowerPoint and Keynote
PowerPoint Templates
-

Tornado Chart PowerPoint template and keynote Slide
Diagrams
-

Cylinder Bar Chart PowerPoint Template and Keynote Slide
Column and Bar chart
-
Organizational Chart PowerPoint Template
Org Charts
-

Pie Chart with Social Media Market Share PowerPoint and Keynote Template
Circular Diagrams
-

Clustered Column Chart PowerPoint and Keynote Slide
PowerPoint Charts
-

Data Driven Line Chart Template for PowerPoint & Keynote
Curves and Lines
-
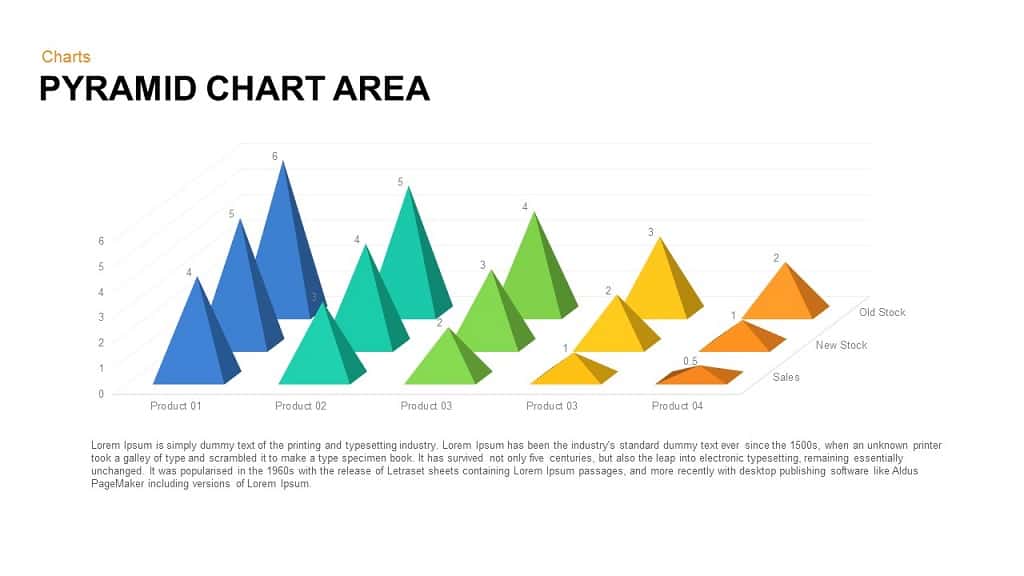
Pyramid Area Chart Template for PowerPoint and Keynote
Column and Bar chart
-

Cone Chart Data PowerPoint Template
Column and Bar chart
-

Radial Bar Chart PowerPoint Templates and Keynote Slides
PowerPoint Charts
-

3D Column Chart for PowerPoint and Keynote Presentation
PowerPoint Charts
-
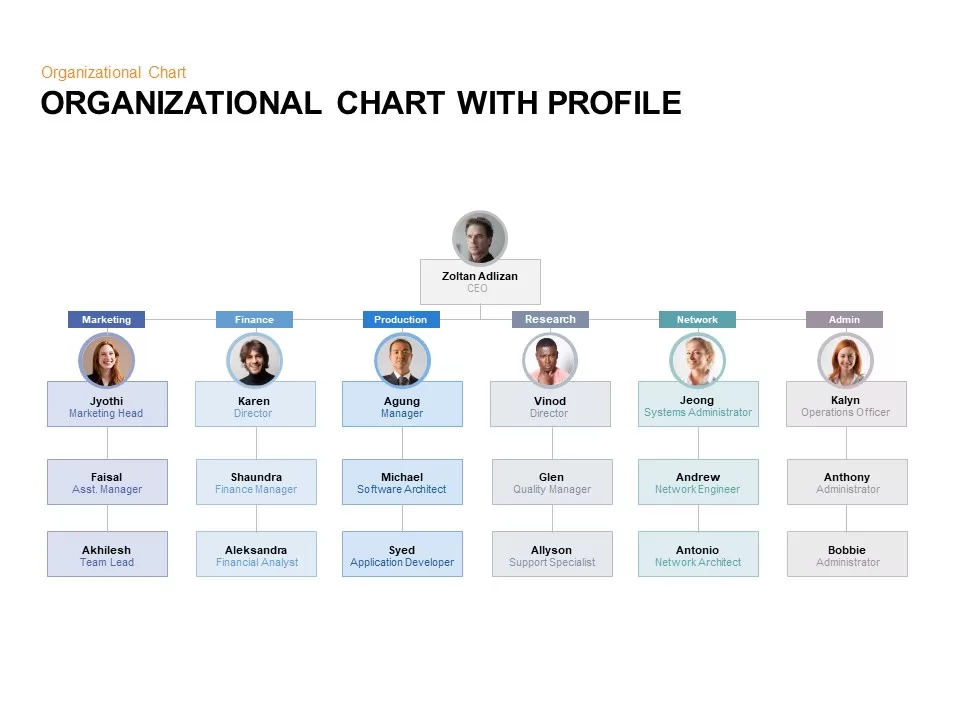
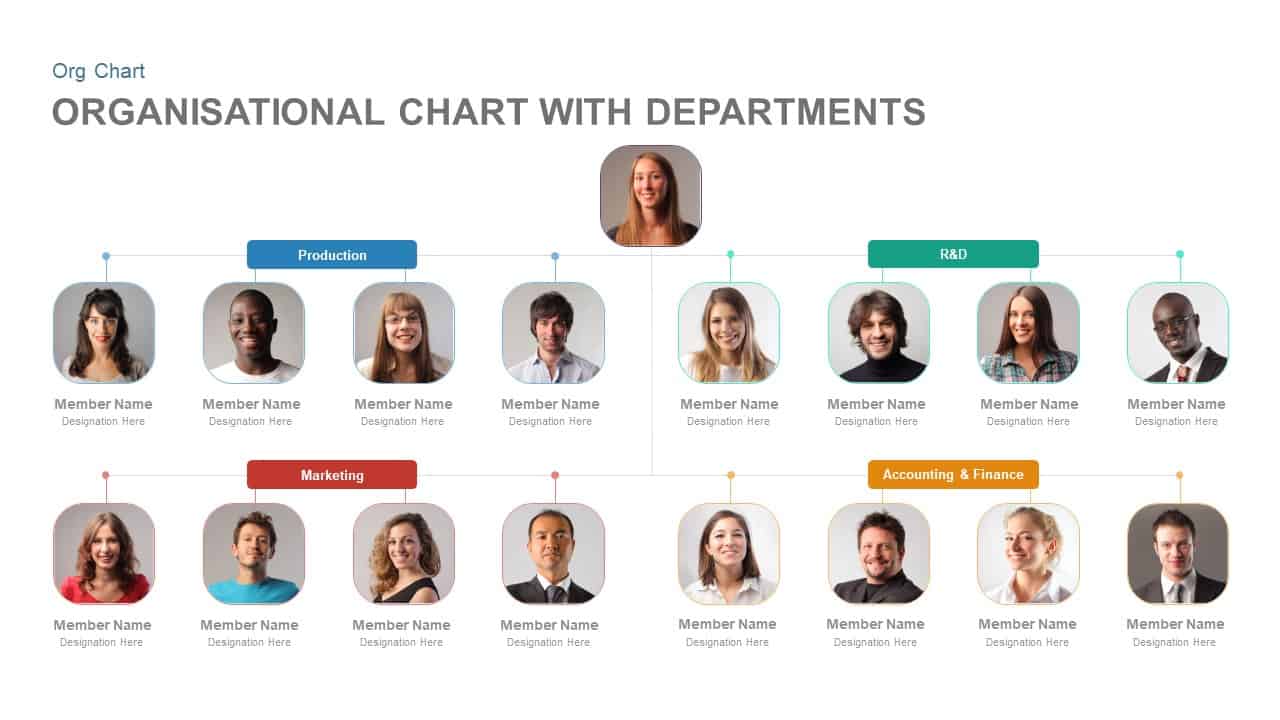
Organizational Chart with Profile PowerPoint and Keynote Template
Org Charts
-
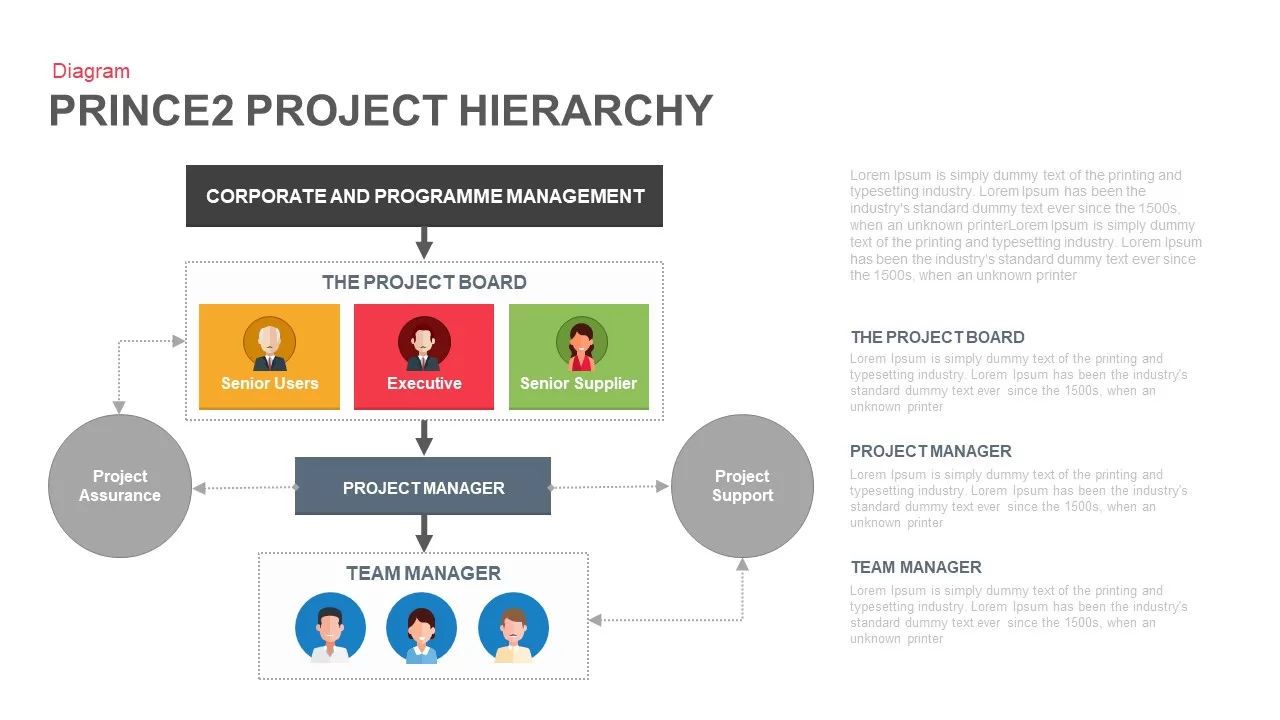
Prince2 Project Organisation Chart PowerPoint Template
Business Models
-

Line Chart Analysis PowerPoint Template and Keynote Slide
Curves and Lines
-

Sales Performance Dashboard Keynote and PowerPoint template
PowerPoint Charts
-

Weekly Data Charts PowerPoint Presentation Template and Keynote Slide
Infographic
-

Data Bar Chart Template for PowerPoint and Keynote
Column and Bar chart
-

3d Line Chart PowerPoint Template and Keynote Slide
Curves and Lines
-

Gear Pie chart PowerPoint Template and Keynote Slide
Diagrams
-

Product Comparison Bar Chart Template for PowerPoint and Keynote
PowerPoint Charts
-

Sales Vs Budget Performance Template for PowerPoint and Keynote
PowerPoint Charts
-
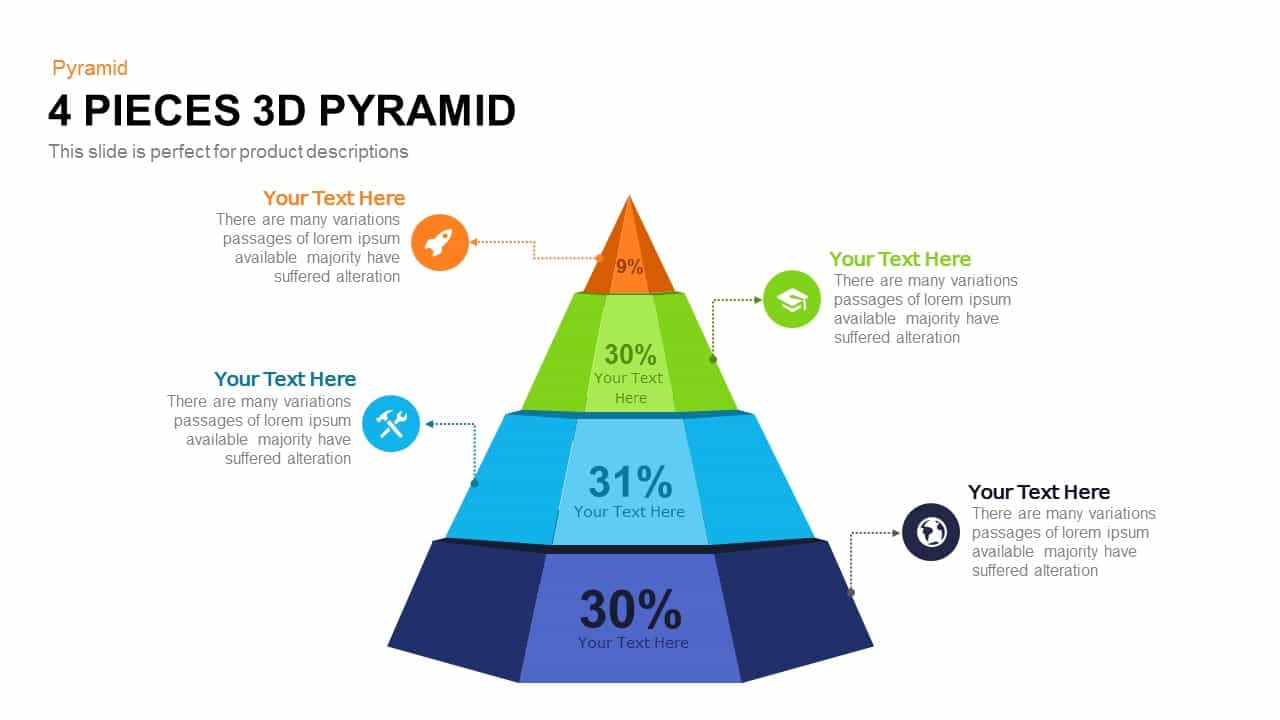
4 Pieces 3d Pyramid PowerPoint Template and Keynote Slide
Pyramid
-
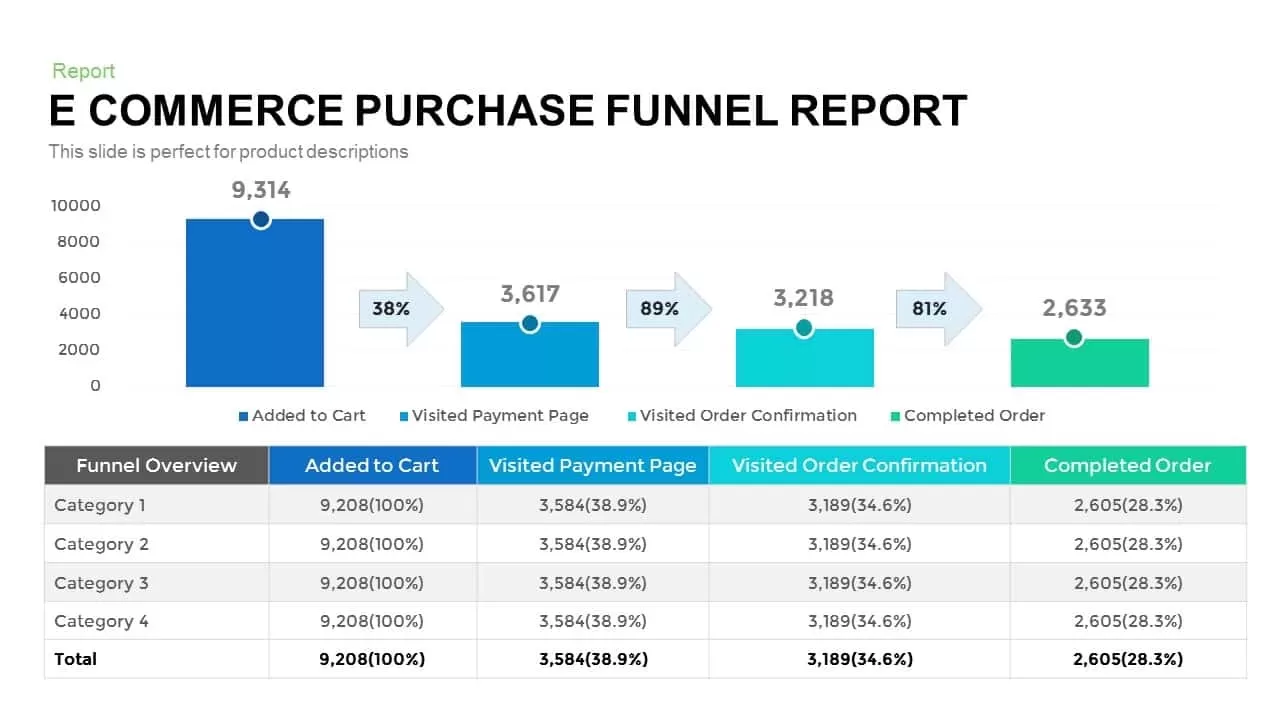
E-Commerce Purchase Funnel Report Template
Funnel Diagrams
-

Sales Bar Chart Template for PowerPoint and Keynote
Column and Bar chart
-

Curved Line Graph PowerPoint Template and Keynote
Curves and Lines
-

Radial Bar Chart Template for PowerPoint and Keynote
Circular Diagrams
-

Comparison Donut Chart PowerPoint Template and Keynote
Keynote Templates
-

Report Bar Chart PowerPoint Template and Keynote
Column and Bar chart
-

Cone Chart PowerPoint Template
Column and Bar chart
-

Gantt Chart PowerPoint Template
Keynote Templates
-
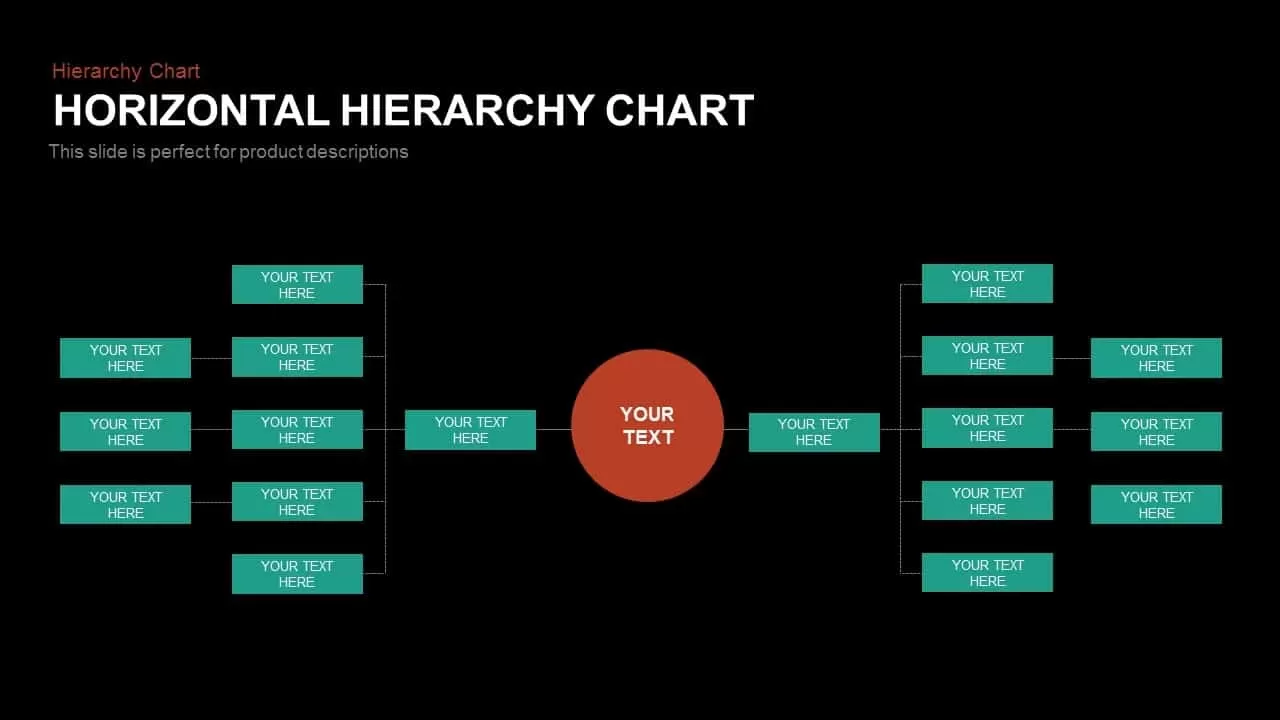
Horizontal Hierarchy Chart Template for PowerPoint and Keynote
Keynote Templates
-
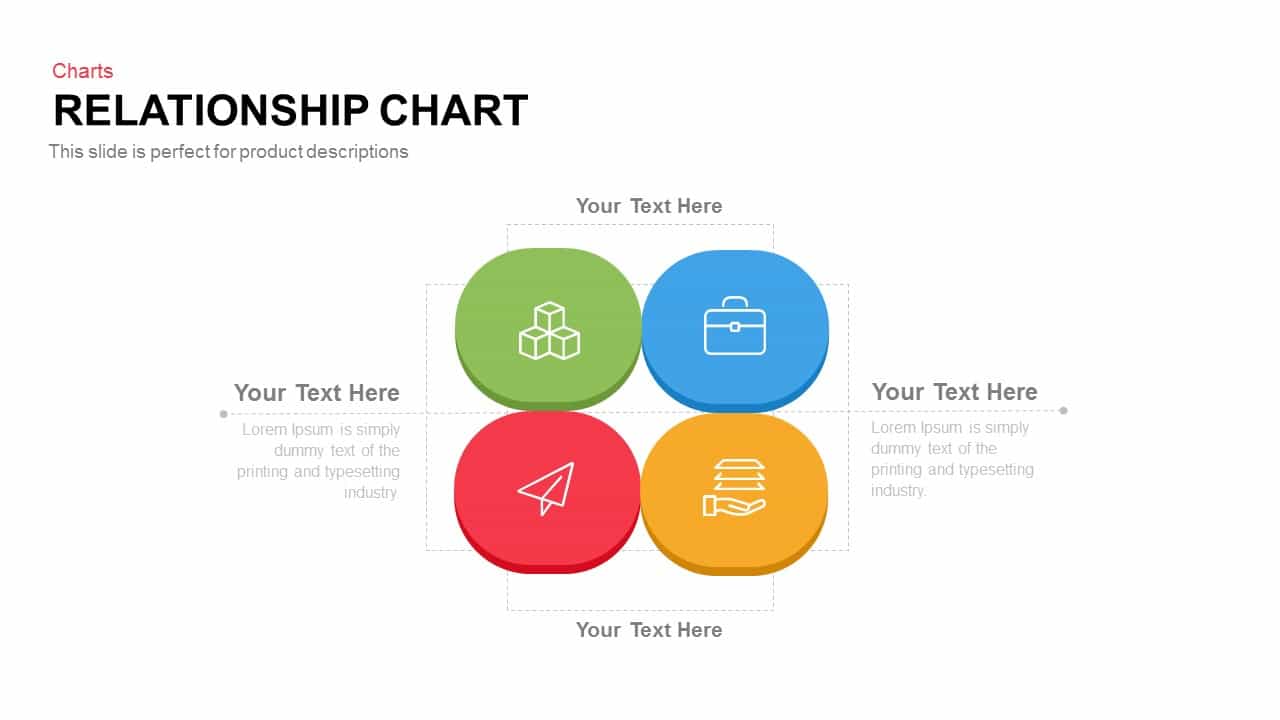
Relationship Chart PowerPoint Template and Keynote Slide
Diagrams
-
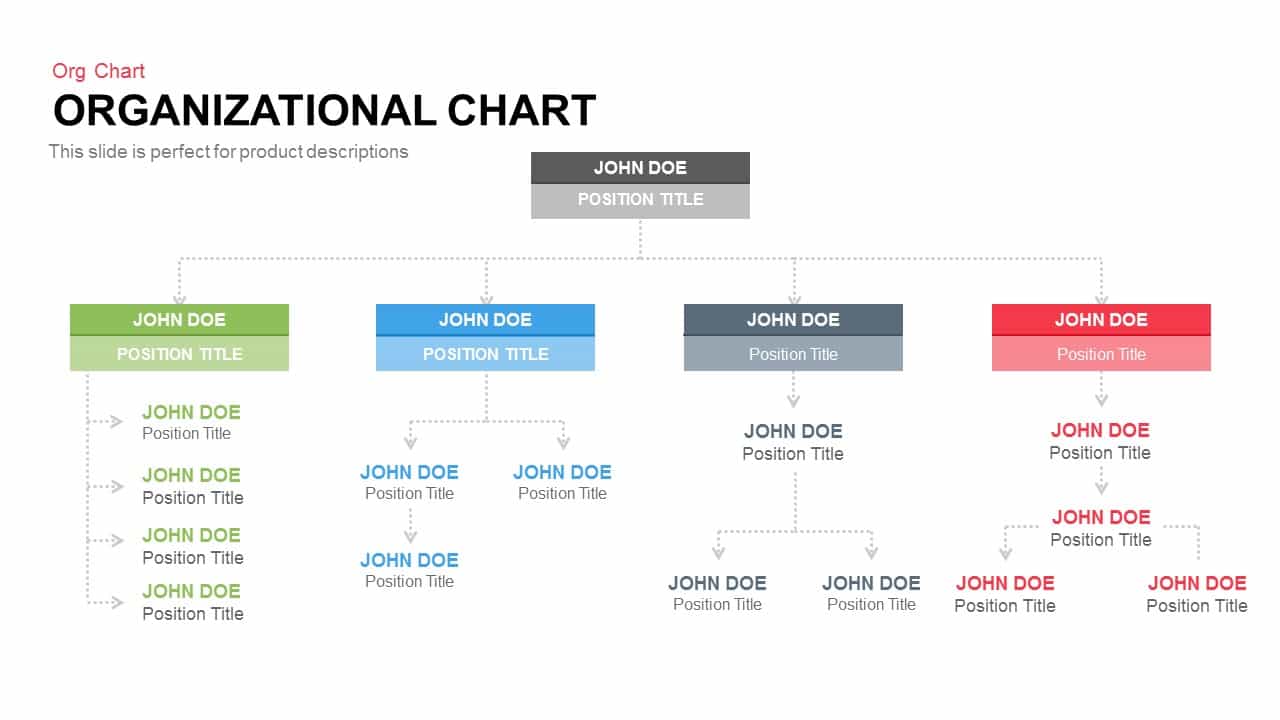
Organizational Chart PowerPoint Template and Keynote Slide
Keynote Templates
-
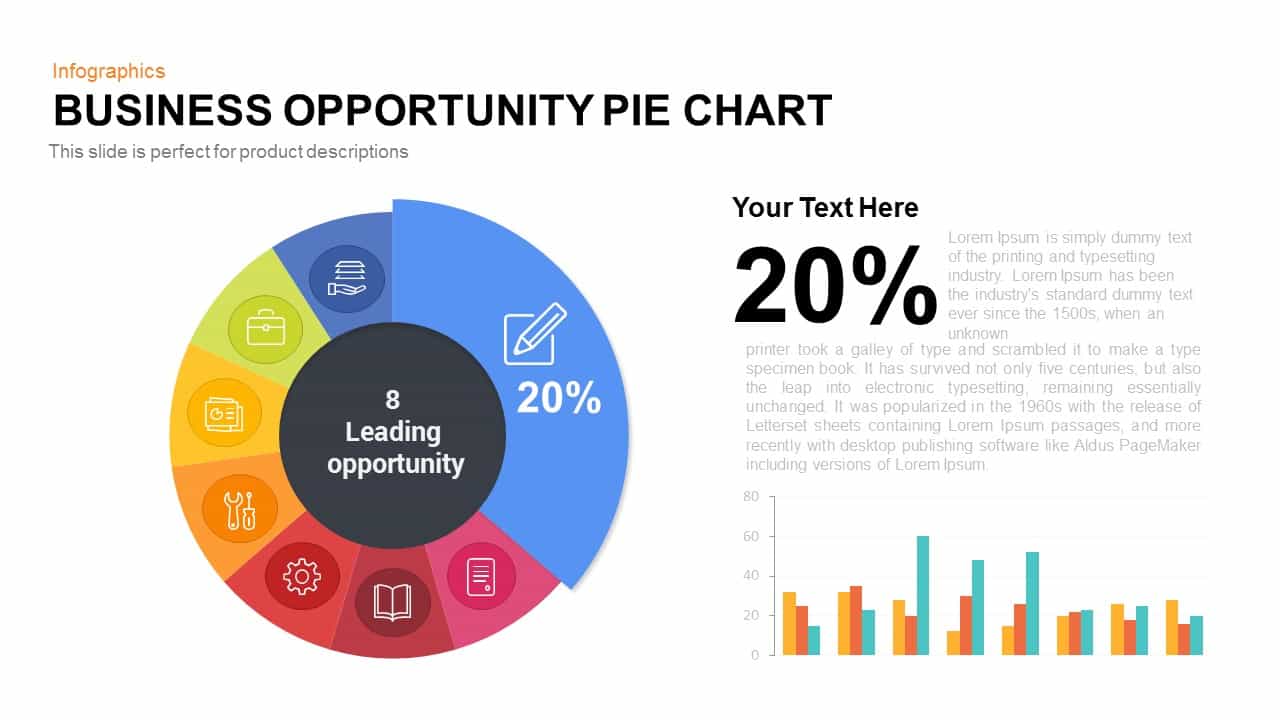
Business Opportunity PowerPoint Pie-Chart Template
Business Models