Charts Presentation Templates for PowerPoint and Google Slides
![]() Filter
Filter
Filter
-

Cost-Volume-Profit Analysis Diagram Template for PowerPoint & Google Slides
Finance
-

Free Competitor Analysis Matrix Template for PowerPoint & Google Slides
Competitor Analysis
Free
-
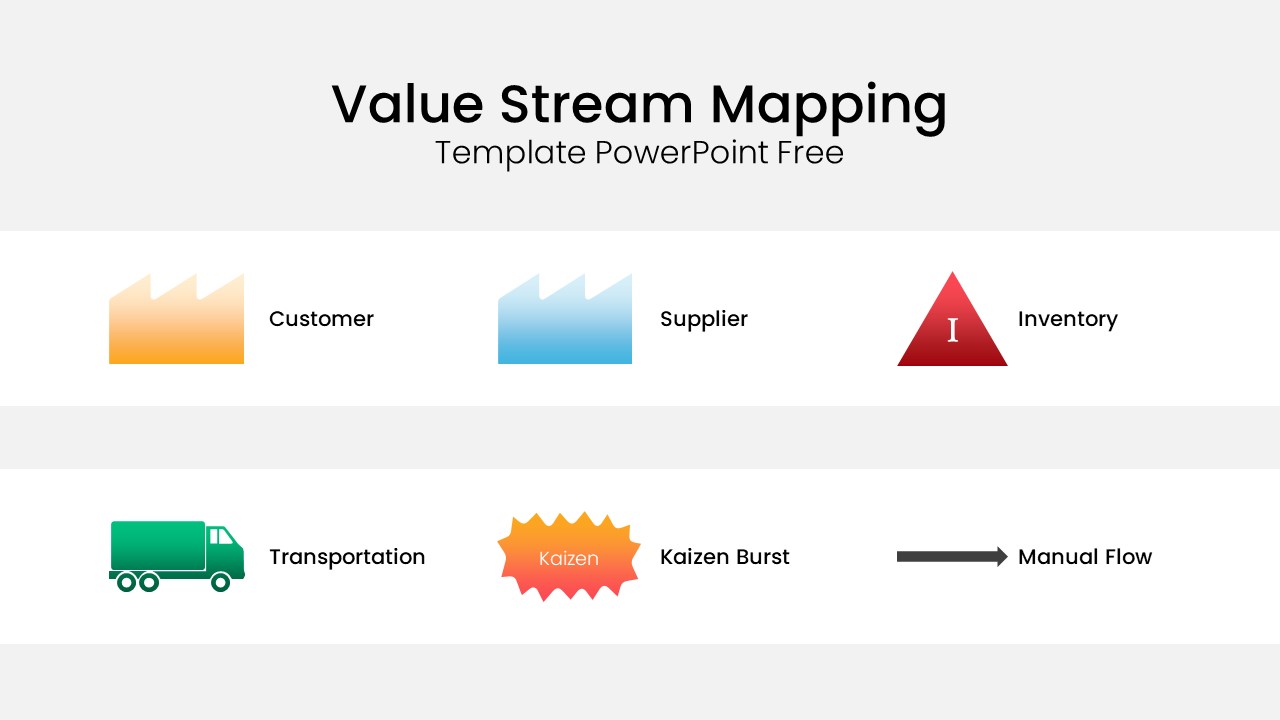
Value Stream Mapping Symbol Legend Template for PowerPoint & Google Slides
Charts
Free
-
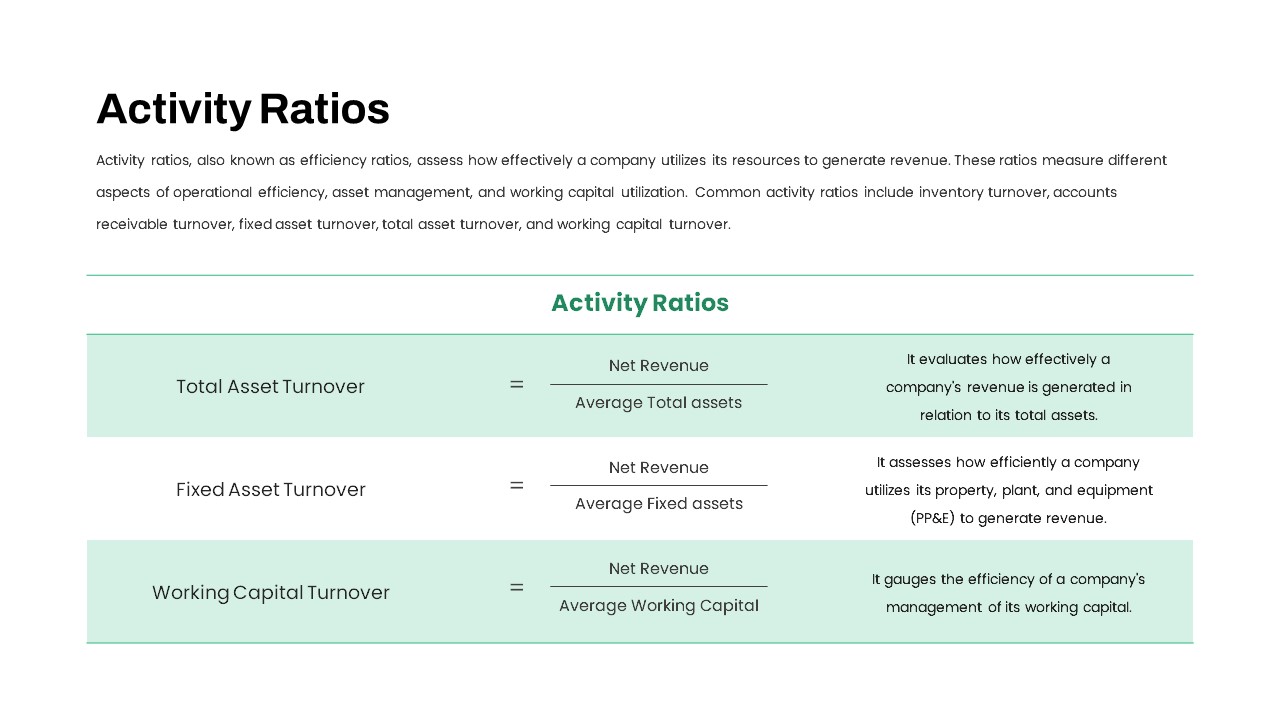
Activity Ratios Formula Table Slide Template for PowerPoint & Google Slides
Comparison Chart
-
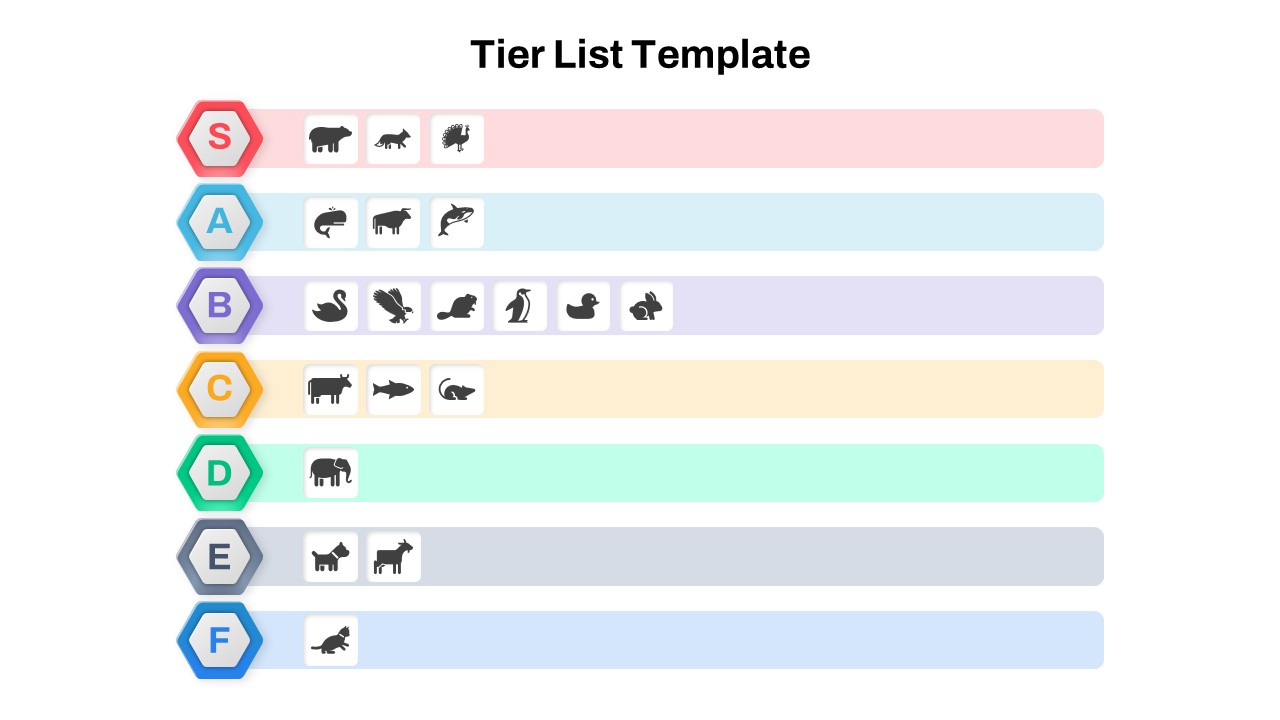
Modern Tier List Template for PowerPoint & Google Slides
Comparison
-

Bubble Chart Scatter, Diagram & Matrix Template for PowerPoint & Google Slides
Comparison Chart
-
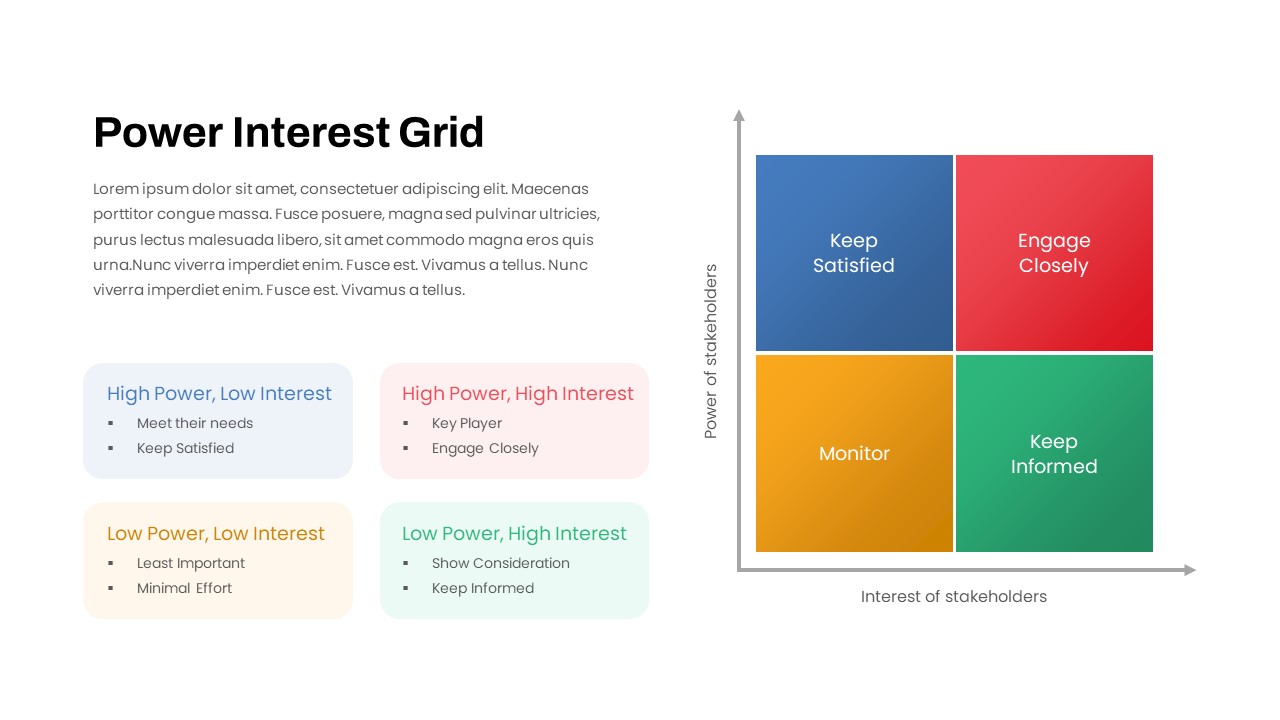
Stakeholder Power Interest Grid Template for PowerPoint & Google Slides
Comparison
-

Dynamic Bar-of-Pie Chart Comparison Template for PowerPoint & Google Slides
Pie/Donut
-

Free Global Warming Infographic Comparison Template for PowerPoint & Google Slides
Comparison Chart
Free
-

Proportional Area Chart Analysis Template for PowerPoint & Google Slides
Comparison Chart
-

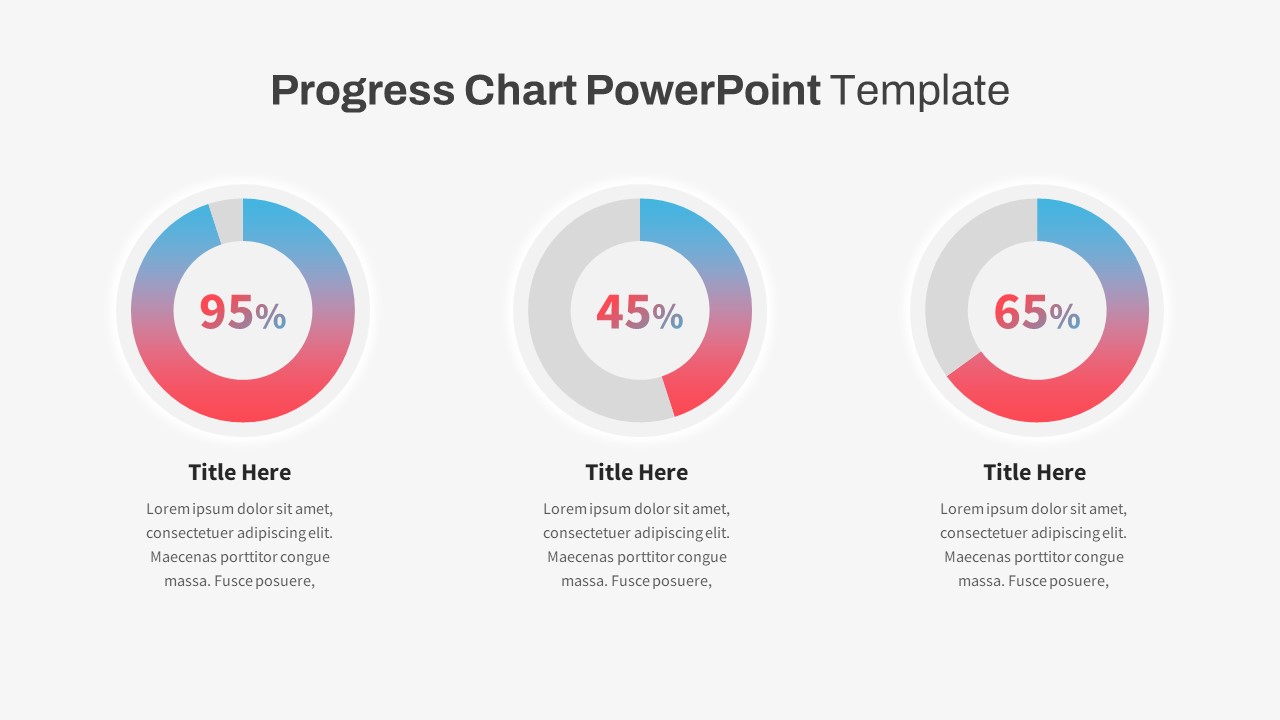
Progress Chart Slide for PowerPoint & Google Slides
Charts
-
Segmented Pie Chart Infographic with Icons for PowerPoint & Google Slides
Pie/Donut
-
Free Infographic Statistics Dashboard Slide for PowerPoint & Google Slides
Bar/Column
Free
-
Segmented Scatter Chart Data Visualization Template for PowerPoint & Google Slides
Business Strategy
-
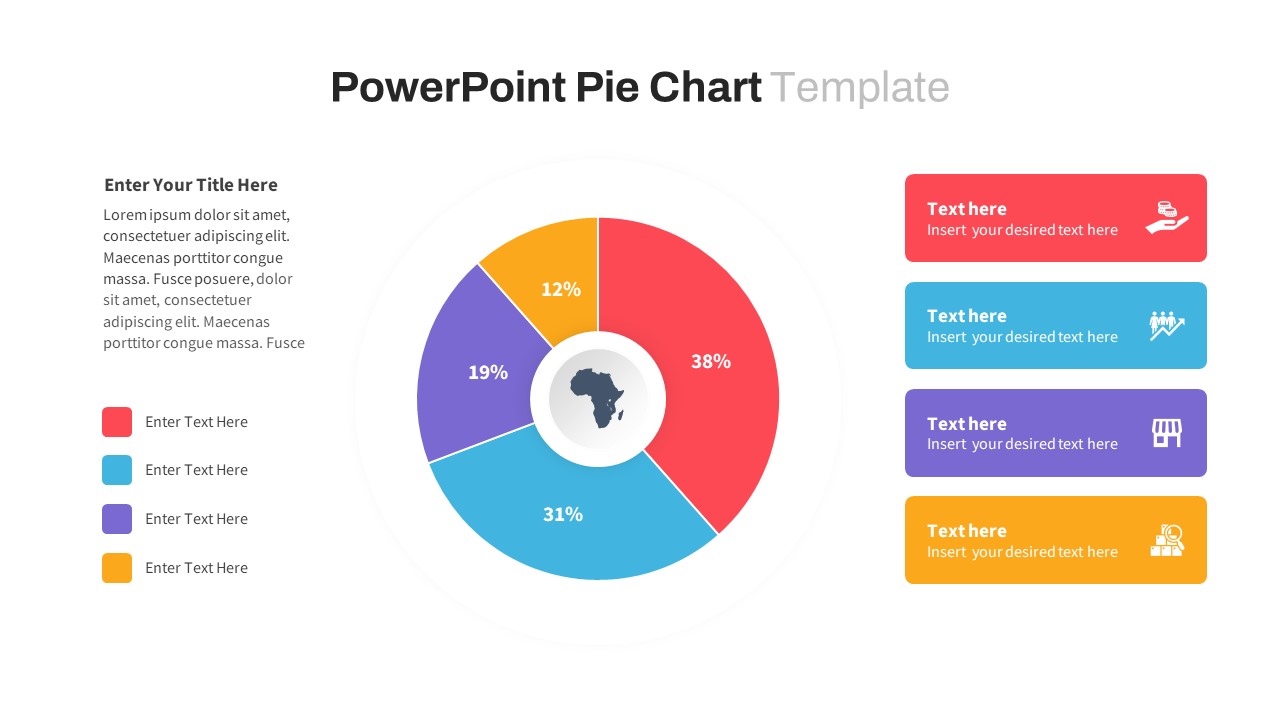
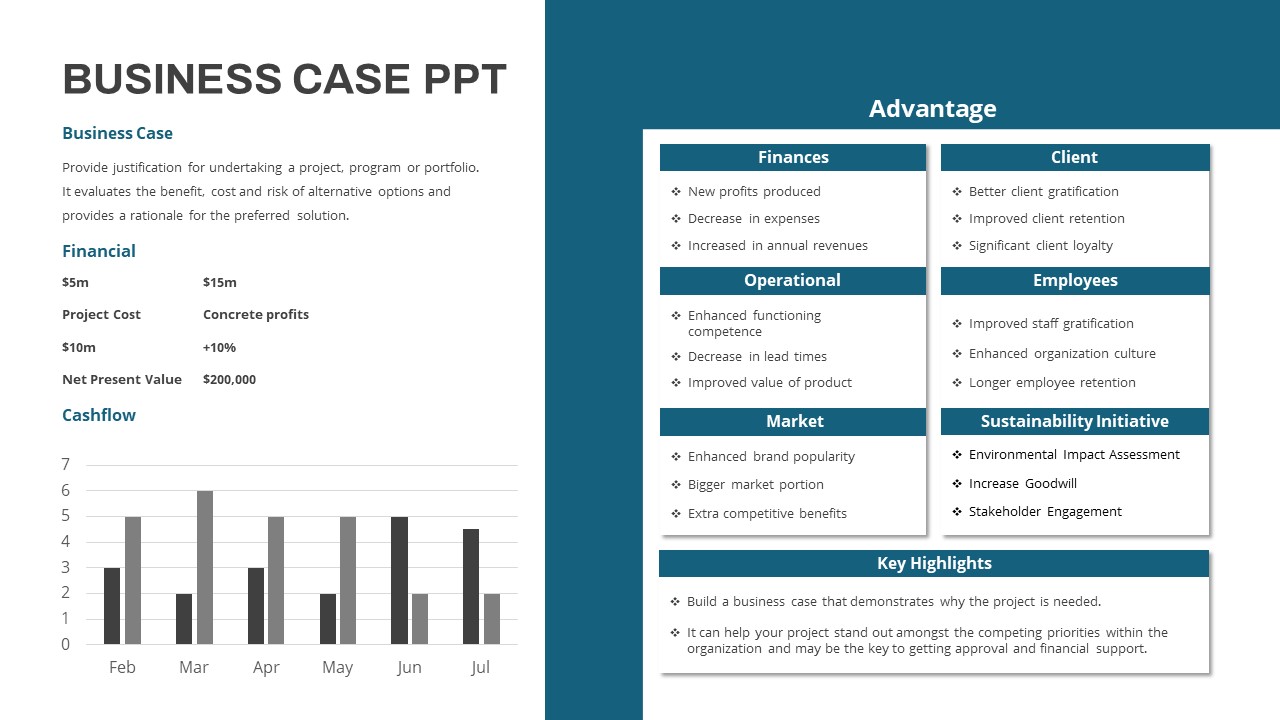
Comprehensive Business Case Presentation Template for PowerPoint & Google Slides
Pie/Donut
-
Cost Cutting Savings Dashboard Template for PowerPoint & Google Slides
Pie/Donut
-
Interactive Jump Line Data Chart Template for PowerPoint & Google Slides
Comparison Chart
-
Multi-Level Wheel Chart Diagram template for PowerPoint & Google Slides
Pie/Donut
-
Dynamic Sunburst Chart Visualization Template for PowerPoint & Google Slides
Charts
-
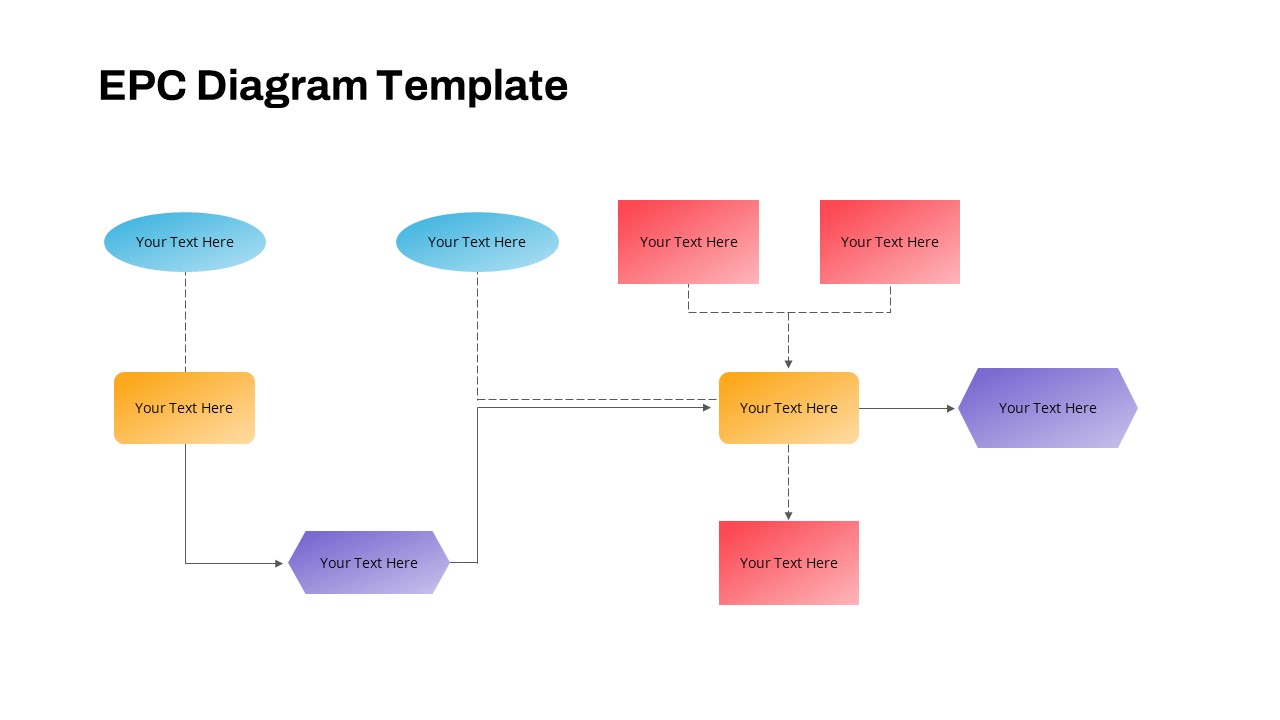
EPC Diagram Template for PowerPoint & Google Slides
Flow Charts
-
Free KPI Dashboard PowerPoint Template for PowerPoint & Google Slides
Charts
Free
-
Quad Chart Infographic Pack of 8 Slides Template for PowerPoint & Google Slides
Comparison Chart
-
Modern Multi-Color Polar Chart Diagram Template for PowerPoint & Google Slides
Charts
-
Advanced Data Flow Diagram Pack Template for PowerPoint & Google Slides
Flow Charts
-

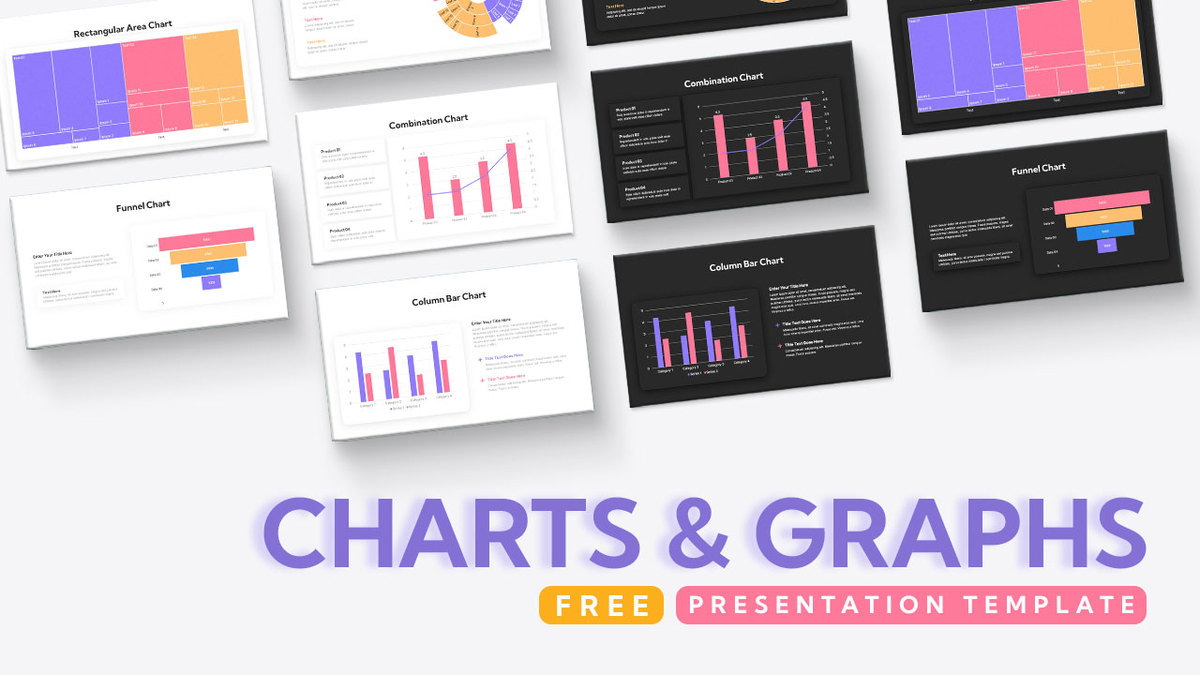
Free Comprehensive Charts & Graphs Template for PowerPoint & Google Slides
Charts
Free
-
Wastewater Treatment Process Flow Chart Template for PowerPoint & Google Slides
Flow Charts
-
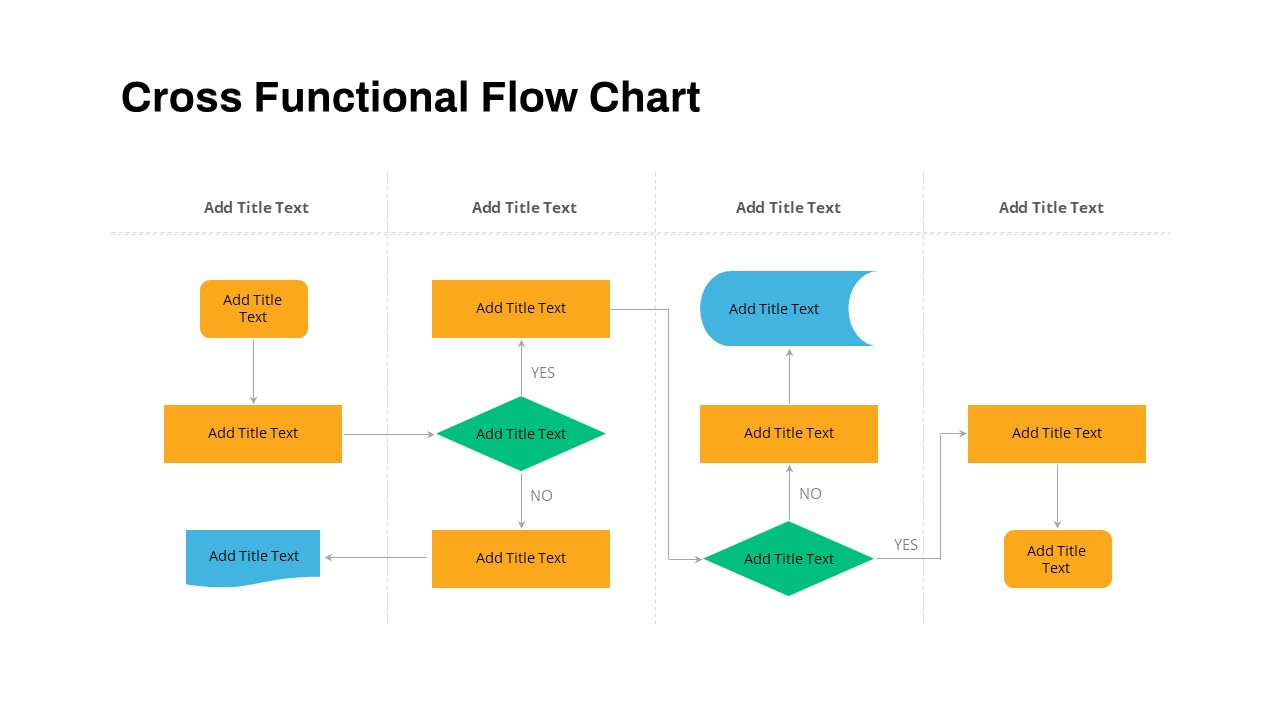
Cross Functional Swimlane Flow Chart Template for PowerPoint & Google Slides
Flow Charts
-
Multipurpose Spline Chart Data Trend Template for PowerPoint & Google Slides
Bar/Column
-
Mirror Bar Chart Comparison Template for PowerPoint & Google Slides
Bar/Column
-
Dynamic Three-Series Stacked Area Chart Template for PowerPoint & Google Slides
Comparison Chart
-
Stacked Waterfall Chart Template for PowerPoint & Google Slides
Bar/Column
-
Multi-Variation Thermometer Chart Template for PowerPoint & Google Slides
Bar/Column
-

Free PowerPoint Jeopardy Template with Scoring
Comparison Chart
Free
-
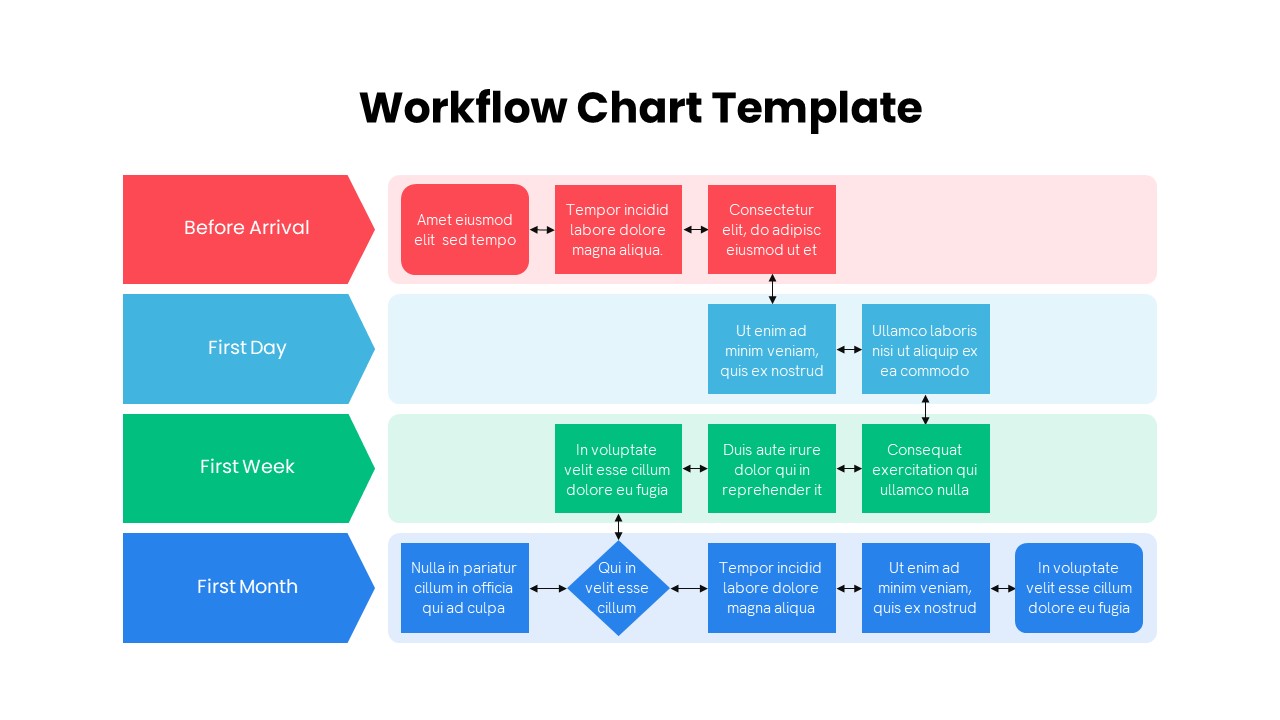
Colorful Multistage Workflow Chart Template for PowerPoint & Google Slides
Flow Charts
-
Multi-Series Vertical Dot Chart Template for PowerPoint & Google Slides
Comparison Chart