PowerPoint Charts and Graphs Templates
![]() Filter
Filter
Filter
-

Blank Bar Graph Template for PowerPoint & Google Slides
Bar/Column
-

Six Column Data Table Template for PowerPoint & Google Slides
Table
-

Three Segment Donut Chart KPI Infographic Template for PowerPoint & Google Slides
Pie/Donut
-
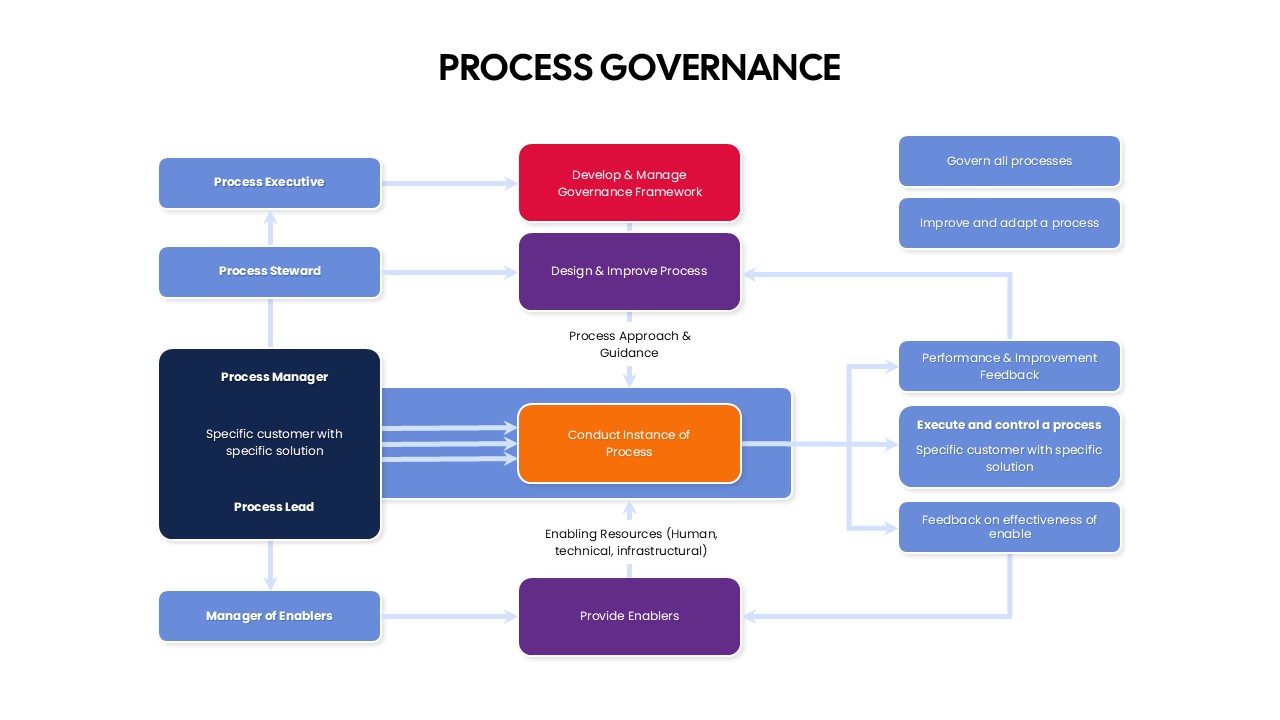
Process Governance Framework Flowchart Template for PowerPoint & Google Slides
Flow Charts
-
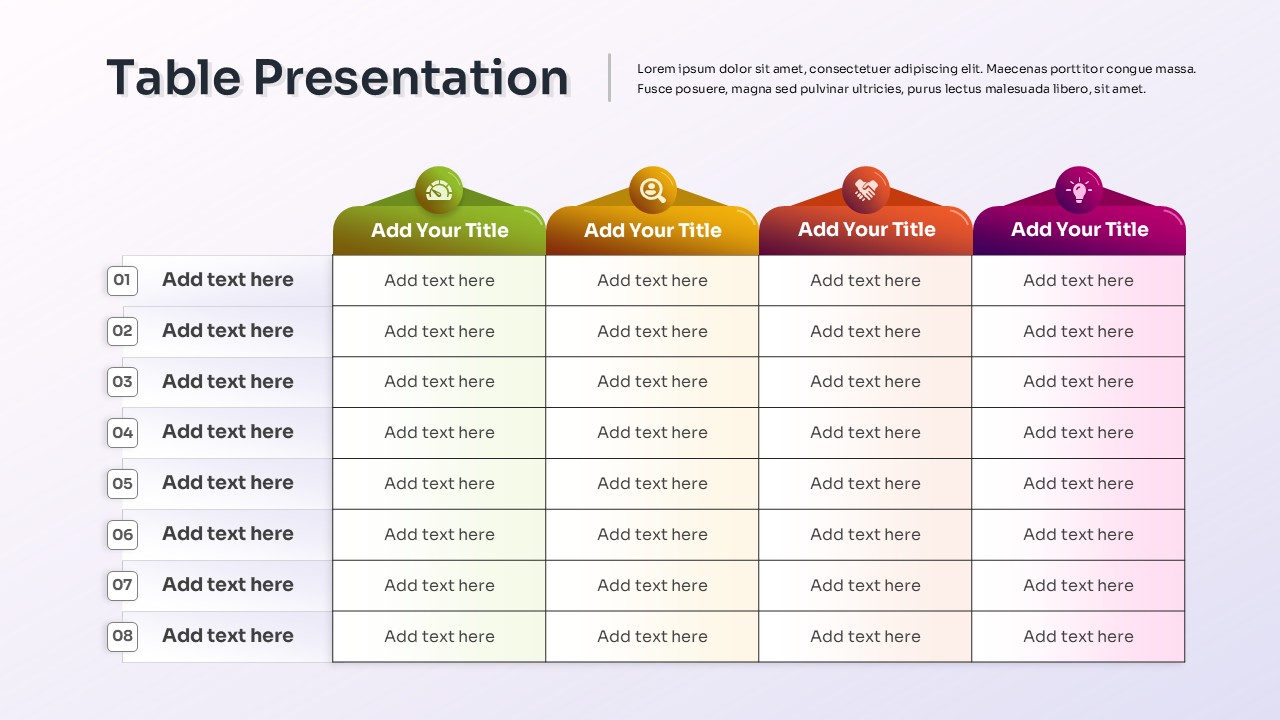
Colorful Table Presentation Template for PowerPoint & Google Slides
Table
-
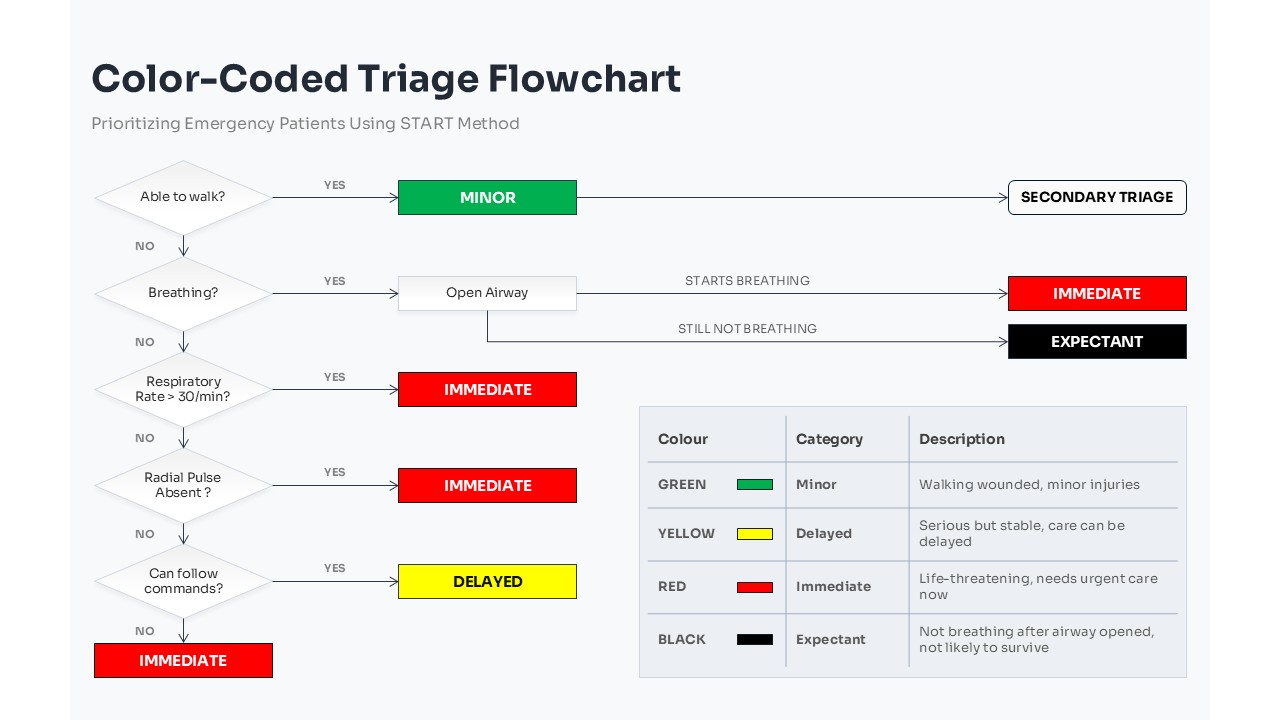
Color-Coded Medical Triage Flowchart Template for PowerPoint & Google Slides
Flow Charts
-

Pros and Cons Comparison Table Template for PowerPoint & Google Slides
Comparison Chart
-

Quarterly Comparison Pie Chart Template for PowerPoint & Google Slides
Pie/Donut
-
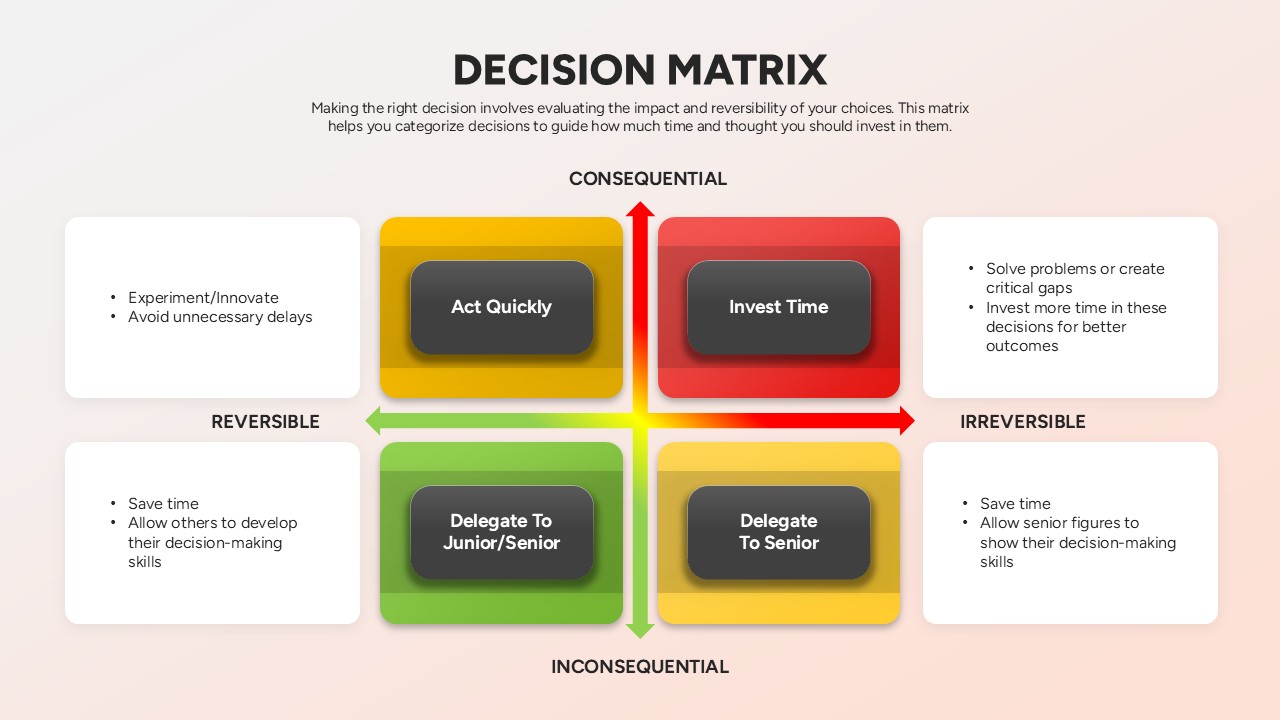
Decision Matrix Evaluation Framework Slide Template for PowerPoint & Google Slides
Leadership
-

Five Column Comparison Table Layout Template for PowerPoint & Google Slides
Comparison
-

Colorful Four-Column Table Layout Template for PowerPoint & Google Slides
Table
-
USA Map with Bar Chart Template for PowerPoint & Google Slides
World Maps
-
Horizontal Organizational Chart Template for PowerPoint & Google Slides
Org Chart
-
Colorful Business Data Comparison Table Template for PowerPoint & Google Slides
Table
-
Cohort Analysis Retention Dashboard Template for PowerPoint & Google Slides
Comparison Chart
-
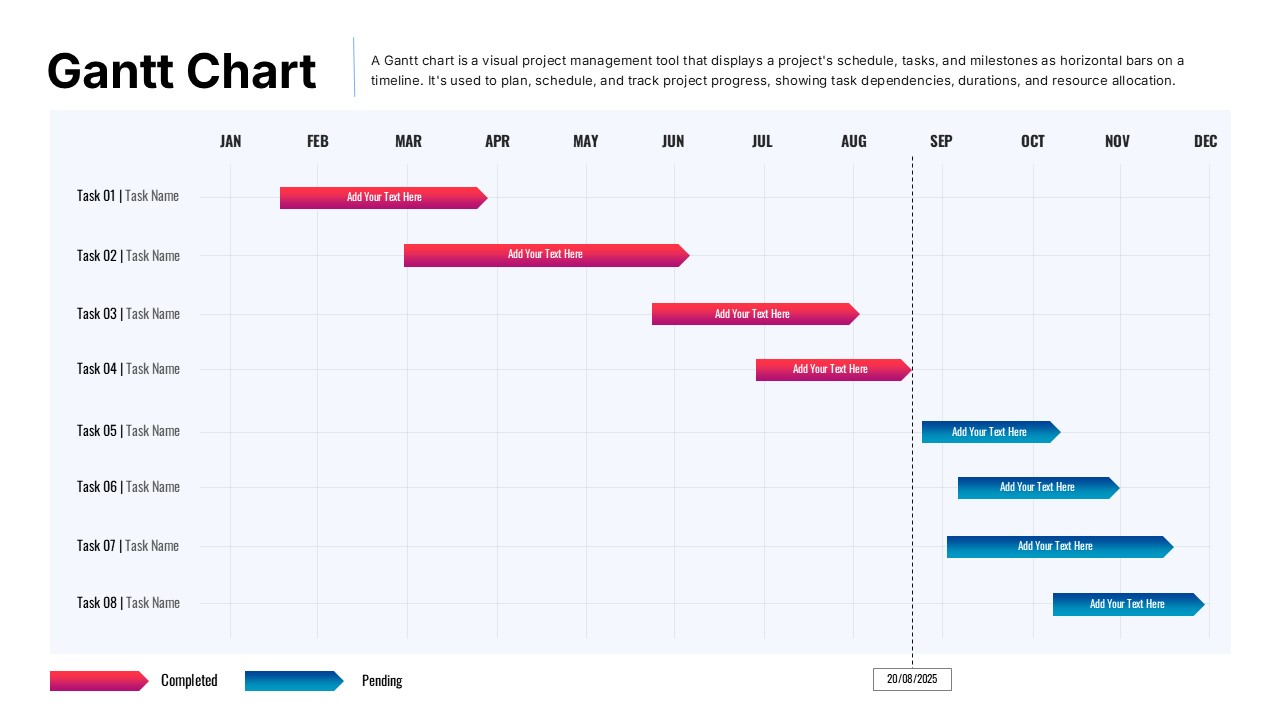
Project Gantt Chart Template for PowerPoint & Google Slides
Gantt Chart
-
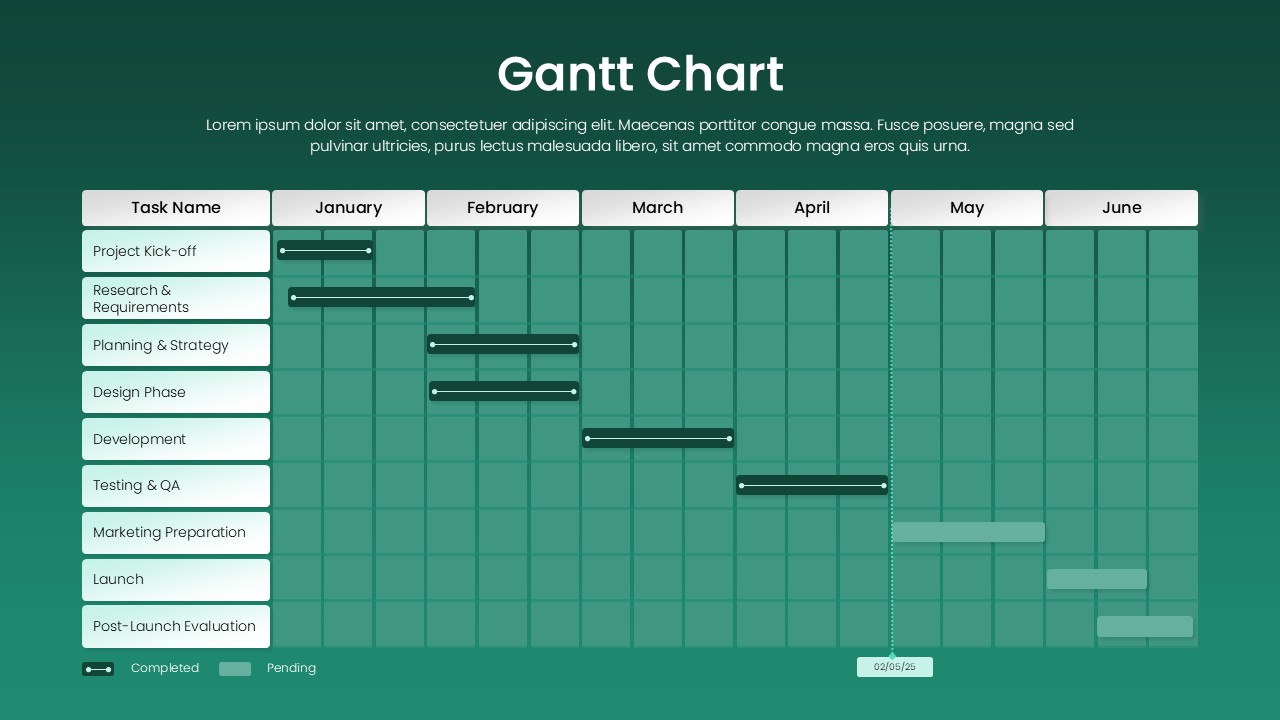
Green Gantt Chart Template for PowerPoint & Google Slides
Gantt Chart
-
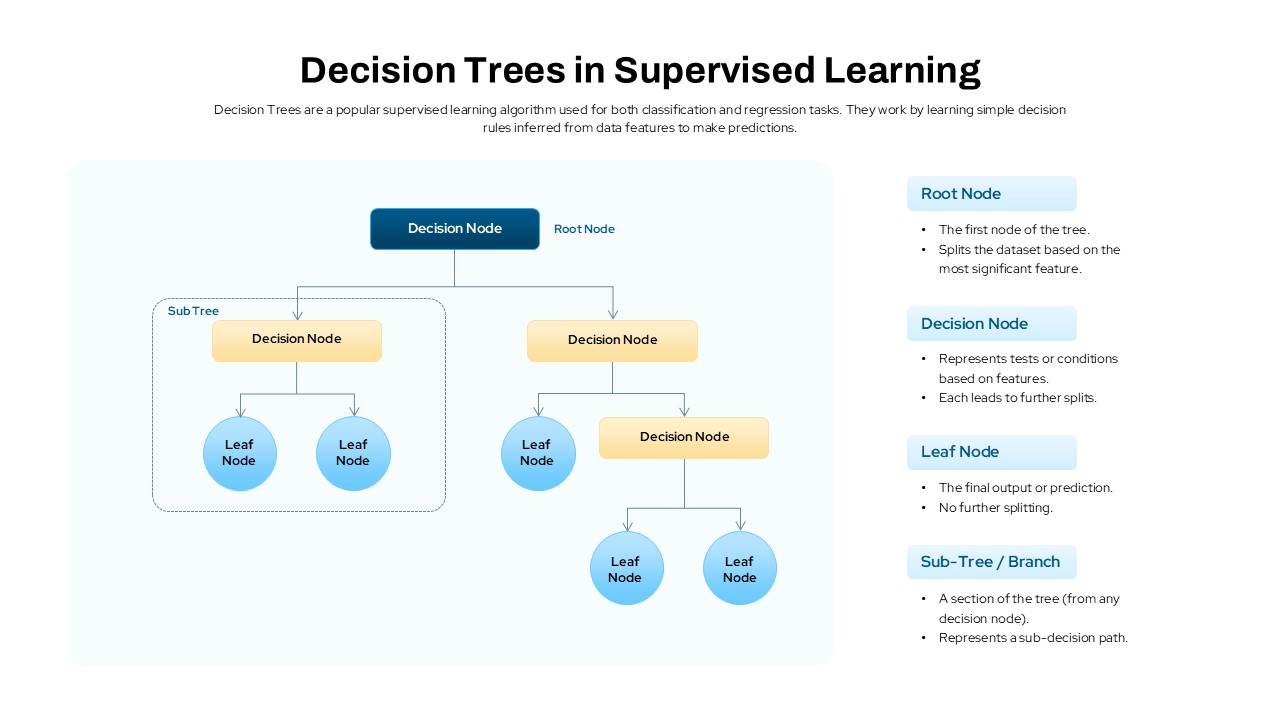
Decision Trees in Supervised Learning Template for PowerPoint & Google Slides
Machine Learning
-
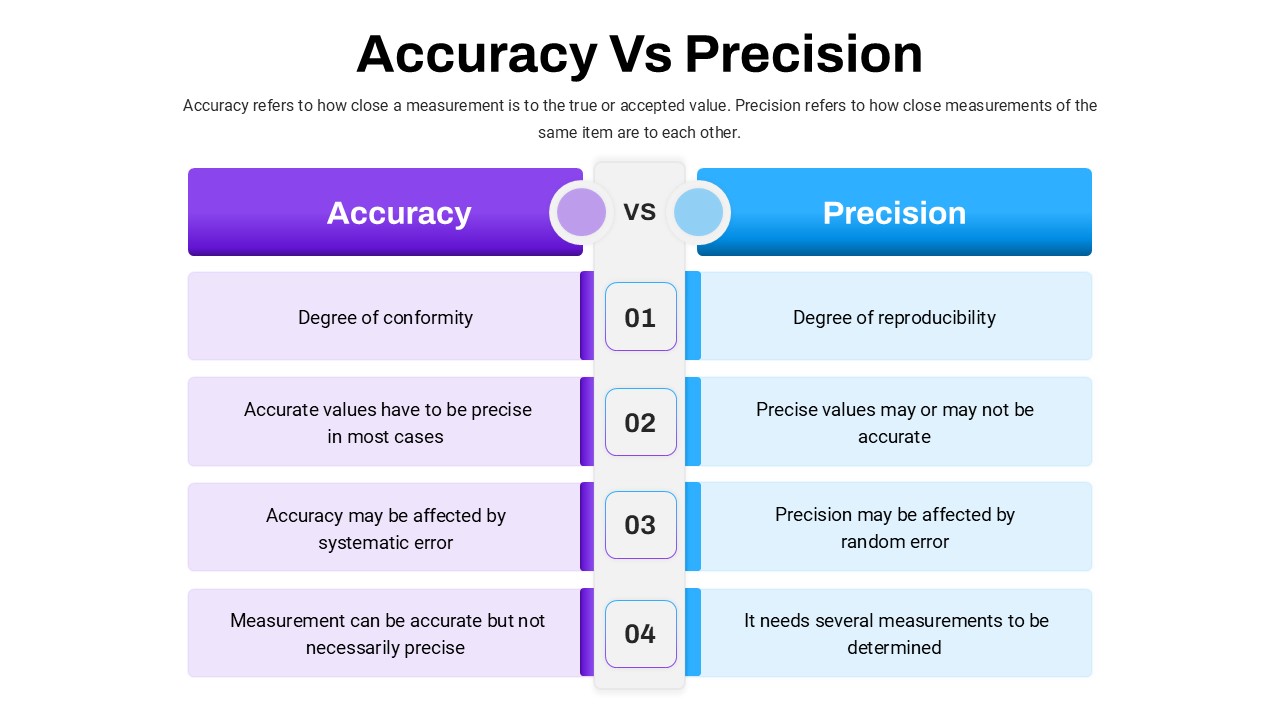
Accuracy Vs Precision Comparison Template for PowerPoint & Google Slides
Comparison Chart
-
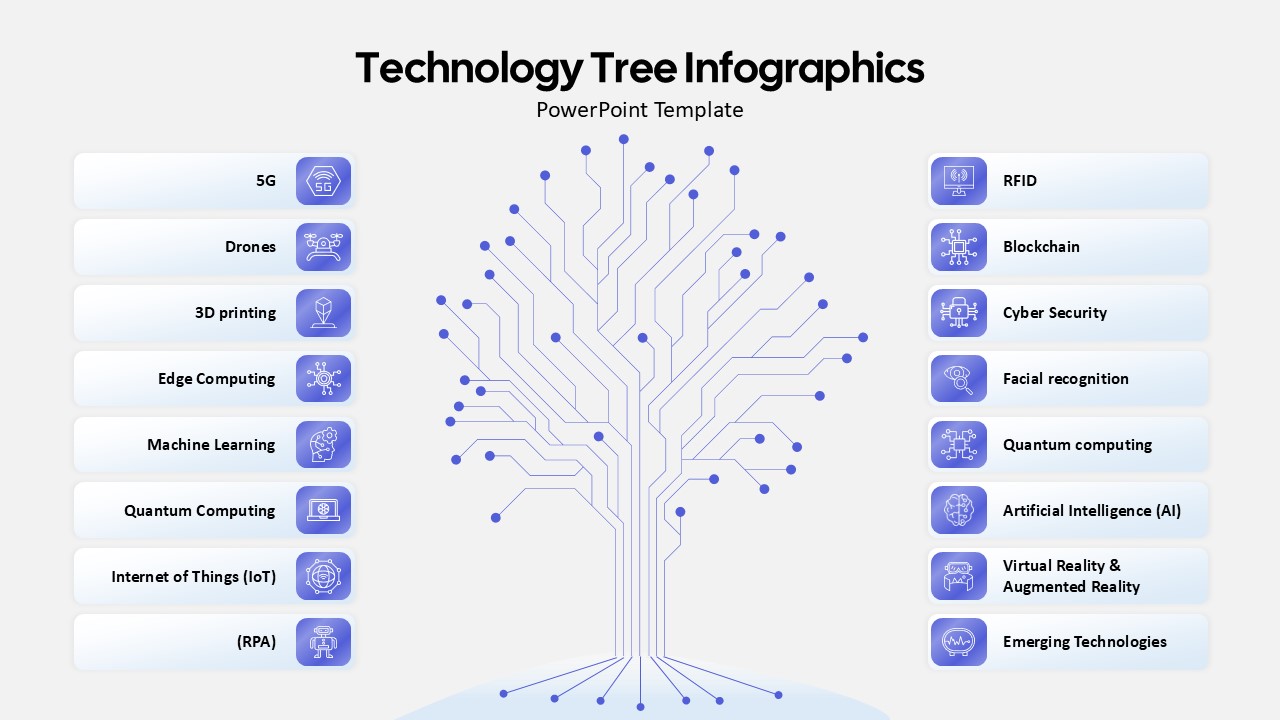
Technology Tree Infographics Template for PowerPoint & Google Slides
AI
-
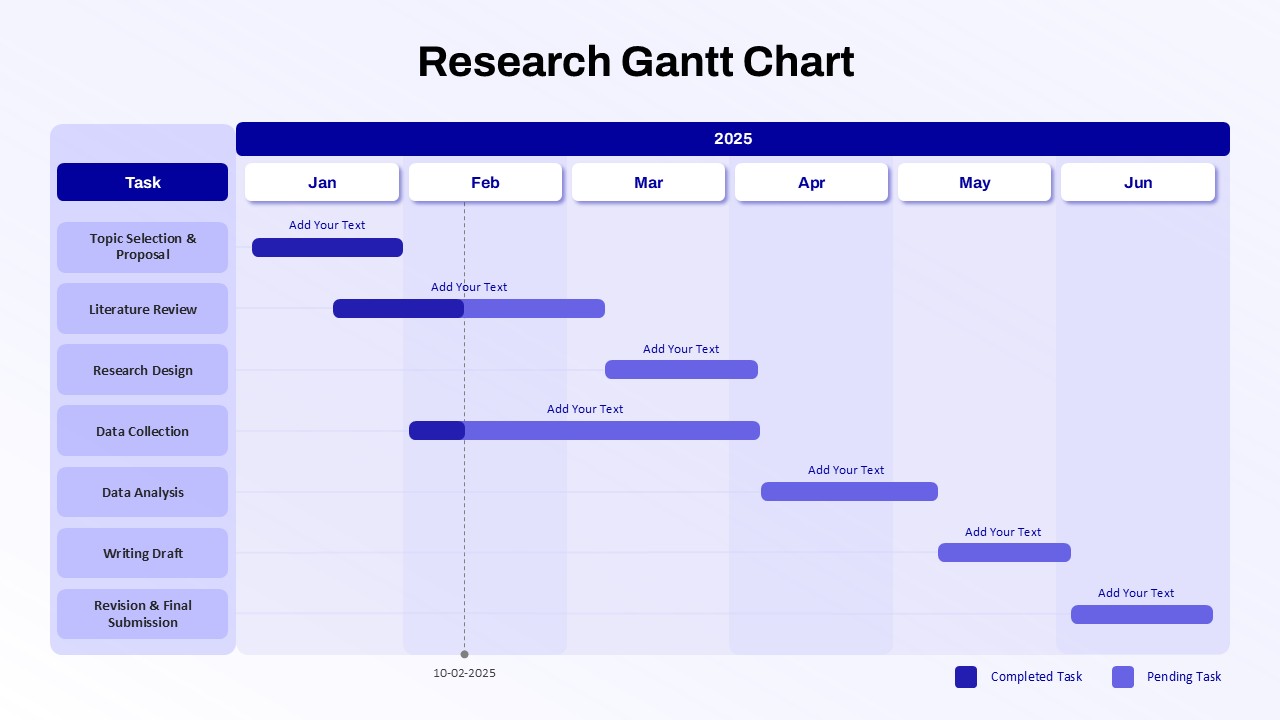
Research Gantt Chart template for PowerPoint & Google Slides
Project
-
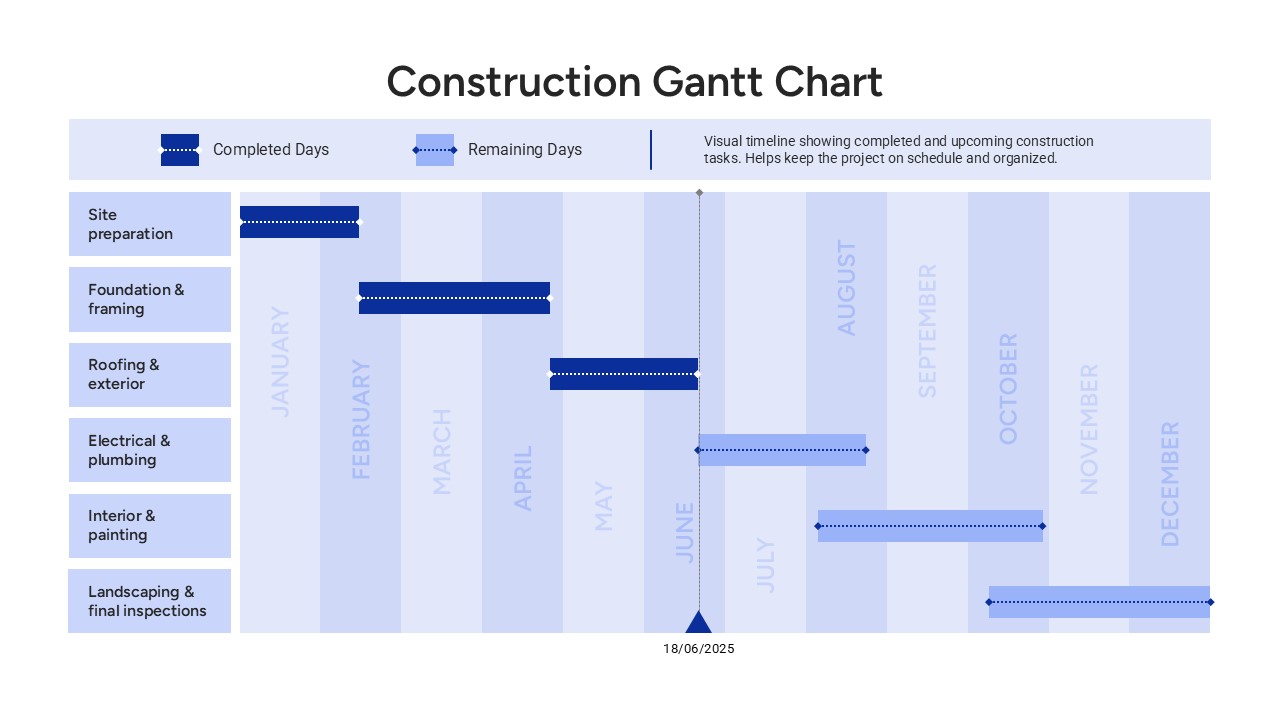
Construction Gantt Chart Template
Gantt Chart
-
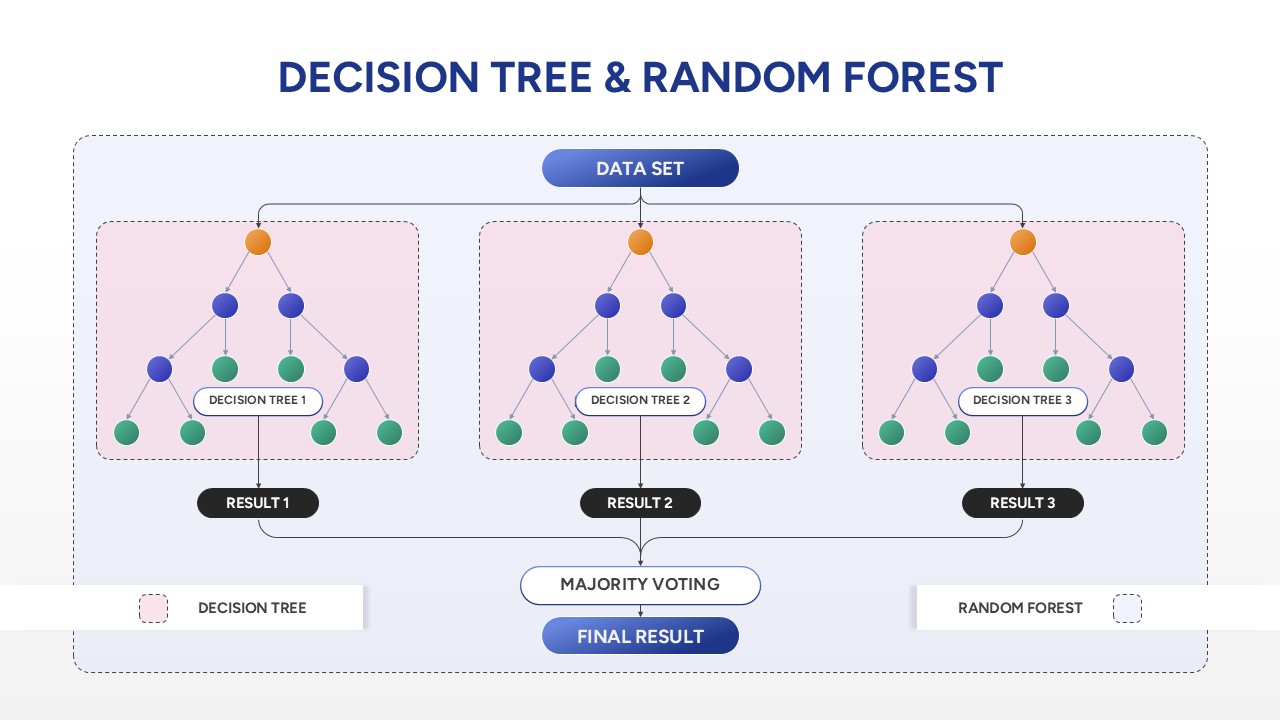
Decision Tree & Random Forest template for PowerPoint & Google Slides
Technology
-
Five Options Business Bar Graph for PowerPoint & Google Slides
Business Report
-
Bar Gantt Chart Template for PowerPoint & Google Slides
Gantt Chart
-
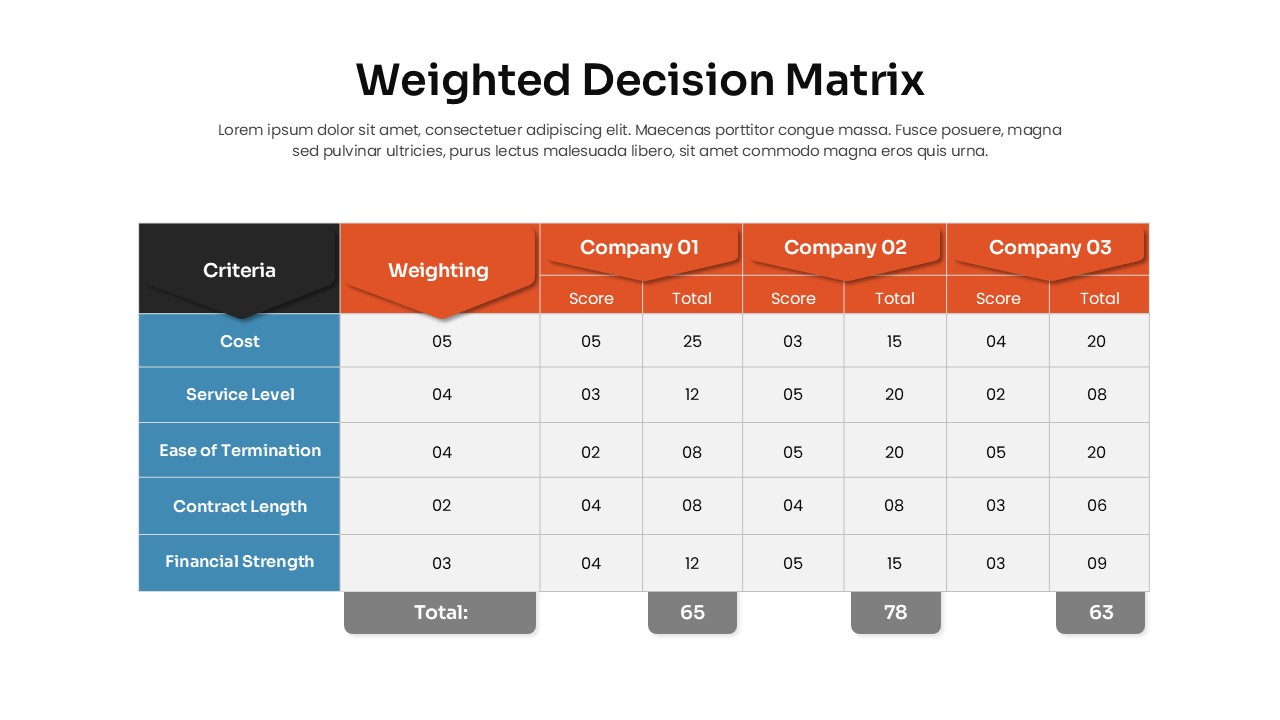
Weighted Decision Matrix template for PowerPoint & Google Slides
Business Models
-
Static Gantt Chart Overview template for PowerPoint & Google Slides
Project Status
-
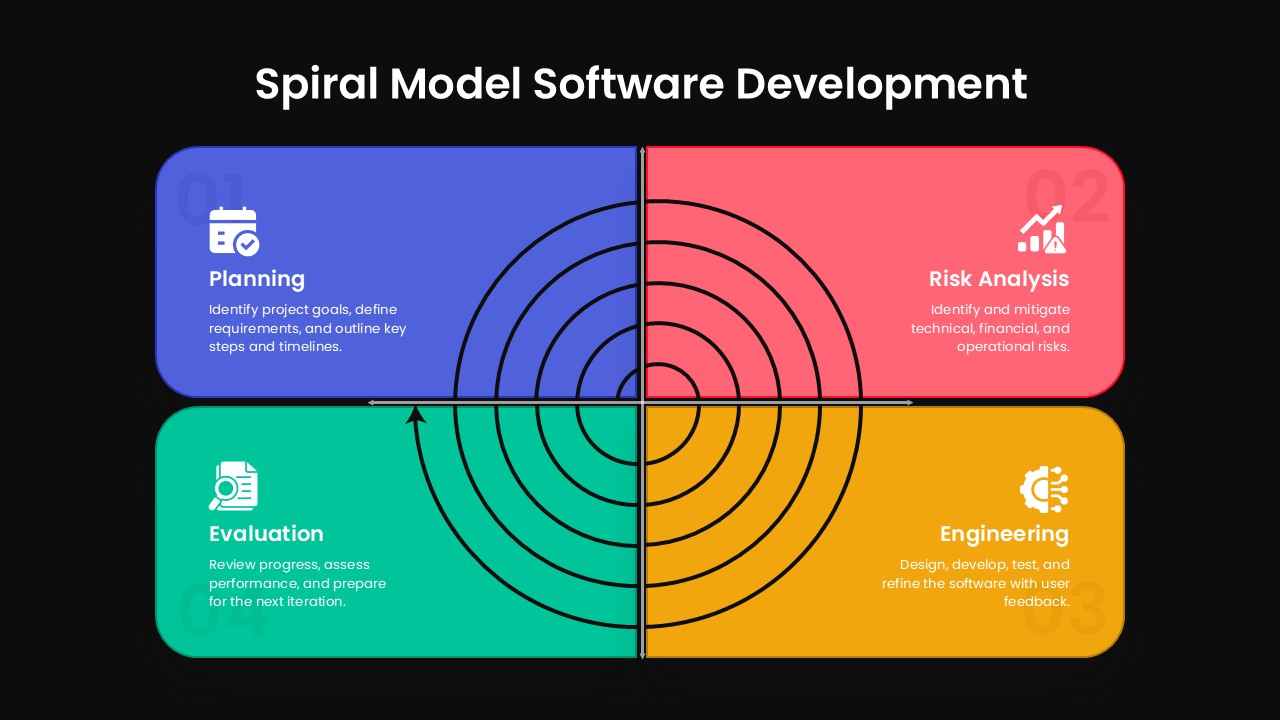
Spiral Model Software Development Template for PowerPoint & Google Slides
Process
-
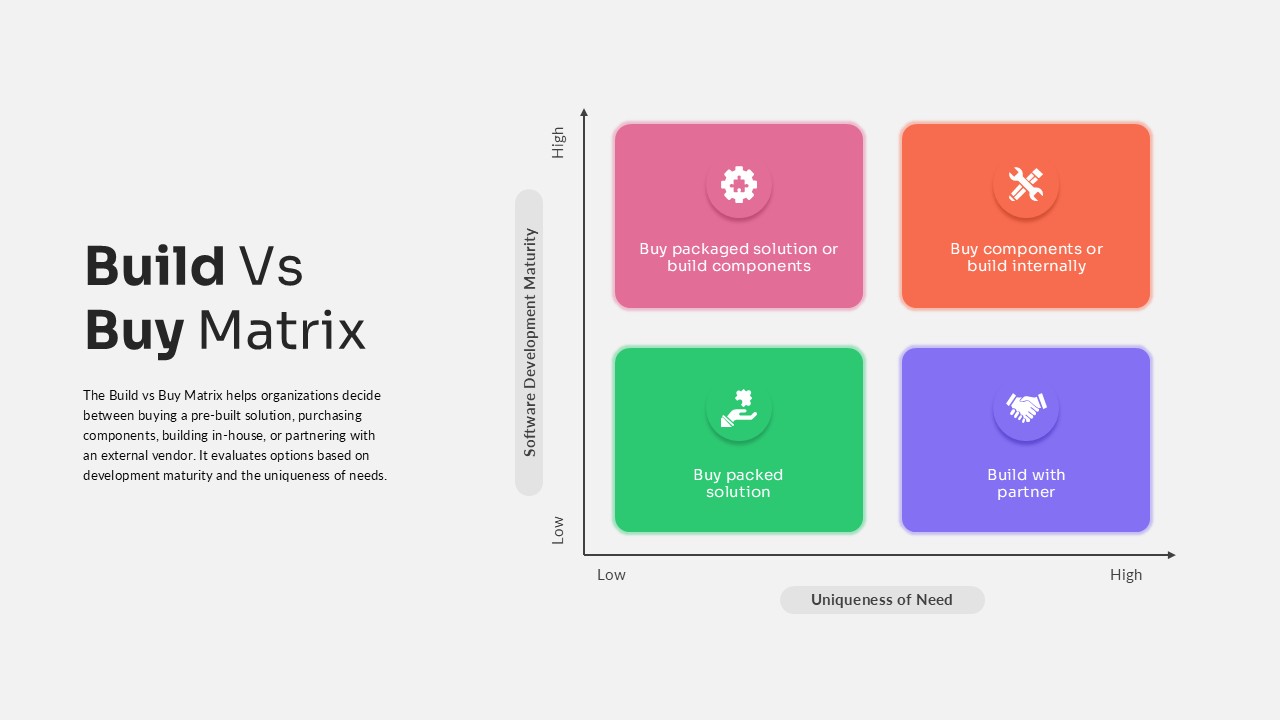
Build vs Buy Matrix Decision Framework template for PowerPoint & Google Slides
Business Strategy
-
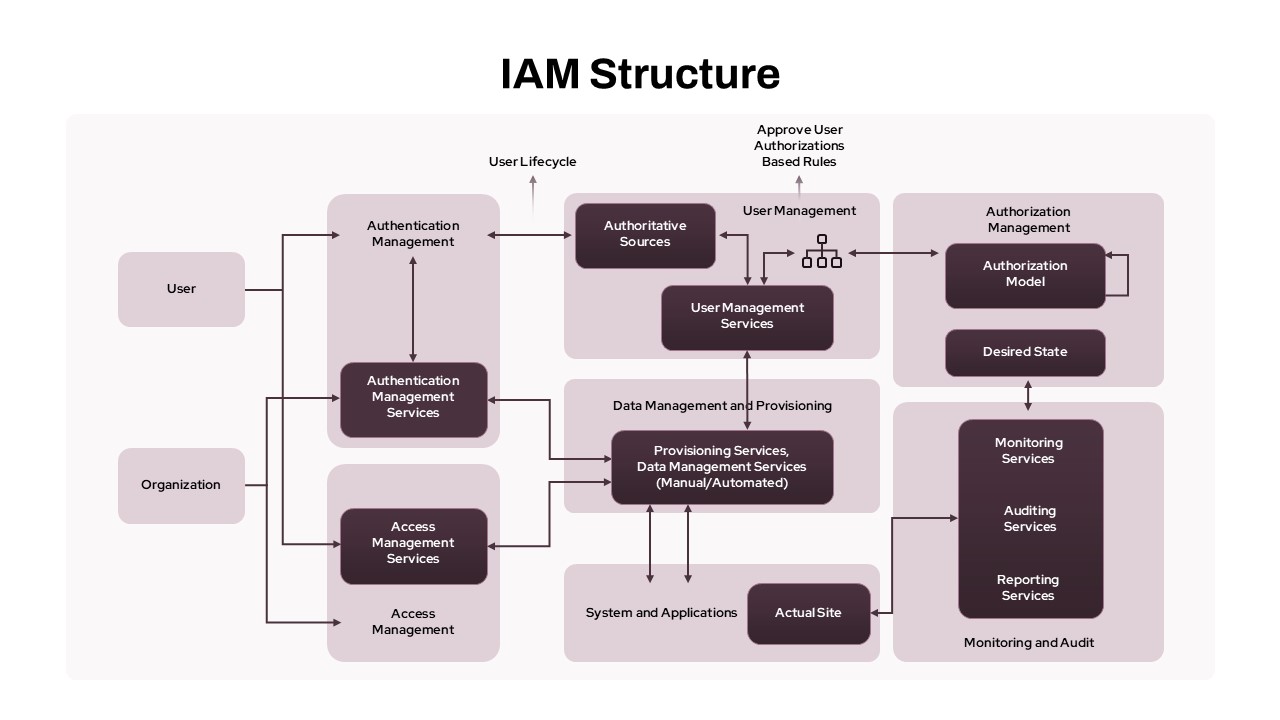
IAM Access Management Structure Diagram Template for PowerPoint & Google Slides
Flow Charts
-
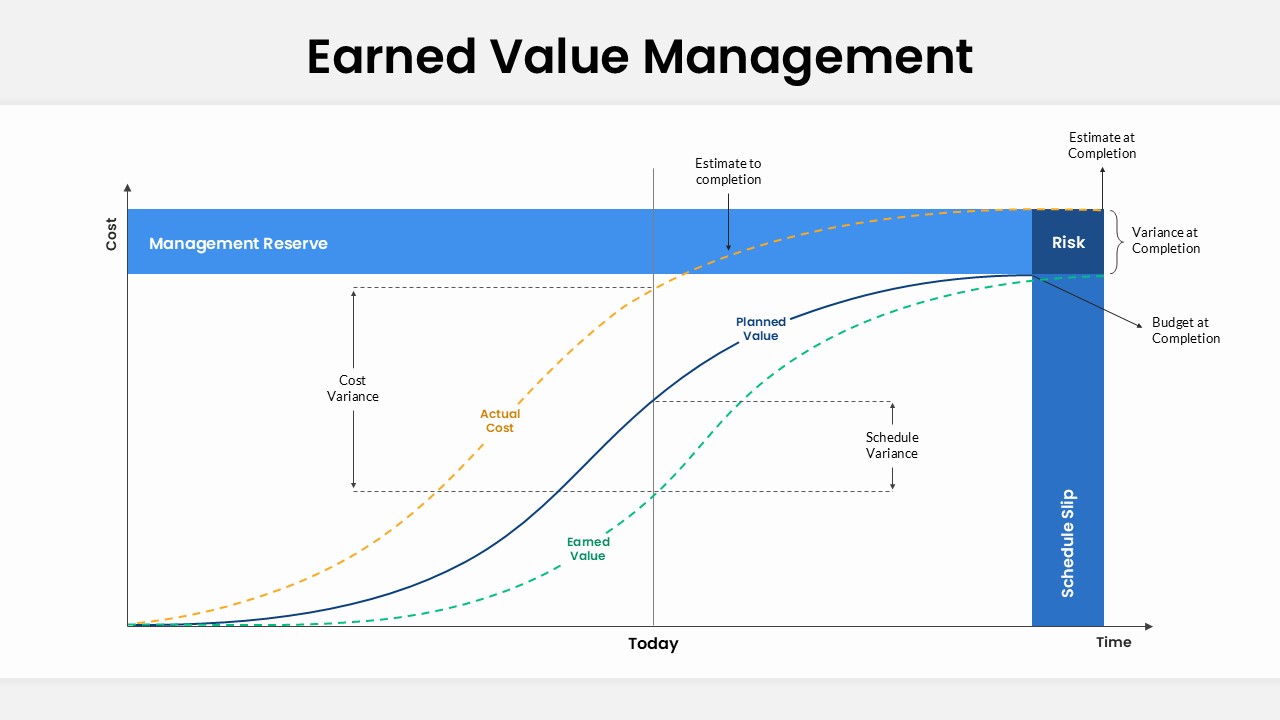
Earned Value Management (EVM) Slide Template for PowerPoint & Google Slides
Charts
-
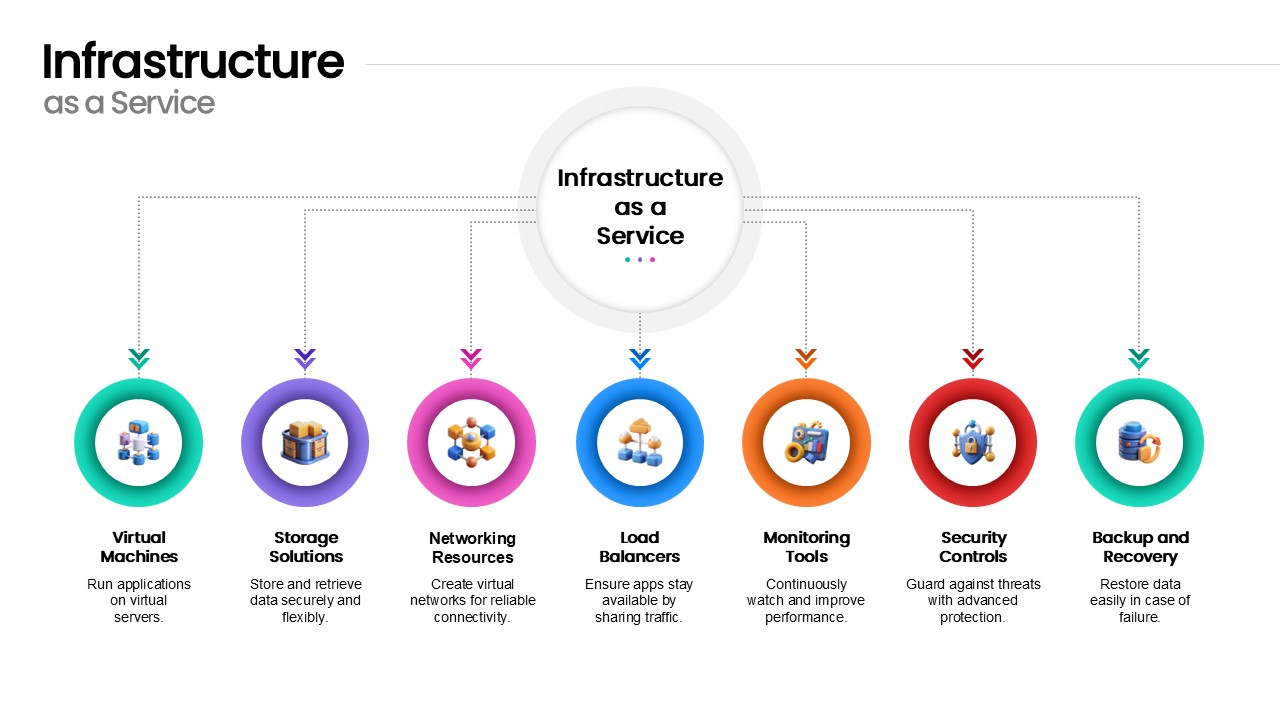
Infrastructure as a Service Diagram Template for PowerPoint & Google Slides
Cloud Computing
-
Data-Driven Decision Making overview template for PowerPoint & Google Slides
Business
-
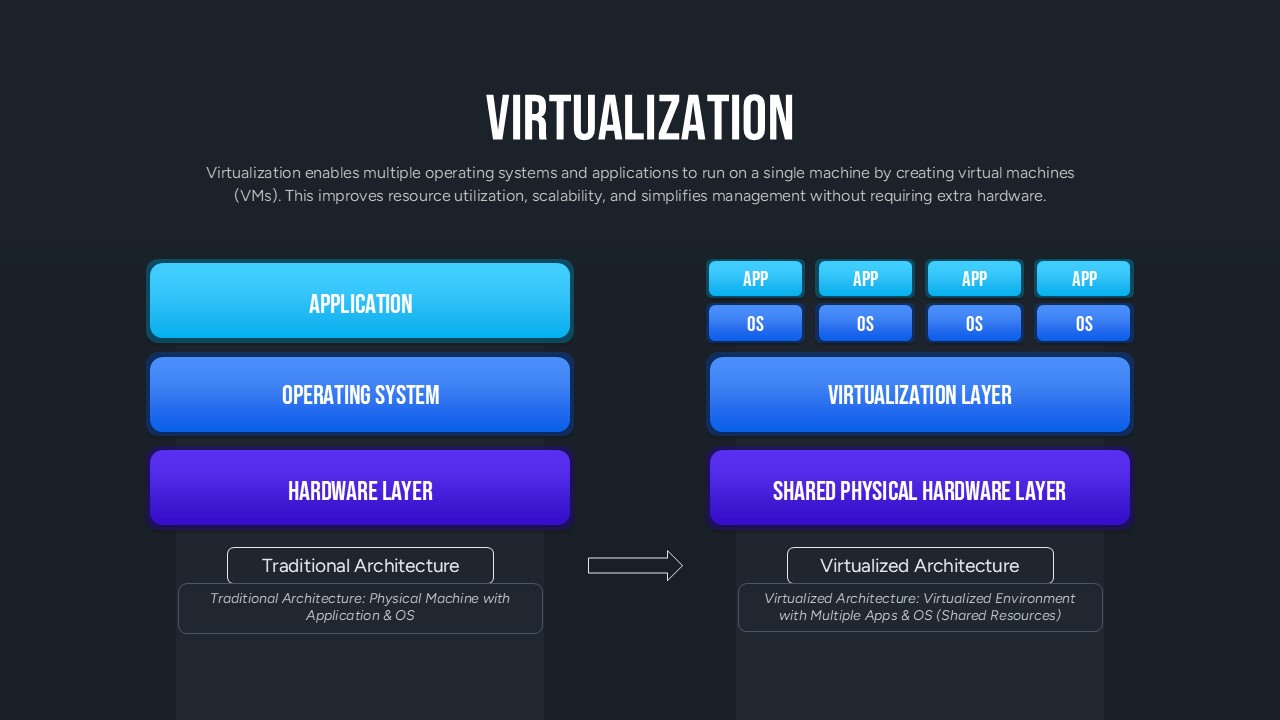
Virtualization Architecture Comparison Template for PowerPoint & Google Slides
Comparison Chart
-
Marketing Budget Allocation Donut Chart Template for PowerPoint & Google Slides
Marketing