PowerPoint Charts and Graphs Templates
![]() Filter
Filter
Filter
-
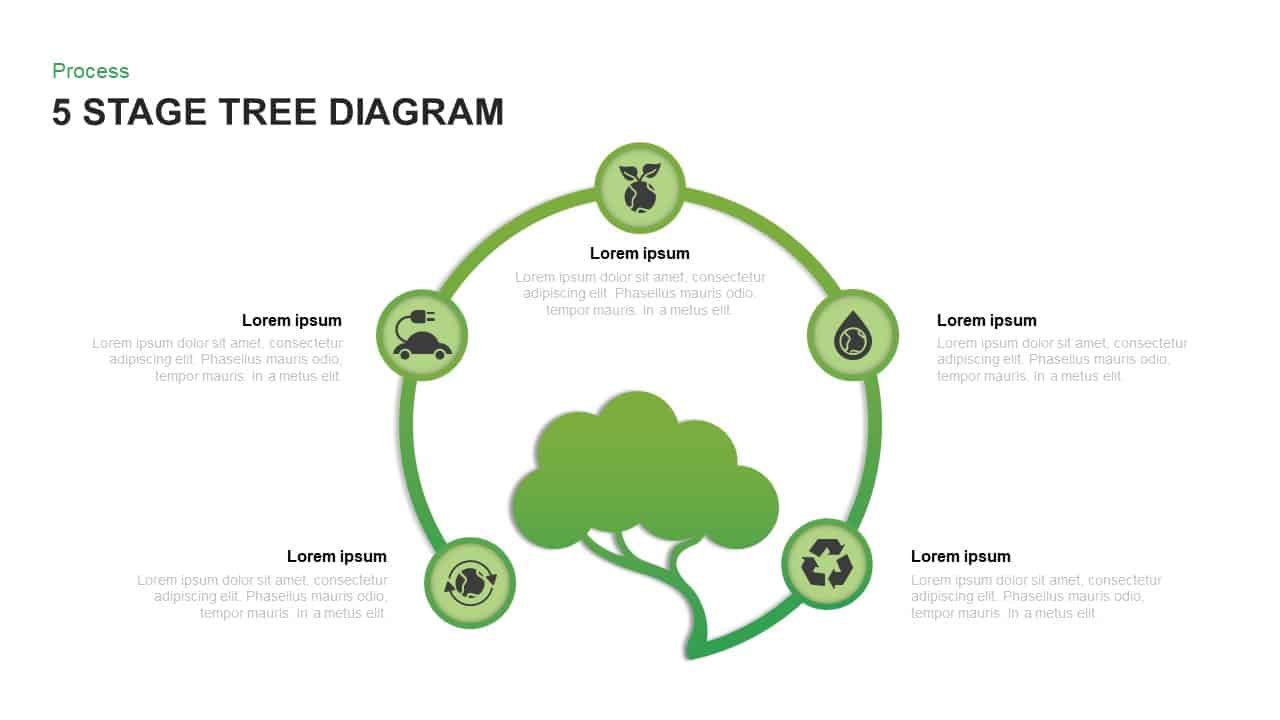
Five-Stage Eco Tree Process Diagram Template for PowerPoint & Google Slides
Process
-

Immigration Data Dashboard Template for PowerPoint & Google Slides
Bar/Column
-
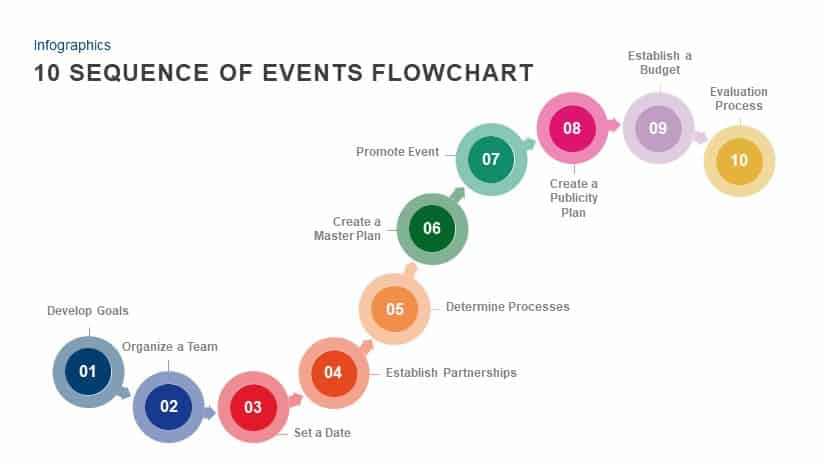
10 Sequence of Events Flowchart template for PowerPoint & Google Slides
Flow Charts
-

Risk Management Heat Map Diagram Template for PowerPoint & Google Slides
Comparison Chart
-

Business Decision-Making Metaphor Template for PowerPoint & Google Slides
Leadership
-

3D Cylinder Bar Chart Visualization Template for PowerPoint
Bar/Column
-

Social Media Market Share Pie Charts Template for PowerPoint & Google Slides
Pie/Donut
-
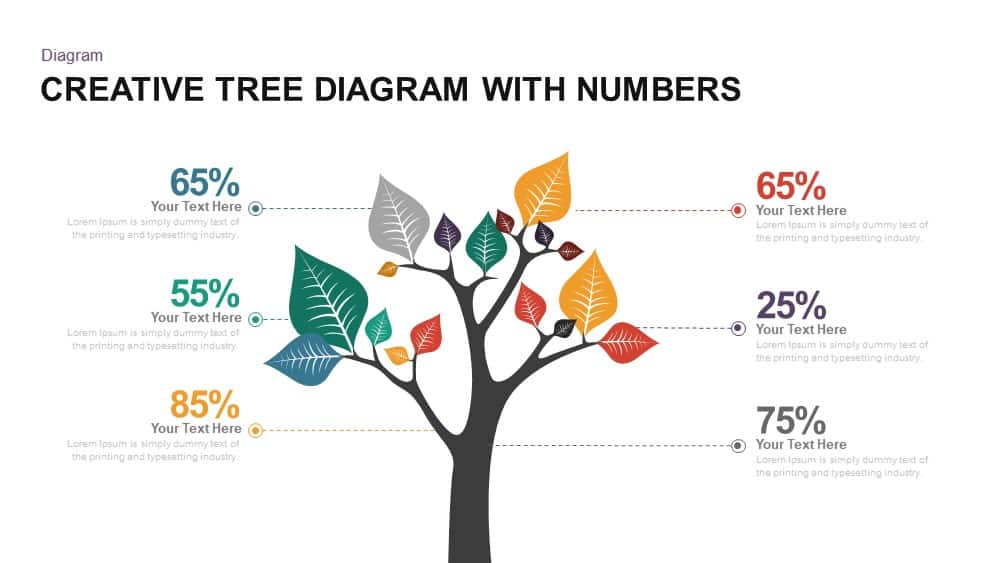
Creative Tree Diagram with Percentages Template for PowerPoint & Google Slides
Decision Tree
-

Radial Bar Chart Diagram for PowerPoint & Google Slides
Bar/Column
-

Cone Data Chart for PowerPoint & Google Slides
Charts
-

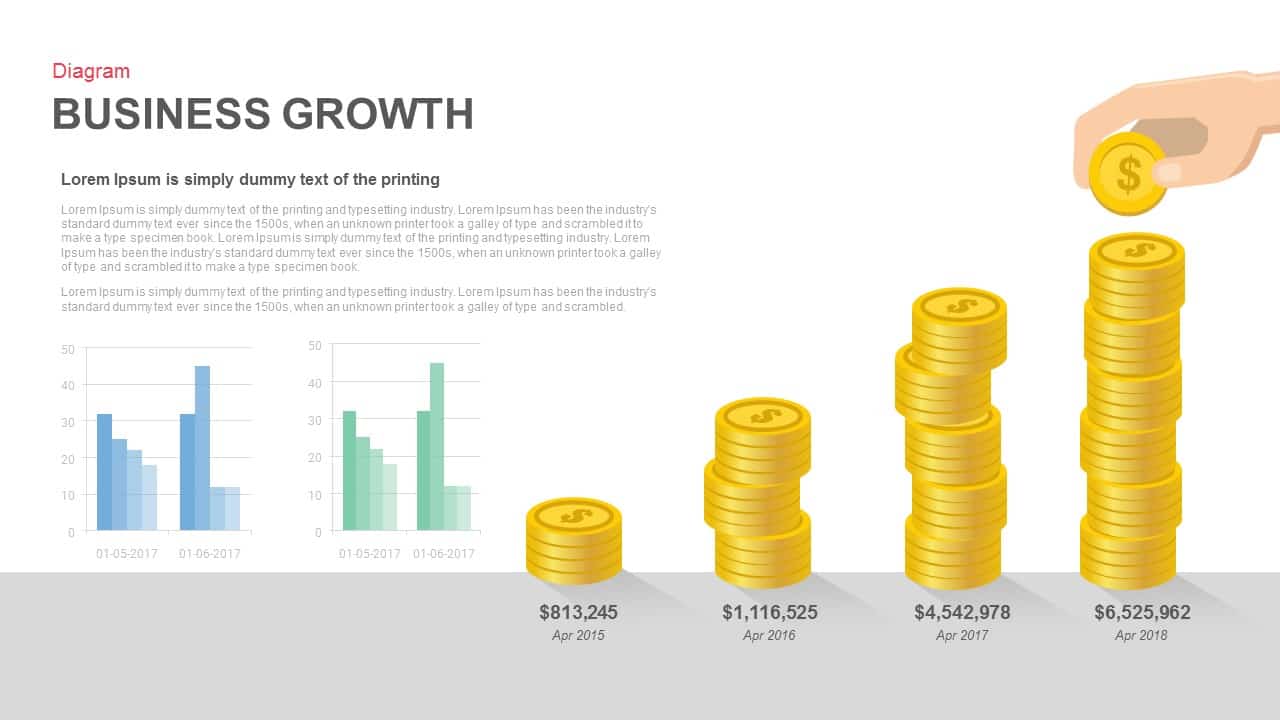
Business Growth Diagram for PowerPoint & Google Slides
Business Models
-
Comparison Chart Overview template for PowerPoint & Google Slides
Comparison Chart
-

Pros & Cons Arrow Diagram template for PowerPoint & Google Slides
Comparison Chart
-
Website Performance Dashboard template for PowerPoint & Google Slides
Charts
-

3D Bar Graph Infographic Template for PowerPoint & Google Slides
Bar/Column
-
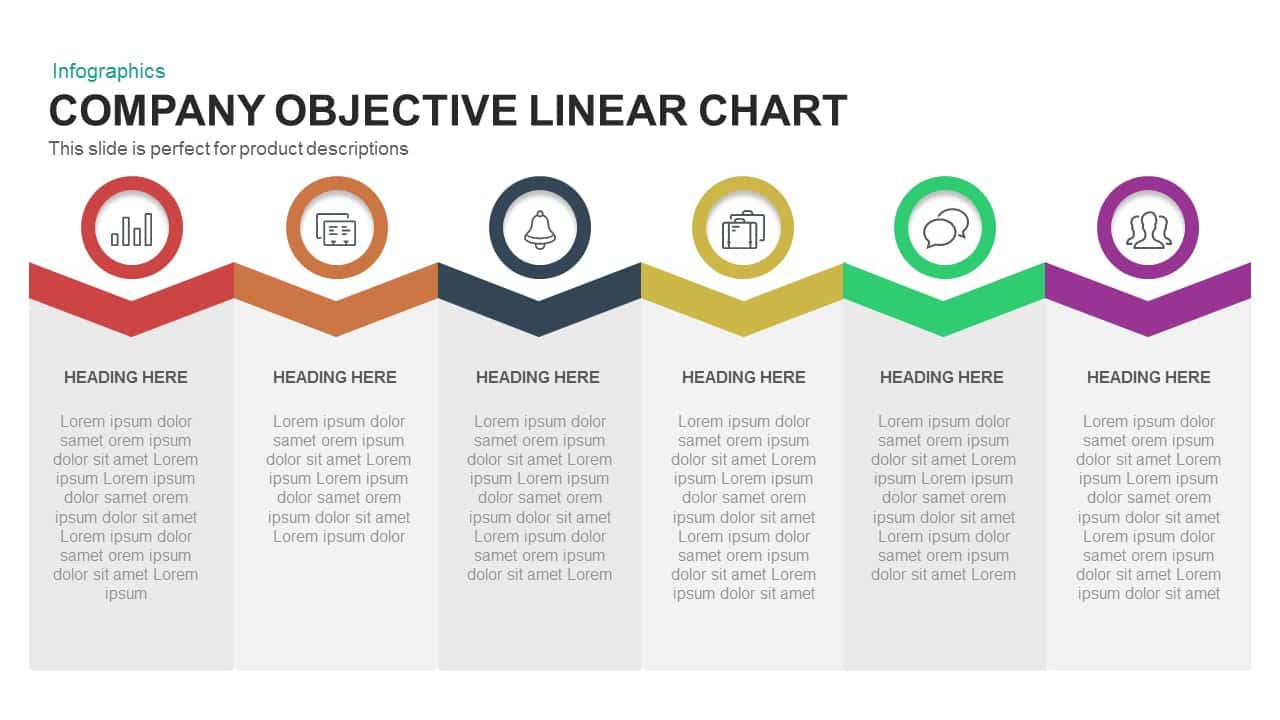
Company Objective Linear Chart Template for PowerPoint & Google Slides
Flow Charts
-
Business Dashboard Analytics & KPIs Template for PowerPoint & Google Slides
Bar/Column
-
Eight Section Donut Chart Infographic Template for PowerPoint & Google Slides
Pie/Donut
-
Data Analytics Dashboard Design template for PowerPoint & Google Slides
Bar/Column
-
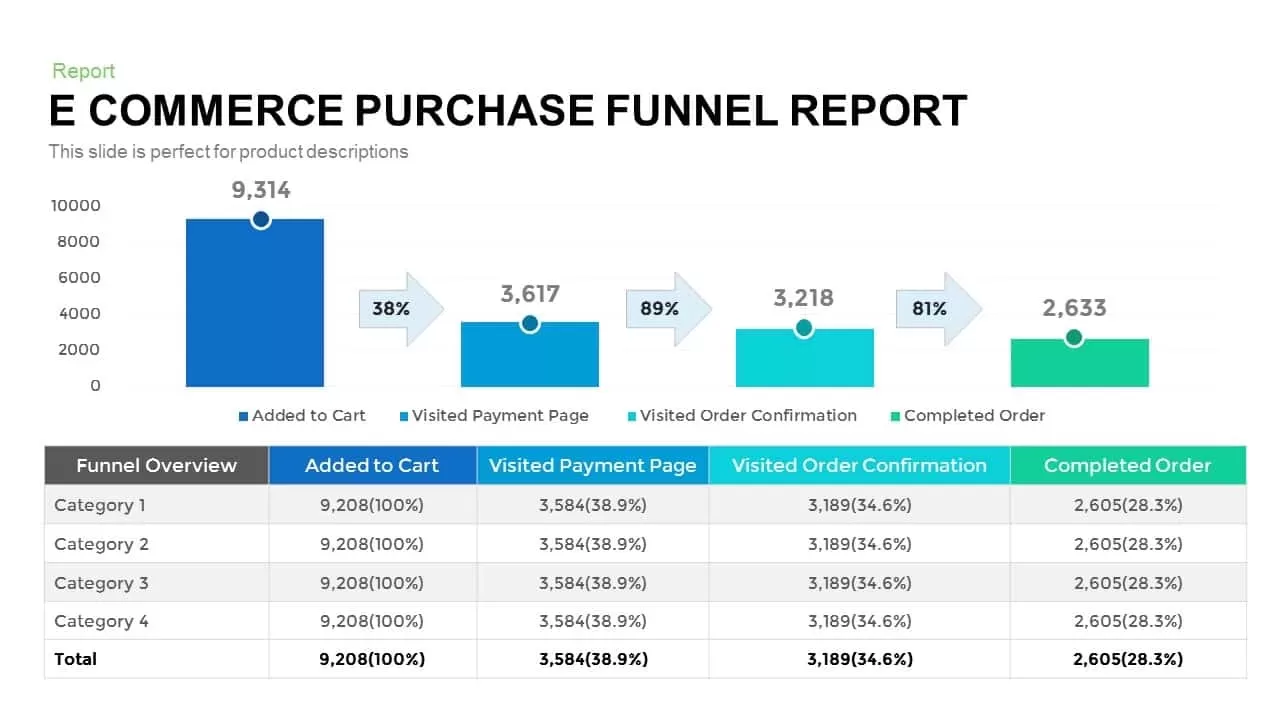
E-commerce Purchase Funnel Report template for PowerPoint & Google Slides
Funnel
-
Cause and Effect Diagram Infographic Template for PowerPoint & Google Slides
Bar/Column
-
Product Usage Analytics Dashboard Chart Template for PowerPoint & Google Slides
Bar/Column
-
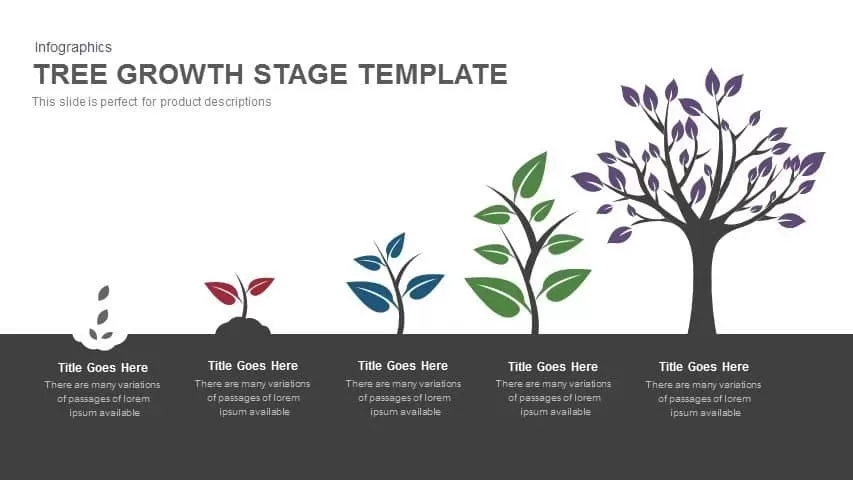
Tree Growth Stage Infographic Template for PowerPoint & Google Slides
Timeline
-
Curved Line Graph for PowerPoint & Google Slides
Timeline
-
Colorful Radial Bar Chart Template for PowerPoint & Google Slides
Bar/Column
-

Monthly Reports Bar Chart template for PowerPoint & Google Slides
Bar/Column
-
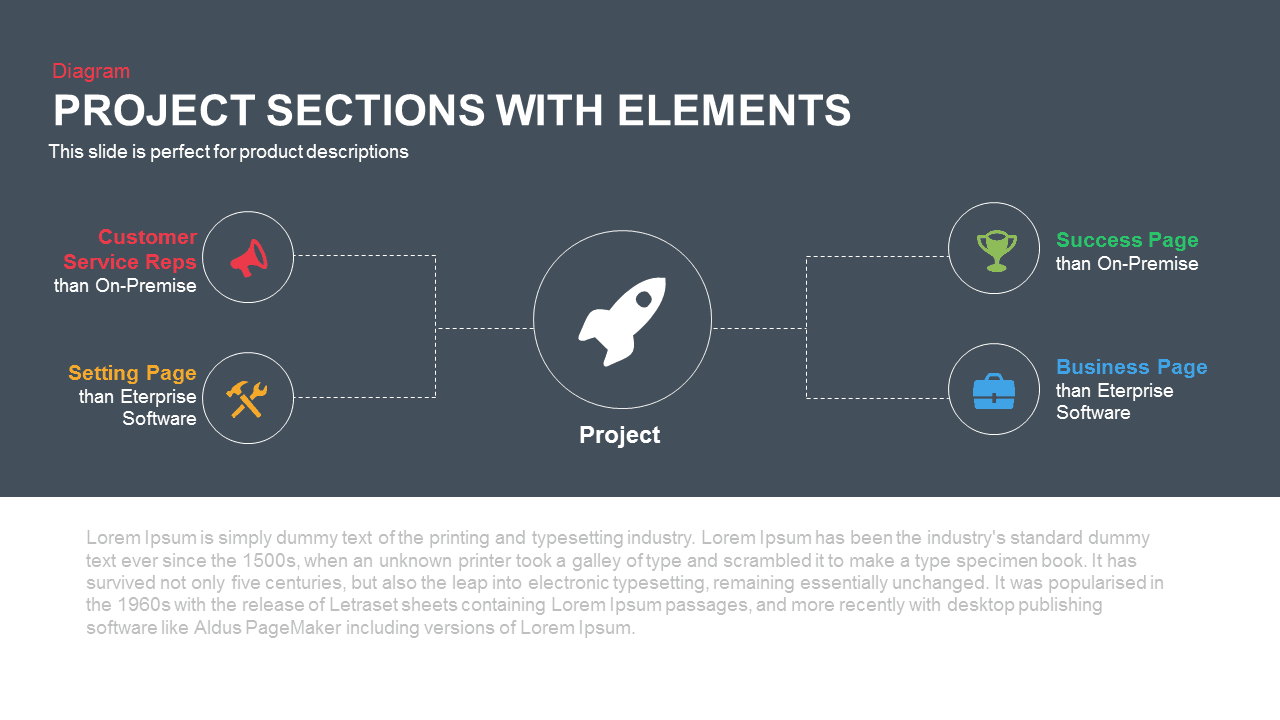
Project Sections Hub-and-Spoke Diagram template for PowerPoint & Google Slides
Flow Charts
-
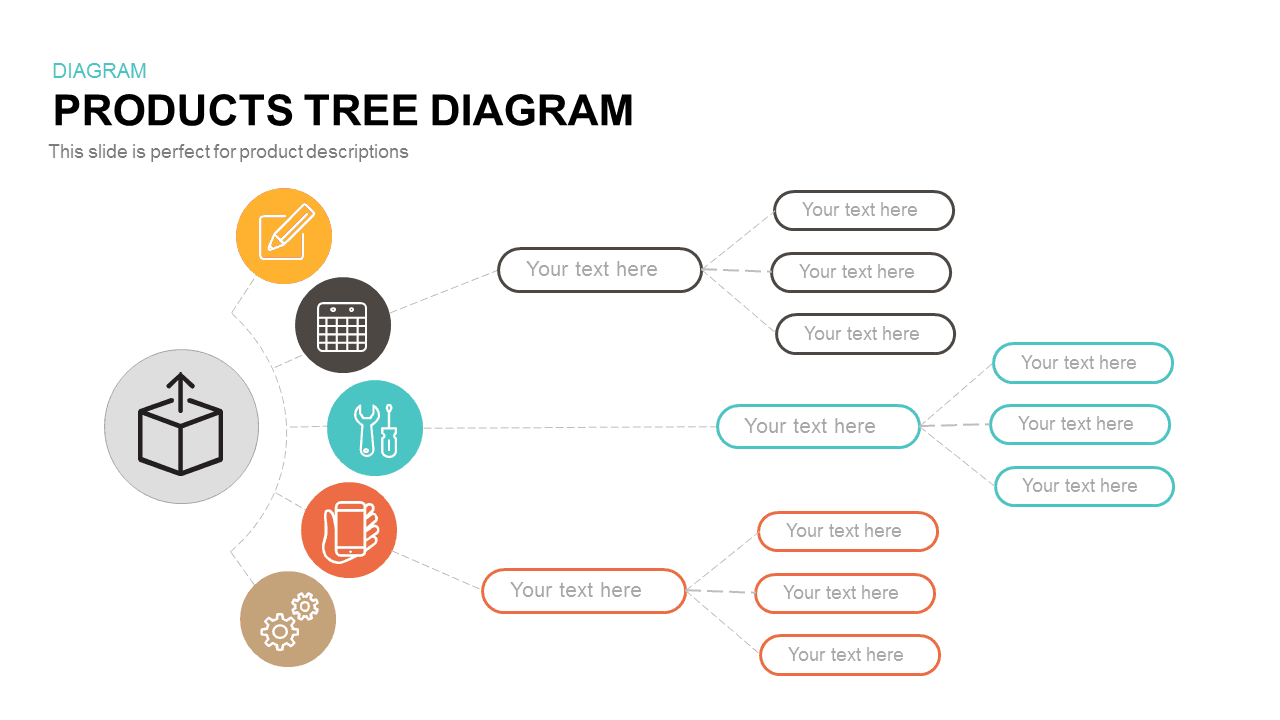
Interactive Products Tree Diagram template for PowerPoint & Google Slides
Org Chart
-
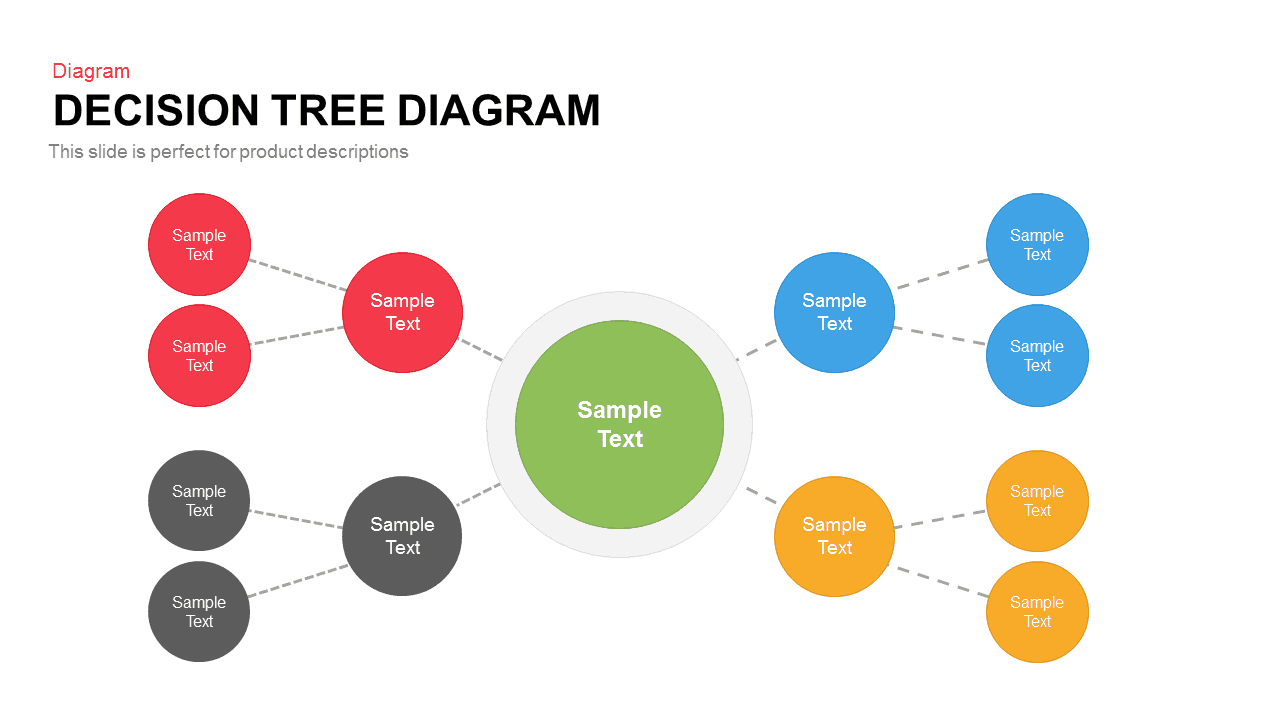
Colorful Decision Tree Diagram template for PowerPoint & Google Slides
Decision Tree
-
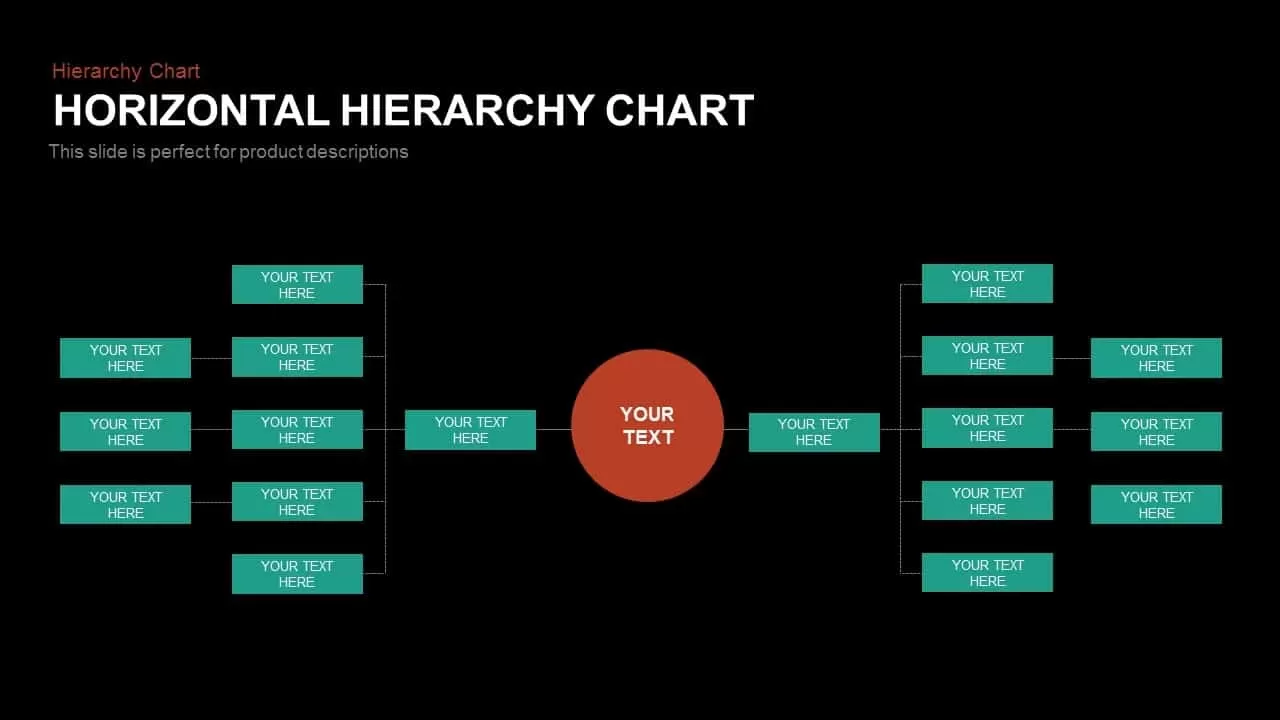
Horizontal Org Chart template for PowerPoint & Google Slides
Org Chart
-
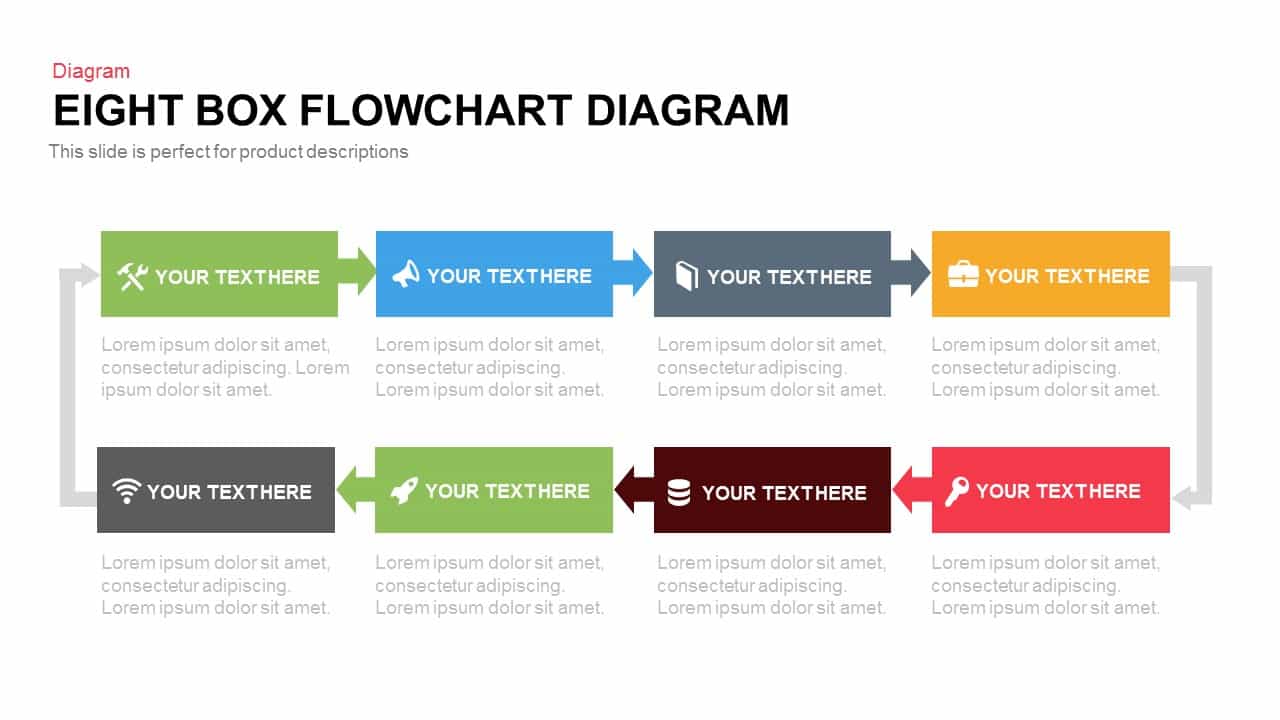
Eight Box Flowchart template for PowerPoint & Google Slides
Flow Charts
-
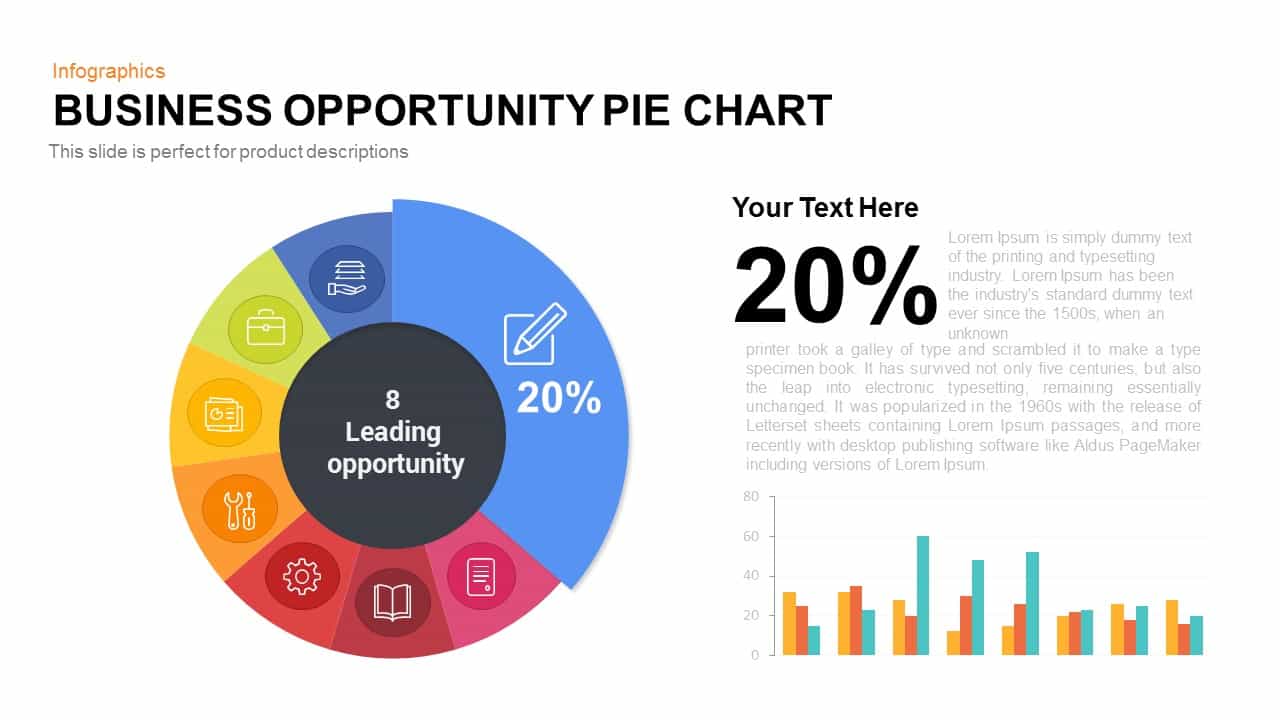
Business Opportunity Pie Chart Template for PowerPoint & Google Slides
Pie/Donut
-
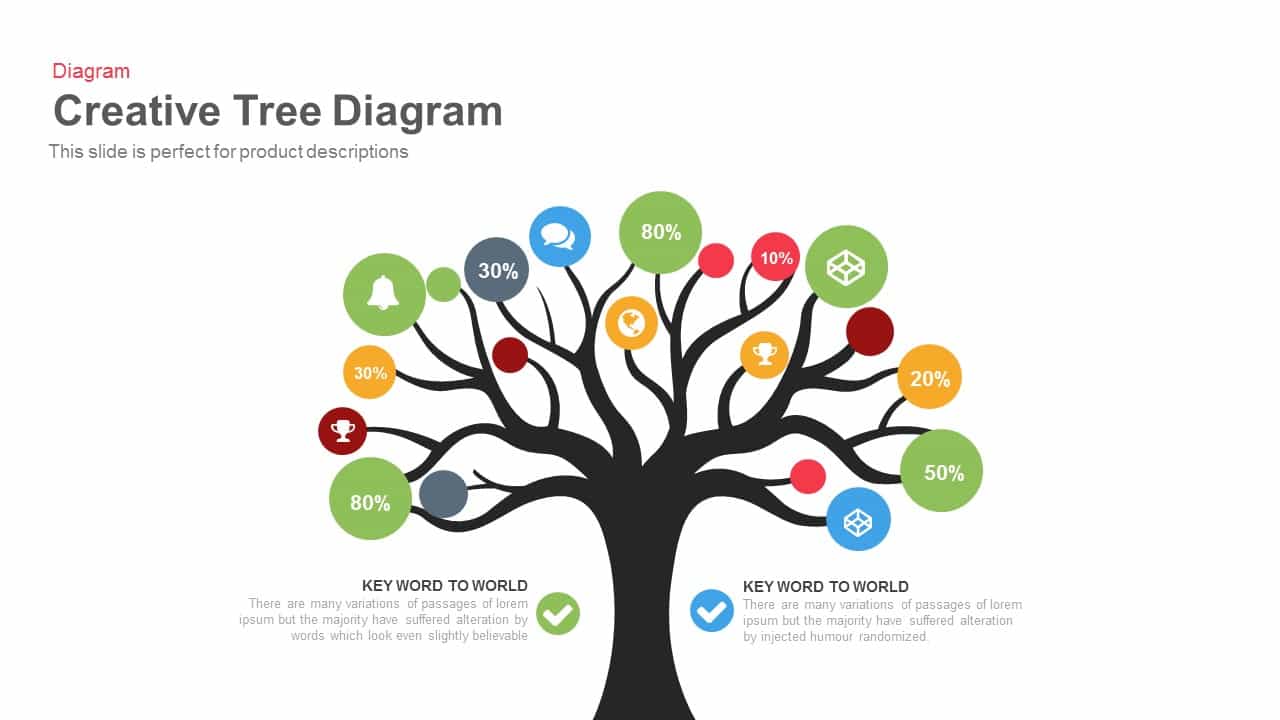
Engaging Creative Tree Diagram Slide Template for PowerPoint & Google Slides
Flow Charts
-
Speedometer Infographic Gauge Comparison Template for PowerPoint & Google Slides
Comparison
-
3D Cylinder Bar Chart Template for PowerPoint & Google Slides
Bar/Column