Charts Presentation Templates for PowerPoint and Google Slides
Present data with confidence and clarity using our Charts Presentation Templates for PowerPoint and Google Slides. These templates are ideal for visualizing performance metrics, survey results, trends, comparisons, and analytical insights. From pie charts and bar graphs to line charts and scatter plots, this category offers a variety of chart types to make your presentation more data-driven and visually compelling.
Fully editable and compatible with Microsoft PowerPoint (PPT) and Google Slides, these templates are perfect for professionals, educators, marketers, analysts, and anyone who needs to present data in a clean and engaging format.
![]() Filter
Filter
Filter
-
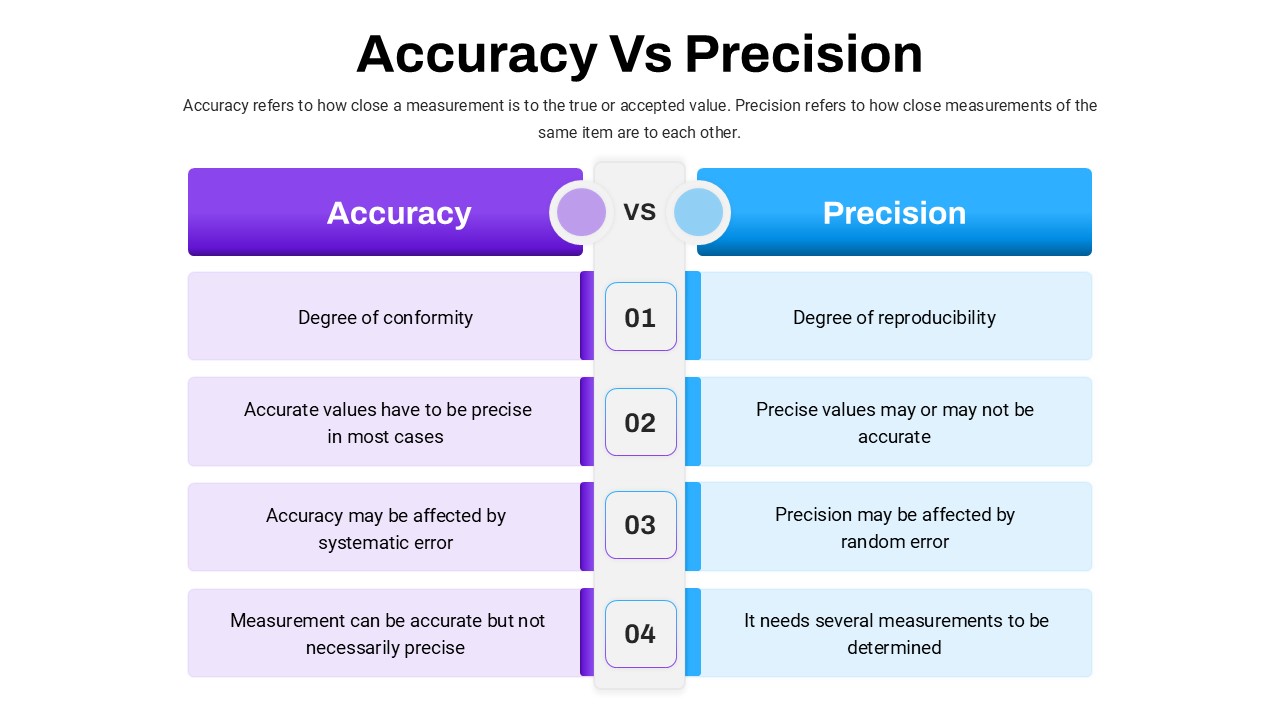
Accuracy Vs Precision Comparison Template for PowerPoint & Google Slides
Comparison Chart
Premium
-
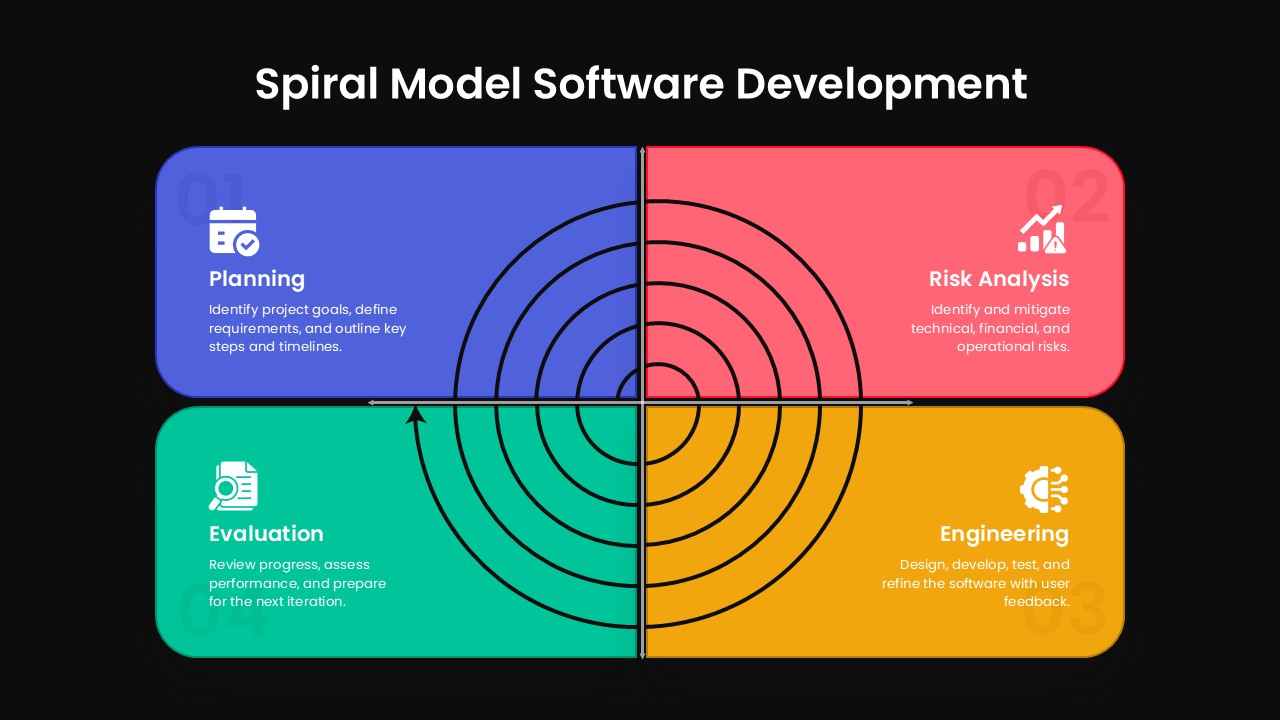
Spiral Model Software Development Template for PowerPoint & Google Slides
Process
Premium
-

Stacked Gantt Chart Timeline Slide Template for PowerPoint & Google Slides
Gantt Chart
Premium
-
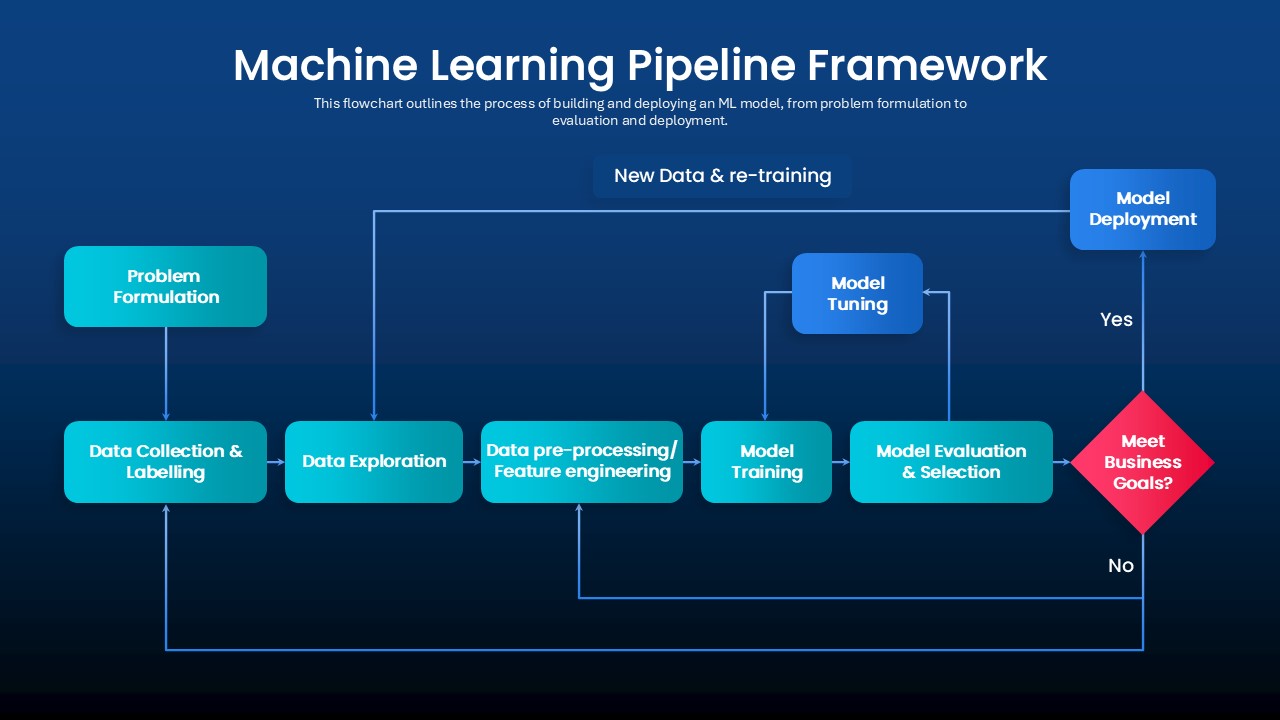
Machine Learning Pipeline Framework Template for PowerPoint & Google Slides
Charts
Premium
-
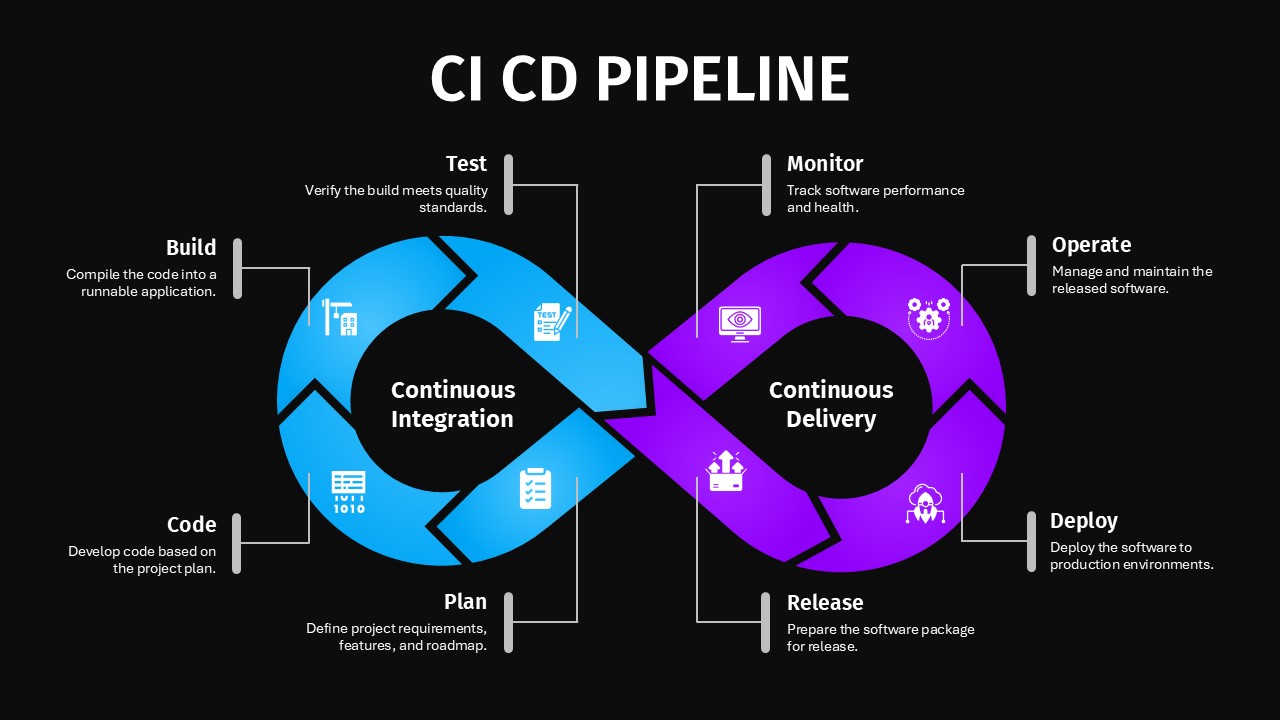
CI/CD Pipeline Infographic Template for PowerPoint & Google Slides
Flow Charts
Premium
-
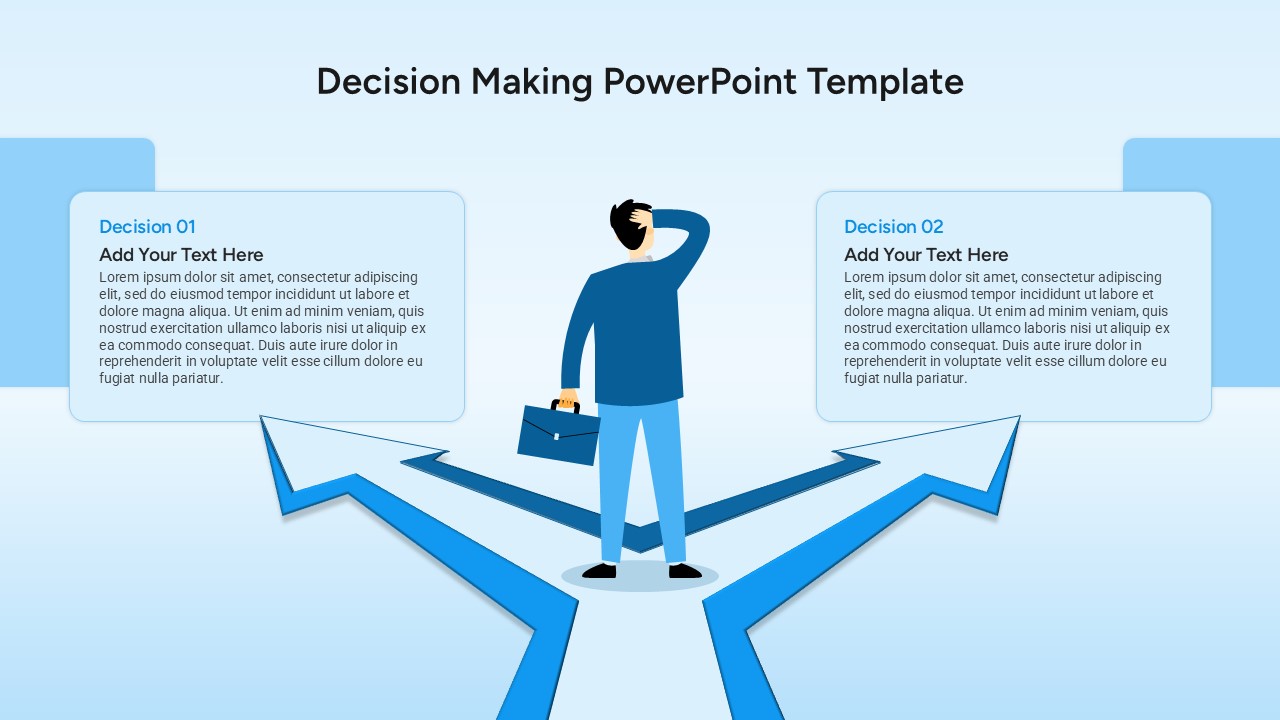
Decision Making Template for PowerPoint & Google Slides
Decision Tree
Premium
-

3D Pyramid Column Chart Infographic Template for PowerPoint & Google Slides
Bar/Column
Premium
-

Market Share Comparison Diagram Template for PowerPoint & Google Slides
Comparison Chart
Premium
-
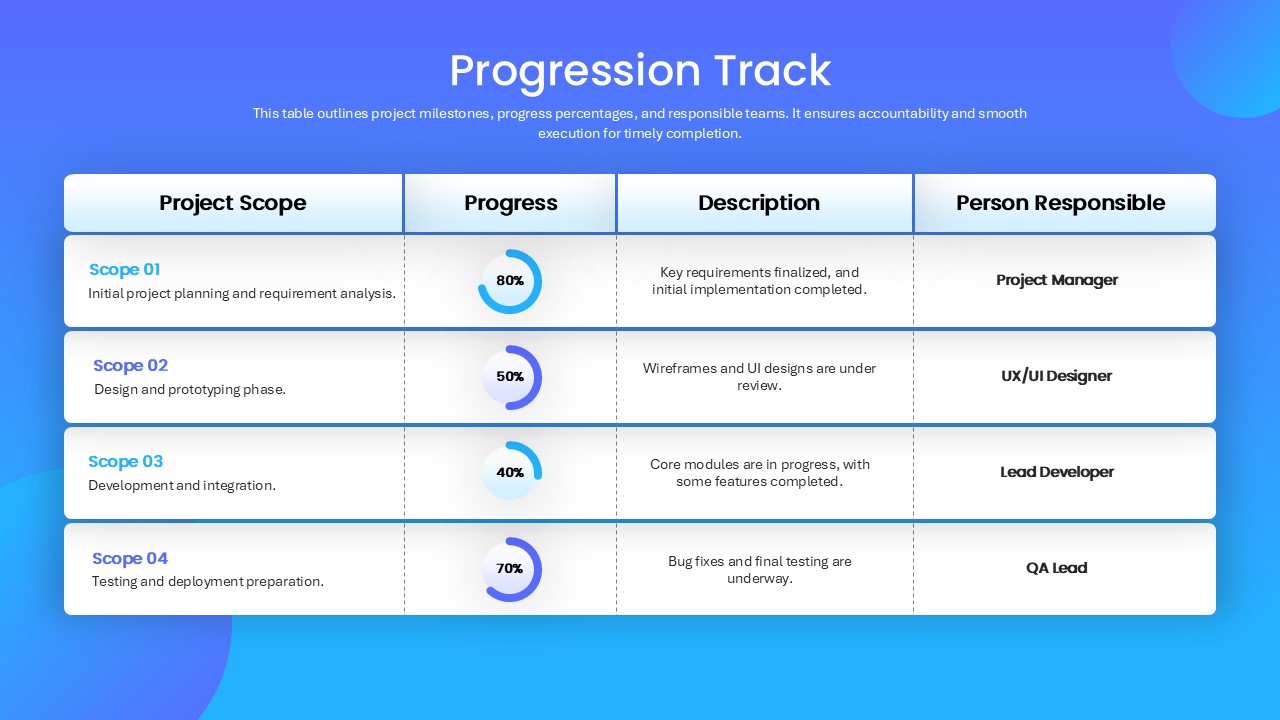
Progression Track Milestone Table Template for PowerPoint & Google Slides
Project Status
Premium
-
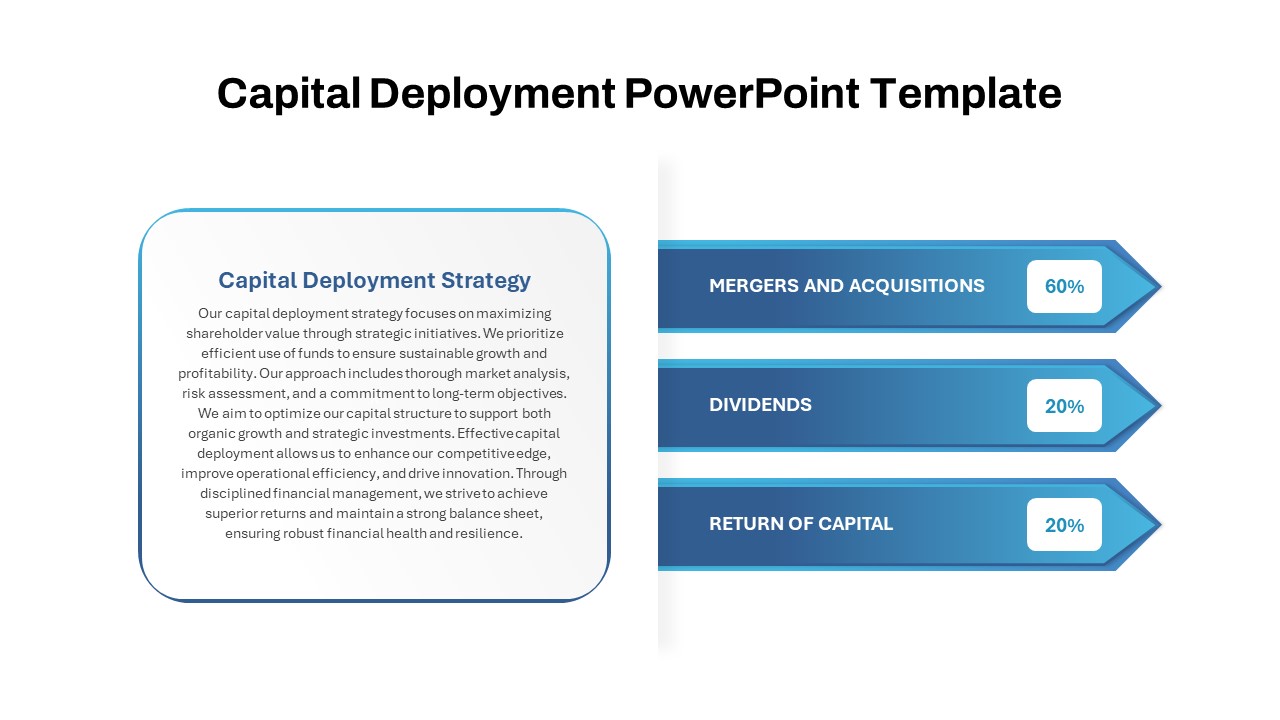
Capital Deployment Percentage Breakdown Template for PowerPoint & Google Slides
Pitch Deck
Premium
-

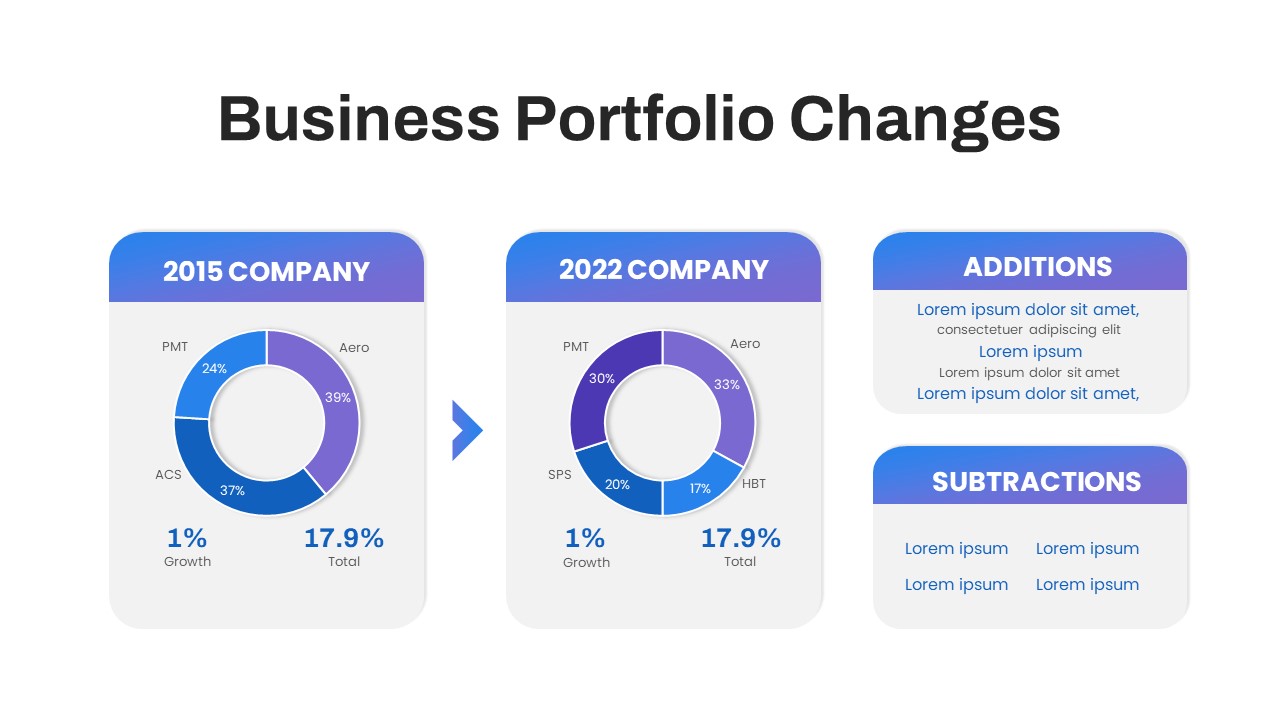
Business Portfolio Changes Donut Chart Template for PowerPoint & Google Slides
Pie/Donut
Premium
-
Annual Growth Trend Analysis Chart template for PowerPoint & Google Slides
Business Report
Premium
-
Quarterly Gross Profit Rate Chart Template for PowerPoint & Google Slides
Revenue
Premium
-
Quarterly Financial Summary Dashboard Template for PowerPoint & Google Slides
Business Report
Premium
-
Skimming Pricing Strategy Line Chart Template for PowerPoint & Google Slides
Business Strategy
Premium
-
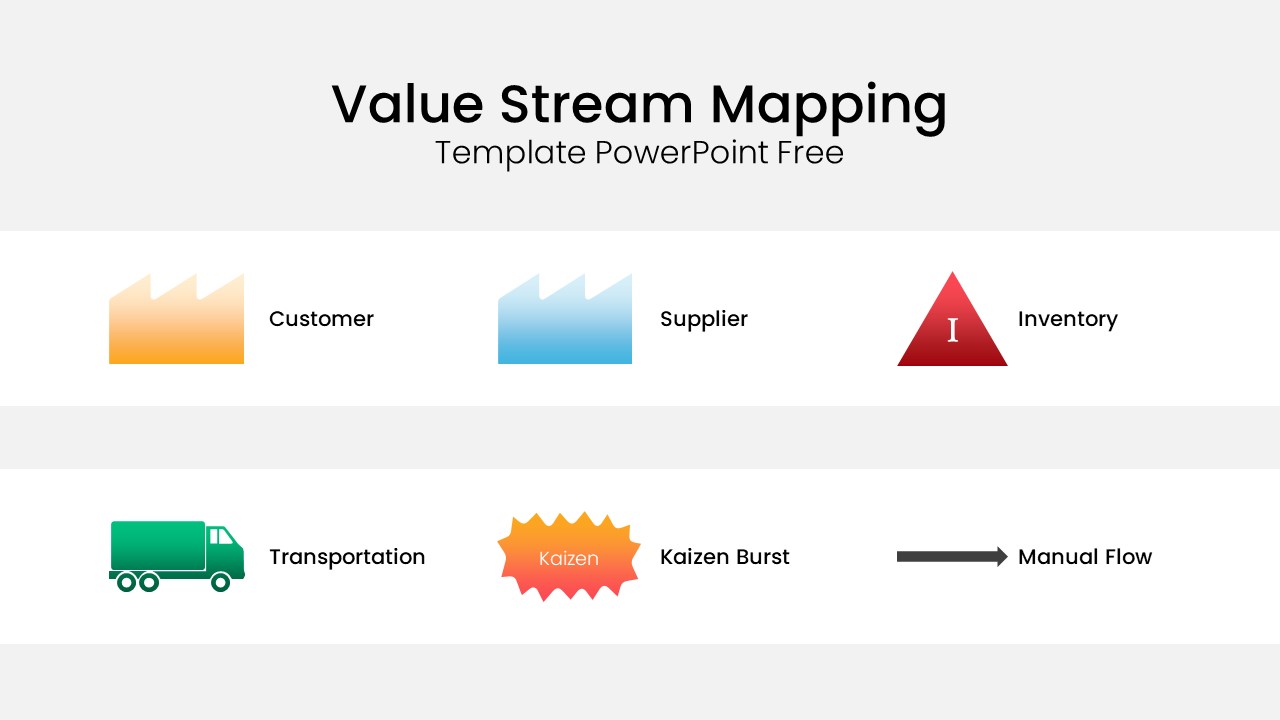
Value Stream Mapping Symbol Legend Template for PowerPoint & Google Slides
Charts
Free
-
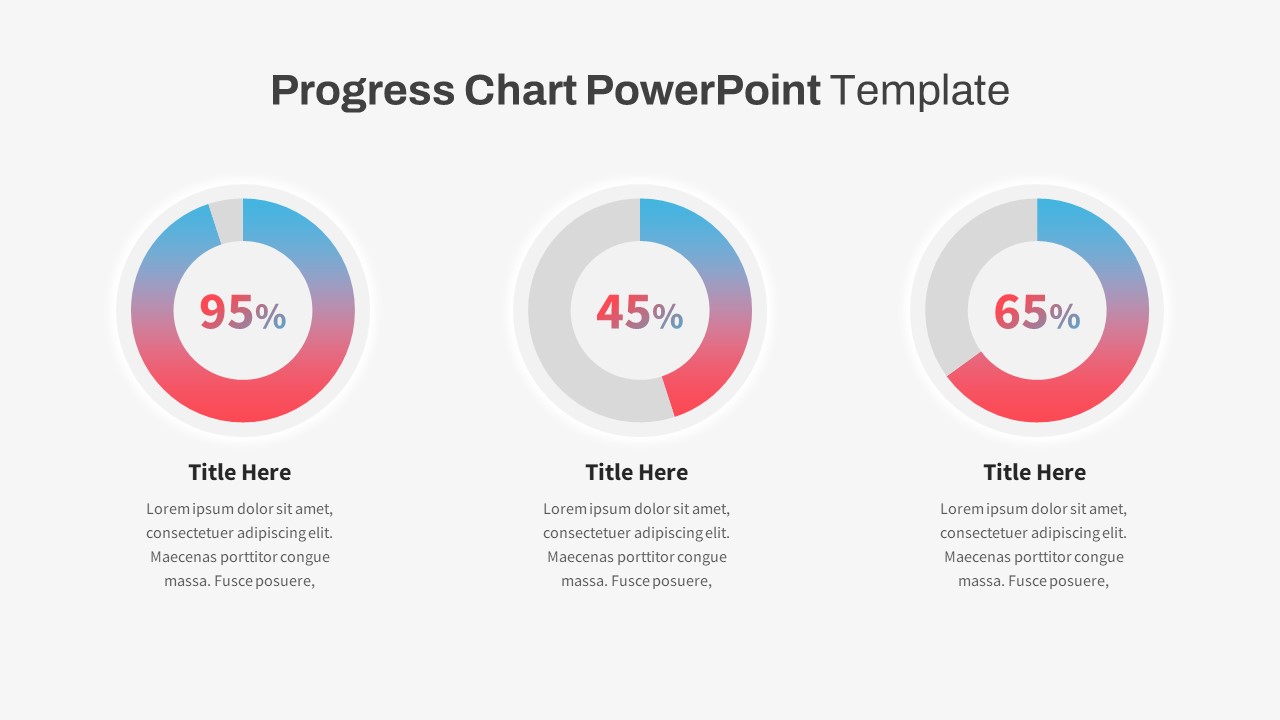
Progress Chart Slide for PowerPoint & Google Slides
Charts
Premium
-
Mirror Bar Chart Comparison Template for PowerPoint & Google Slides
Bar/Column
Premium
-
Rectangle Area Chart with Gradient Fill Template for PowerPoint & Google Slides
Comparison Chart
Premium
-
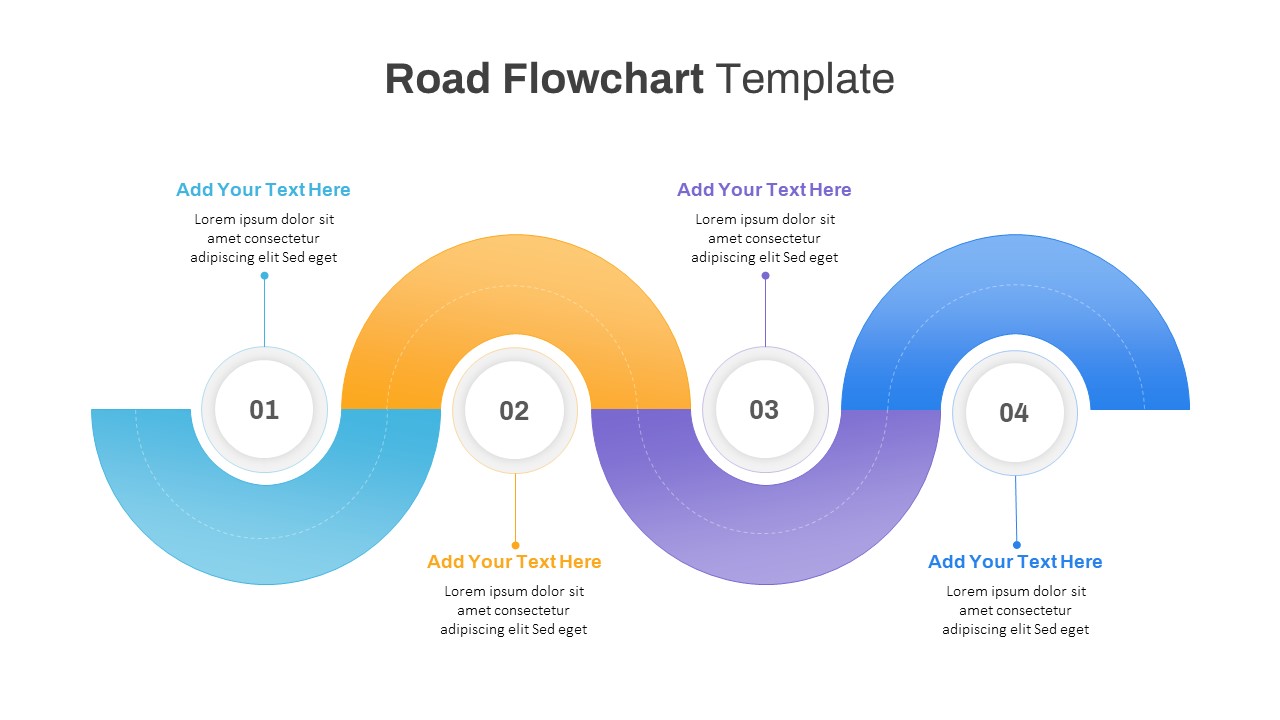
Road Flowchart Process with Four Steps Template for PowerPoint & Google Slides
Flow Charts
Premium
-
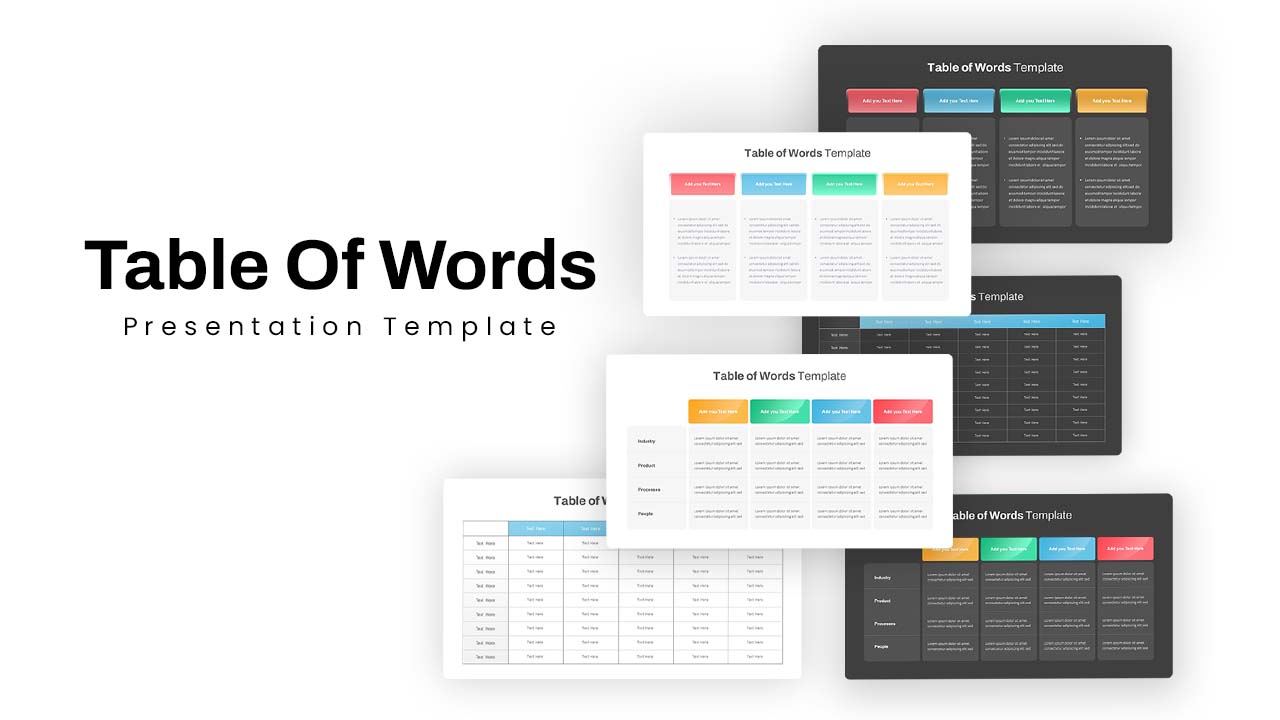
Versatile Table of Words Layout Template for PowerPoint & Google Slides
Table
Premium
-
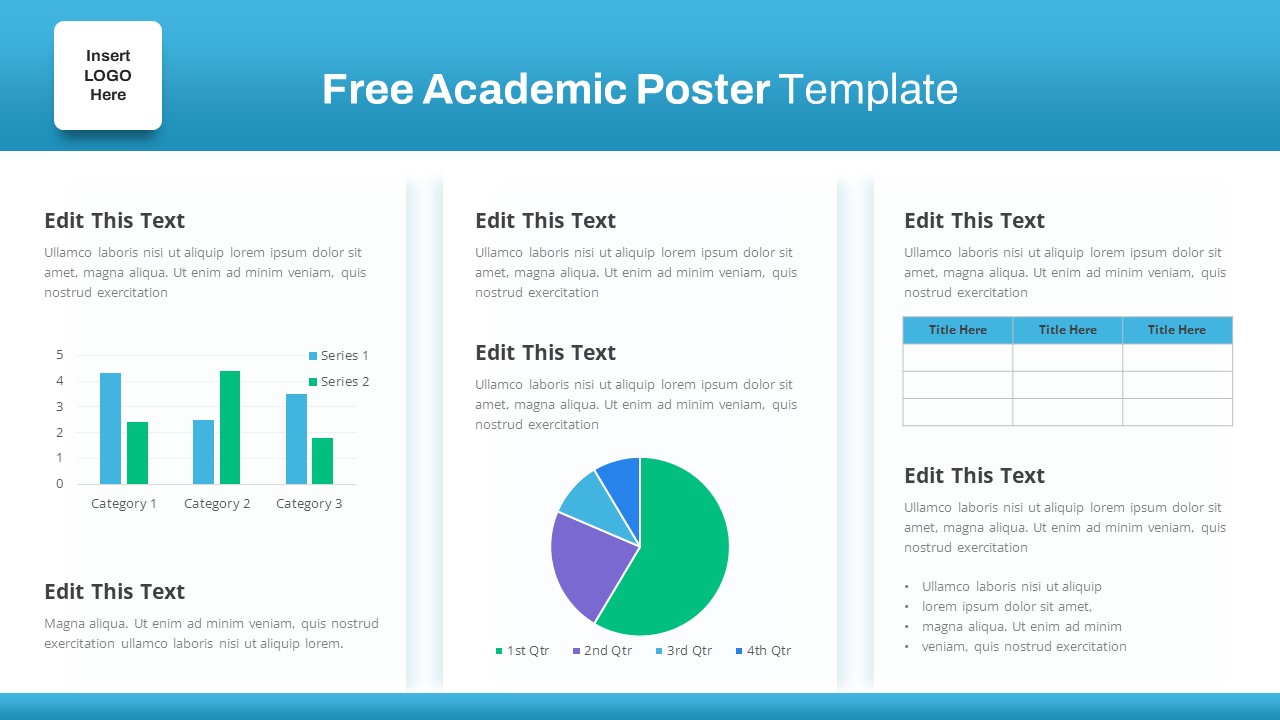
Free Academic Research Poster Design Template for PowerPoint & Google Slides
Bar/Column
Free
-
Professional Quad Chart Layout Template for PowerPoint & Google Slides
Pie/Donut
Premium
-
Data Over Time Line Chart template for PowerPoint & Google Slides
Charts
Premium
-
Professional 100% Stacked Column Chart Template for PowerPoint & Google Slides
Bar/Column
Premium
-
Population Pyramid Chart Analysis Template for PowerPoint & Google Slides
Bar/Column
Premium
-
Combination Bar and Line Chart Template for PowerPoint & Google Slides
Bar/Column
Premium
-
Heat Map Risk Matrix Dashboard Template for PowerPoint & Google Slides
Comparison Chart
Premium
-
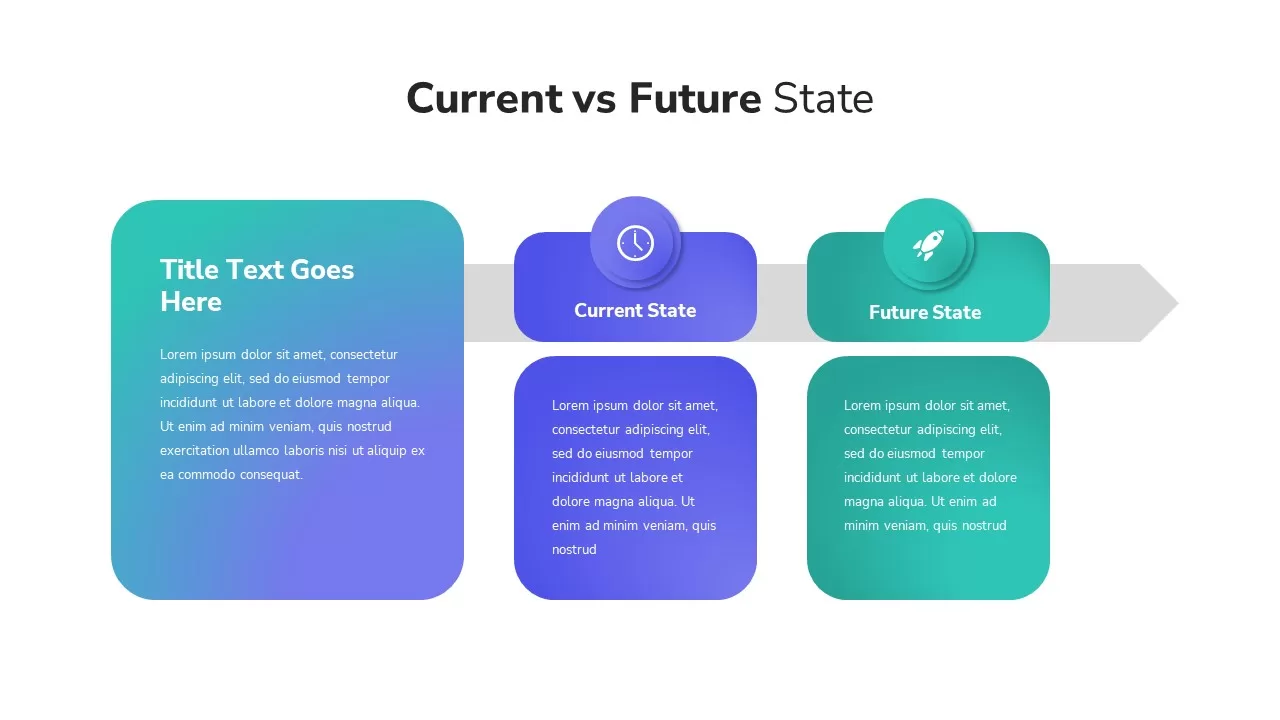
Current vs Future State Comparison Slide Template for PowerPoint & Google Slides
Comparison Chart
Premium
-
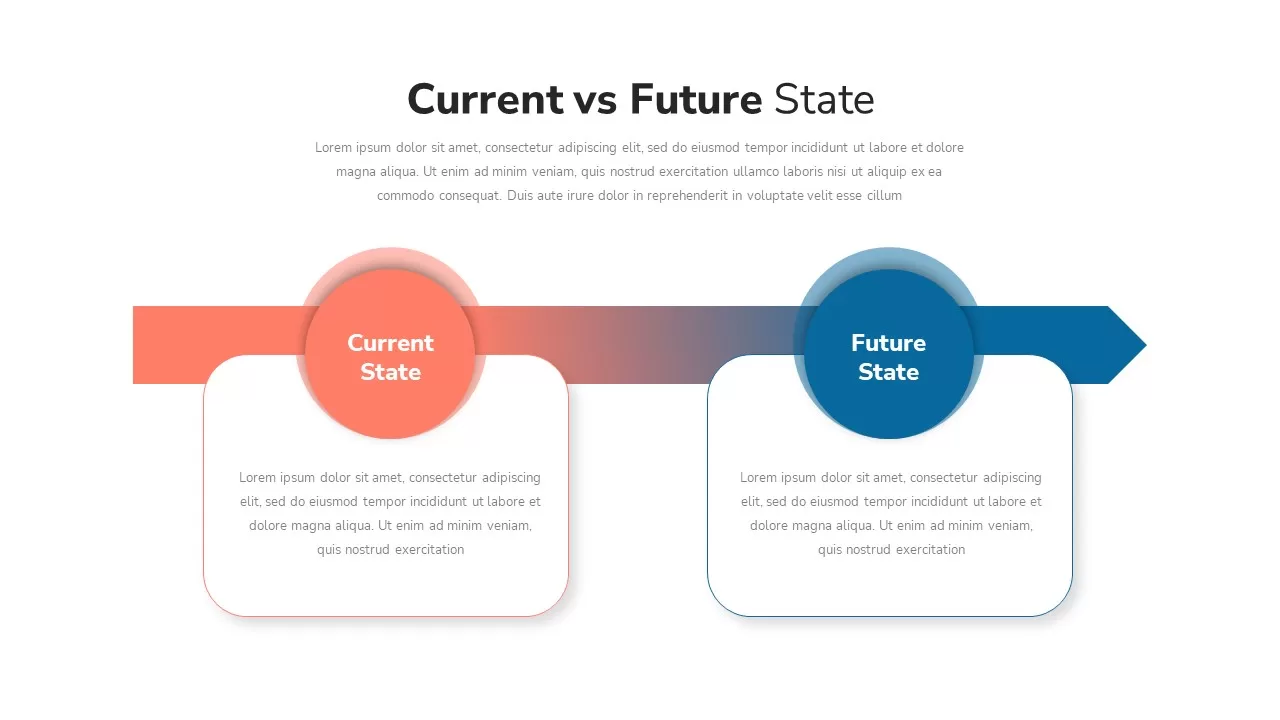
Current vs Future State Comparison Template for PowerPoint & Google Slides
Comparison Chart
Premium
-
Current VS Future State PowerPoint Presentation Template
Comparison Chart
Premium
-
Current vs Future State Comparison Slide Template for PowerPoint & Google Slides
Comparison Chart
Premium
-
Flow Chart Diagram Template for PowerPoint & Google Slides
Flow Charts
Premium
-

Circular Product Comparison Chart Template for PowerPoint & Google Slides
Comparison Chart
Premium
-
Supply Positioning Model Matrix Template for PowerPoint & Google Slides
Comparison Chart
Premium