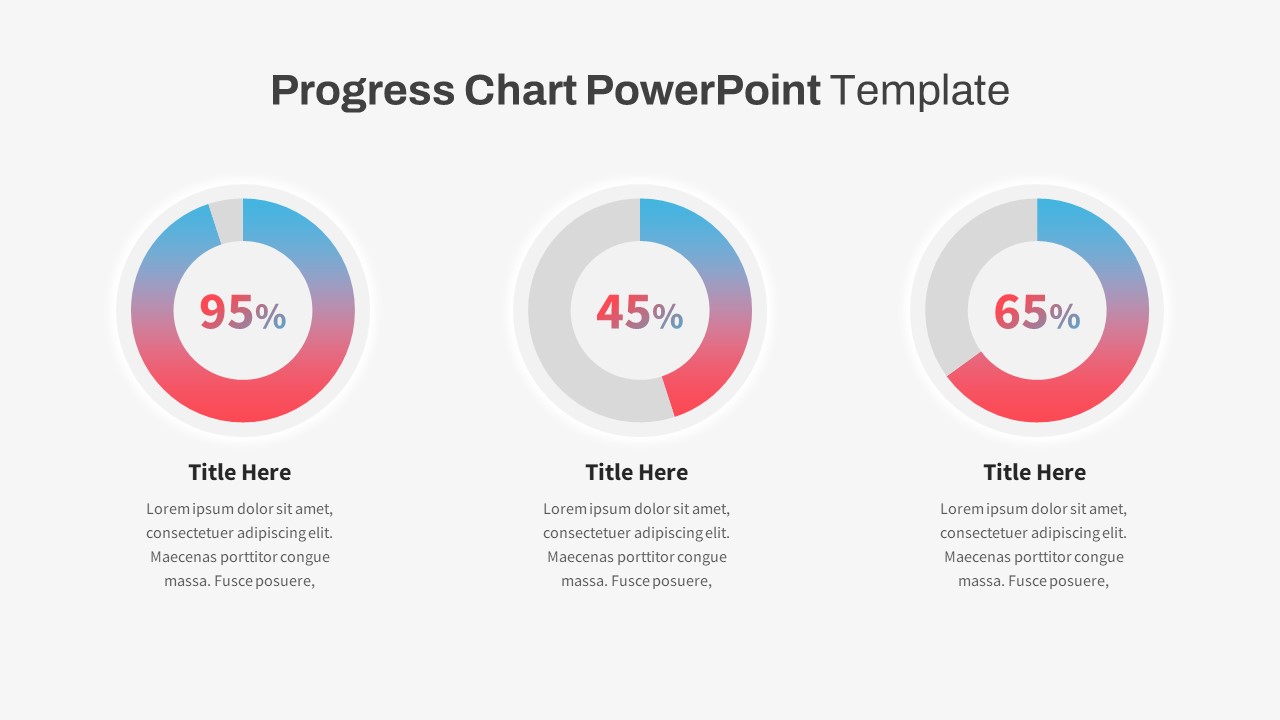
Progress Chart PowerPoint Template


Use progress PowerPoint chart to delineate business, sales, and academic progress reports
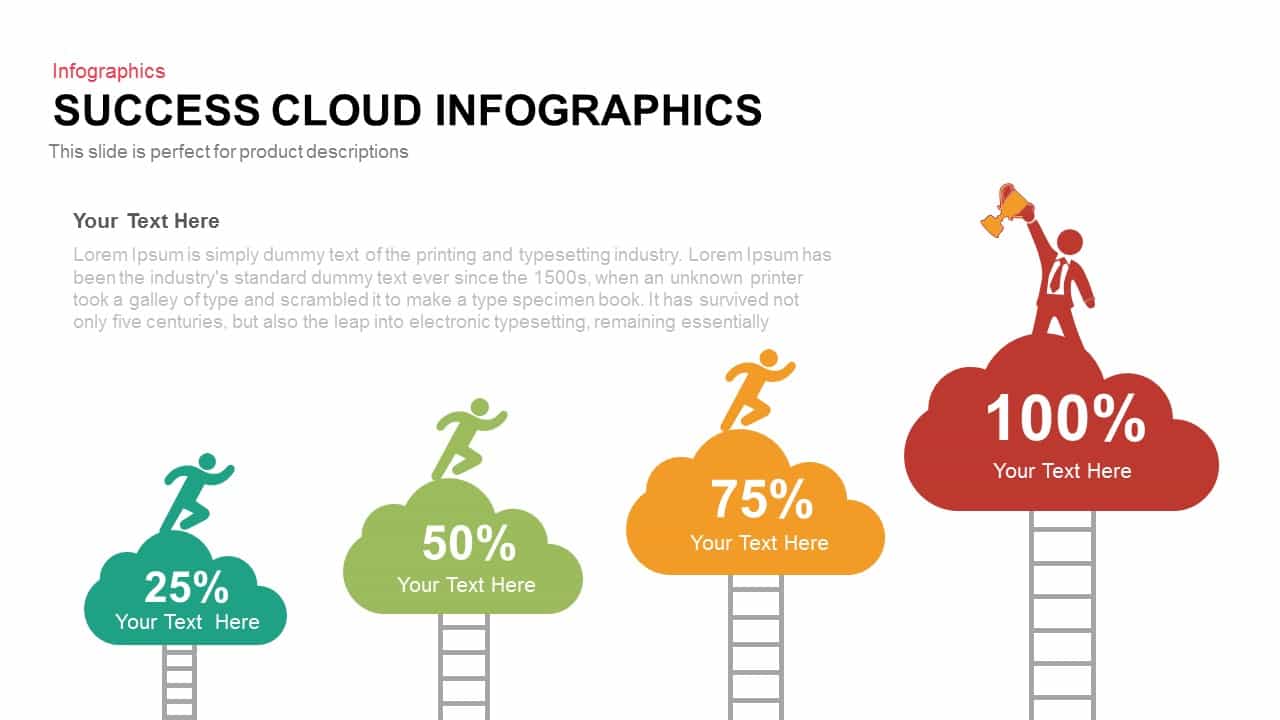
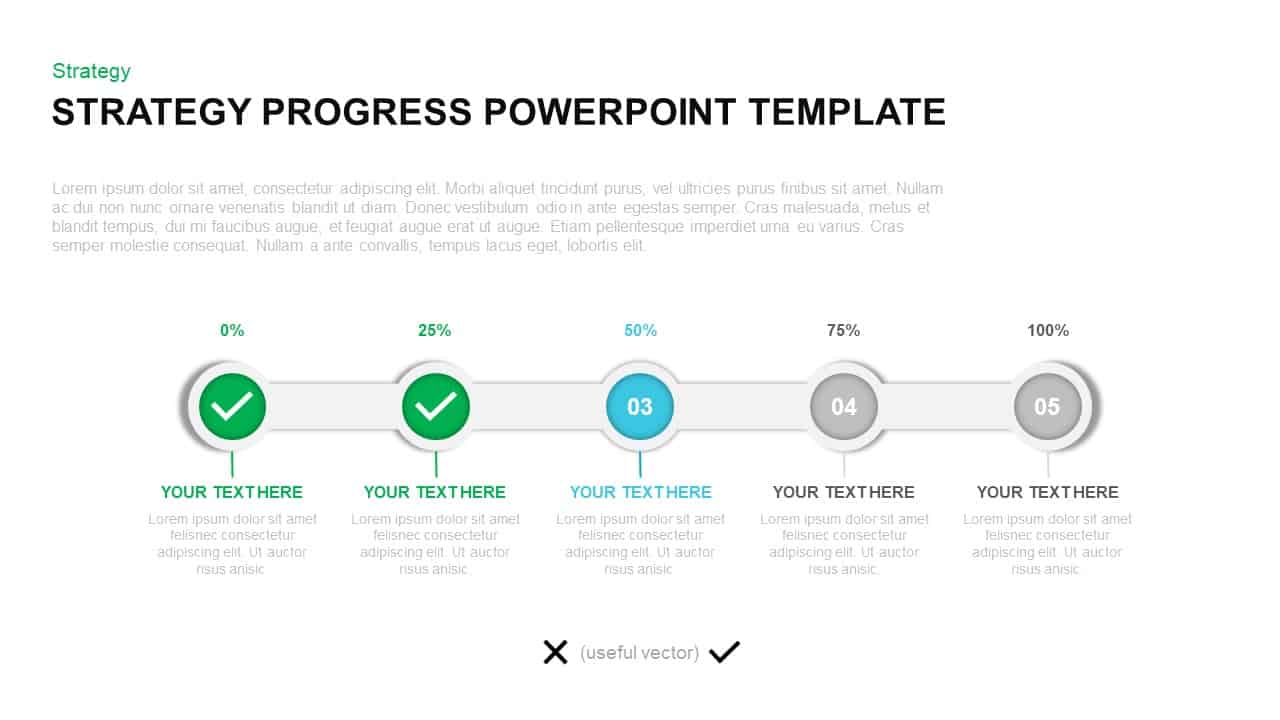
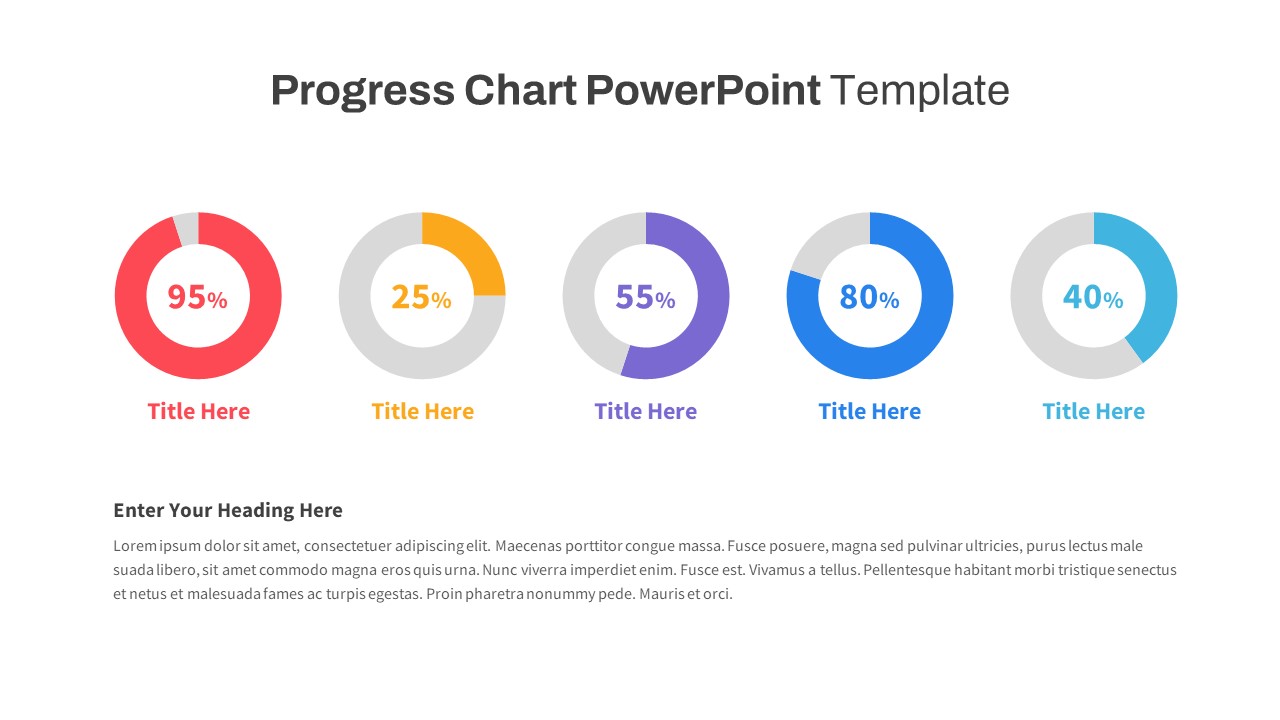
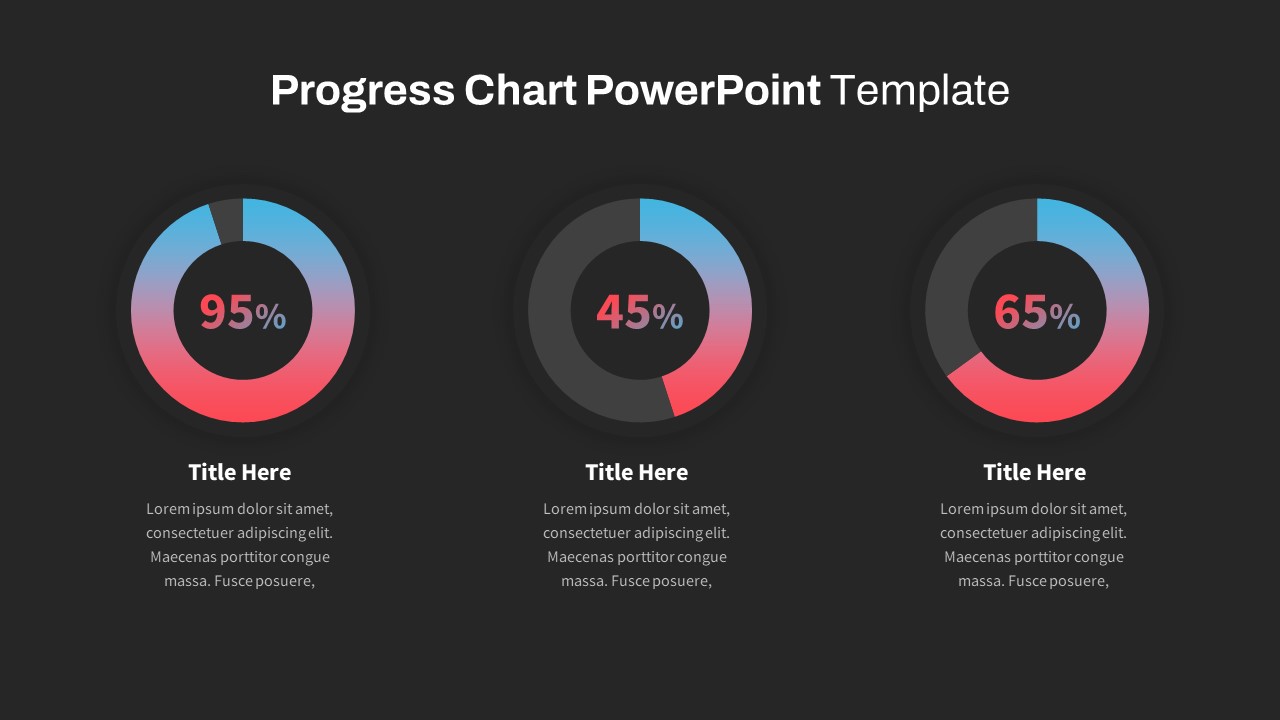
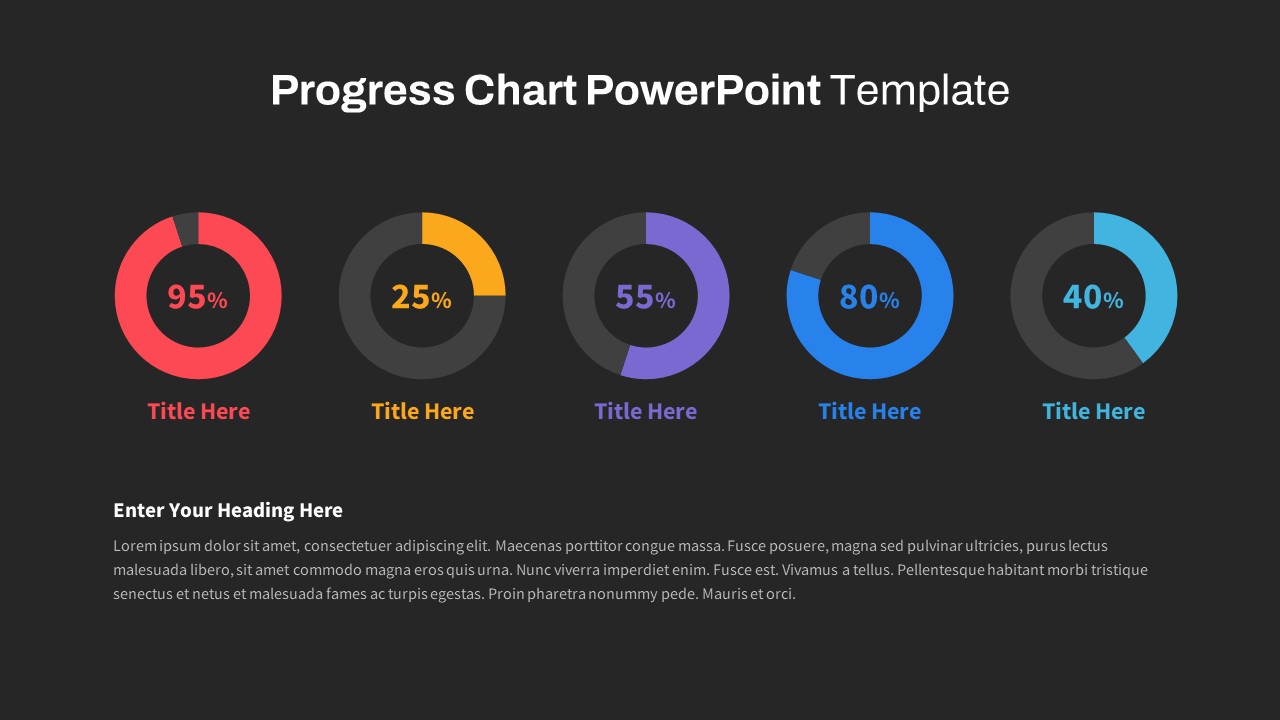
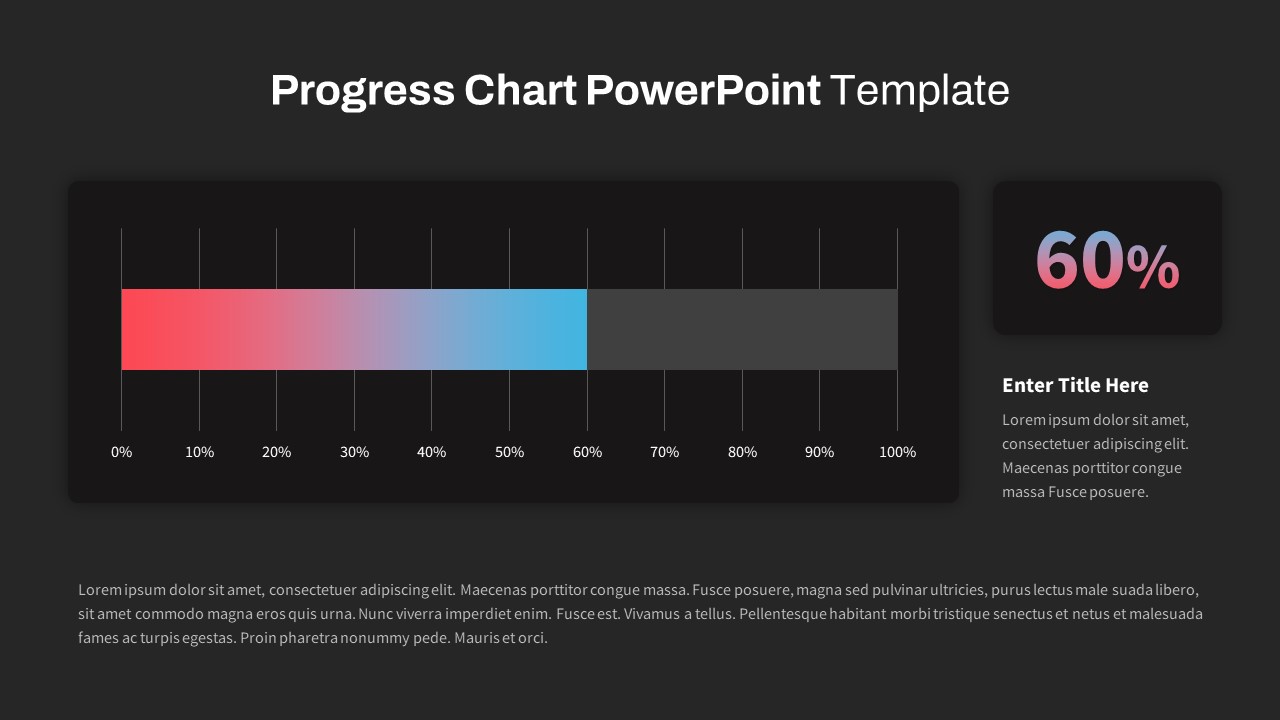
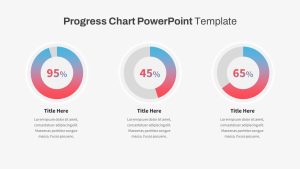
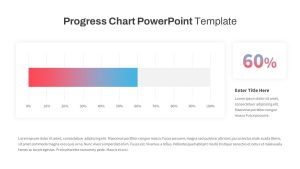
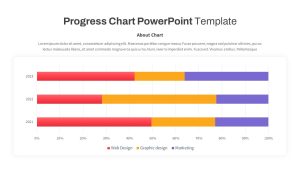
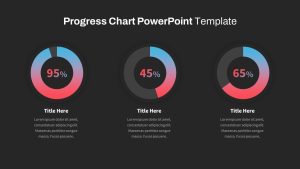
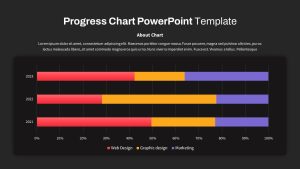
The progress chart PowerPoint template presents a trio of unique designs shaped to amplify your reports. Departing from conventional data-driven charts, these templates offer visually engaging alternatives, featuring horizontal progress bars and dynamic donut charts. The infographic diagram designs of the progress bar templates serve as powerful tools for illustrating quantitative data and injecting vitality into your presentations. When raw numbers fail to captivate, these templates infuse your reports with a fresh perspective, filling them with a sense of positivity and achievement. Utilize these versatile designs to elucidate the journey of growth, demonstrating the efficacy of diverse strategies and plans in achieving progression.
How to create a bar chart in PowerPoint?
Making a bar chart in PowerPoint is simple and it helps gear up your slides. First off, open PowerPoint and pick the slide where you want the chart. Then, open the “Insert” tab and click “Chart.” In the menu that pops up, go for the “Bar” option. Now, you can put in your data either right there in PowerPoint or in the Excel sheet that shows up. Once your numbers are in, close Excel and your bar chart magically appear on the slide! You can adjust it; however, you like with colors, labels, and other cool stuff to match your presentation vibe.
Progress chart template for PowerPoint presentation enables users to add sales figures, distribution percentages, project milestones, and performance reviews. It is best for the fields like business, finance, education, marketing, and research. Corporate executives, educators, consultants, researchers and business managers can download progress charts to delineate statistical reports based on performance.
The PowerPoint progress presentation chart offers a comprehensive array of statistical diagrams to effectively illustrate your research findings. It features a dynamic combination of doughnut charts, bar charts, and visually appealing color-filled single bar chart models, all designed with high-quality graphical elements. Each chart and graph in PowerPoint showcases values alongside percentage distributions, ensuring clarity and precision in data representation. For instance, the single bar chart employs parallel designs to depict the proportions of sales figures or other outcomes through subtle yet impactful color variations. Similarly, the doughnut chart and bar chart excel in presenting multiple items with vibrant color blends, enriching the visual narrative of your research outcomes. Download it now!
Login to download this file

Item ID
SB04153
Related Templates

Free Curved Arrow Progress Chart template for PowerPoint & Google Slides
Project
Free
iPad App Mockup with Progress Metrics Template for PowerPoint & Google Slides
Bar/Column
Success Cloud Progress Infographics Template for PowerPoint & Google Slides
Charts

Growth Arrow for Progress & Growth template for PowerPoint & Google Slides
Arrow
Strategy Progress Timeline Template for PowerPoint & Google Slides
Process
Performance Review Progress Management Template for PowerPoint & Google Slides
Process
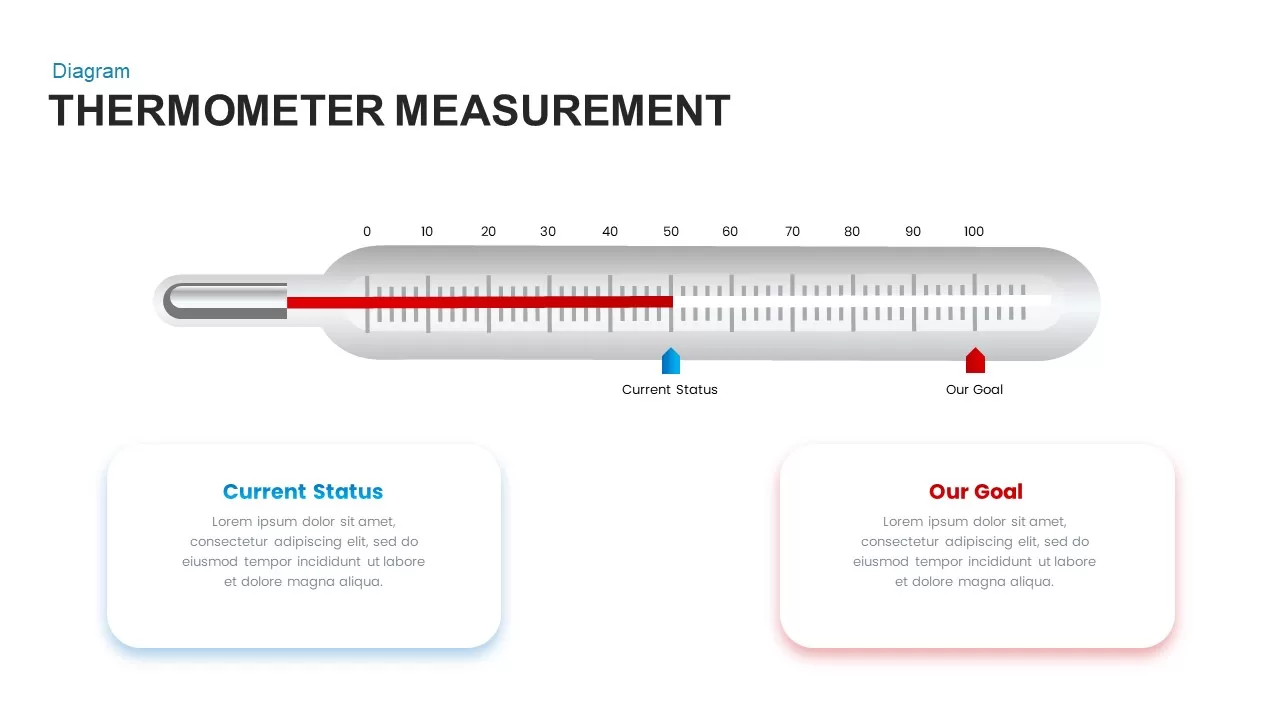
Thermometer Gauge Progress Measurement Template for PowerPoint & Google Slides
Comparison
Dynamic Statistics & Progress Charts Template for PowerPoint & Google Slides
Pie/Donut
Agriculture Infographics Slide with Progress Rings & Metrics Template for PowerPoint & Google Slides
Pie/Donut
Progress Timeline Bar PowerPoint Template
Timeline
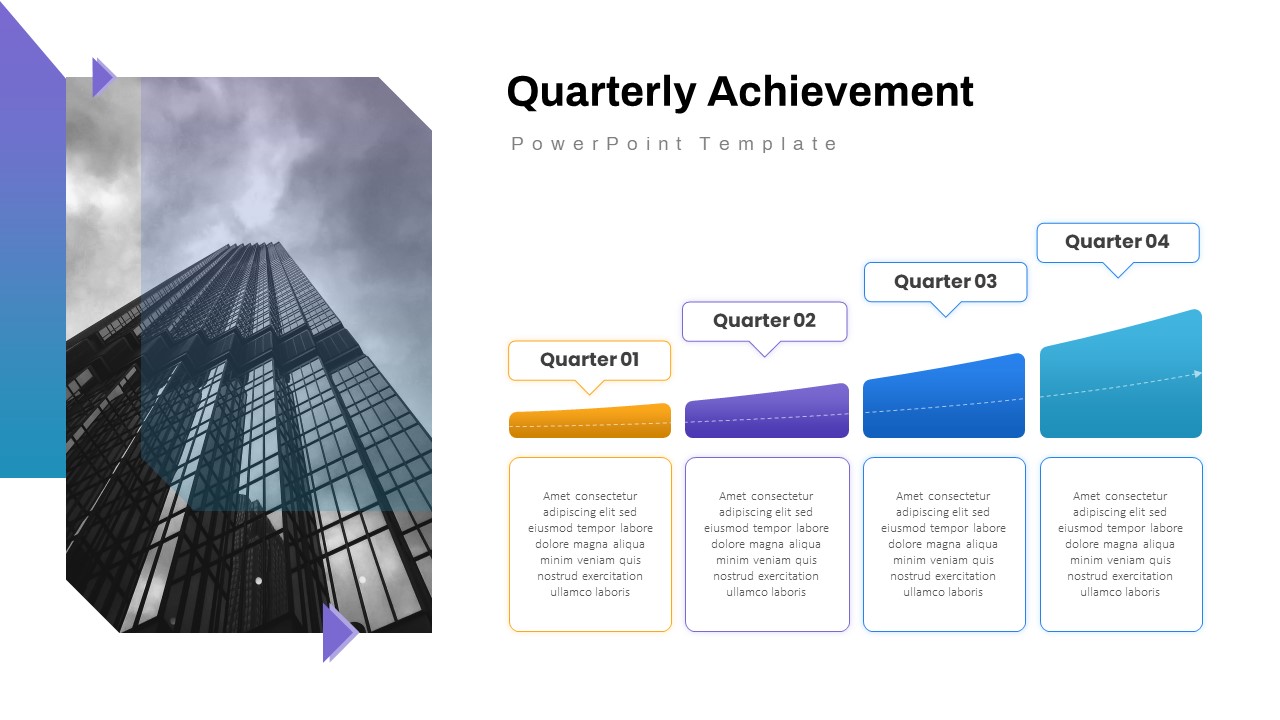
Quarterly Achievement Progress Template for PowerPoint & Google Slides
Accomplishment
Progress Bar and Milestone Visualization Template for PowerPoint & Google Slides
Timeline
Project Progress Dashboard Pie Charts Template for PowerPoint & Google Slides
Project
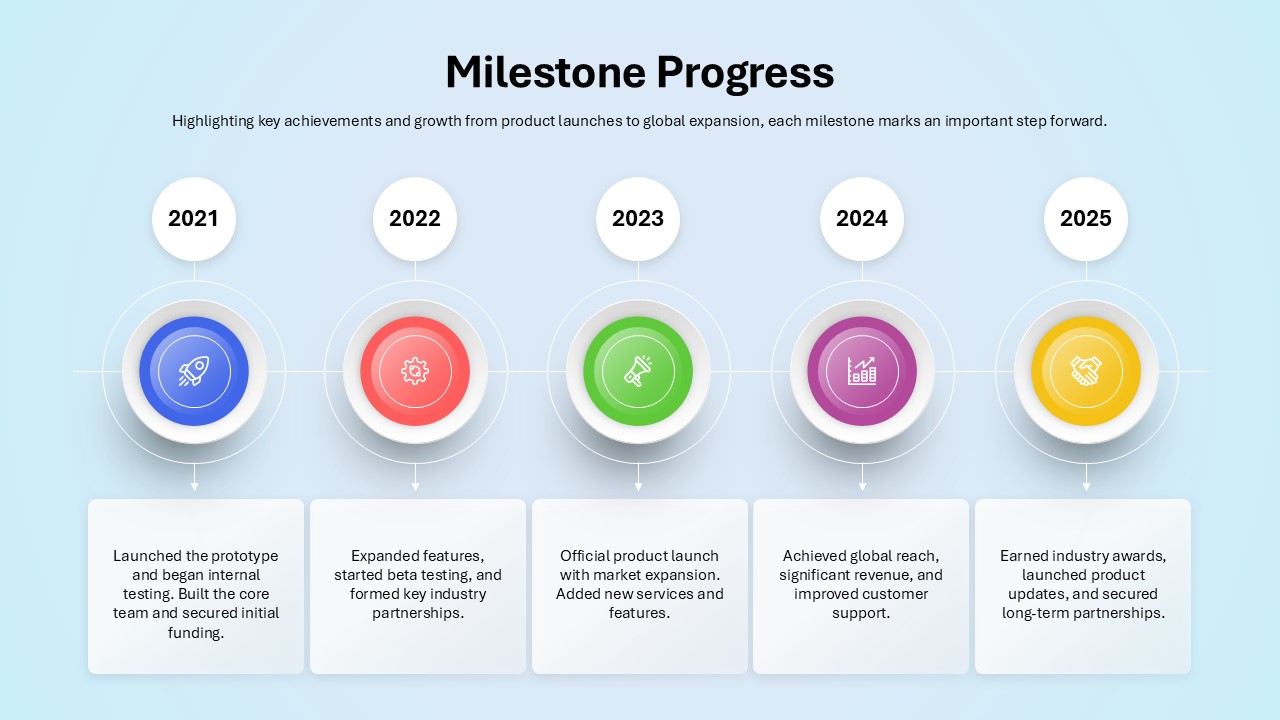
Milestone Progress template for PowerPoint & Google Slides
Business Plan
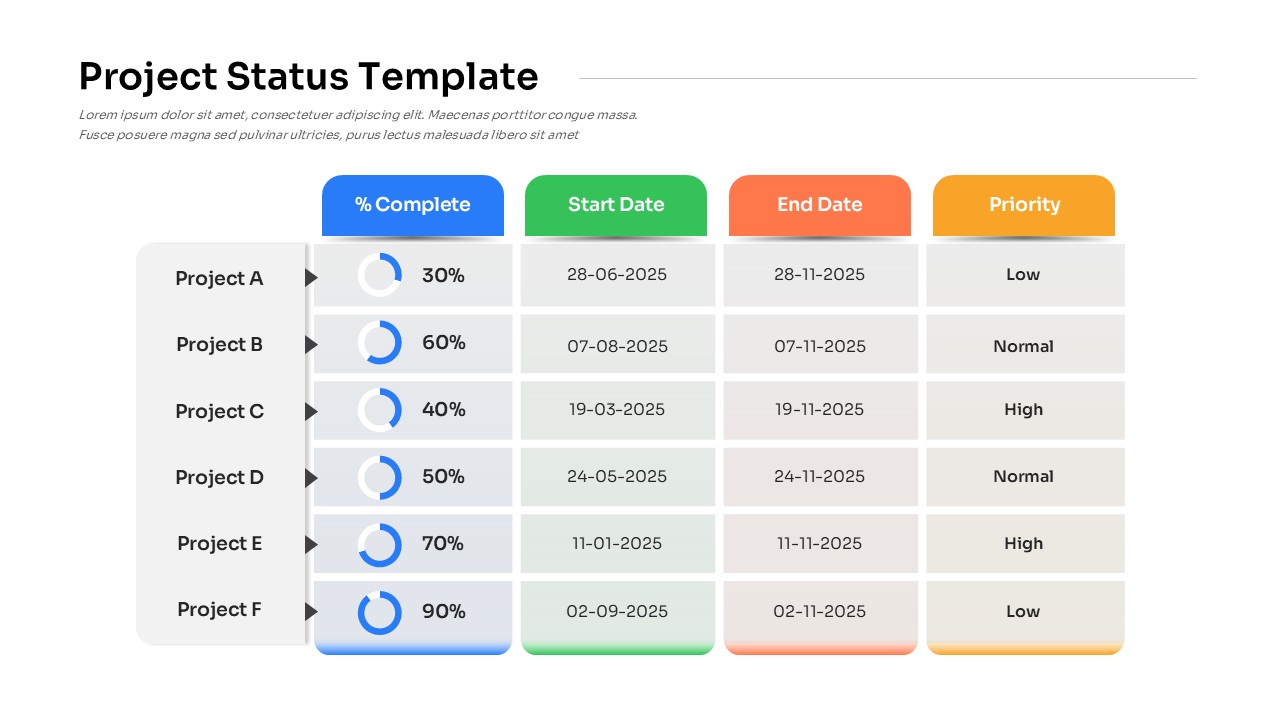
Project Status with Progress & Priority Template for PowerPoint & Google Slides
Table
Progress Bar Graph Layout Design for PowerPoint & Google Slides
Charts
Progress Bar Infographic for PowerPoint & Google Slides
Business
Progress Bar infographic pack for PowerPoint & Google Slides
Business
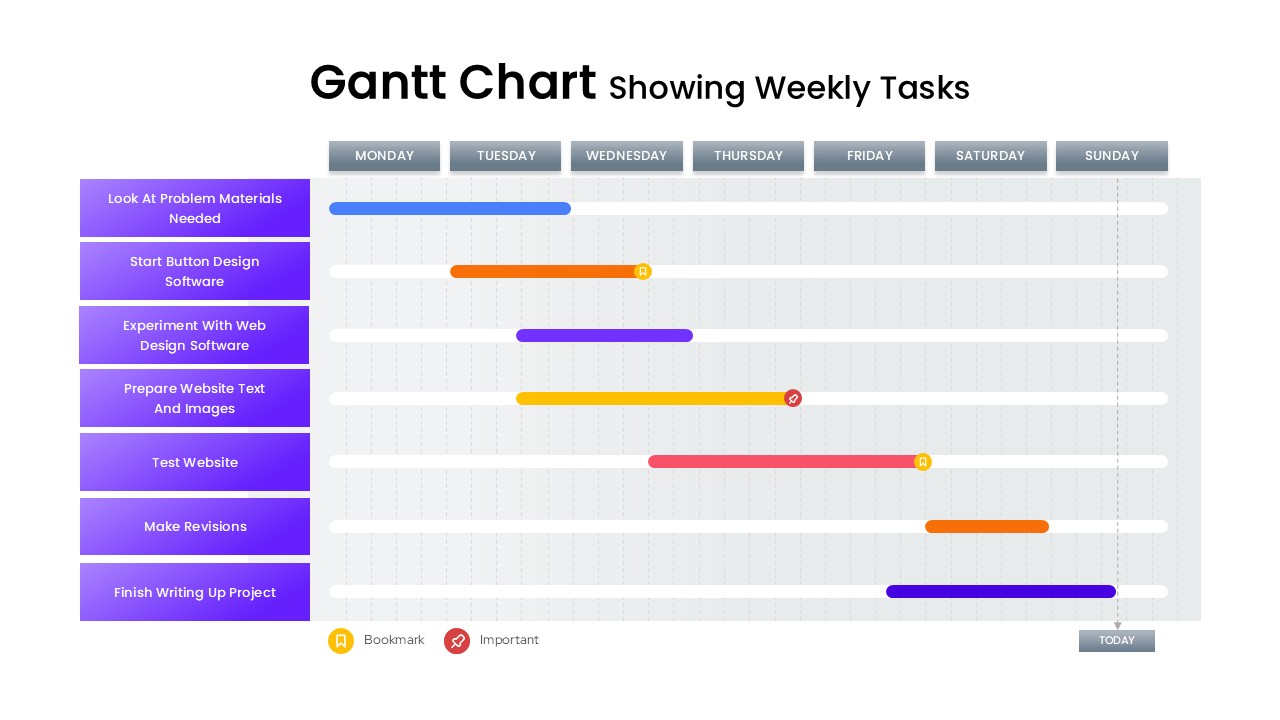
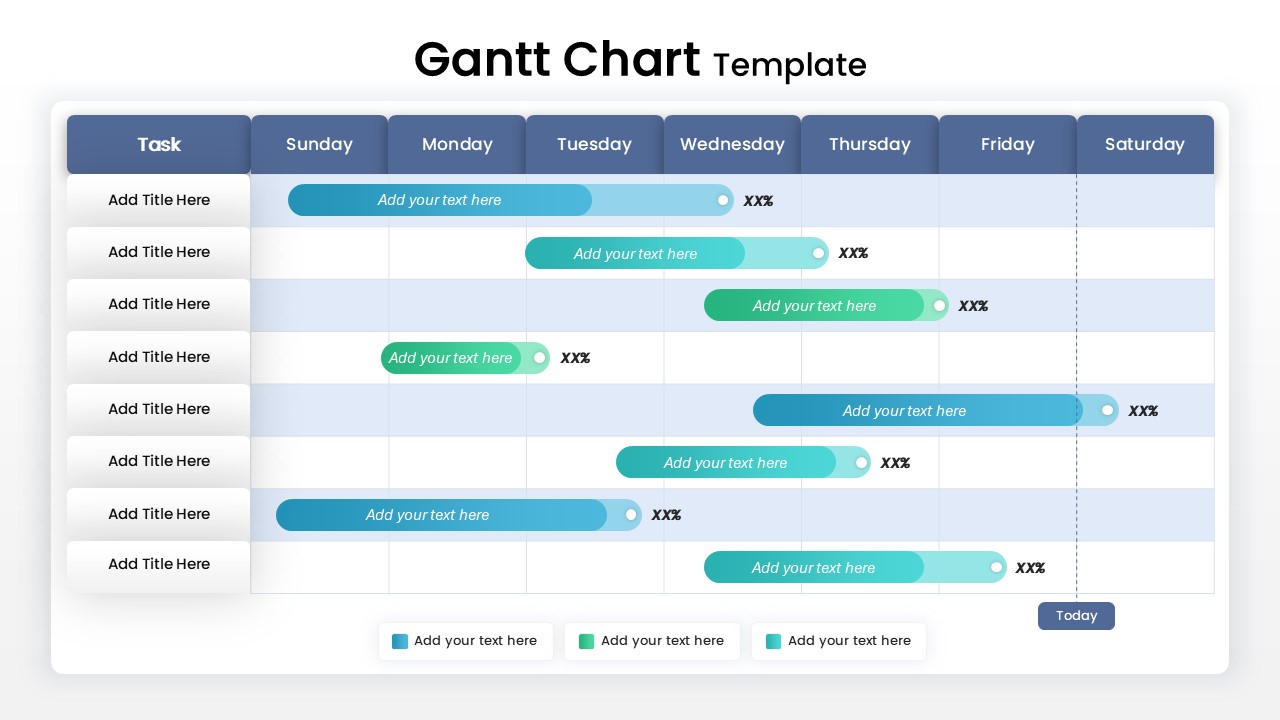
Gantt Chart Template Showing Weekly Tasks Template for PowerPoint & Google Slides
Gantt Chart
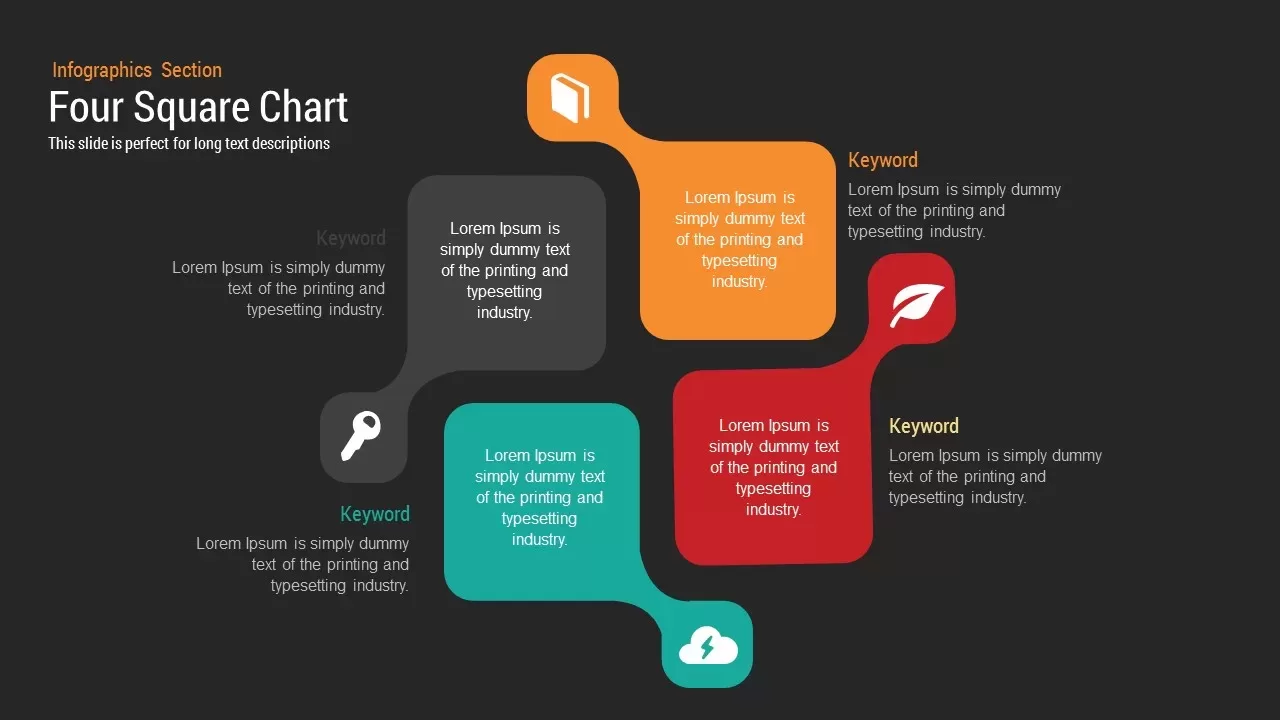
Four Square Chart template for PowerPoint & Google Slides
Charts
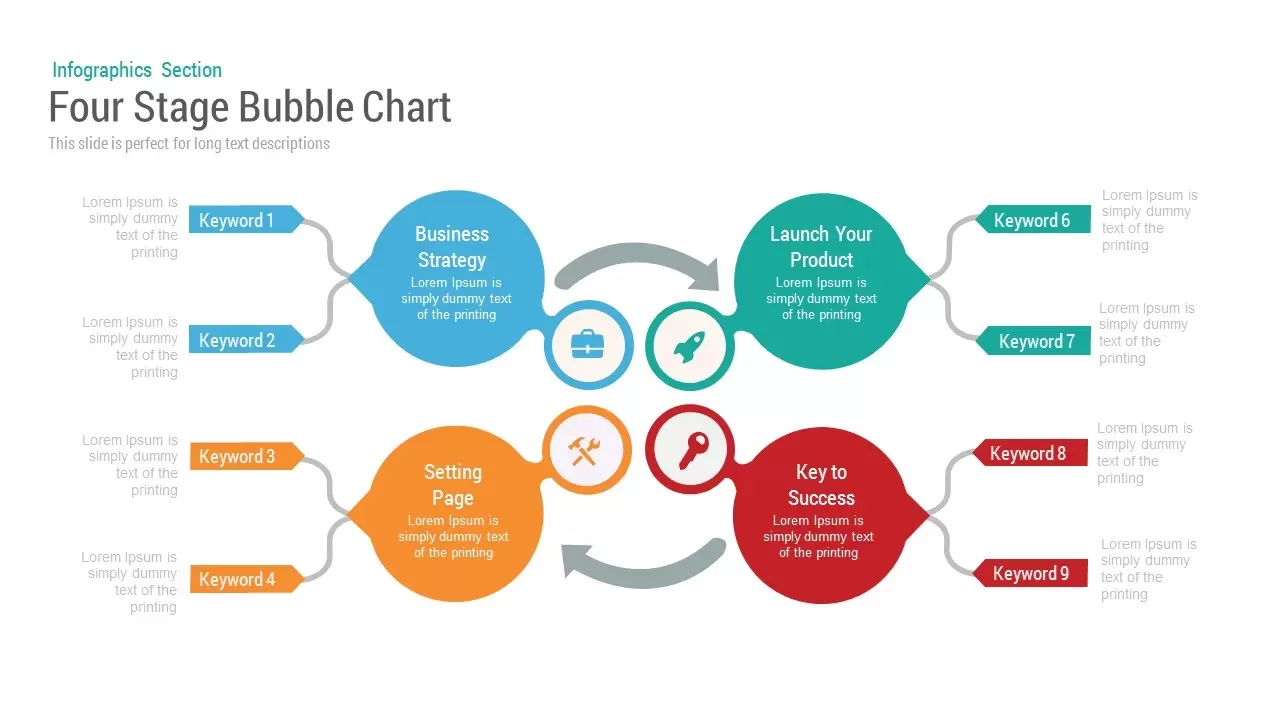
Bubble Chart template for PowerPoint & Google Slides
Charts
Creative SWOT Chart template for PowerPoint & Google Slides
SWOT

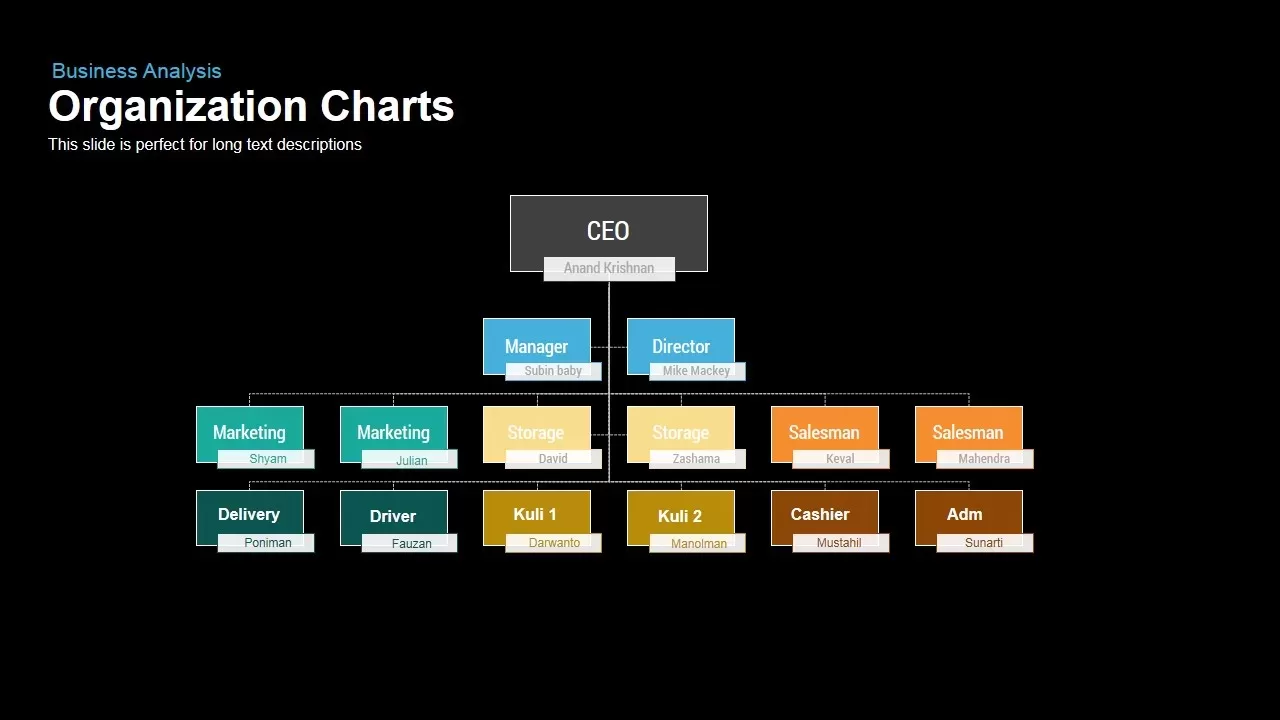
Corporate Organization Chart template for PowerPoint & Google Slides
Org Chart
Donut Chart template for PowerPoint & Google Slides
Pie/Donut
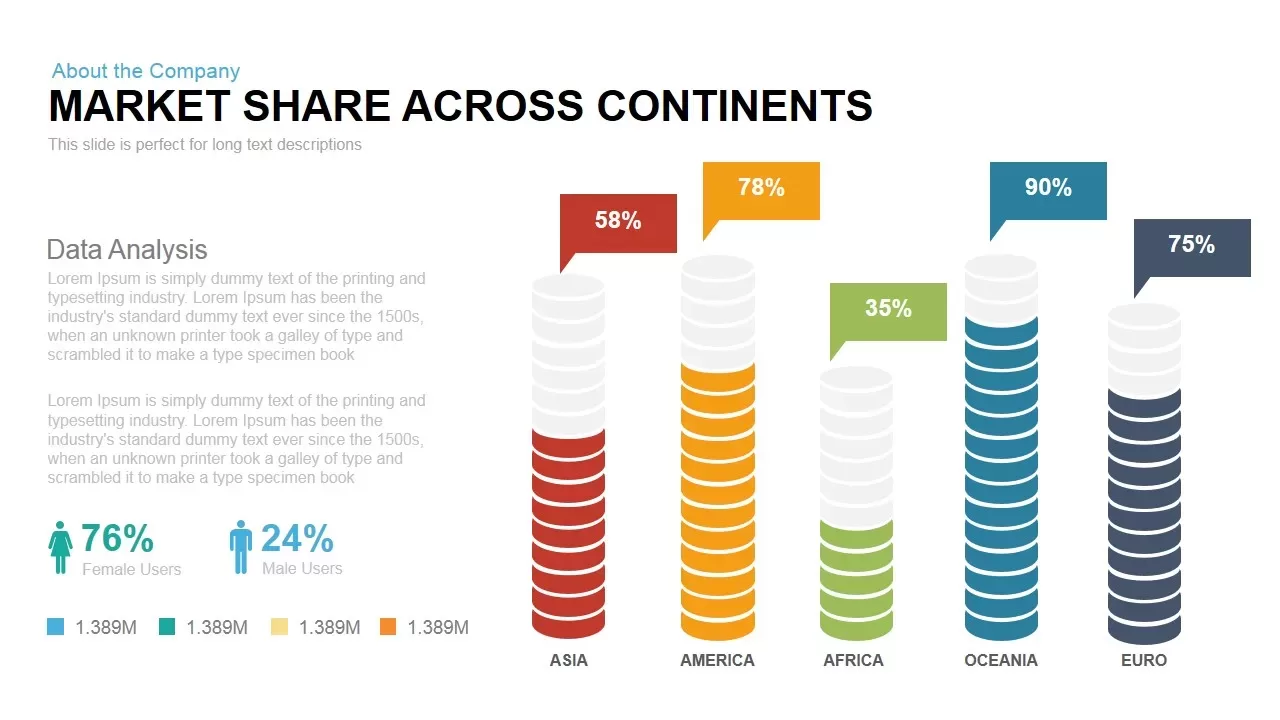
Global Market Share Cylinder Chart Template for PowerPoint & Google Slides
Bar/Column
Business Organization Chart Hierarchy Template for PowerPoint & Google Slides
Org Chart
Creative Dynamic Gantt Chart Timeline Template for PowerPoint & Google Slides
Timeline
Simple Organizational Chart Infographic Template for PowerPoint & Google Slides
Org Chart
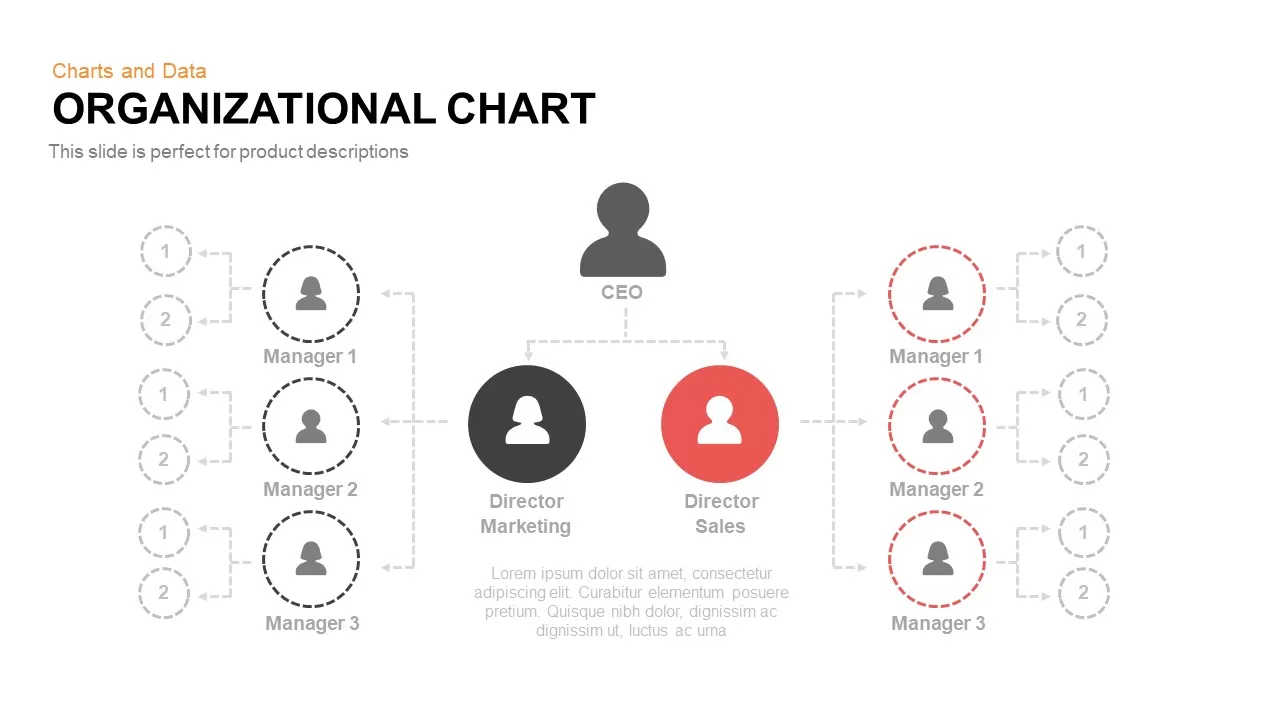
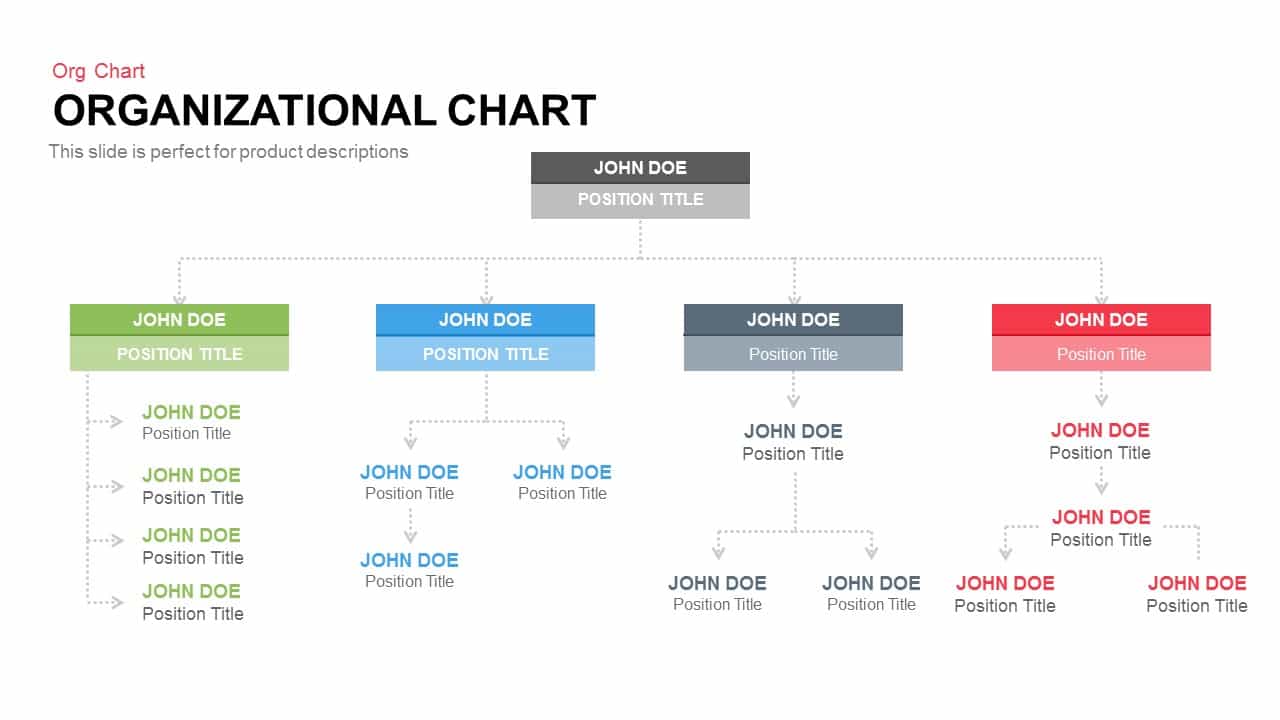
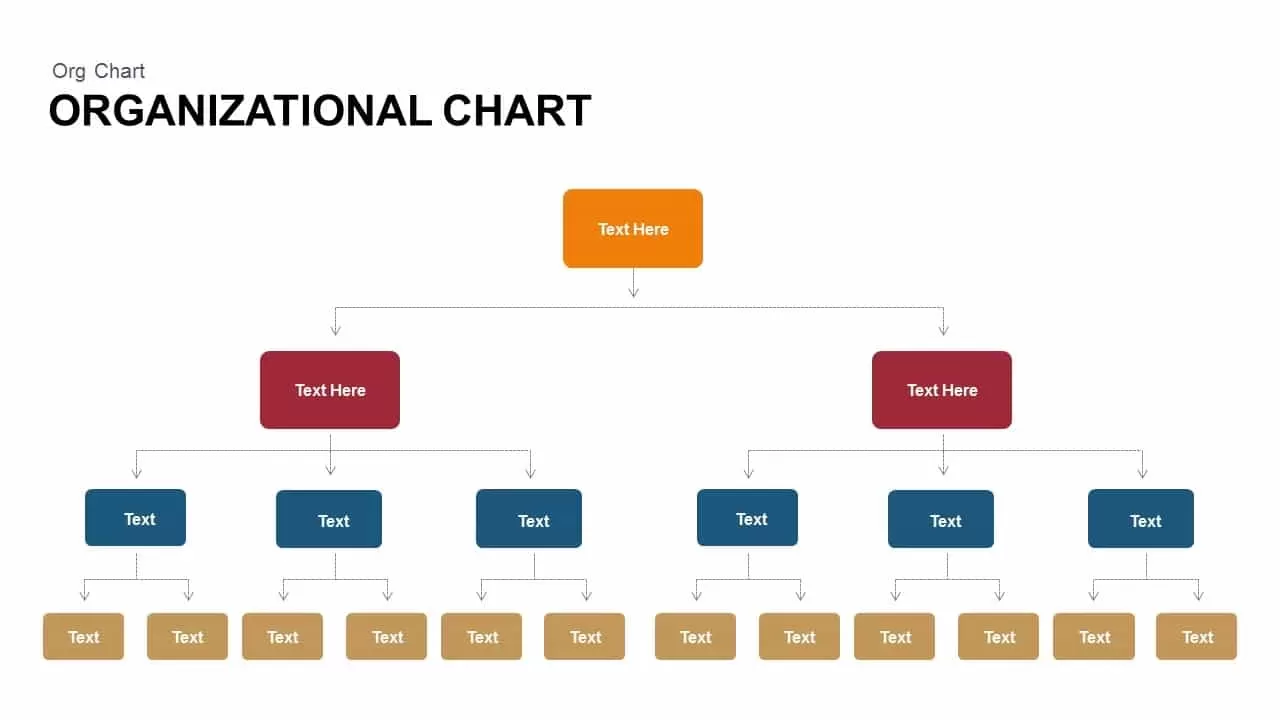
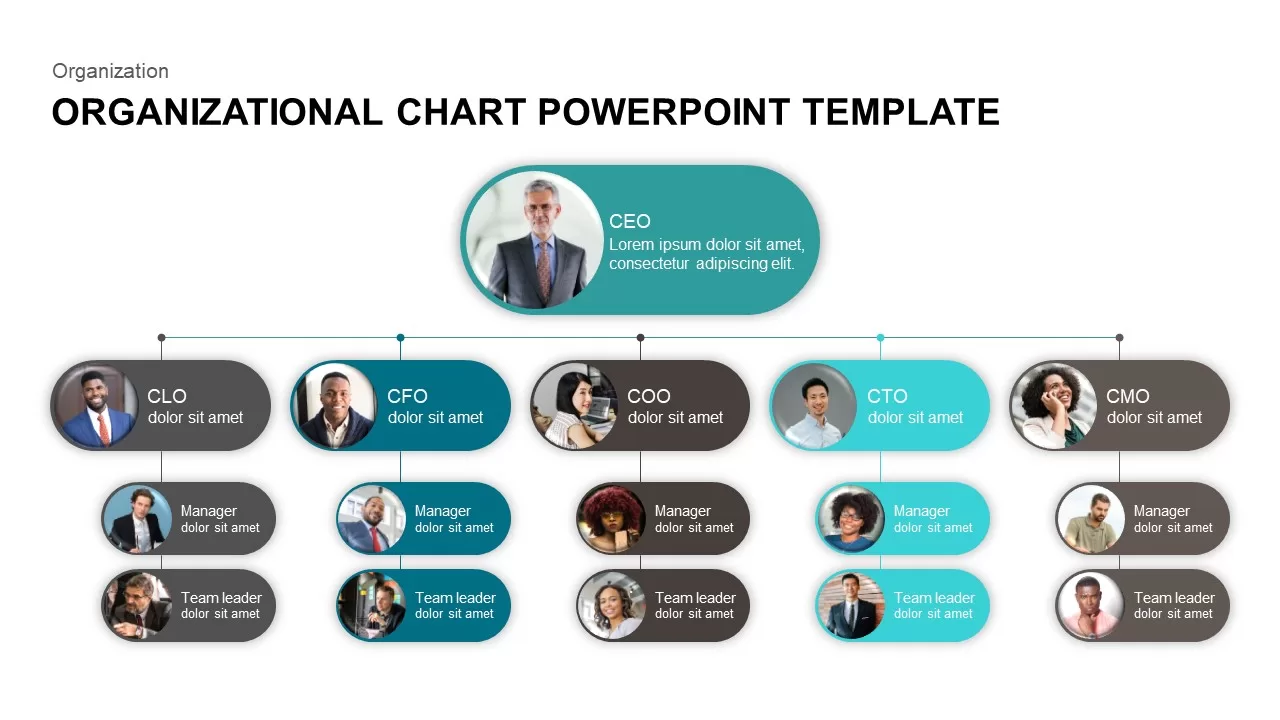
Organizational Chart Template for PowerPoint & Google Slides
Org Chart
Pencil Bar Chart Data Analysis Template for PowerPoint & Google Slides
Bar/Column
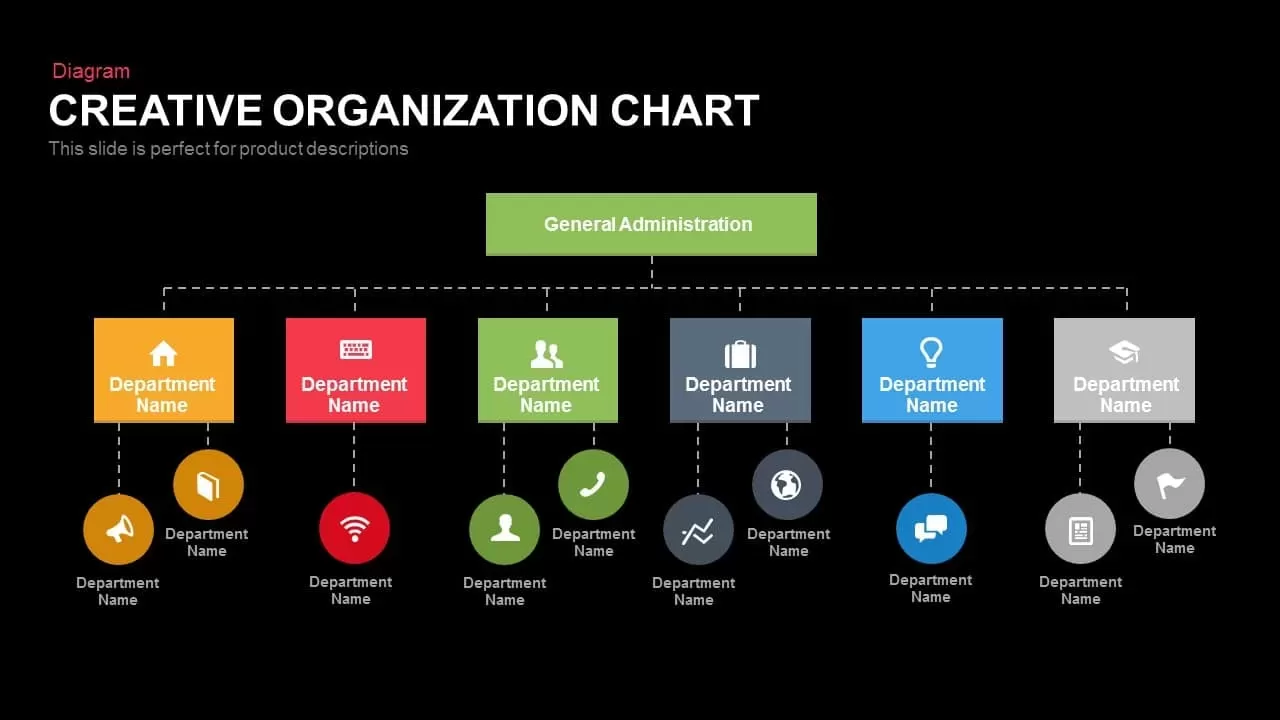
Creative Organization Chart Diagram Template for PowerPoint & Google Slides
Org Chart
Corporate Org Chart template for PowerPoint & Google Slides
Org Chart

Fully Editable Gantt Chart Timeline template for PowerPoint & Google Slides
Gantt Chart
Modern Ten-Block Section Title Chart template for PowerPoint & Google Slides
Comparison

Product Usage Analytics Dashboard Chart Template for PowerPoint & Google Slides
Bar/Column
Five-Stage People Infographic Chart template for PowerPoint & Google Slides
Process
Sales vs Budget Performance Chart Template for PowerPoint & Google Slides
Bar/Column
Interactive Product Comparison Bar Chart Template for PowerPoint & Google Slides
Bar/Column
Organizational Chart PowerPoint Template
Org Chart

Clustered Column Chart Data Analysis Template for PowerPoint
Bar/Column
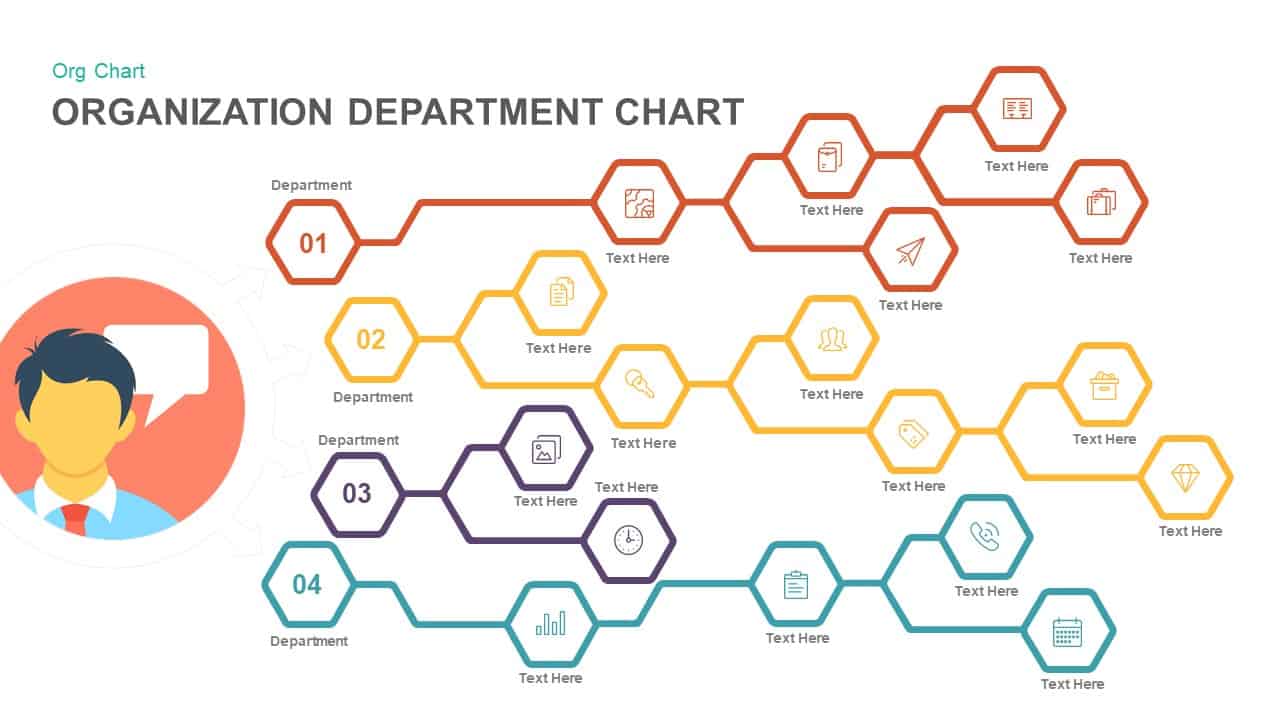
Organization Department Hexagon Chart Template for PowerPoint & Google Slides
Org Chart
Corporate Organizational Chart PowerPoint Template
Org Chart
For and Against Vote Count Bar Chart Template for PowerPoint & Google Slides
Bar/Column
Entertainment Industry Revenue Bar Chart Template for PowerPoint & Google Slides
Bar/Column
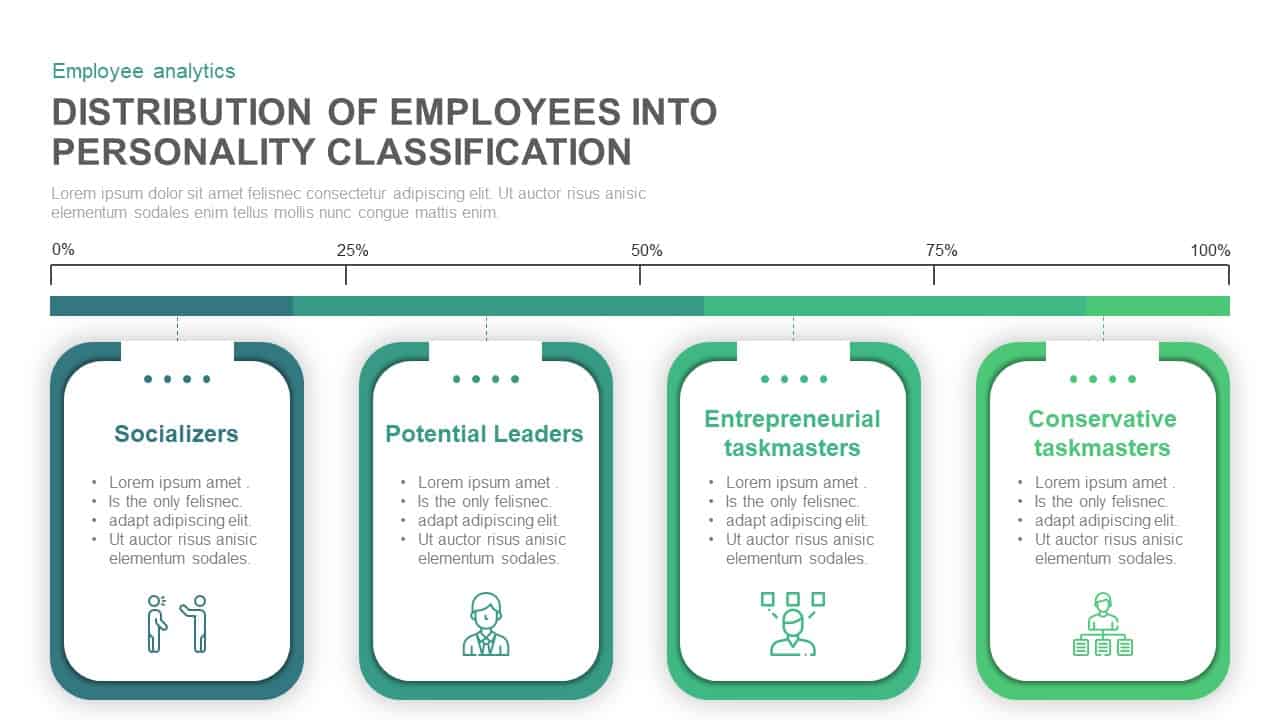
Employee Personality Distribution Chart Template for PowerPoint & Google Slides
Bar/Column
Capital Structure Dynamic Split Chart Template for PowerPoint & Google Slides
Comparison Chart

Dynamic Marketing Radar Chart Analytics Template for PowerPoint & Google Slides
Comparison
Flow Chart Diagram Template for PowerPoint & Google Slides
Flow Charts
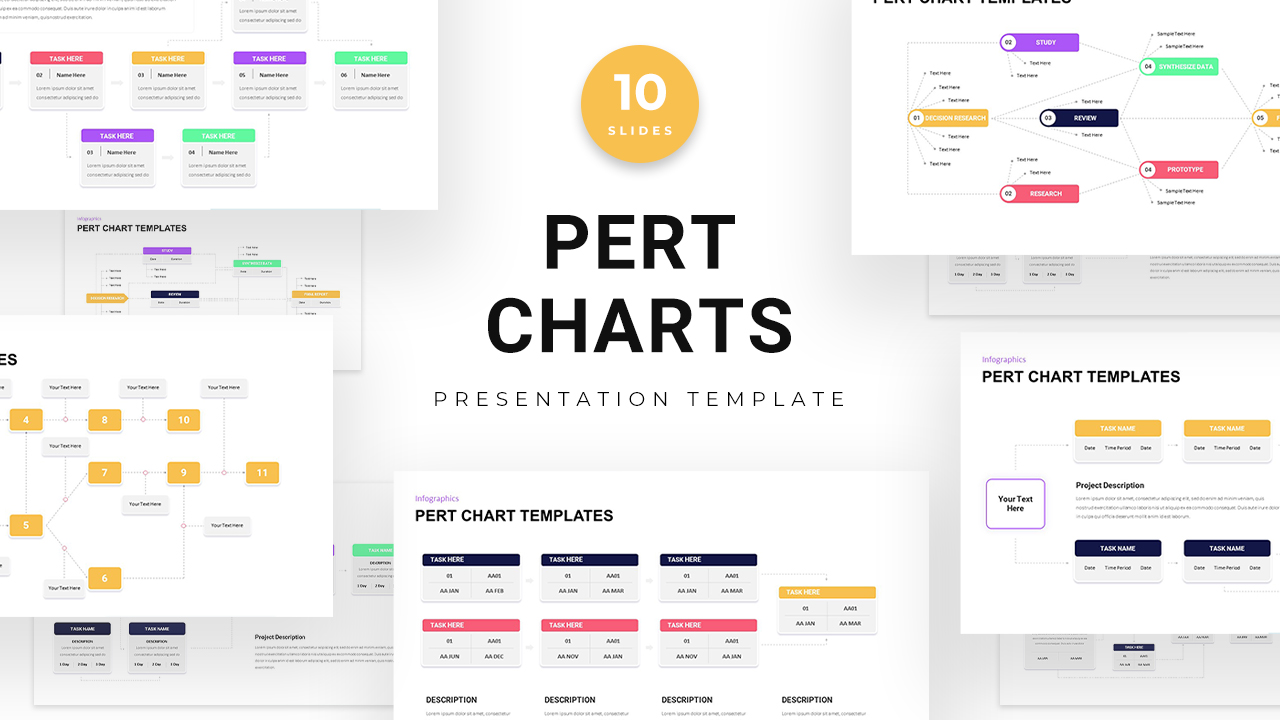
PERT Chart Project Management template for PowerPoint & Google Slides
Project Status
Organizational Chart Overview template for PowerPoint & Google Slides
Org Chart
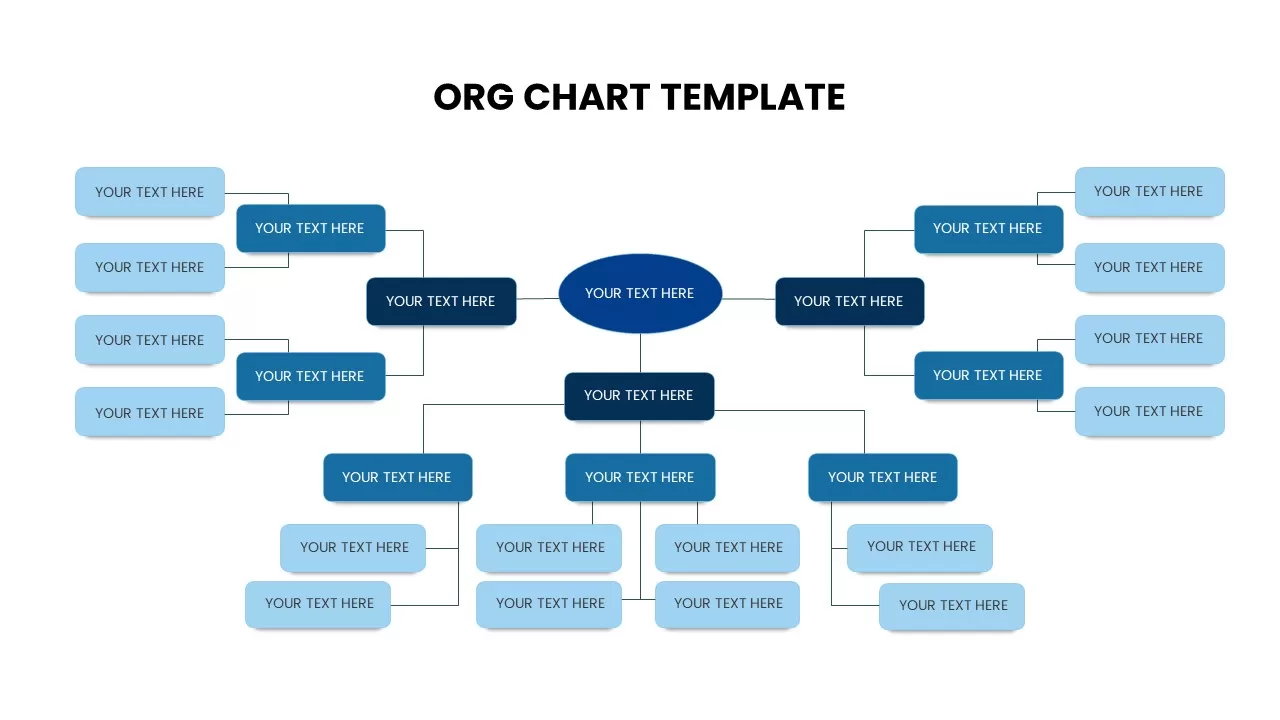
Org Chart Structure template for PowerPoint & Google Slides
Org Chart
Flow Chart Template for PowerPoint & Google Slides
Flow Charts
Free Circular Multi-Step Flow Chart Diagram Template for PowerPoint & Google Slides
Flow Charts
Free
Interactive Project Gantt Chart Timeline Template for PowerPoint & Google Slides
Gantt Chart
Dynamic Benchmarking Comparison Chart Template for PowerPoint & Google Slides
Comparison Chart
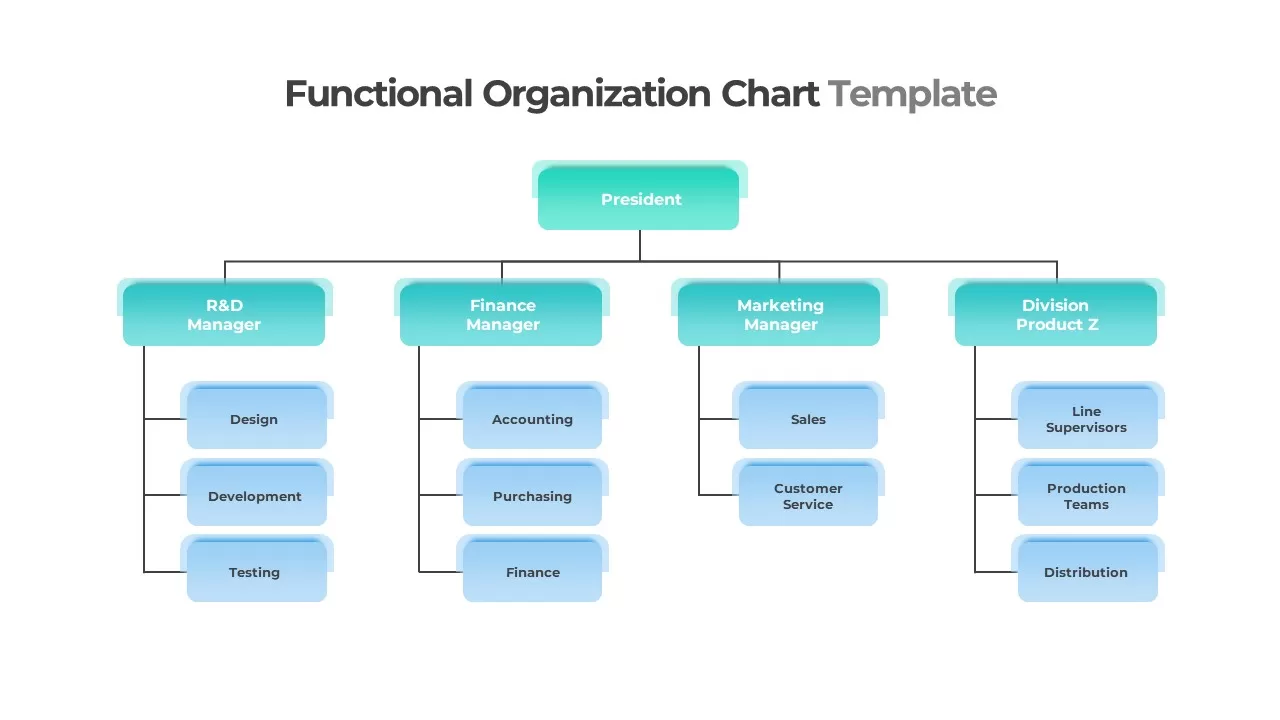
Functional Organization Chart Structure Template for PowerPoint & Google Slides
Org Chart
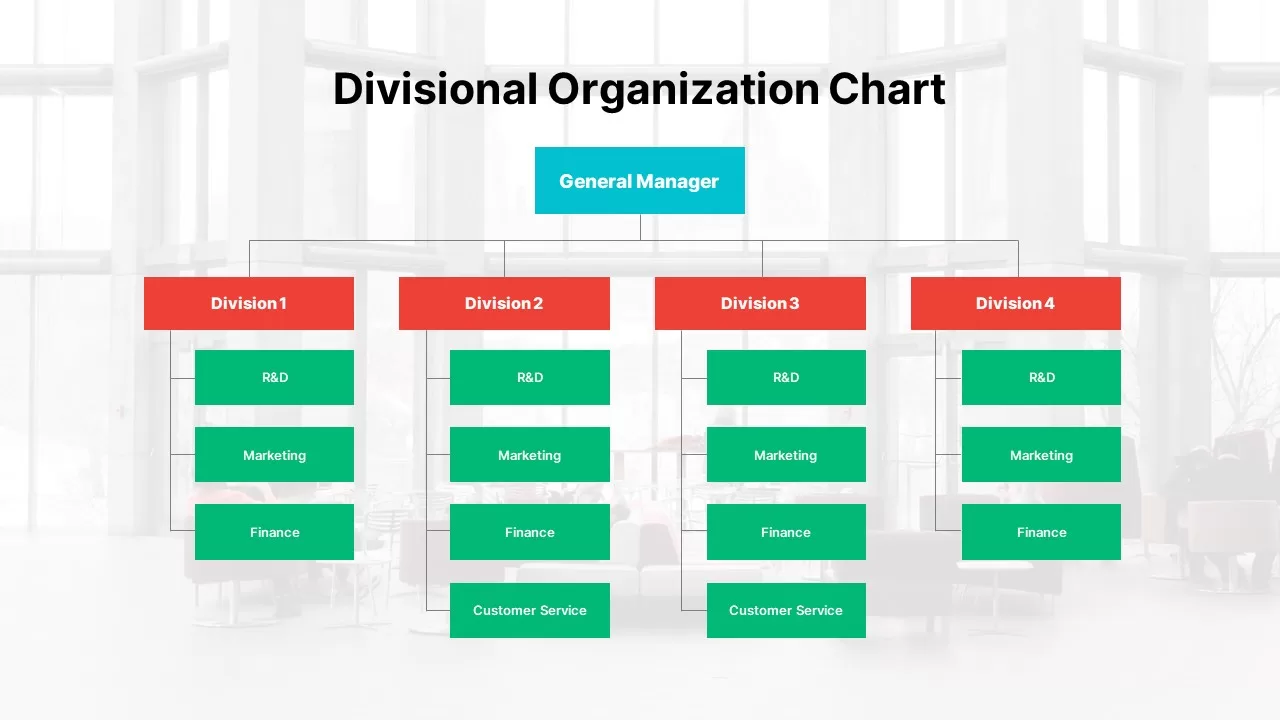
Modern Divisional Organization Chart Template for PowerPoint & Google Slides
Org Chart
Free Stacked Column Chart Data Visualization Template for PowerPoint & Google Slides
Bar/Column
Free
Animated Clustered Bar Chart Template for PowerPoint & Google Slides
Bar/Column
Animated Stacked Bar Chart Template for PowerPoint & Google Slides
Bar/Column
Clustered Bar Chart Comparison Template for PowerPoint & Google Slides
Bar/Column
XY Bubble Chart Data Visualization Template for PowerPoint & Google Slides
Comparison Chart
Simple Area Chart Data Trends Analysis Template for PowerPoint & Google Slides
Comparison Chart
Data Over Time Line Chart template for PowerPoint & Google Slides
Charts
Growth Curve Line Chart Visualization Template for PowerPoint & Google Slides
Charts
Rectangle Area Chart with Gradient Fill Template for PowerPoint & Google Slides
Comparison Chart
Waterfall Chart Data Visualization Template for PowerPoint & Google Slides
Comparison Chart
Year-over-Year Stacked Gender Bar Chart Template for PowerPoint & Google Slides
Bar/Column
Stacked Waterfall Chart Template for PowerPoint & Google Slides
Bar/Column
Population Age Distribution Pyramid Chart Template for PowerPoint & Google Slides
Pyramid
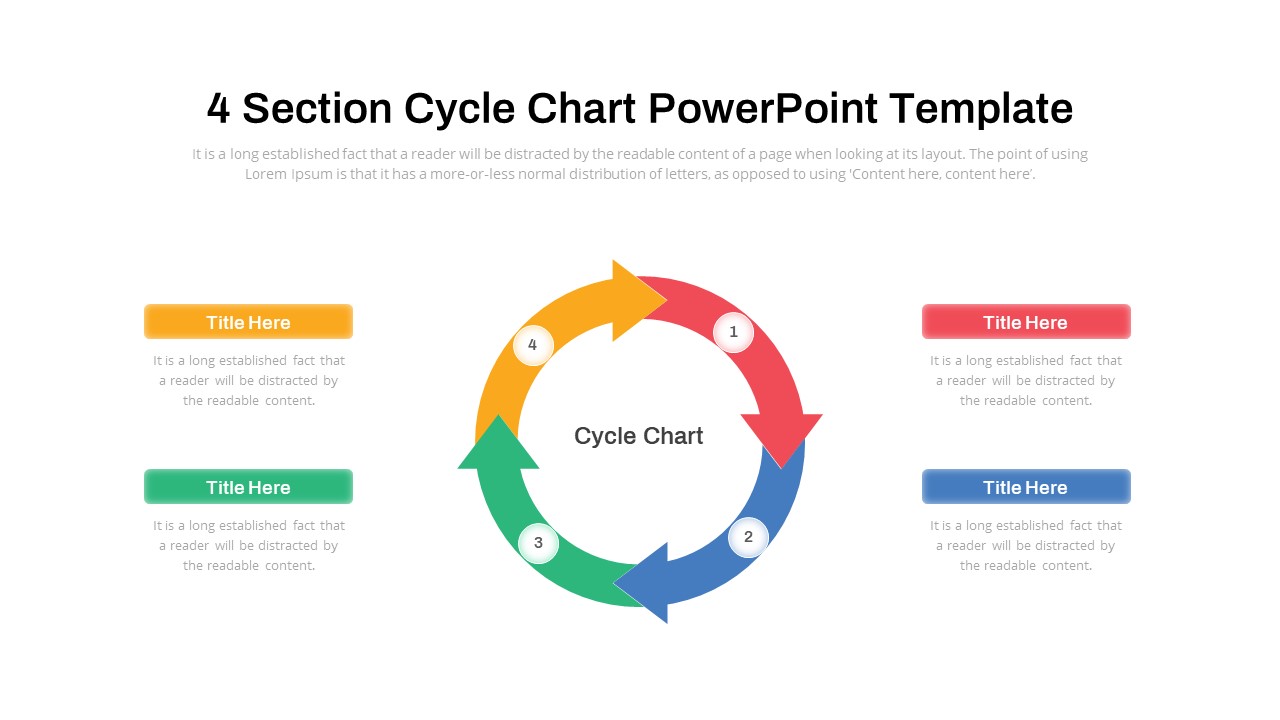
Cycle Chart Template for PowerPoint & Google Slides
Circular
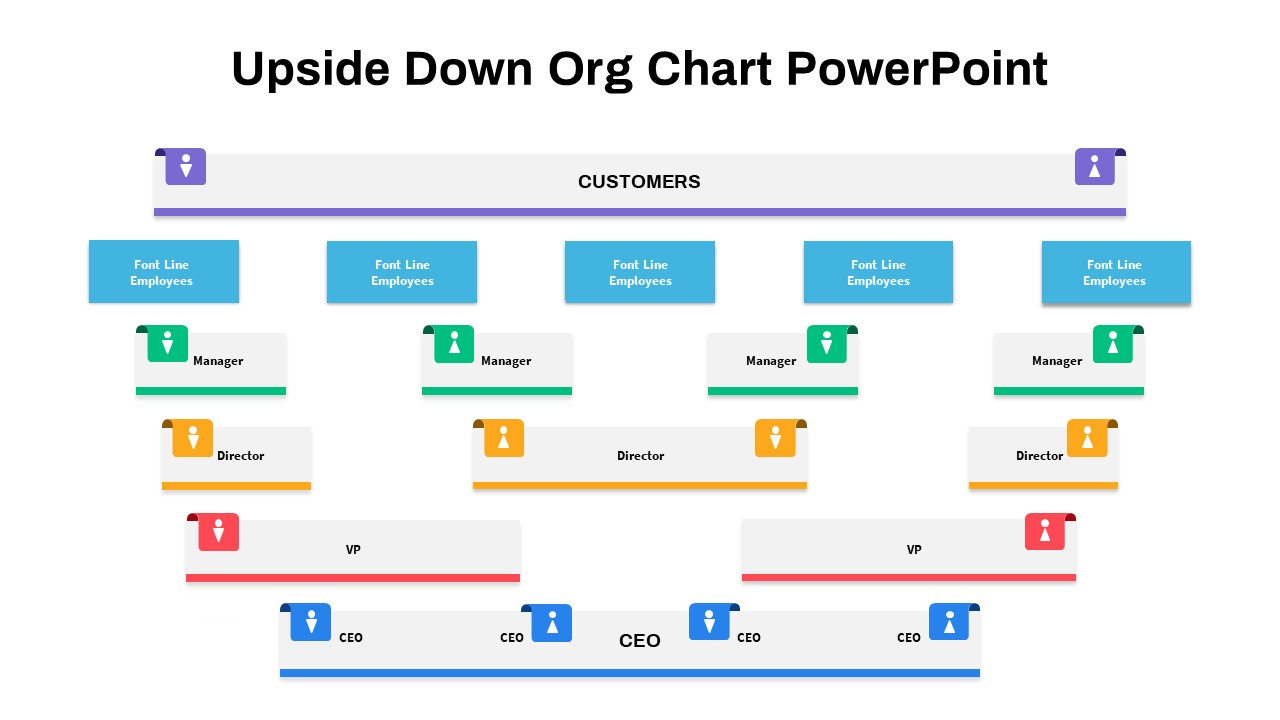
Upside-Down Organizational Chart Diagram Template for PowerPoint & Google Slides
Org Chart
Multi-Variation Thermometer Chart Template for PowerPoint & Google Slides
Bar/Column
Quad Chart Infographic Pack of 8 Slides Template for PowerPoint & Google Slides
Comparison Chart
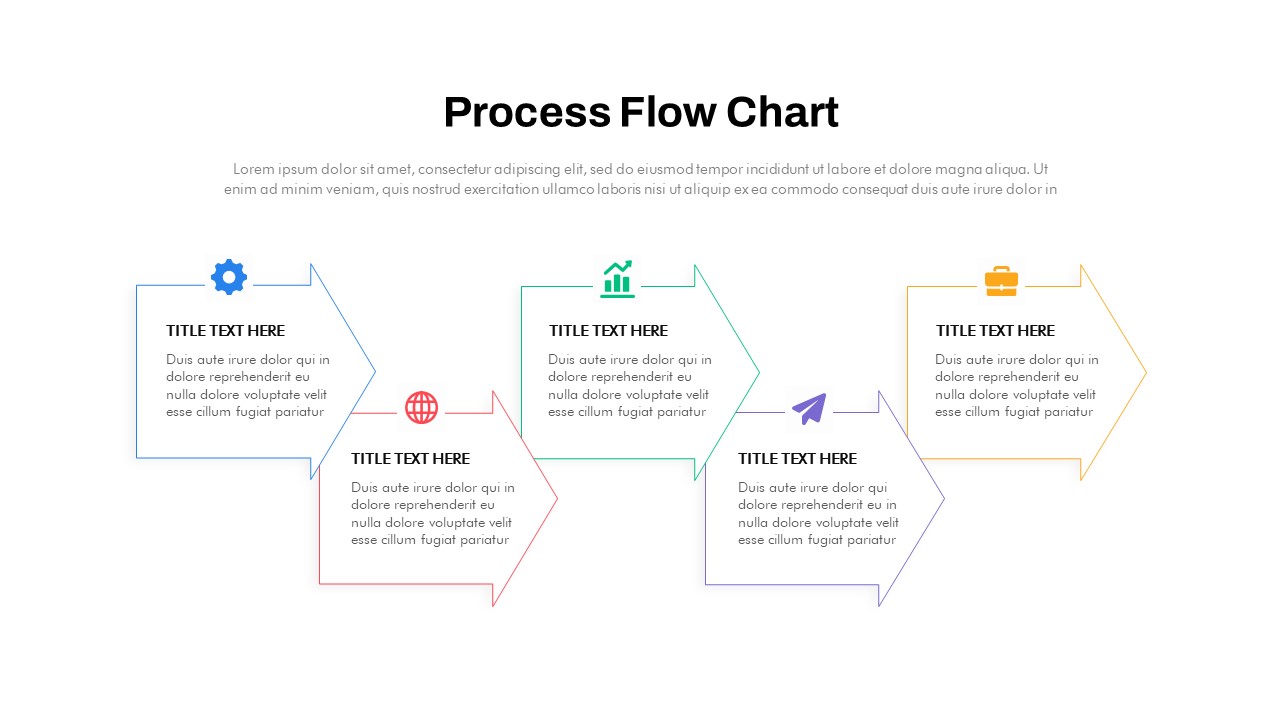
Animated Process Flow Chart Template for PowerPoint & Google Slides
Infographics
Wheel Chart PowerPoint Templates
Pie/Donut
Interactive Jump Line Data Chart Template for PowerPoint & Google Slides
Comparison Chart
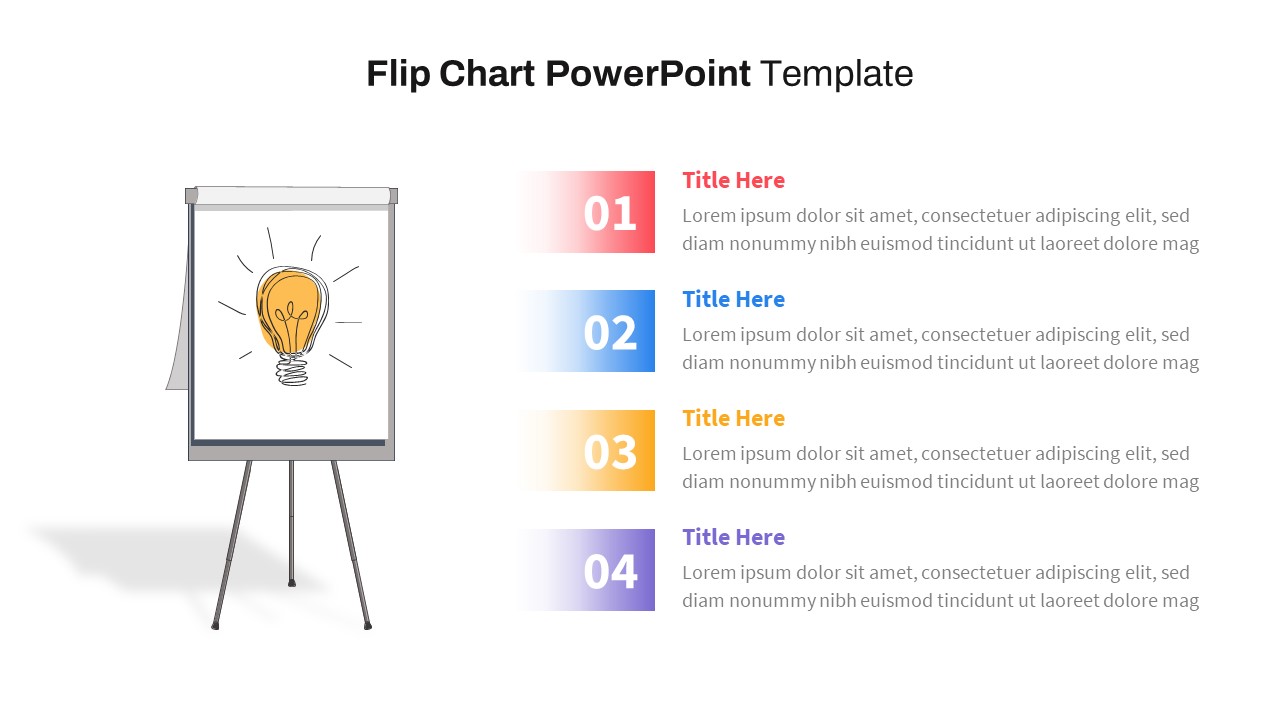
Flip Chart Four-Step List Layout Template for PowerPoint & Google Slides
Process
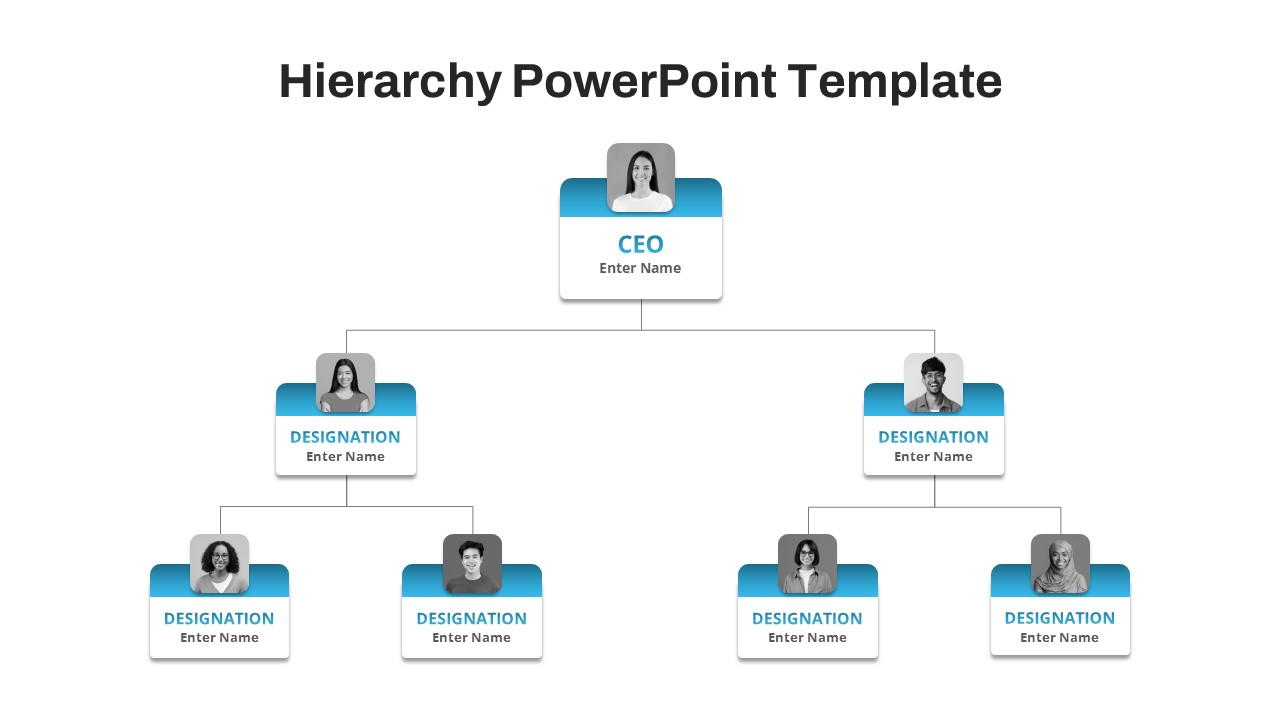
Free Corporate Hierarchy Organizational Chart Template for PowerPoint & Google Slides
Org Chart
Free
Quarterly Credit Loss Provisions Chart Template for PowerPoint & Google Slides
Bar/Column
Expanding Margins Analysis Bar Chart Template for PowerPoint & Google Slides
Charts
Annual Growth Trend Analysis Chart template for PowerPoint & Google Slides
Business Report
Dynamic Financial Analysis Line Chart Template for PowerPoint & Google Slides
Finance
Quarterly Sales Review Bar Chart Template for PowerPoint & Google Slides
Bar/Column
Professional Table of Organization Chart Template for PowerPoint & Google Slides
Org Chart
Profile Comparison Chart template for PowerPoint & Google Slides
Comparison Chart
Sales Growth Comparison Chart & Table Template for PowerPoint & Google Slides
Bar/Column
Skills Gap Analysis Comparison Chart Template for PowerPoint & Google Slides
Gap
Color-Coded Gantt Chart template for PowerPoint & Google Slides
Business
Feasibility Matrix Comparison Chart Template for PowerPoint & Google Slides
Comparison Chart
Team Gantt Chart Overview template for PowerPoint & Google Slides
Project Status
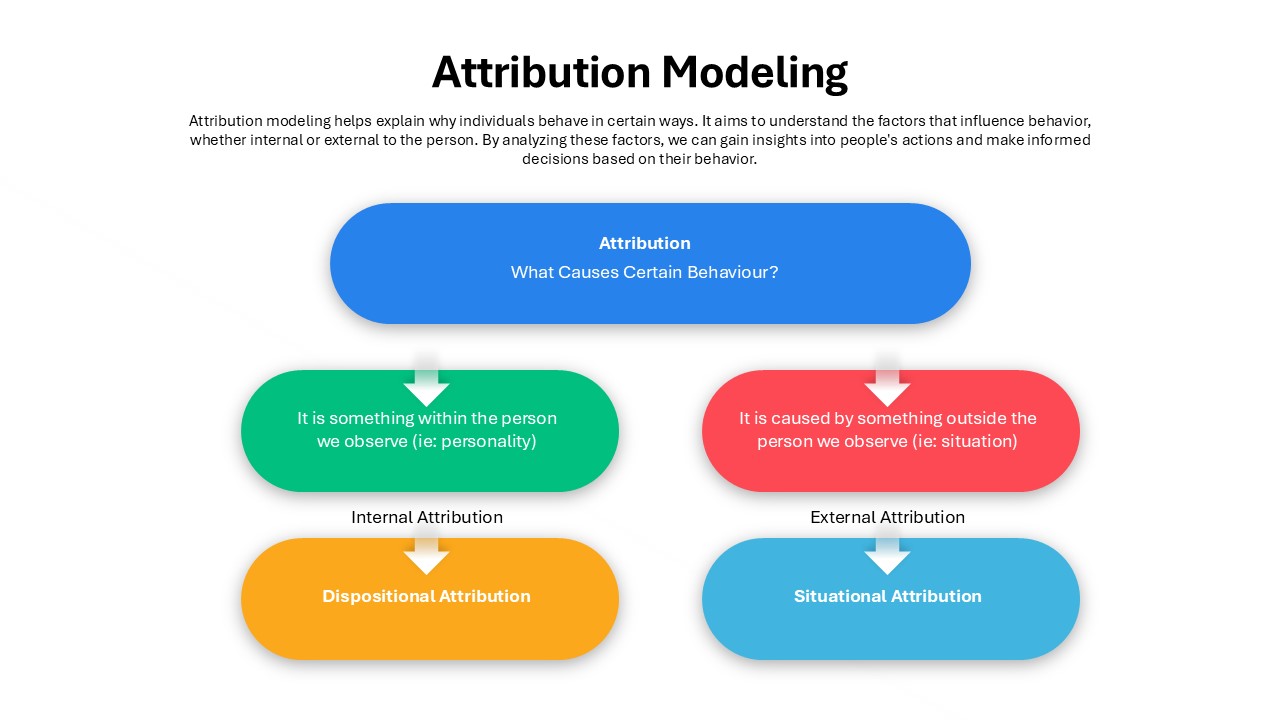
Attribution Modeling Flow Chart Template for PowerPoint & Google Slides
Flow Charts
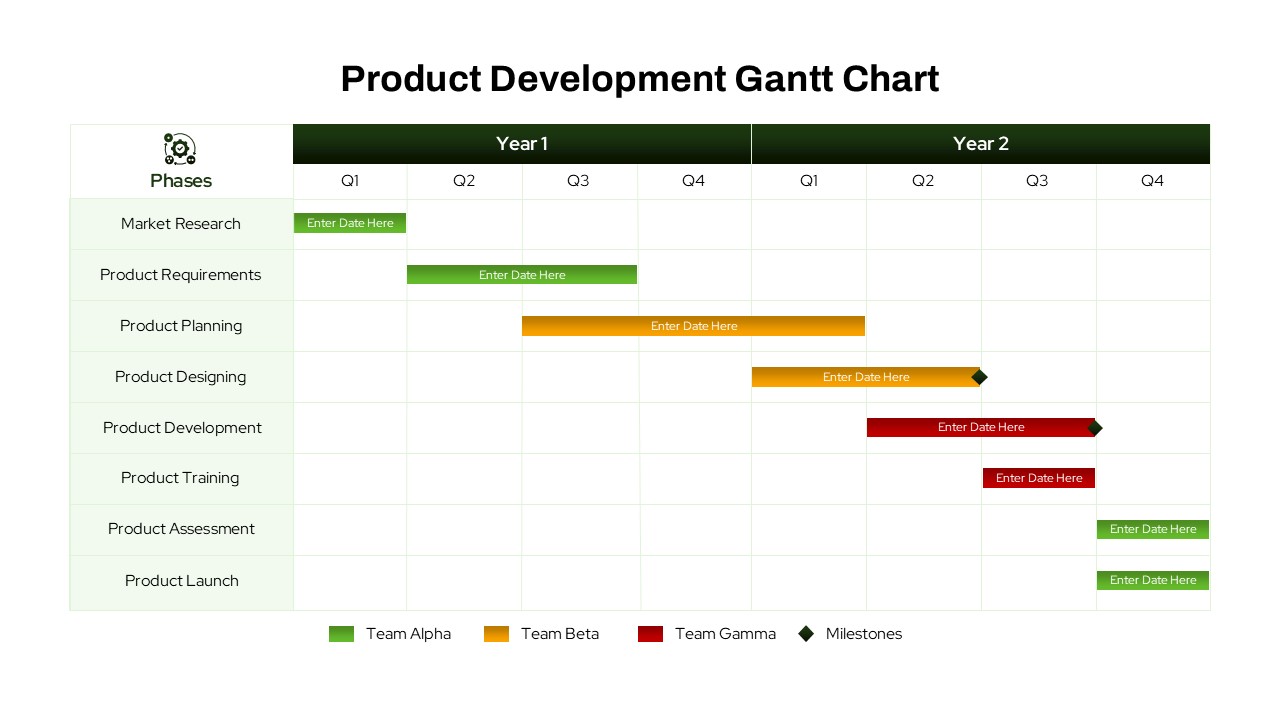
Product Development Gantt Chart template for PowerPoint & Google Slides
Gantt Chart
Bar Gantt Chart Template for PowerPoint & Google Slides
Gantt Chart
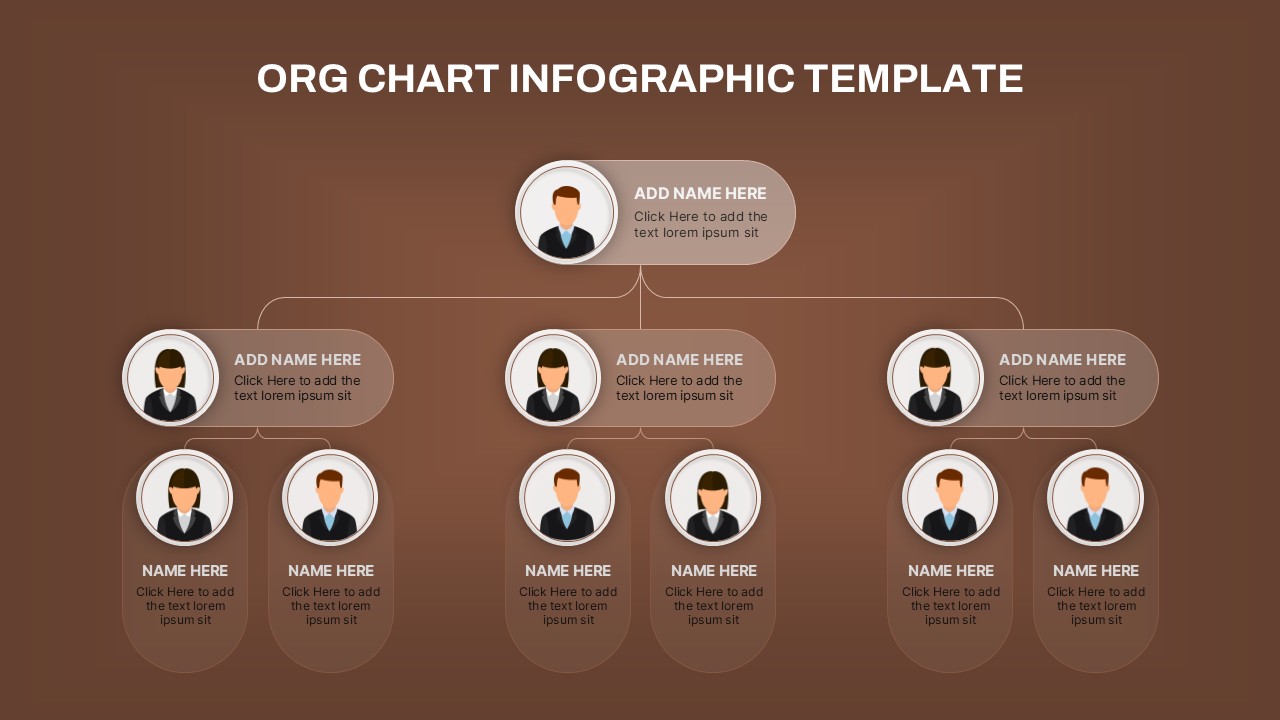
Hierarchical Org Chart Infographic Template for PowerPoint & Google Slides
Org Chart
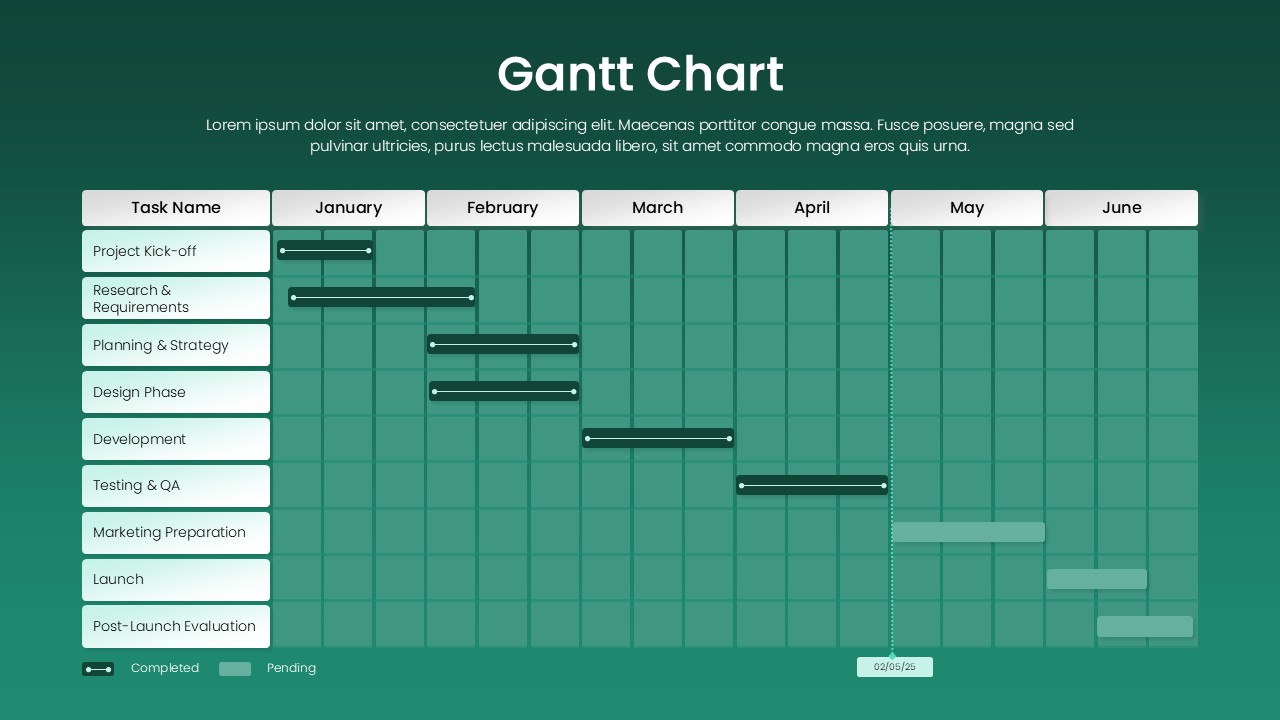
Green Gantt Chart Template for PowerPoint & Google Slides
Gantt Chart
Weekly Gantt Chart with Milestones Template for PowerPoint & Google Slides
Gantt Chart
Three Segment Donut Chart KPI Infographic Template for PowerPoint & Google Slides
Pie/Donut
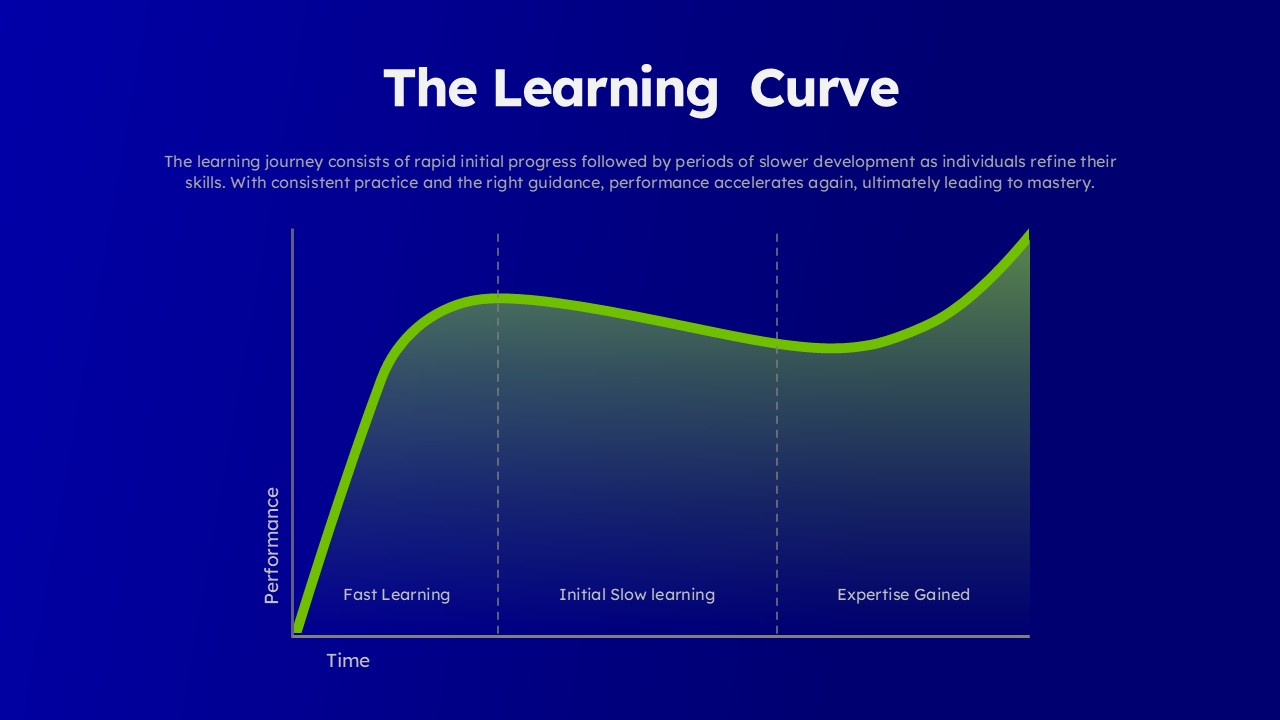
Learning Curve Performance Growth Chart Template for PowerPoint & Google Slides
Employee Performance

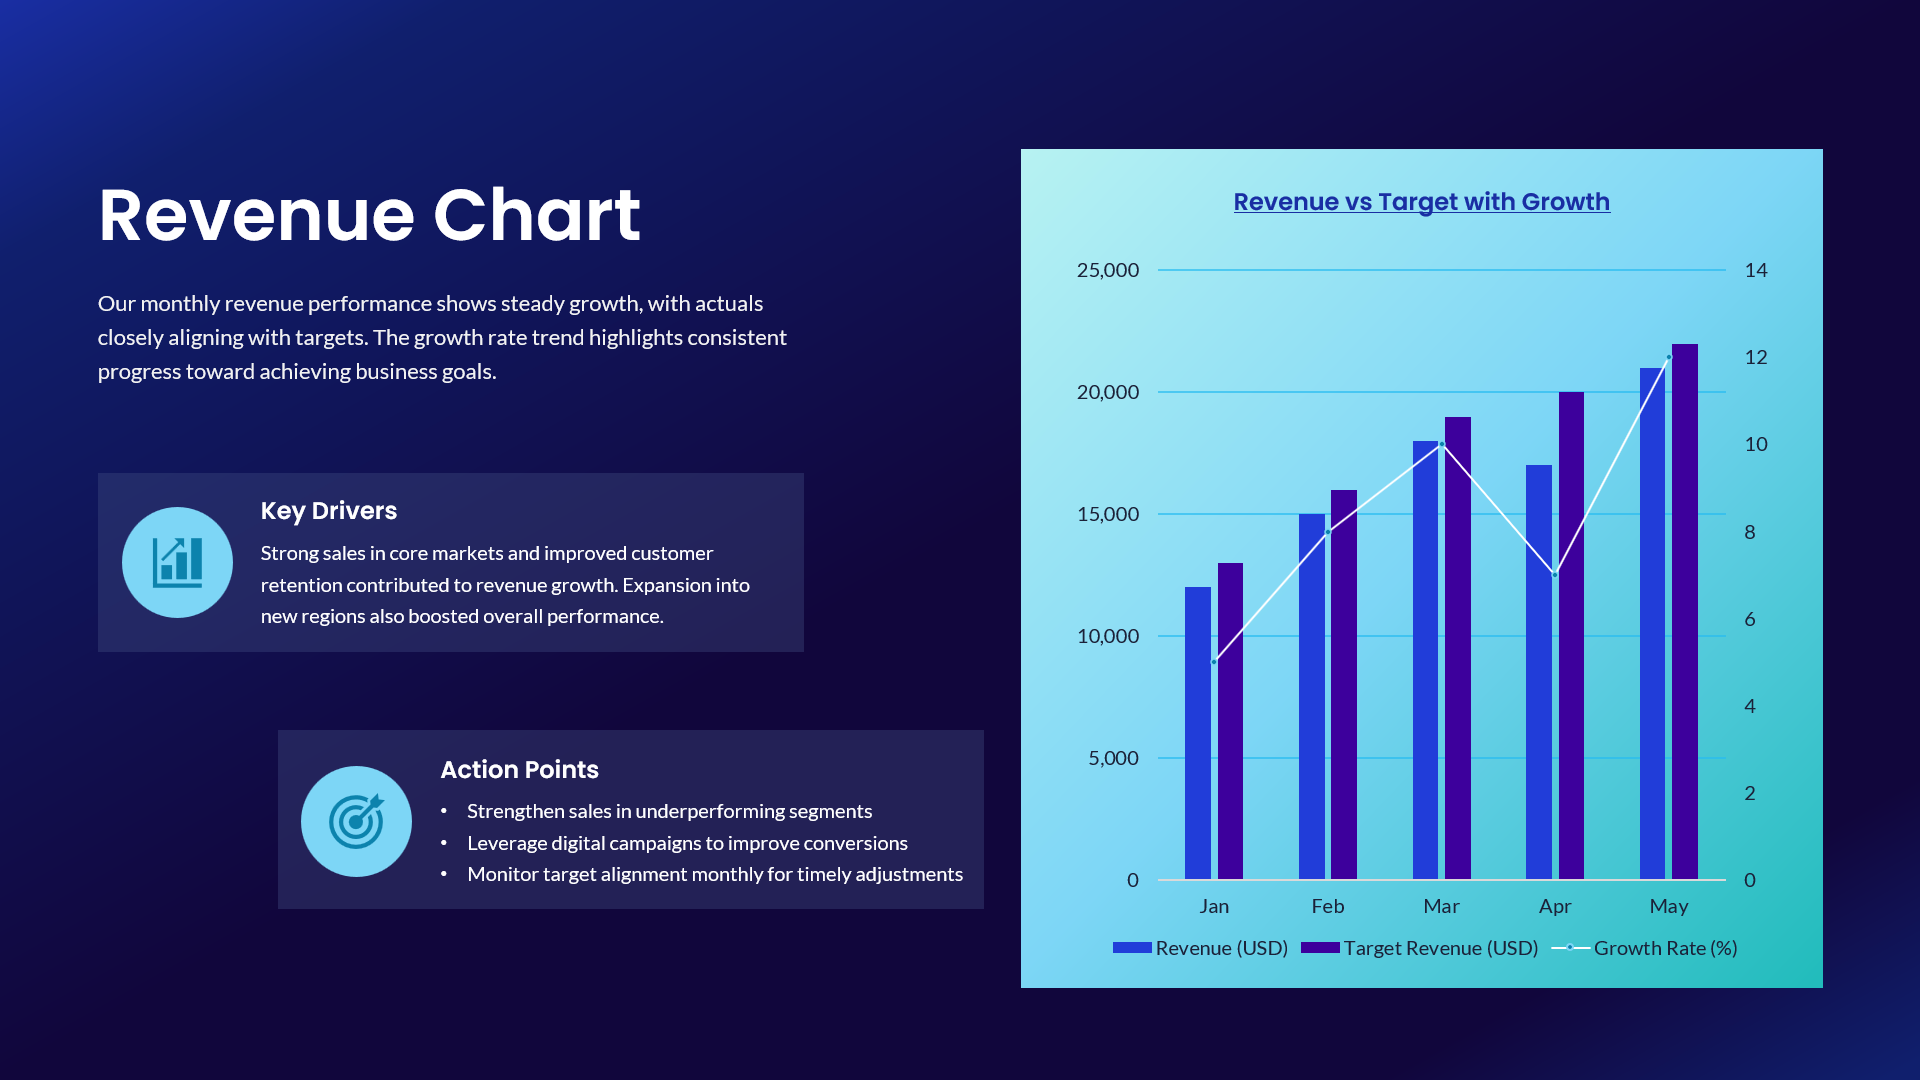
Revenue vs Target Growth Chart Template for PowerPoint & Google Slides
Revenue