


Charts Presentation Templates for PowerPoint and Google Slides
Present data with confidence and clarity using our Charts Presentation Templates for PowerPoint and Google Slides. These templates are ideal for visualizing performance metrics, survey results, trends, comparisons, and analytical insights. From pie charts and bar graphs to line charts and scatter plots, this category offers a variety of chart types to make your presentation more data-driven and visually compelling.
Fully editable and compatible with Microsoft PowerPoint (PPT) and Google Slides, these templates are perfect for professionals, educators, marketers, analysts, and anyone who needs to present data in a clean and engaging format.
![]() Filter
Filter
Filter
-

Infrastructure as a Service Diagram Template for PowerPoint & Google Slides
Cloud Computing
Premium
-

MABA Attractiveness Matrix Chart Template for PowerPoint & Google Slides
Comparison Chart
Premium
-
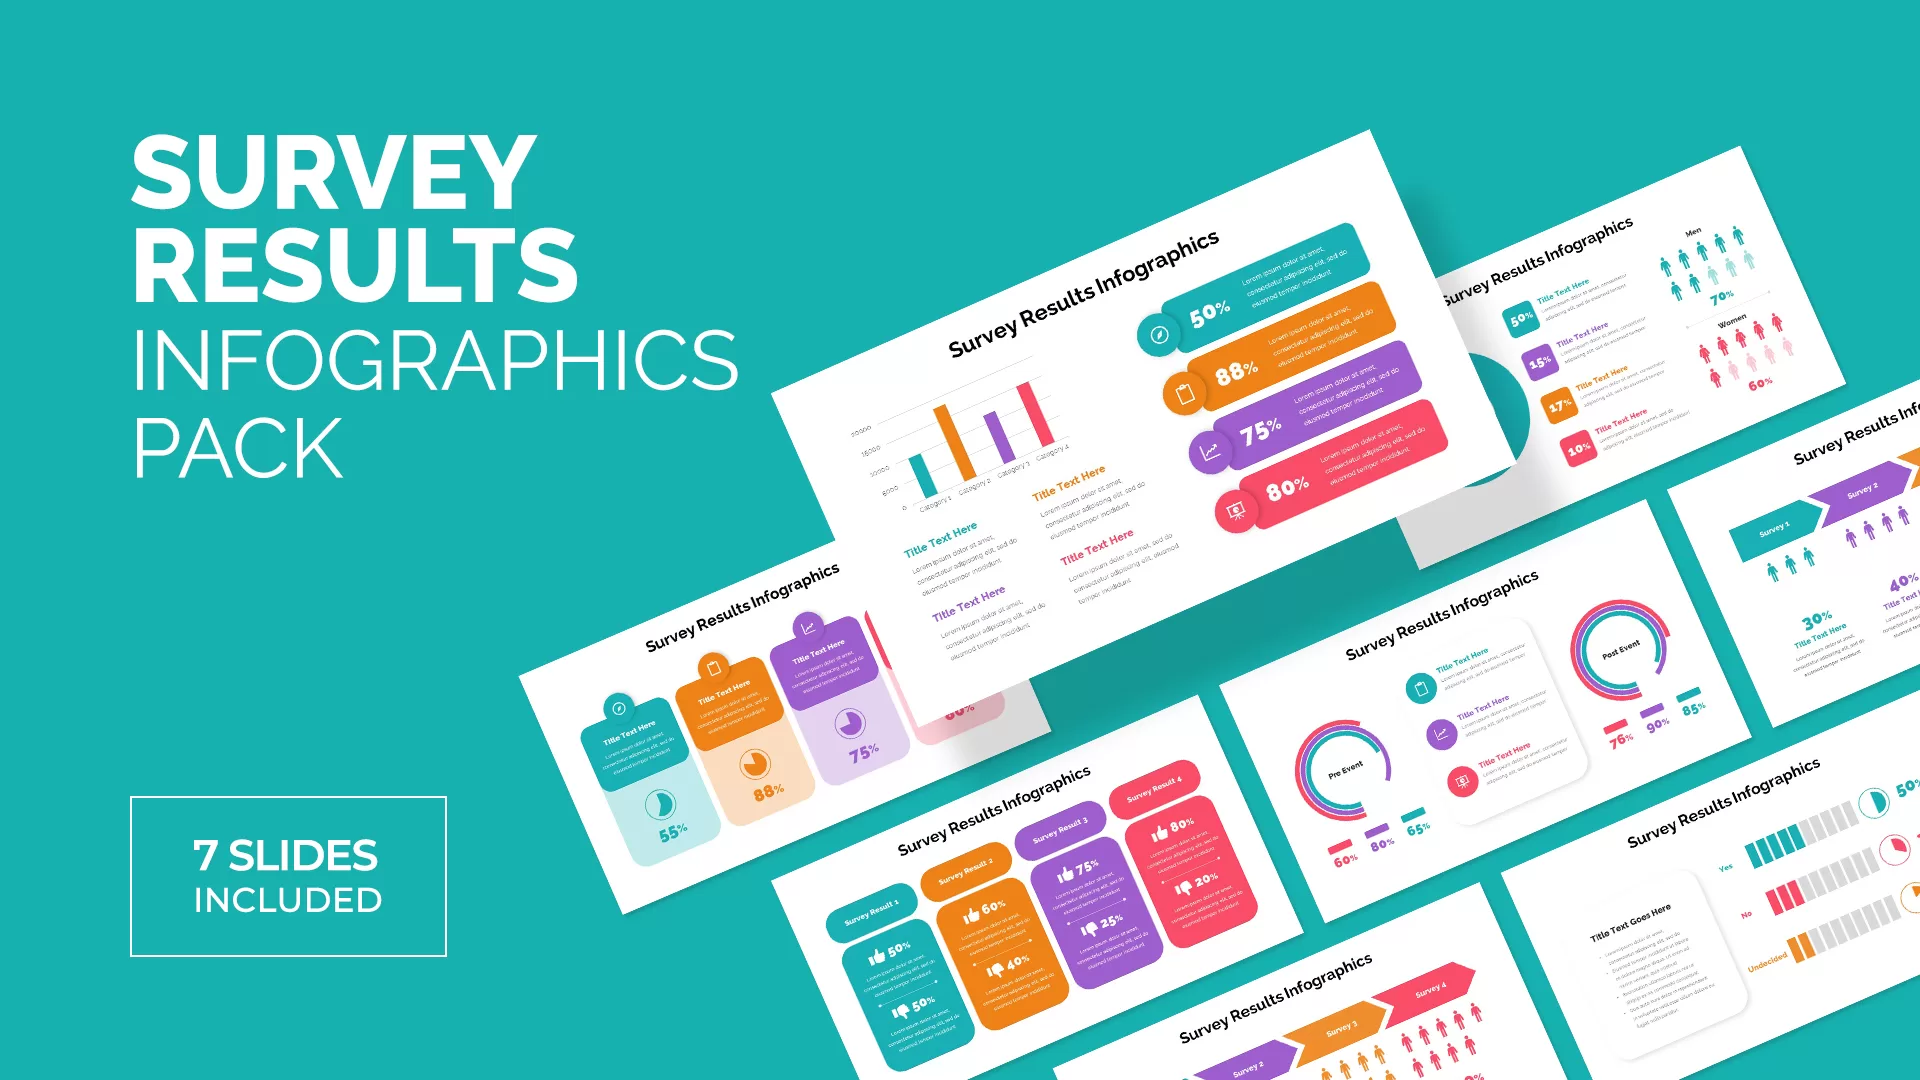
Survey Results Infographics for PowerPoint & Google Slides
Infographics
Premium
-
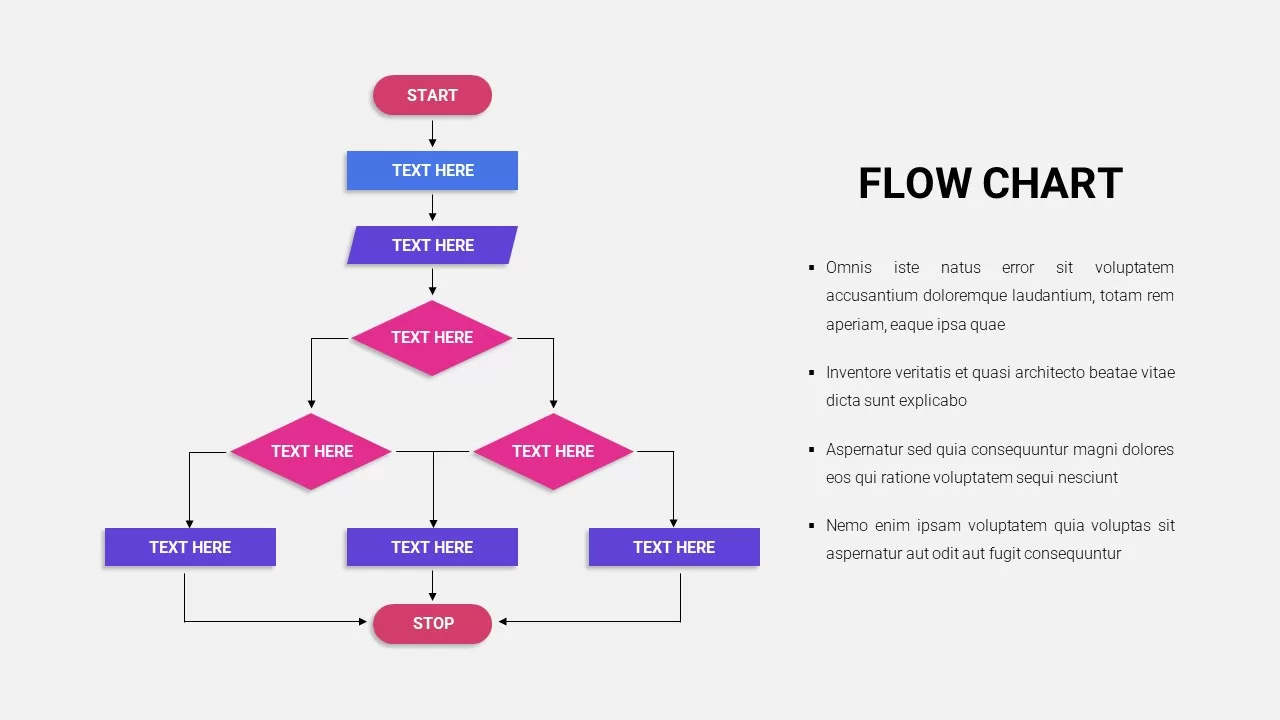
Flow Chart Template for PowerPoint & Google Slides
Flow Charts
Premium
-
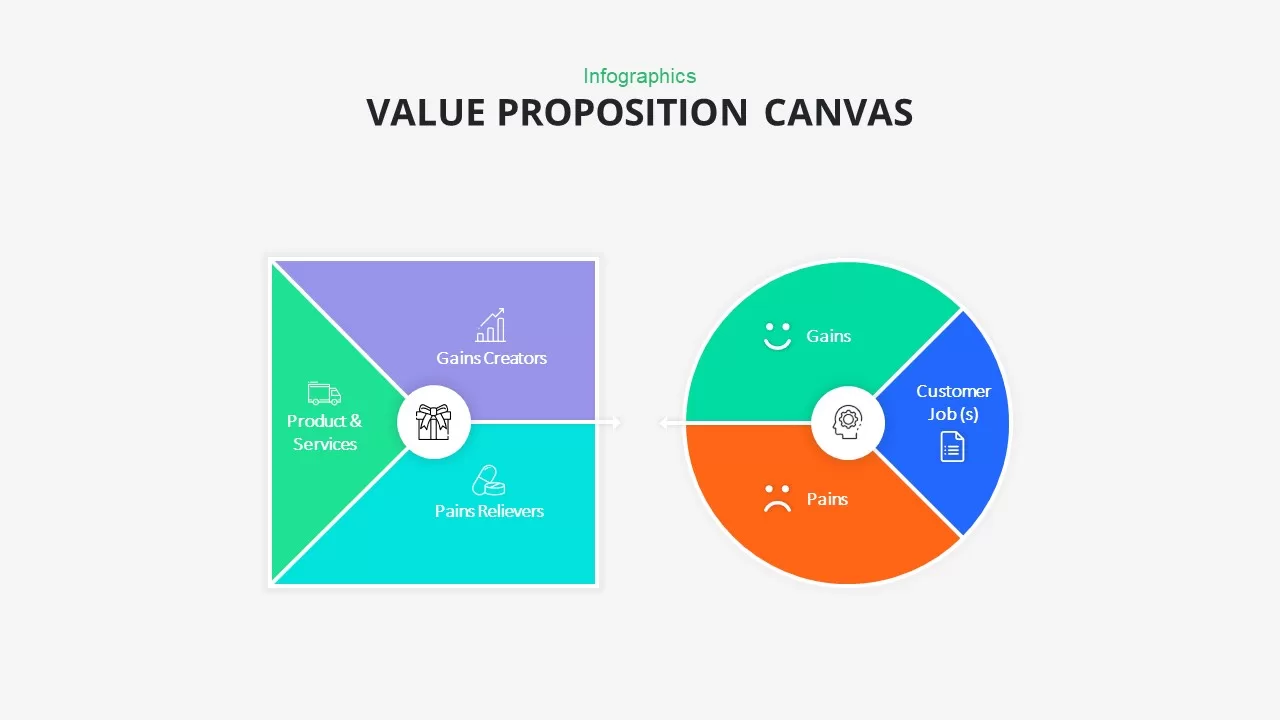
Value Proposition Canvas Infographic Template for PowerPoint & Google Slides
Business Report
Premium
-
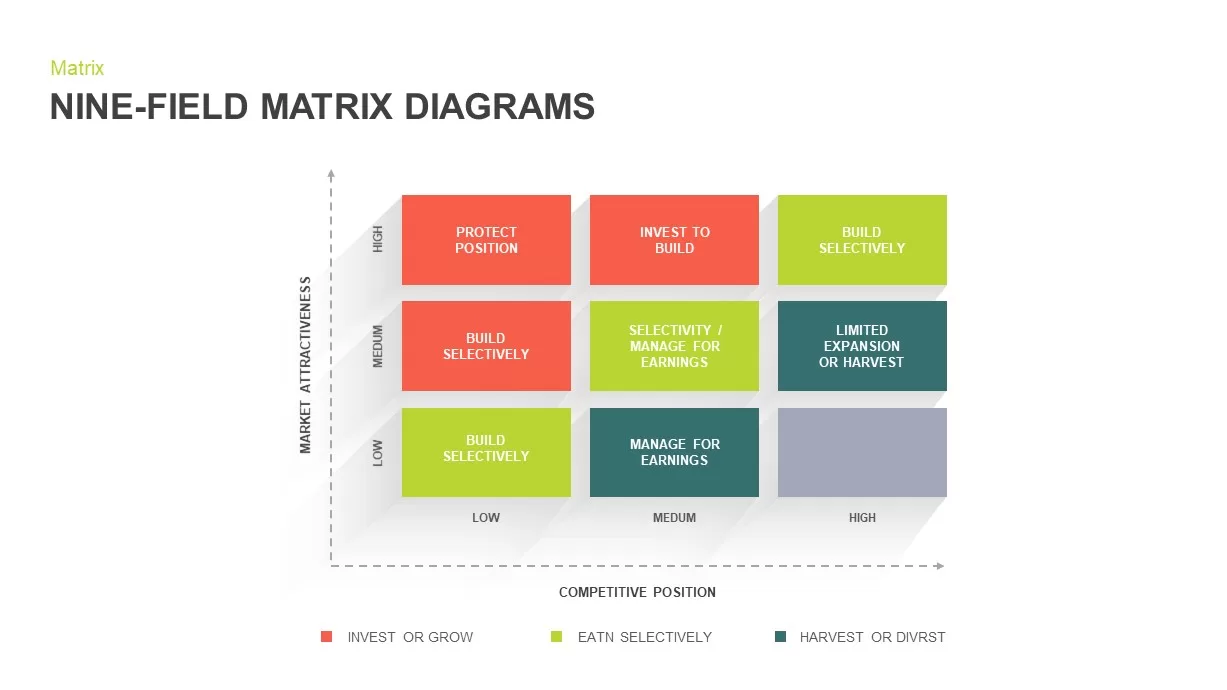
Nine-Field Matrix Diagrams Collection Template for PowerPoint & Google Slides
Comparison Chart
Premium
-

Car Sales Market Share Pie Chart Template for PowerPoint & Google Slides
BCG
Premium
-

Modern Colorful Circular Org Chart Template for PowerPoint & Google Slides
Org Chart
Premium
-

Immigration Data Dashboard Template for PowerPoint & Google Slides
Bar/Column
Premium