Charts Presentation Templates for PowerPoint and Google Slides
Present data with confidence and clarity using our Charts Presentation Templates for PowerPoint and Google Slides. These templates are ideal for visualizing performance metrics, survey results, trends, comparisons, and analytical insights. From pie charts and bar graphs to line charts and scatter plots, this category offers a variety of chart types to make your presentation more data-driven and visually compelling.
Fully editable and compatible with Microsoft PowerPoint (PPT) and Google Slides, these templates are perfect for professionals, educators, marketers, analysts, and anyone who needs to present data in a clean and engaging format.
![]() Filter
Filter
Filter
-

Product Feature Comparison Table Template for PowerPoint & Google Slides
Comparison Chart
-
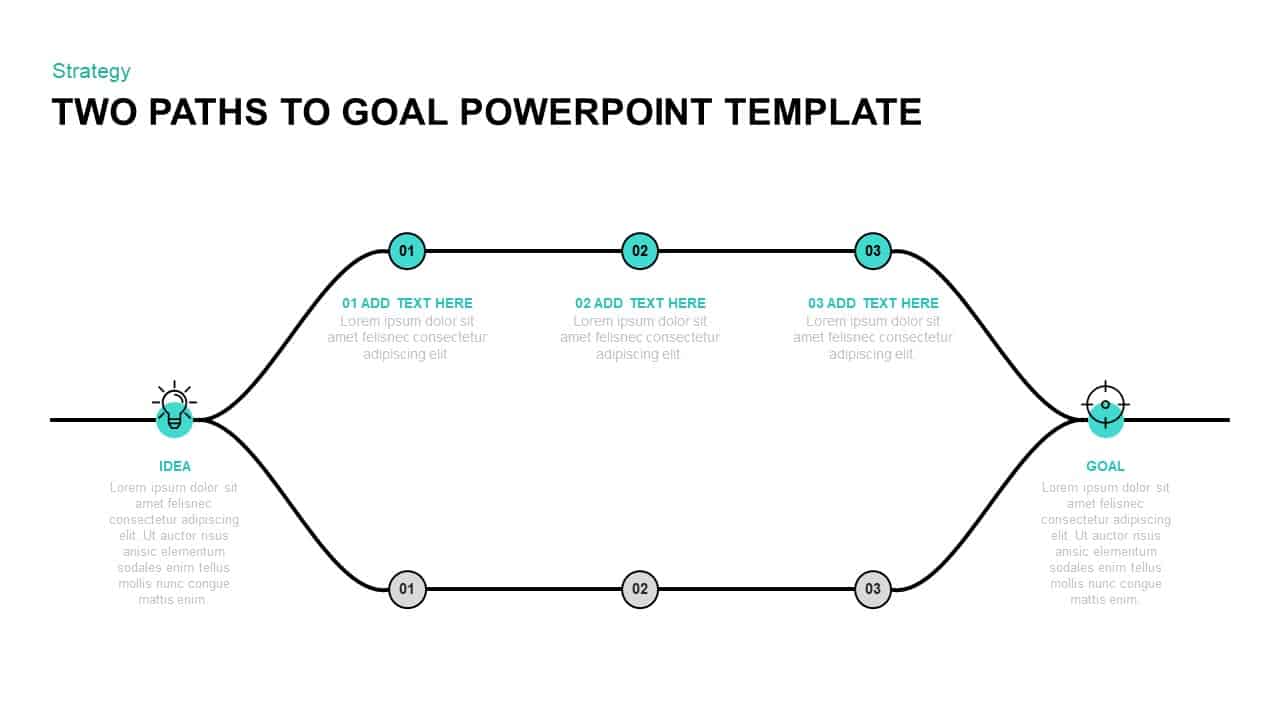
Two-Path Idea-to-Goal Process Diagram Template for PowerPoint & Google Slides
Infographics
-

Modern Colorful Circular Org Chart Template for PowerPoint & Google Slides
Org Chart
-
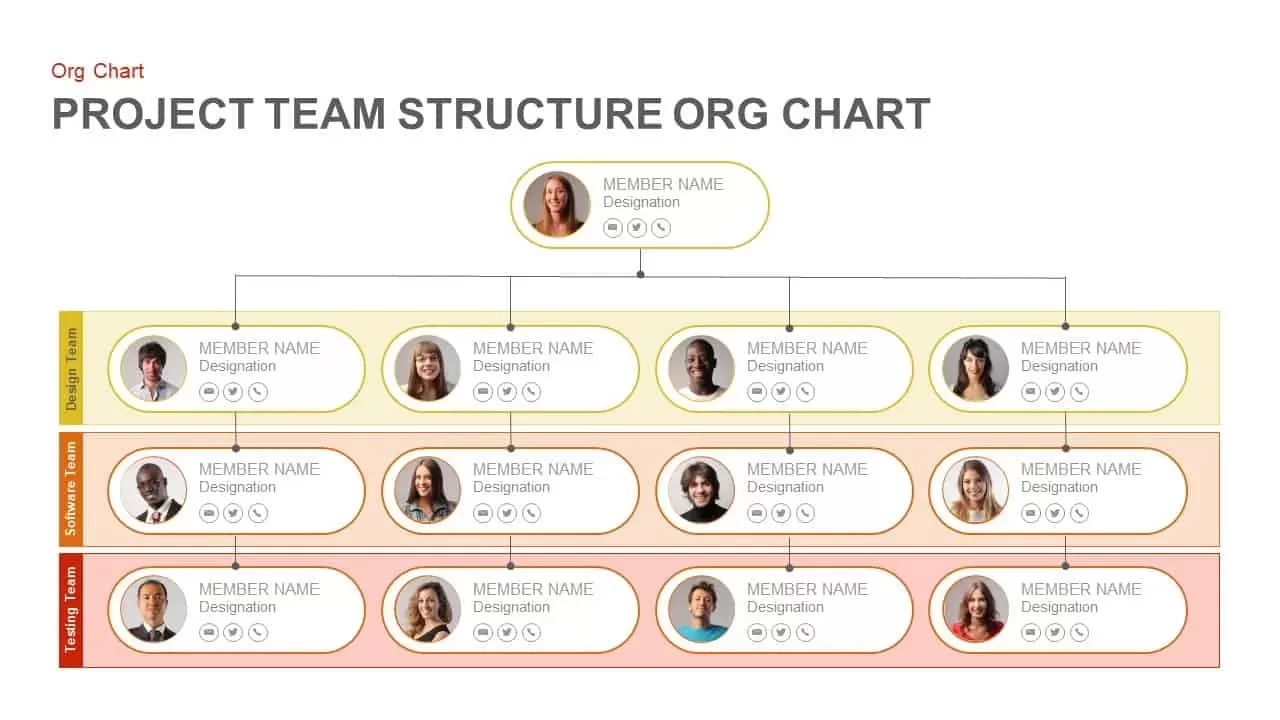
Project Team Structure Org Chart Template for PowerPoint & Google Slides
Org Chart
-

Quarterly Financial Summary Dashboard Template for PowerPoint & Google Slides
Business Report
-
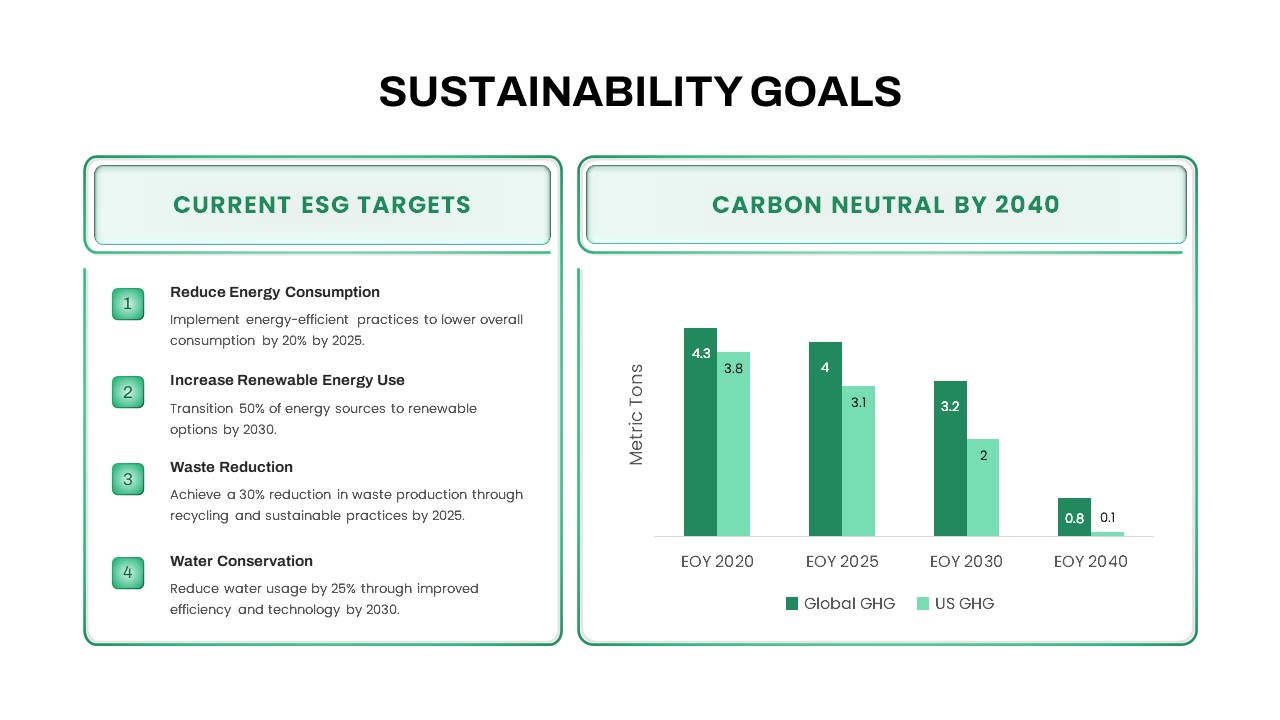
Sustainability Goals and Targets Chart Template for PowerPoint & Google Slides
Goals
-

Free Versatile Product Comparison Chart Template for PowerPoint & Google Slides
Charts
Free
-
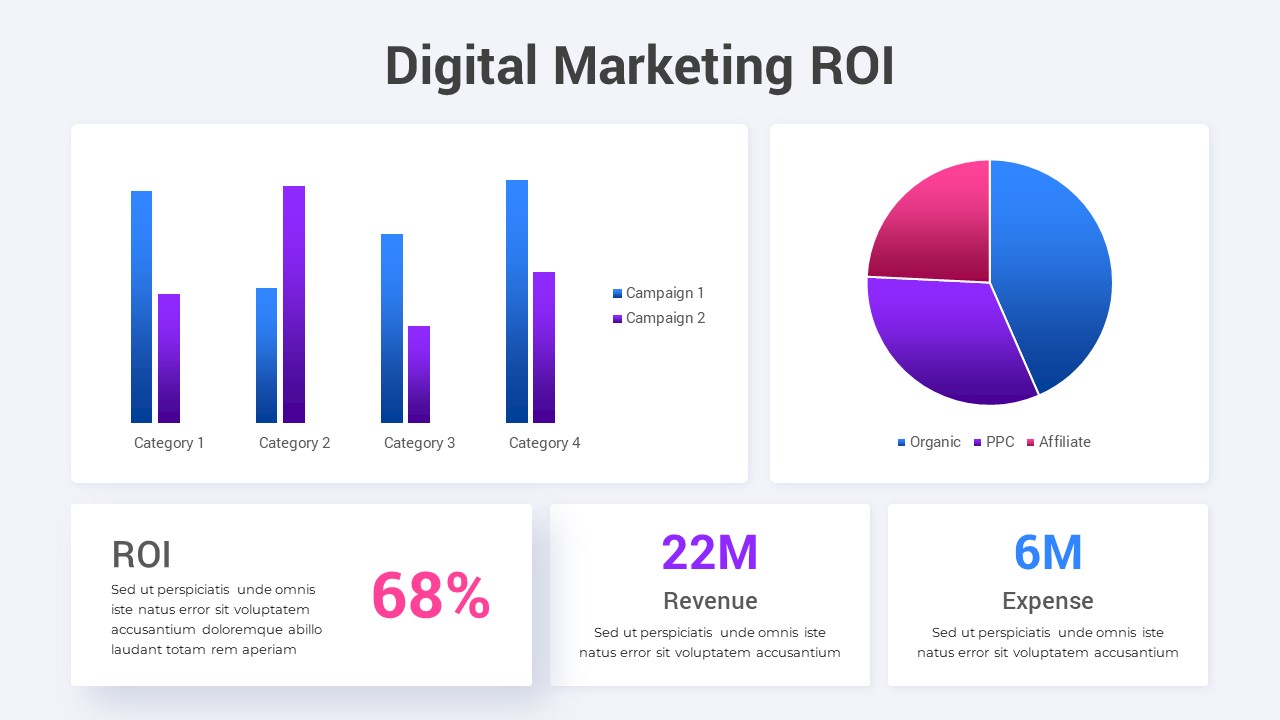
Digital Marketing ROI Analysis template for PowerPoint & Google Slides
Digital Marketing
-
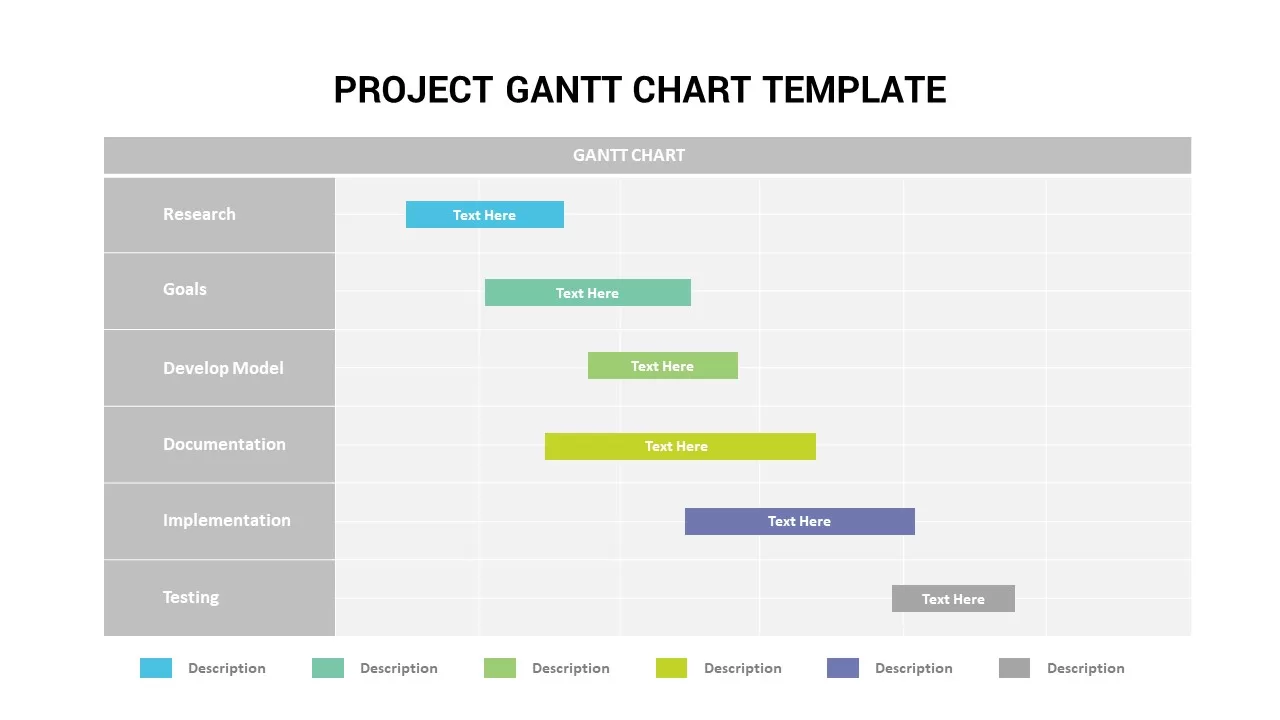
Project Gantt Chart template for PowerPoint & Google Slides
Gantt Chart
-

Comparison Pricing Table Infographic Template for PowerPoint & Google Slides
Comparison Chart
-

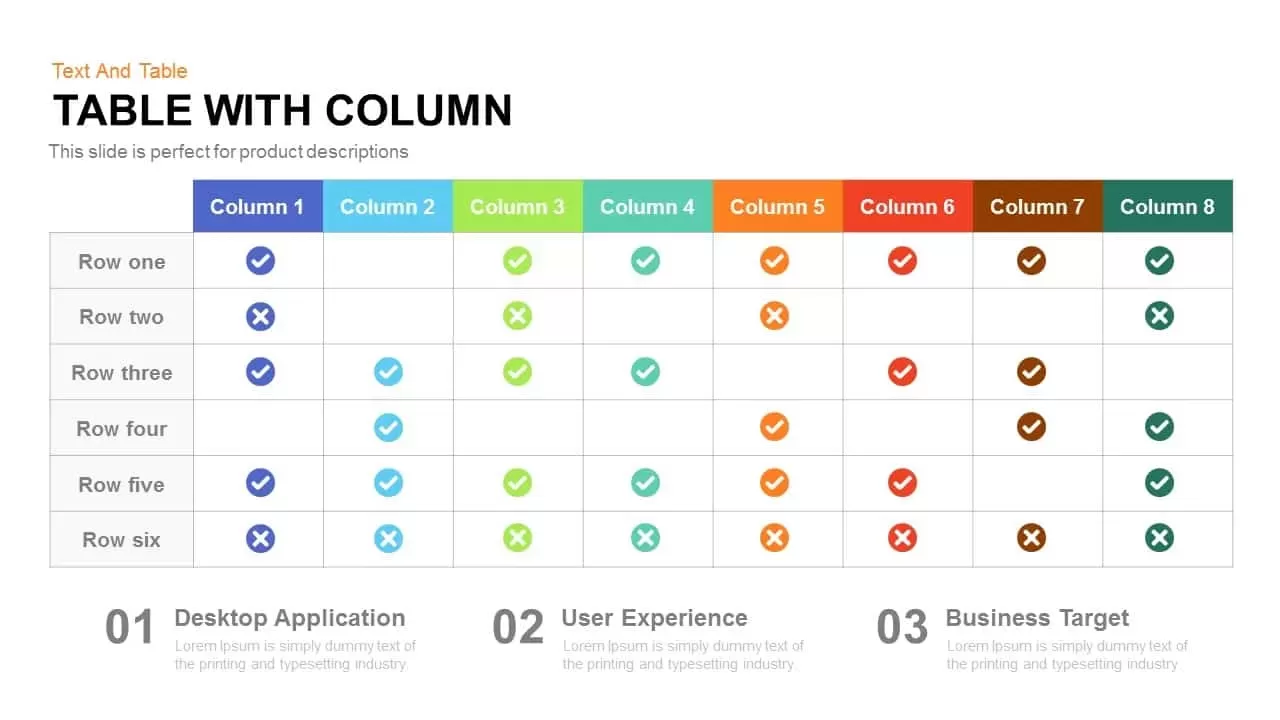
Table with Columns template for PowerPoint & Google Slides
Comparison Chart
-
Sales Growth Comparison Chart & Table Template for PowerPoint & Google Slides
Bar/Column
-
Business Timeline Comparison Bar Chart Template for PowerPoint & Google Slides
Comparison Chart
-
Vendor Comparison Analysis template for PowerPoint & Google Slides
Comparison Chart
-

Comparison Donut Chart PowerPoint Template and Keynote
Pie/Donut
-
Four-Tier Pricing Comparison Table Template for PowerPoint & Google Slides
Comparison
-
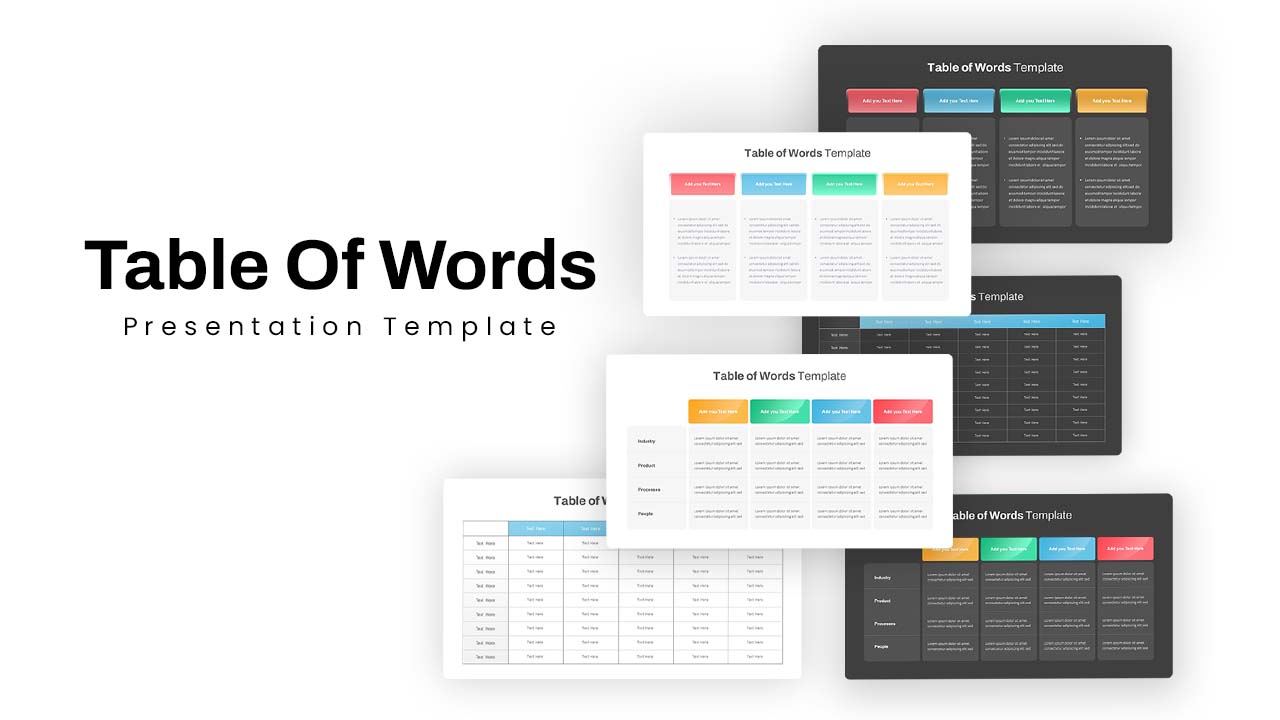
Versatile Table of Words Layout Template for PowerPoint & Google Slides
Table
-

Circular Product Comparison Chart Template for PowerPoint & Google Slides
Comparison Chart
-
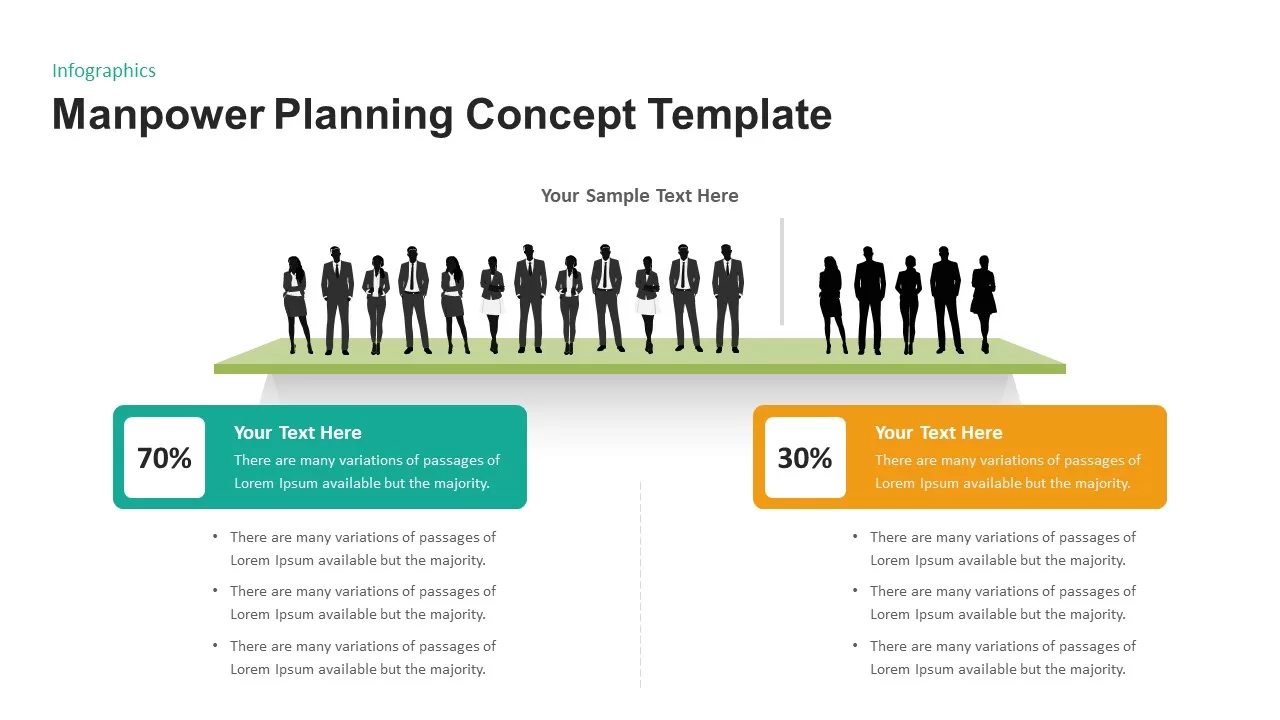
Manpower Planning Concept Comparison Template for PowerPoint & Google Slides
Comparison Chart
-
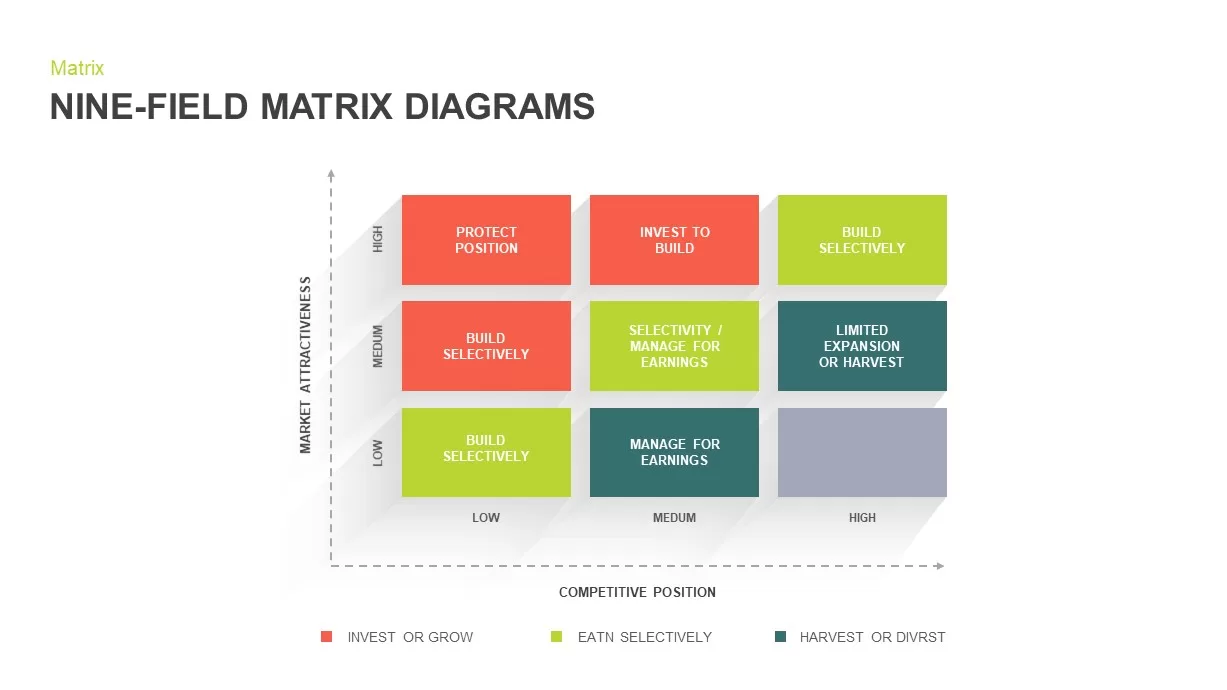
Nine-Field Matrix Diagrams Collection Template for PowerPoint & Google Slides
Comparison Chart
-
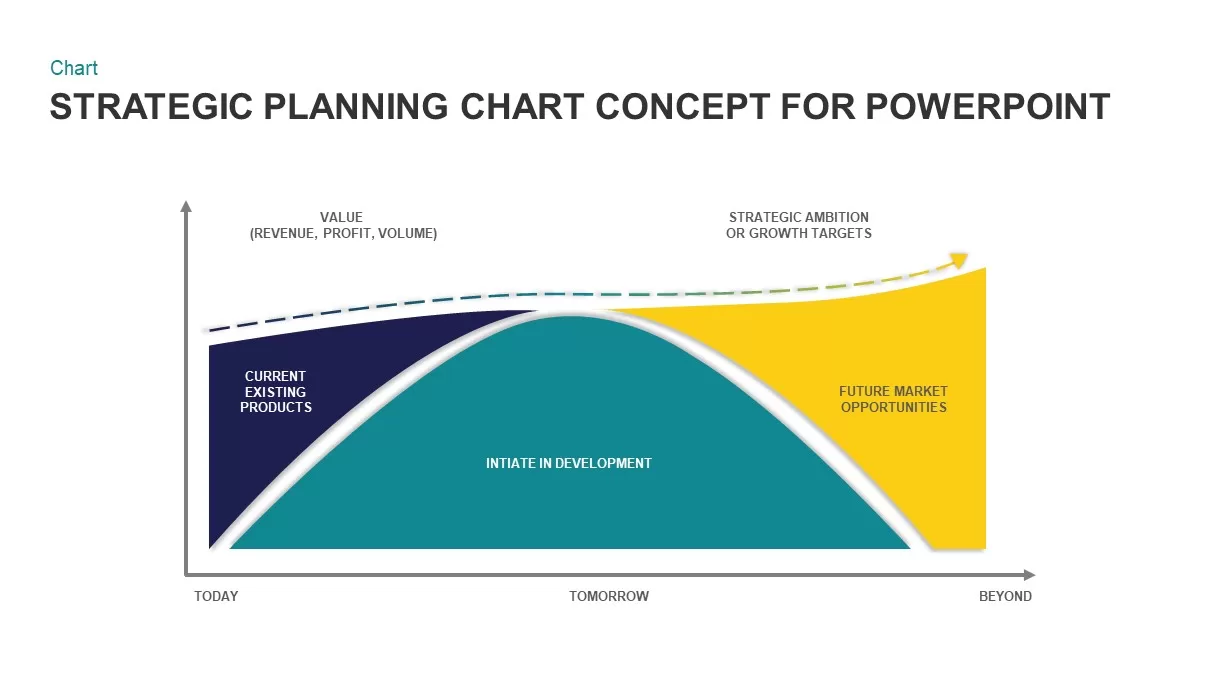
Strategic Planning Curve Diagram Template for PowerPoint & Google Slides
Charts
-
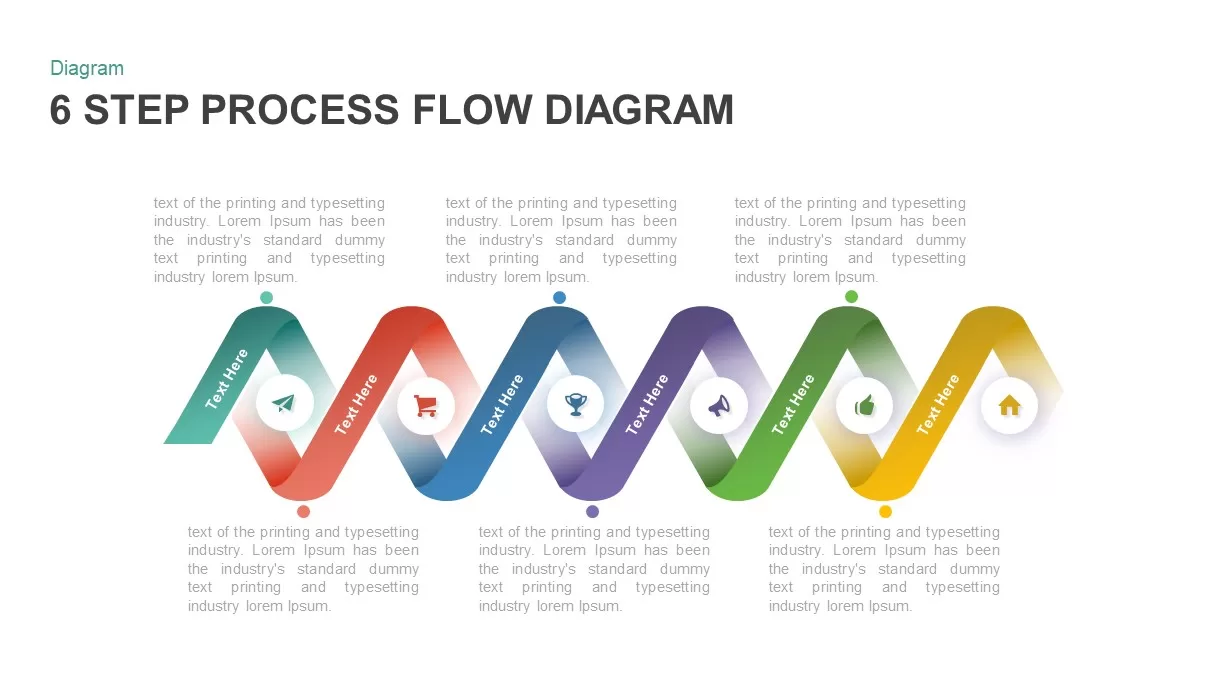
6 Step Process Flow Diagram for PowerPoint & Google Slides
Charts
-
Capital Structure Dynamic Split Chart Template for PowerPoint & Google Slides
Comparison Chart
-
Eisenhower Matrix Task Prioritization Template for PowerPoint & Google Slides
Comparison Chart
-
Creative Tree Diagram Infographic Template for PowerPoint & Google Slides
Decision Tree
-
Vertical Split Flow Chart Diagram Template for PowerPoint & Google Slides
Flow Charts
-
Three-Step Flowchart Process Diagram Template for PowerPoint & Google Slides
Flow Charts
-
Five-Input Cause and Effect Diagram Template for PowerPoint & Google Slides
Arrow
-
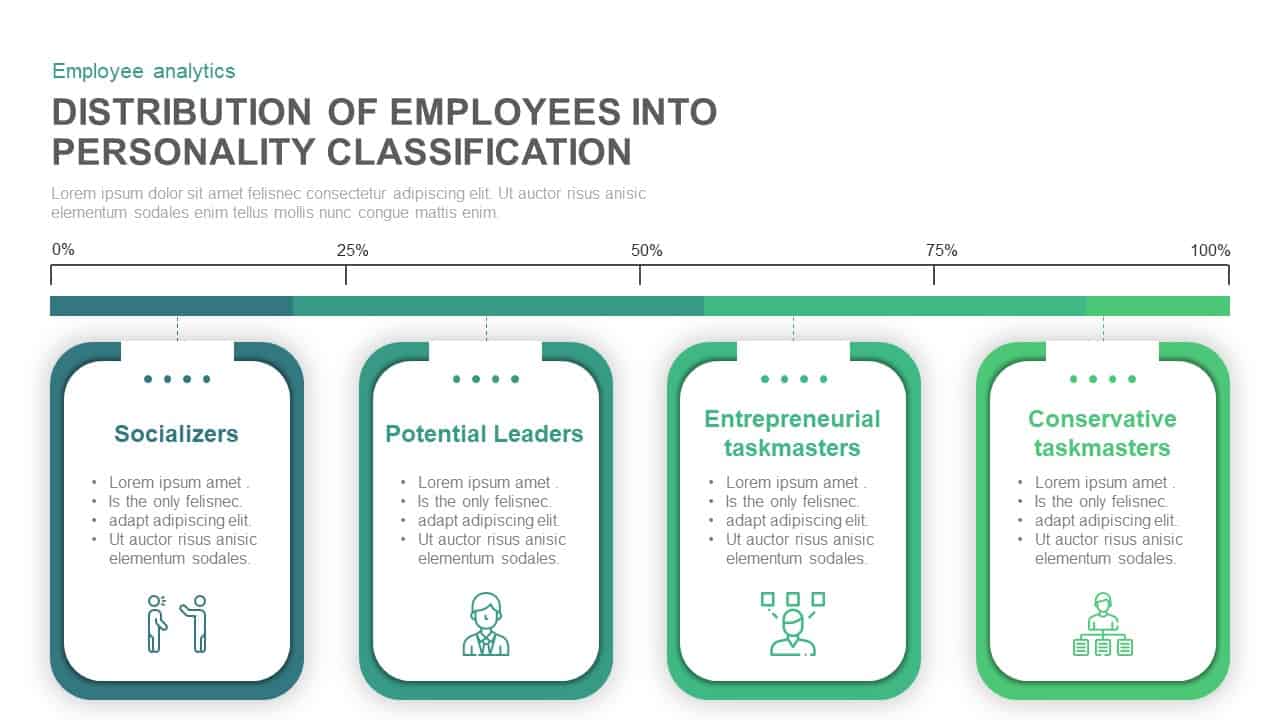
Employee Personality Distribution Chart Template for PowerPoint & Google Slides
Bar/Column
-
Distracting Factors at Work Bar Chart Template for PowerPoint & Google Slides
Bar/Column
-
Entertainment Industry Revenue Bar Chart Template for PowerPoint & Google Slides
Bar/Column
-
For and Against Vote Count Bar Chart Template for PowerPoint & Google Slides
Bar/Column
-
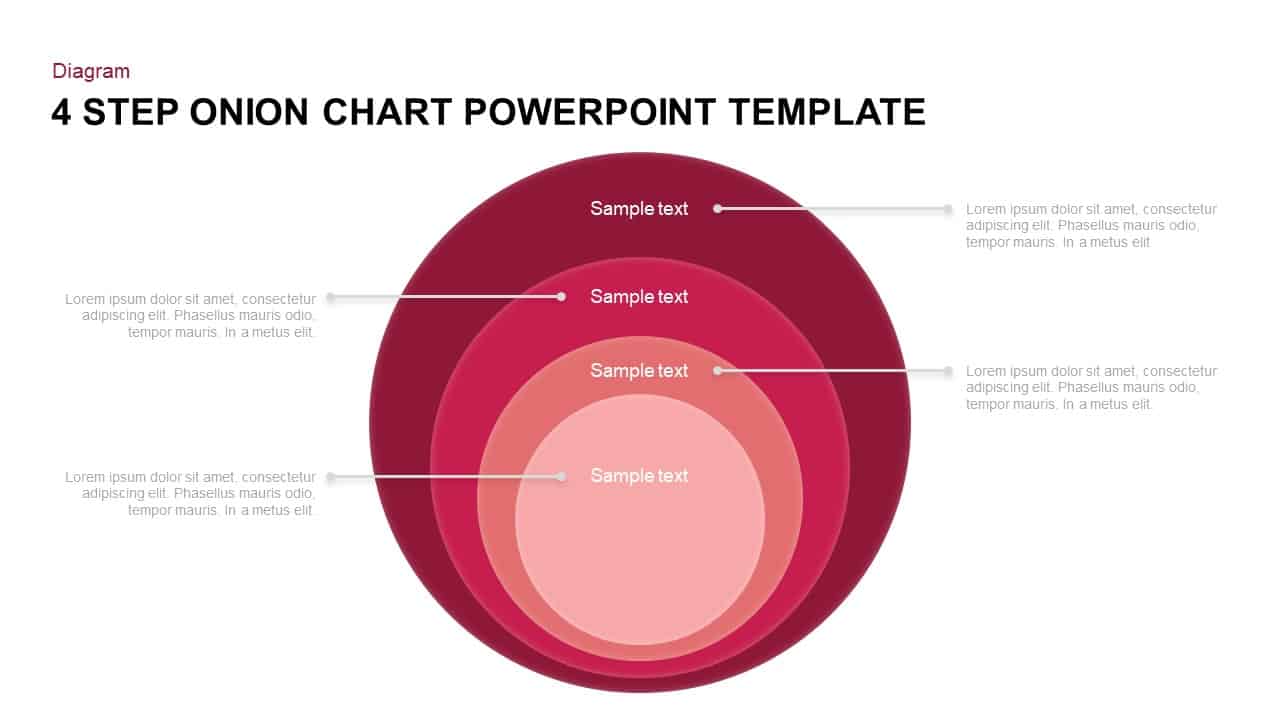
Four-Step Onion Chart Process Template for PowerPoint & Google Slides
Charts
-
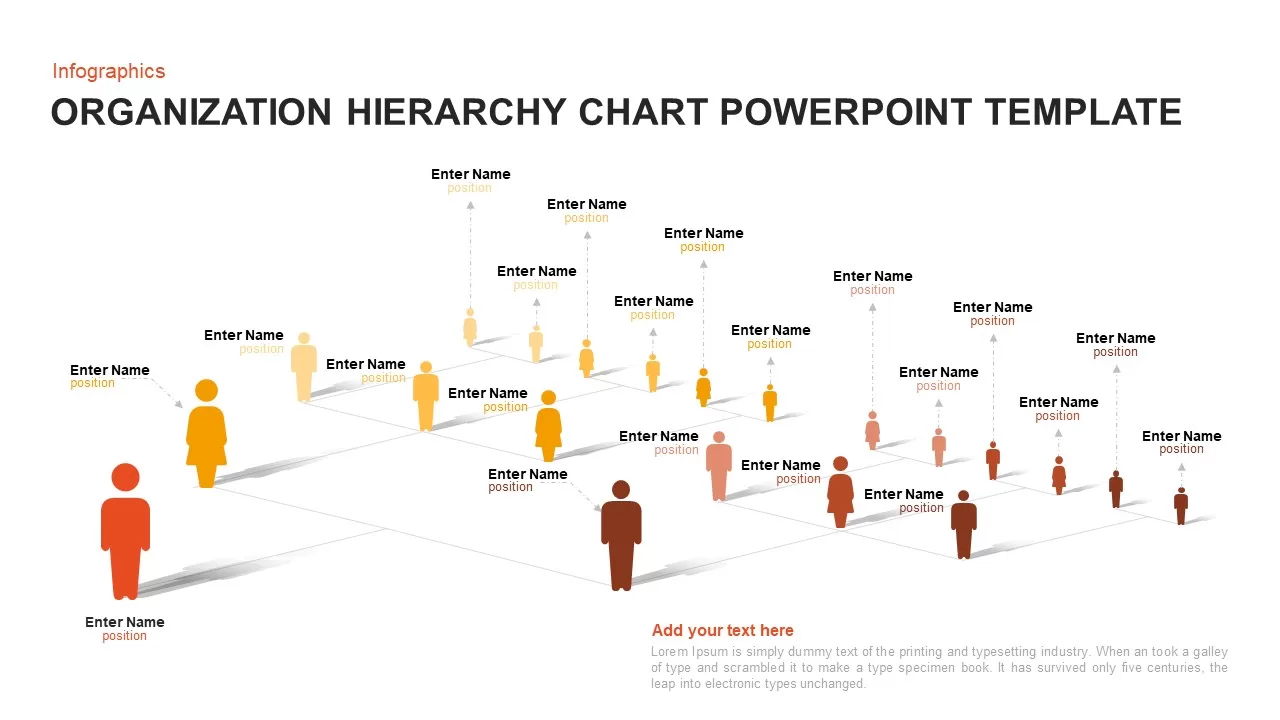
3D Organization Hierarchy Chart Template for PowerPoint & Google Slides
Org Chart
-
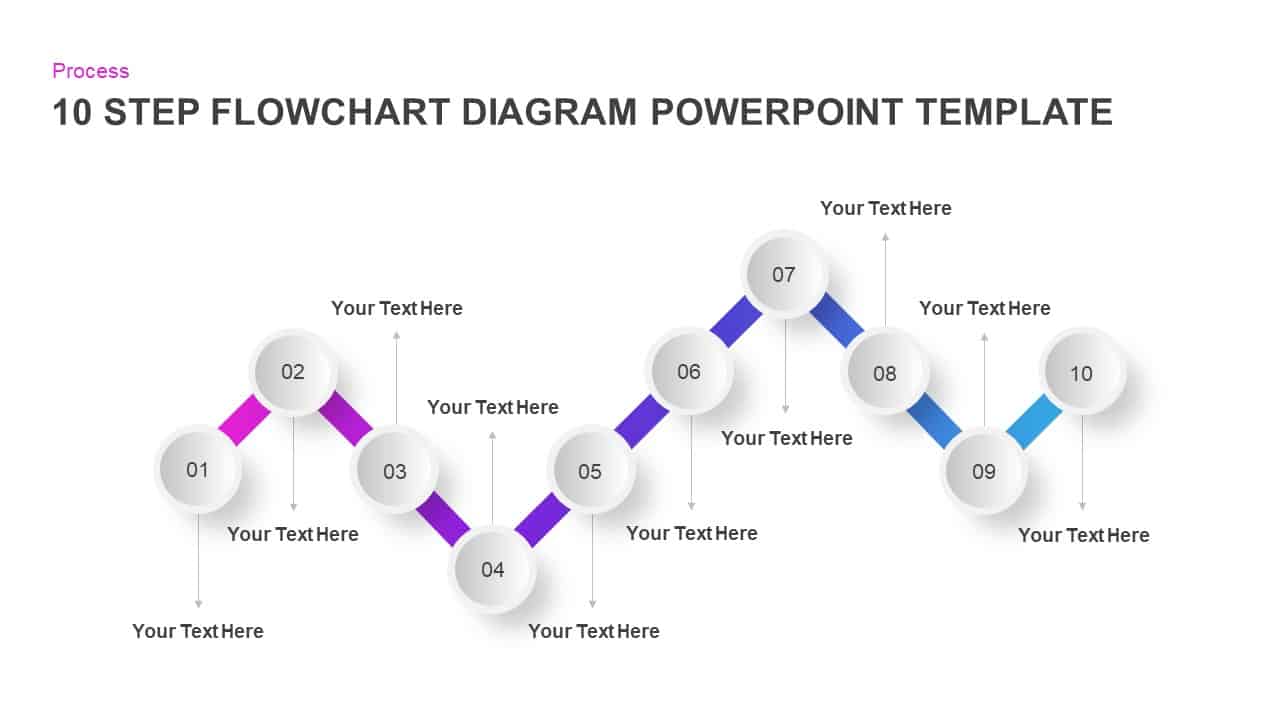
Gradient Ten-Step Flowchart Diagram Template for PowerPoint & Google Slides
Process