Circular Product Comparison Chart Template for PowerPoint & Google Slides
Product Comparison A VS B PowerPoint and Google Slides Template
Evaluating two software solutions, comparing competitor features, or helping buyers choose between two product tiers requires clear side-by-side positioning. This Product Comparison A vs B template provides product marketers, sales teams, consultants, and procurement managers with a focused seven-slide comparison deck. Utilizing warm amber-gold and rich magenta accents, the layouts help you pit two competing offerings against each other so clients and stakeholders can weigh trade-offs, pricing, and technical specifications at a glance.
Contrast Competing Options with a Product Comparison Presentation Slide
Putting two concepts head-to-head works best when the visual contrast is immediate and balanced:
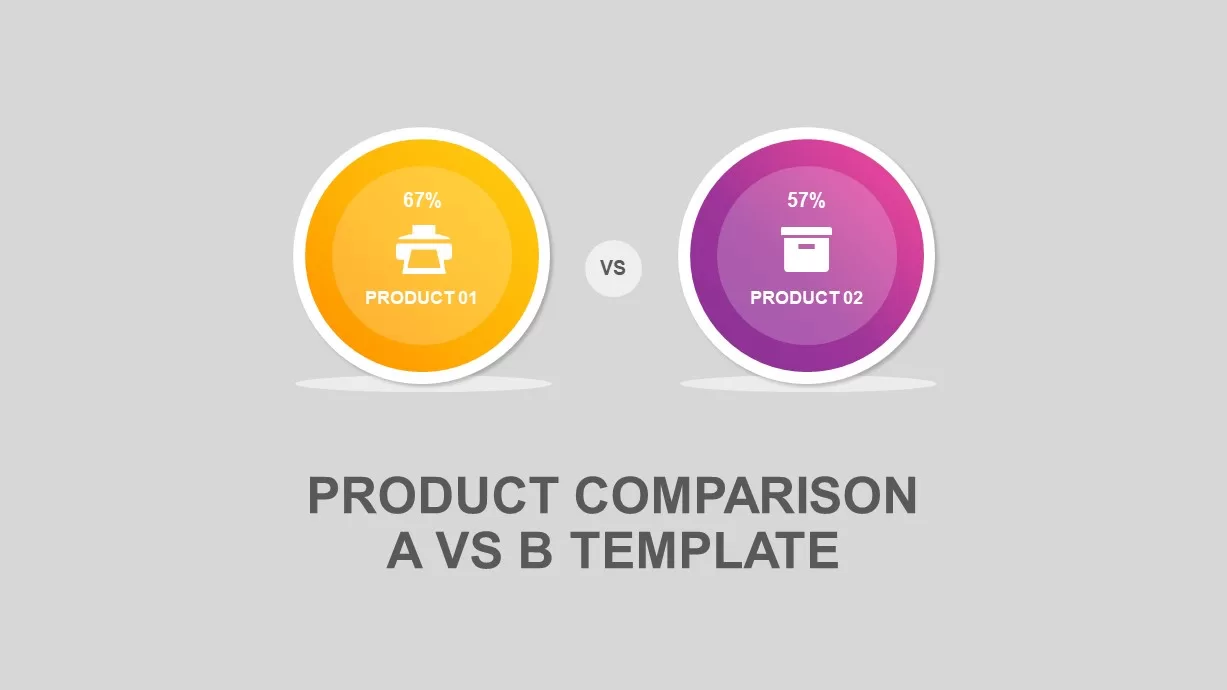
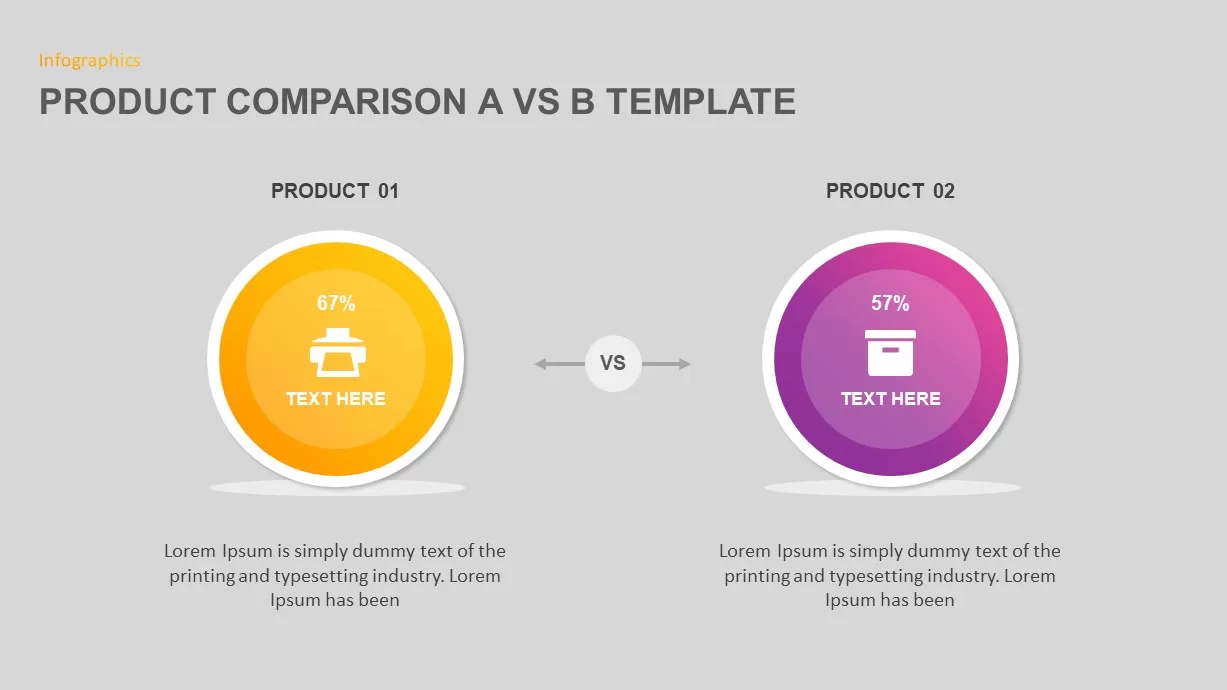
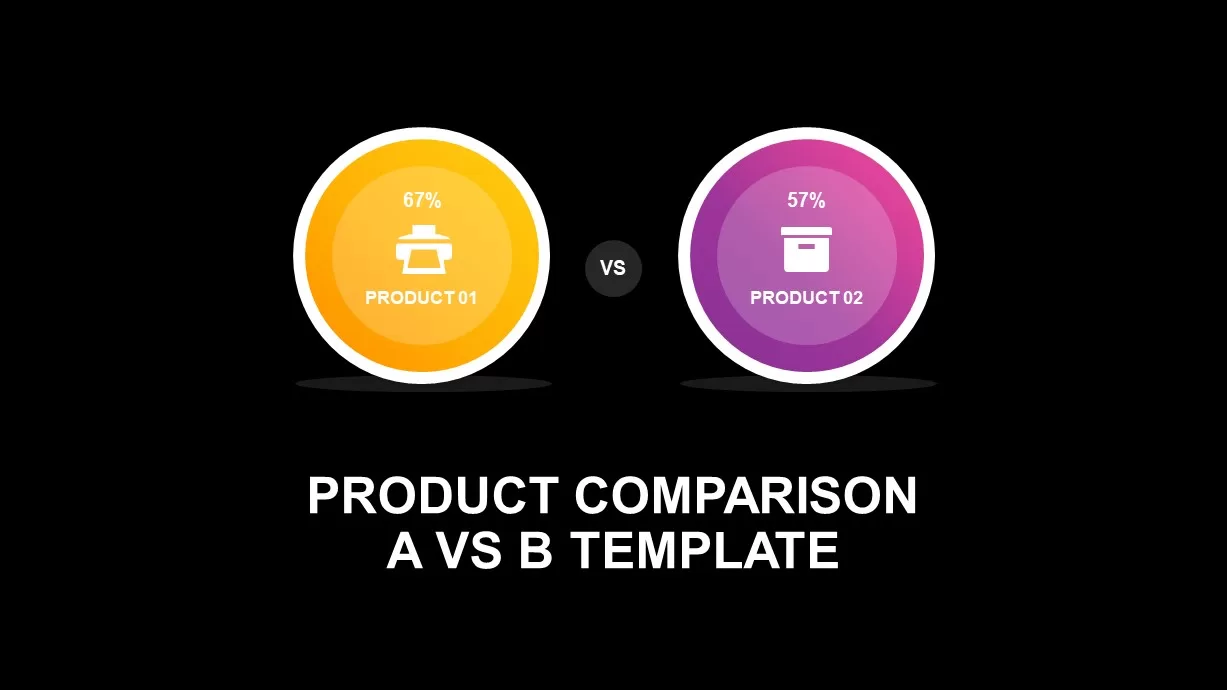
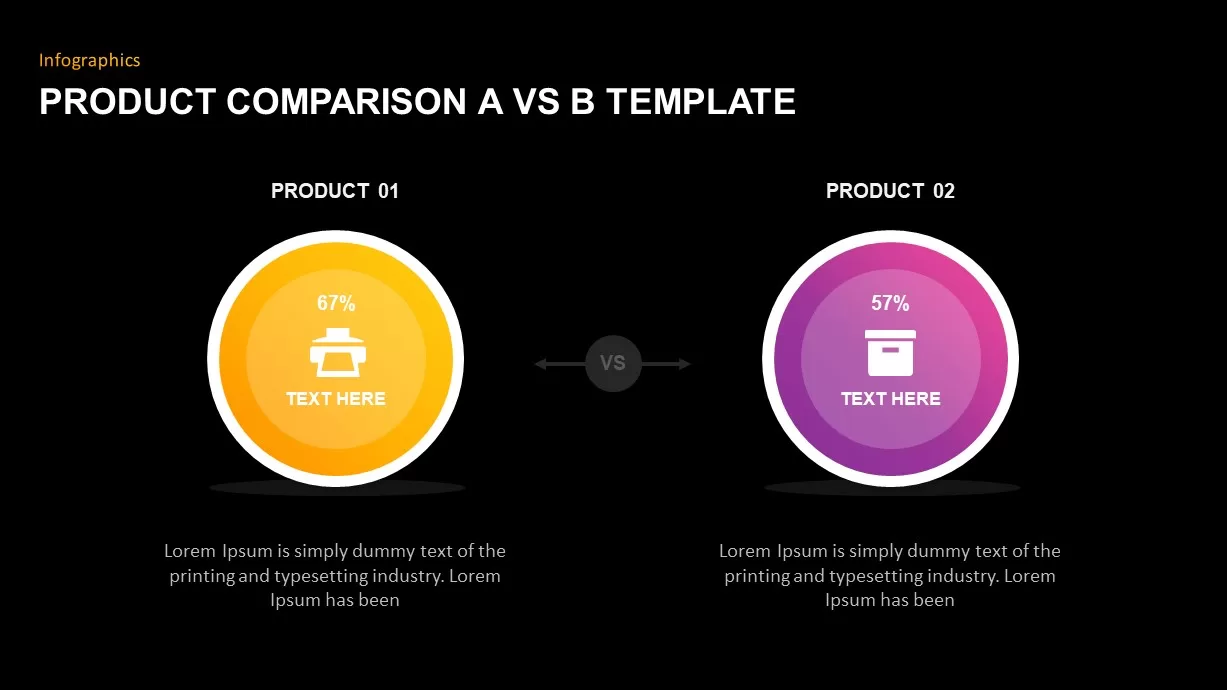
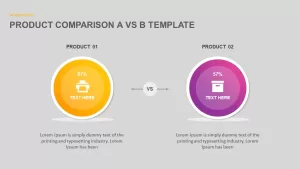
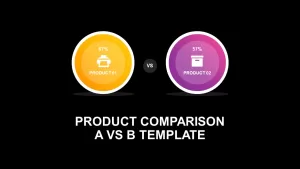
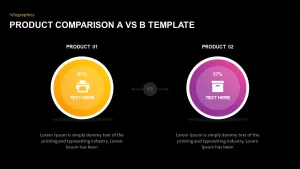
- A bold title slide featuring two elevated circular nodes for Product A and Product B linked by a central “VS” badge, set against a soft gray canvas.
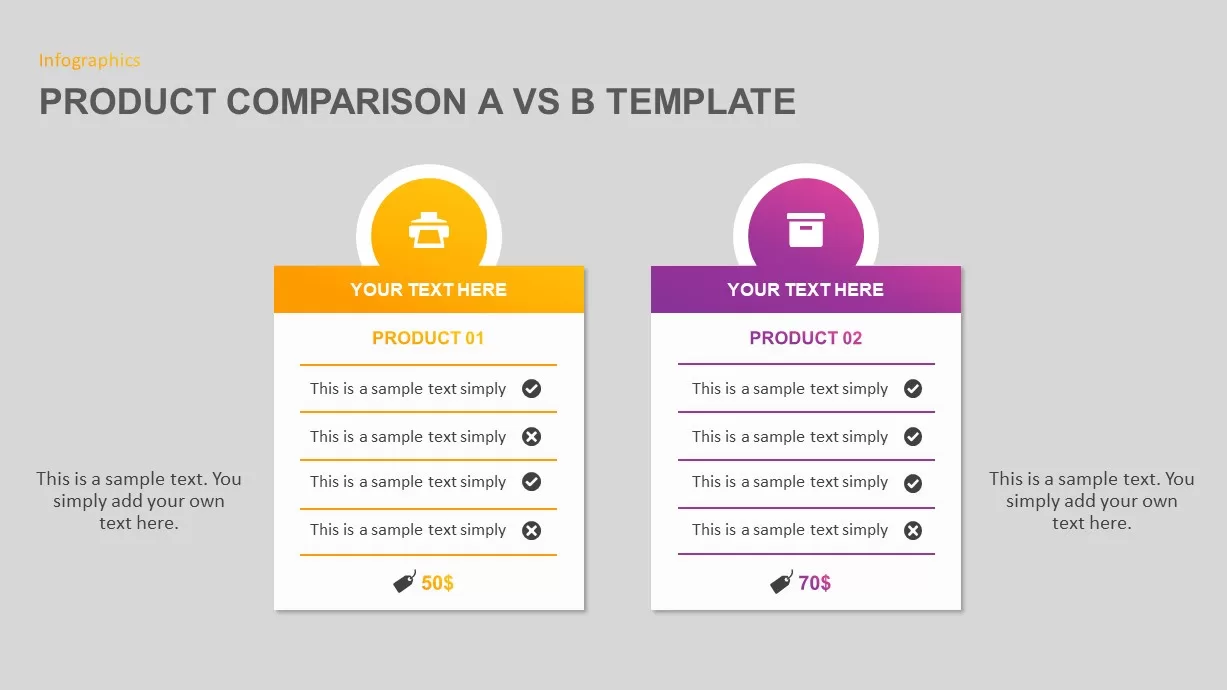
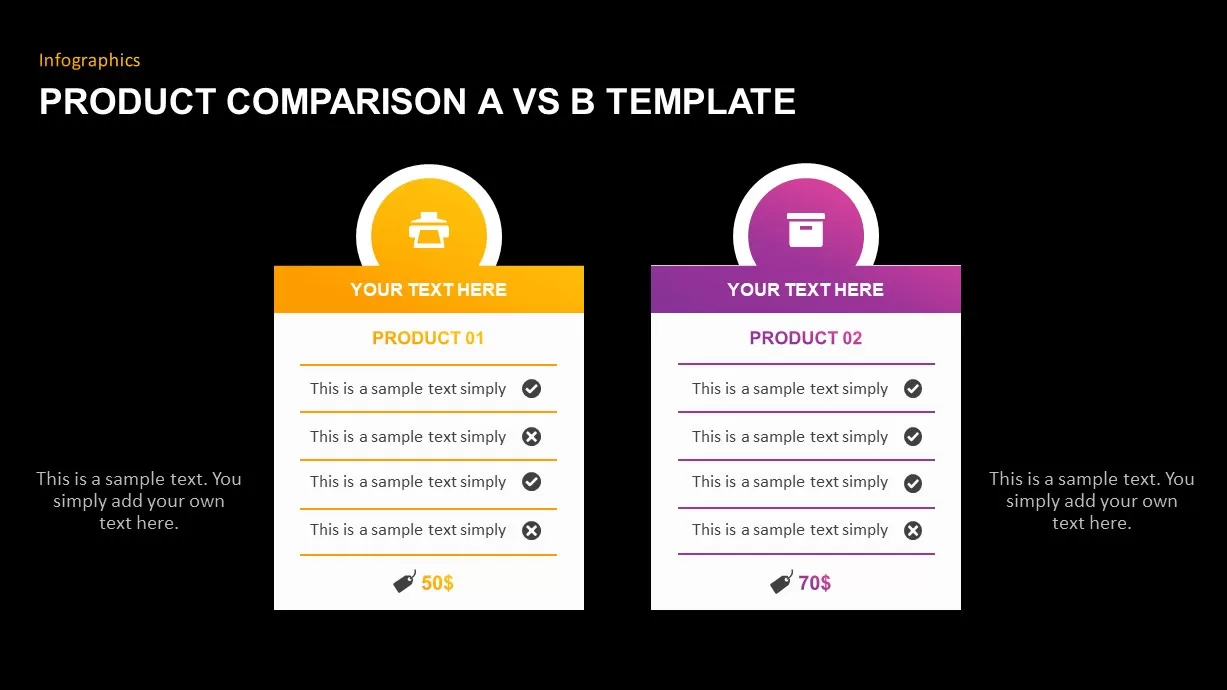
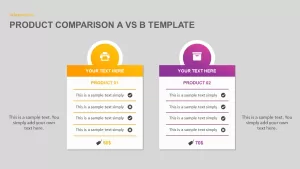
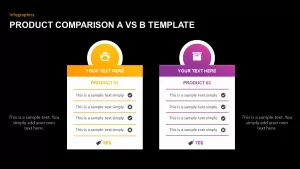
- Side-by-side comparison tables topped with arched color-coded header blocks, line art icons, and checkmark feature rows to evaluate capabilities.
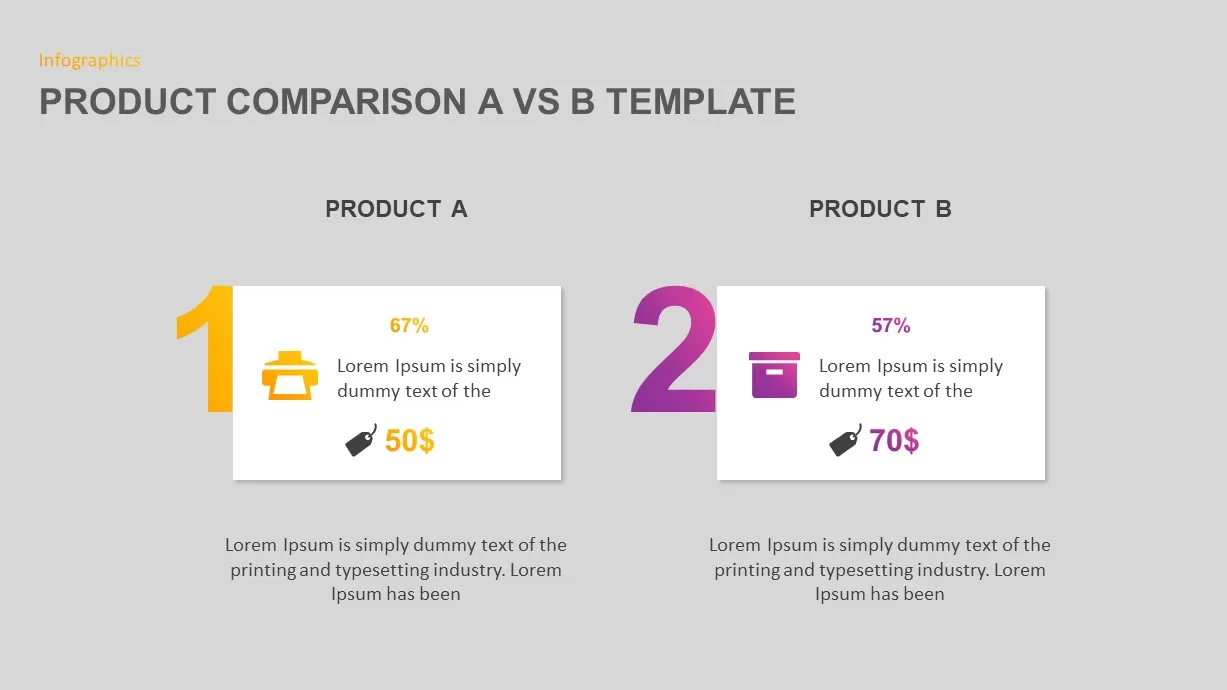
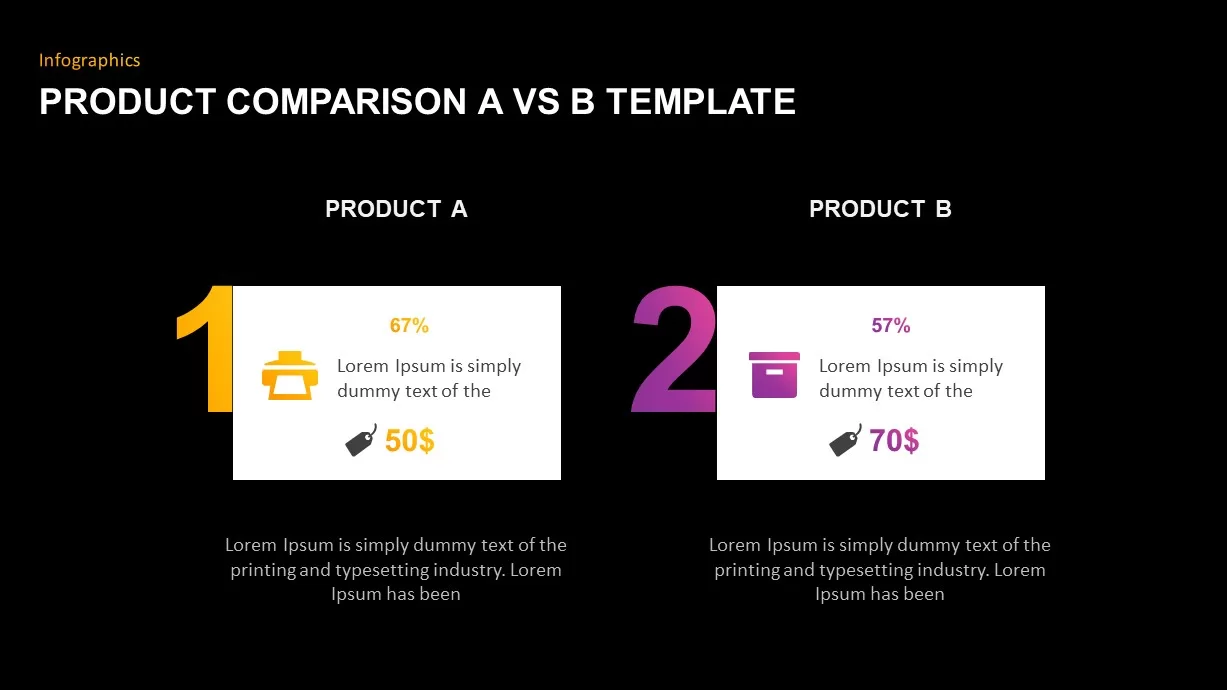
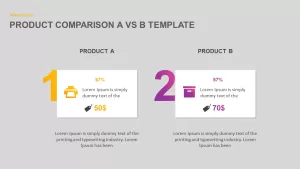
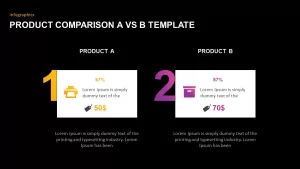
- Dedicated pricing footers on table cards that clearly highlight cost differences ($50 vs $70) alongside specific deliverables.
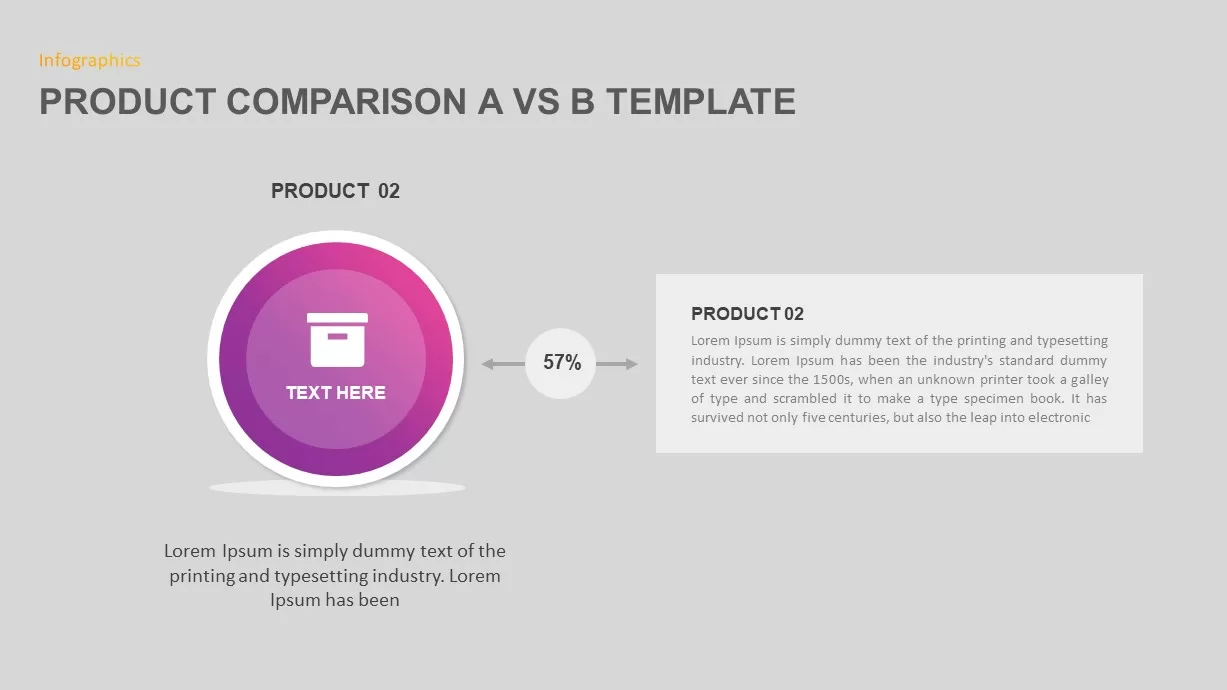
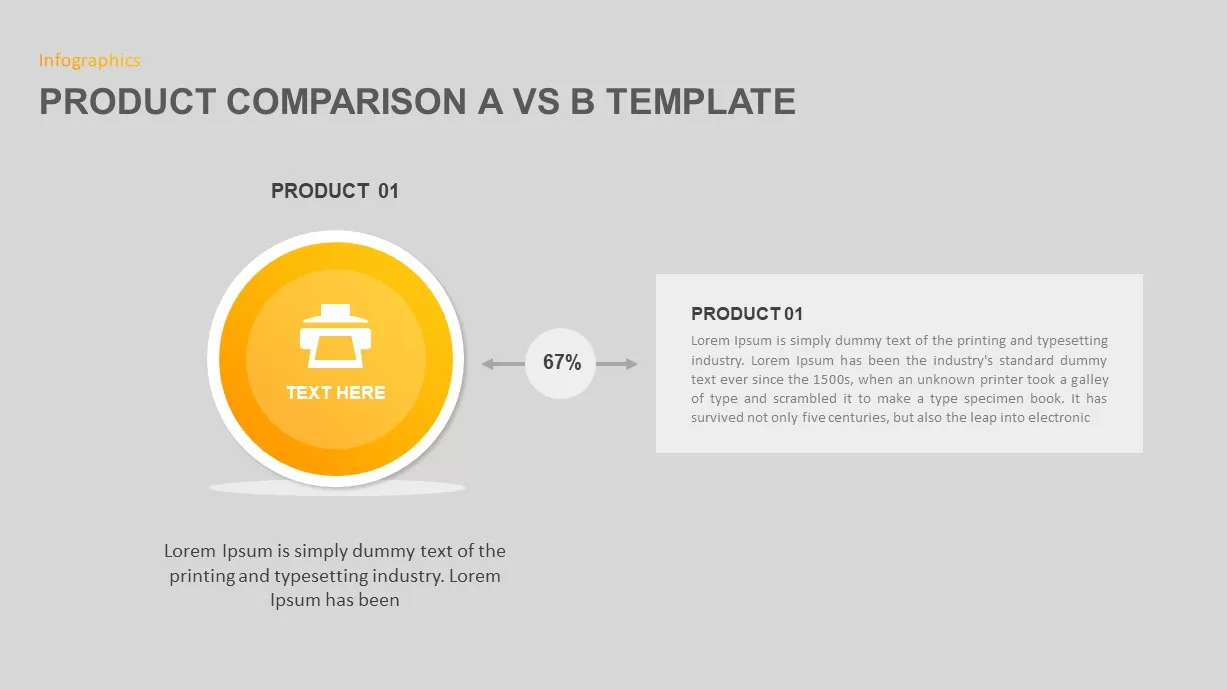
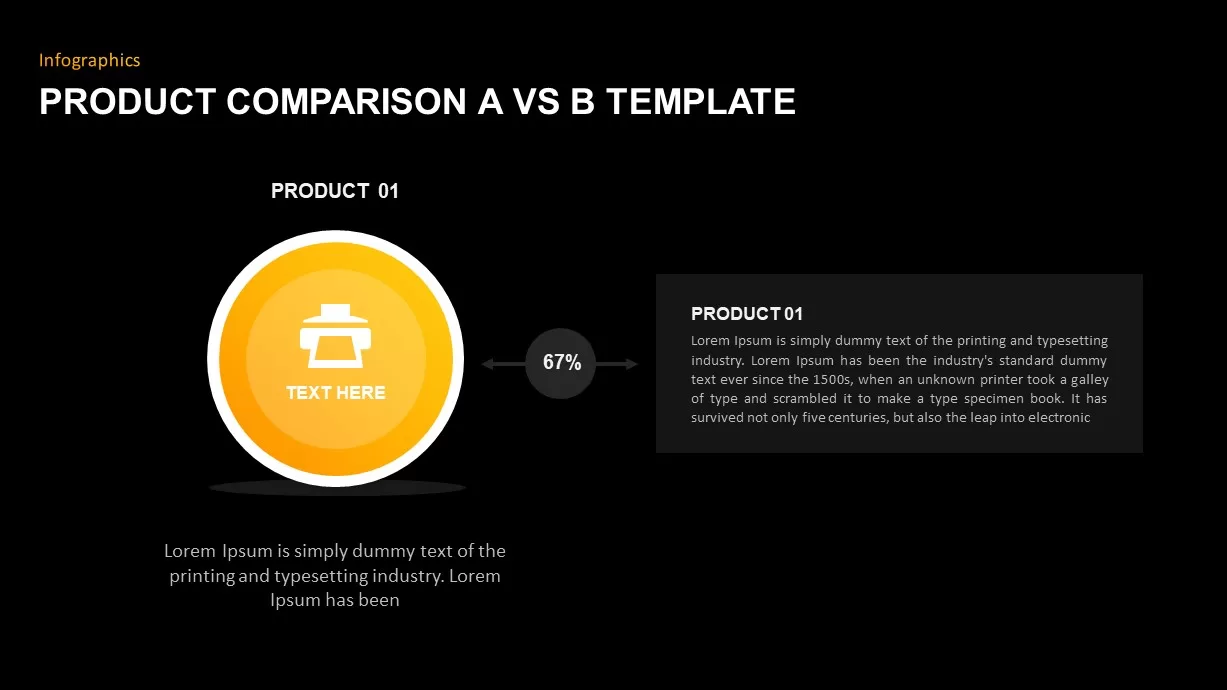
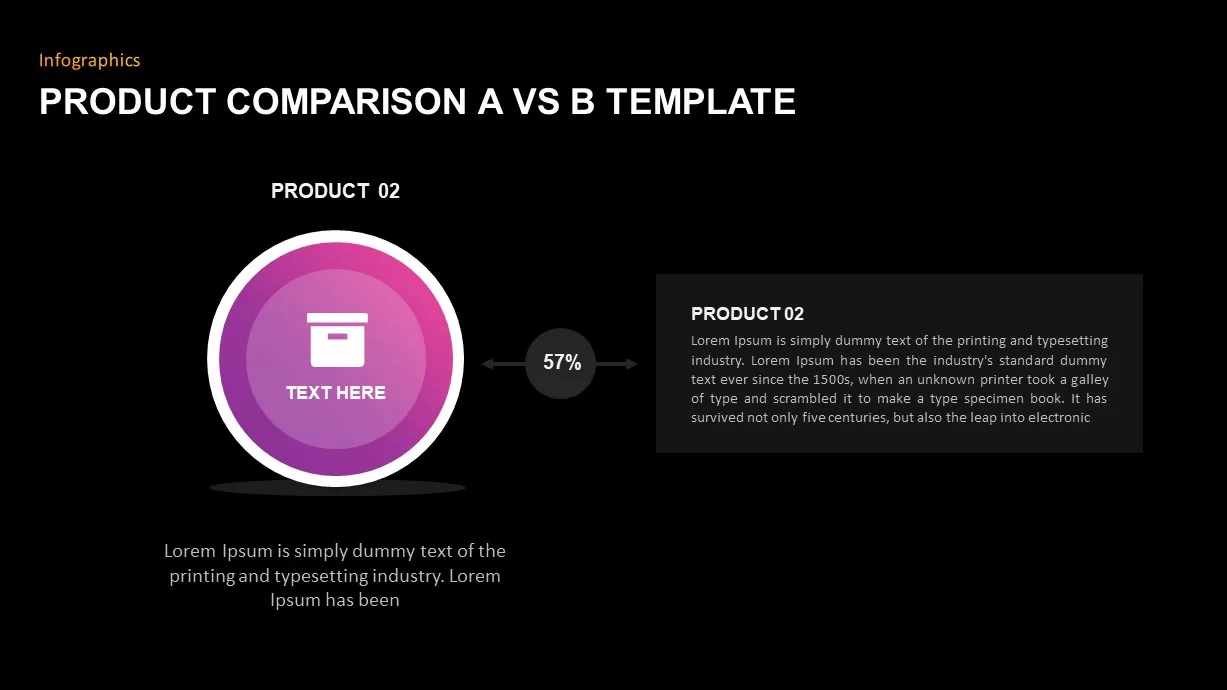
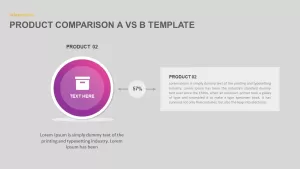
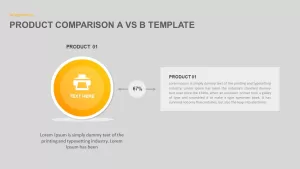
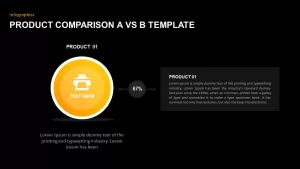
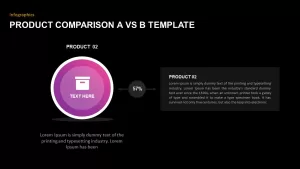
- Individual spotlight slides designed to isolate a single product node, complete with horizontal connectors leading into detailed specification paragraphs.
Evaluate Specifications using A vs B Comparison Google Slides
Presenting clear trade-offs across different audiences requires clean visual variety and adaptable themes:
- Dark slate and light gray background versions, ensuring high readability across dimly lit auditoriums, bright conference rooms, and virtual calls.
- Minimalist typography and balanced card margins engineered to keep dense technical data points clean and easy to scan.
- Distinct line art icons representing core product categories, packaging, and digital tools.
- 100% editable vector components across PowerPoint and Google Slides, allowing you to tweak pricing numbers, modify feature rows, swap color palettes, or update icons in minutes.
Login to download this file

Item ID
SB01823


Related Templates

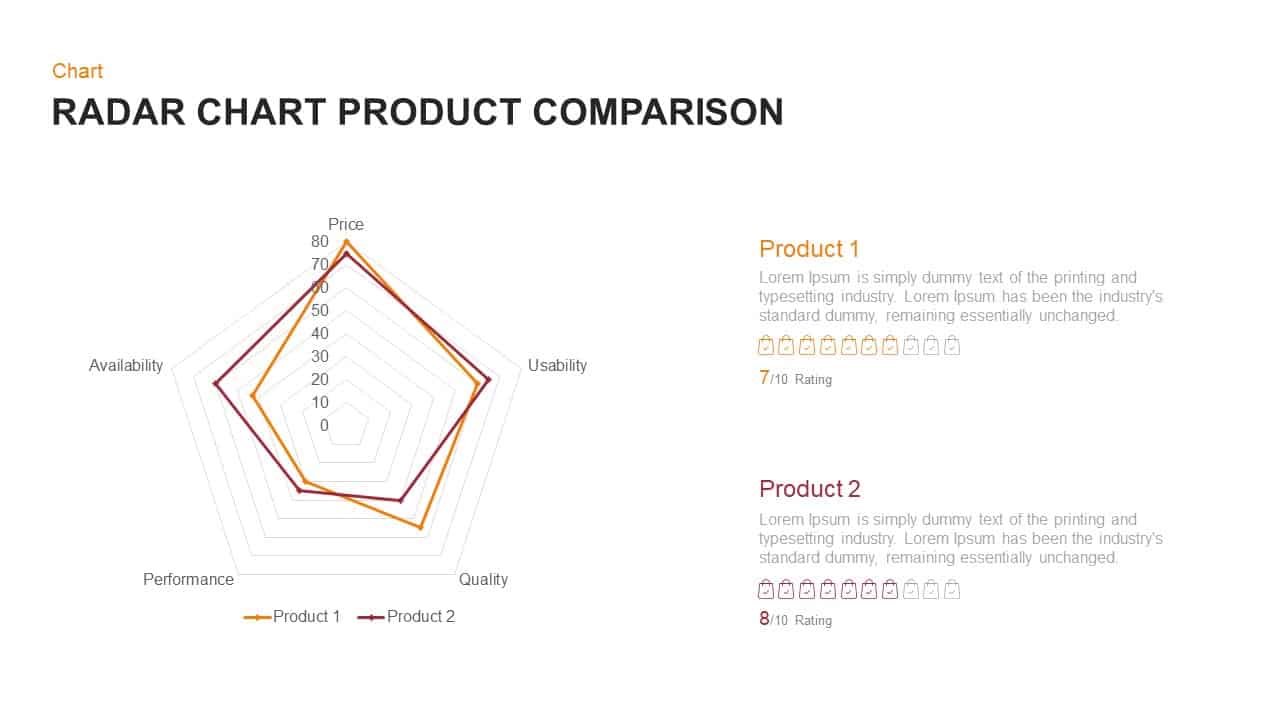
Radar Chart Product Comparison PowerPoint Template
Comparison Chart
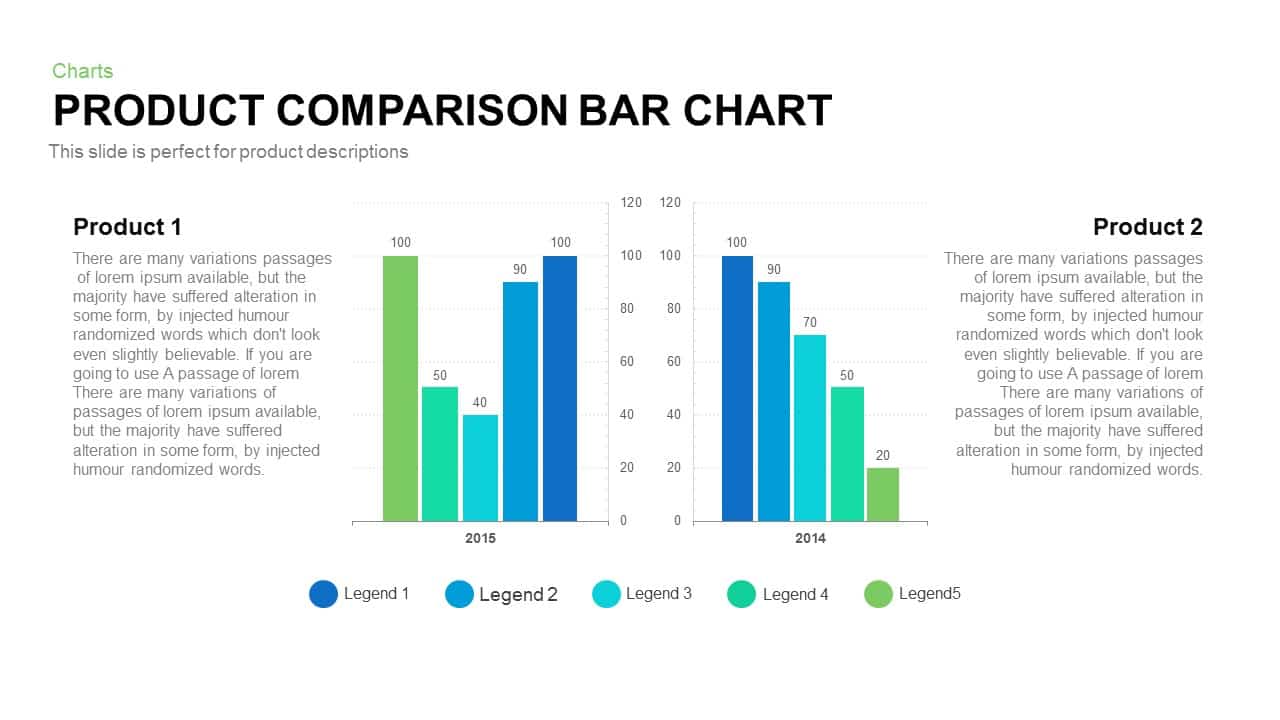
Product Comparison Bar Chart Template
Bar/Column
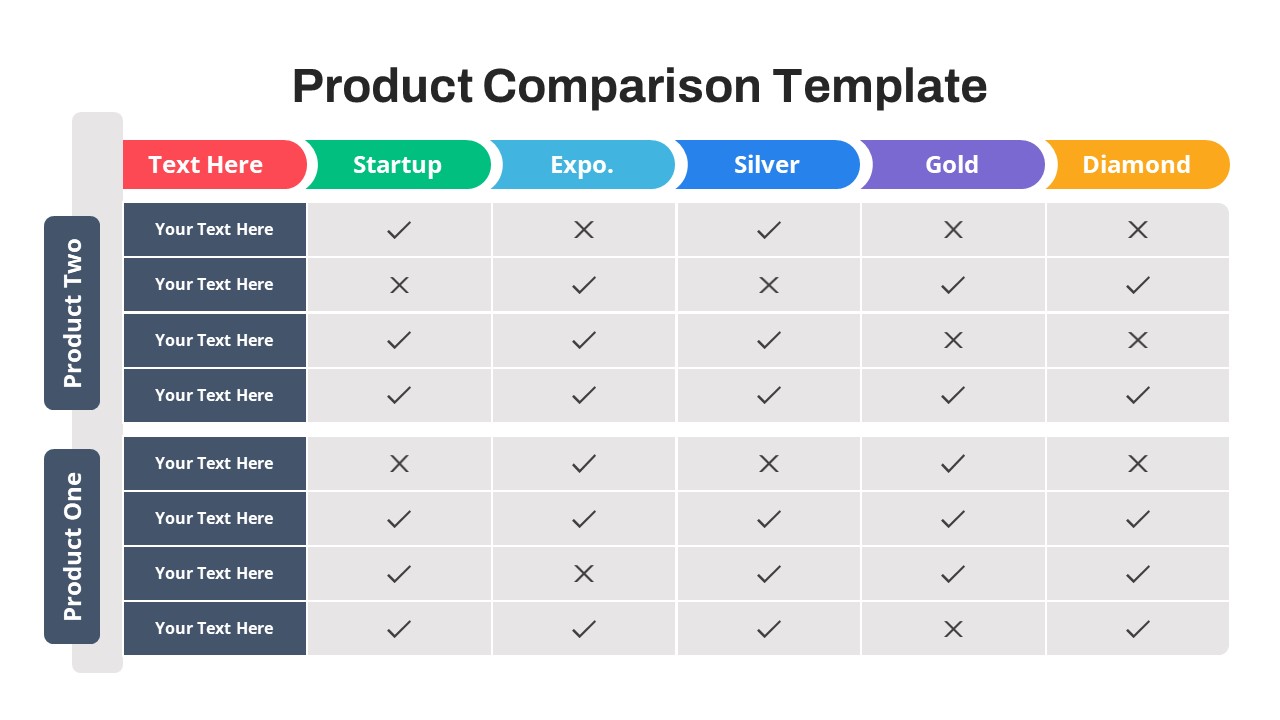
Free Product Comparison Chart Template
Charts
Free
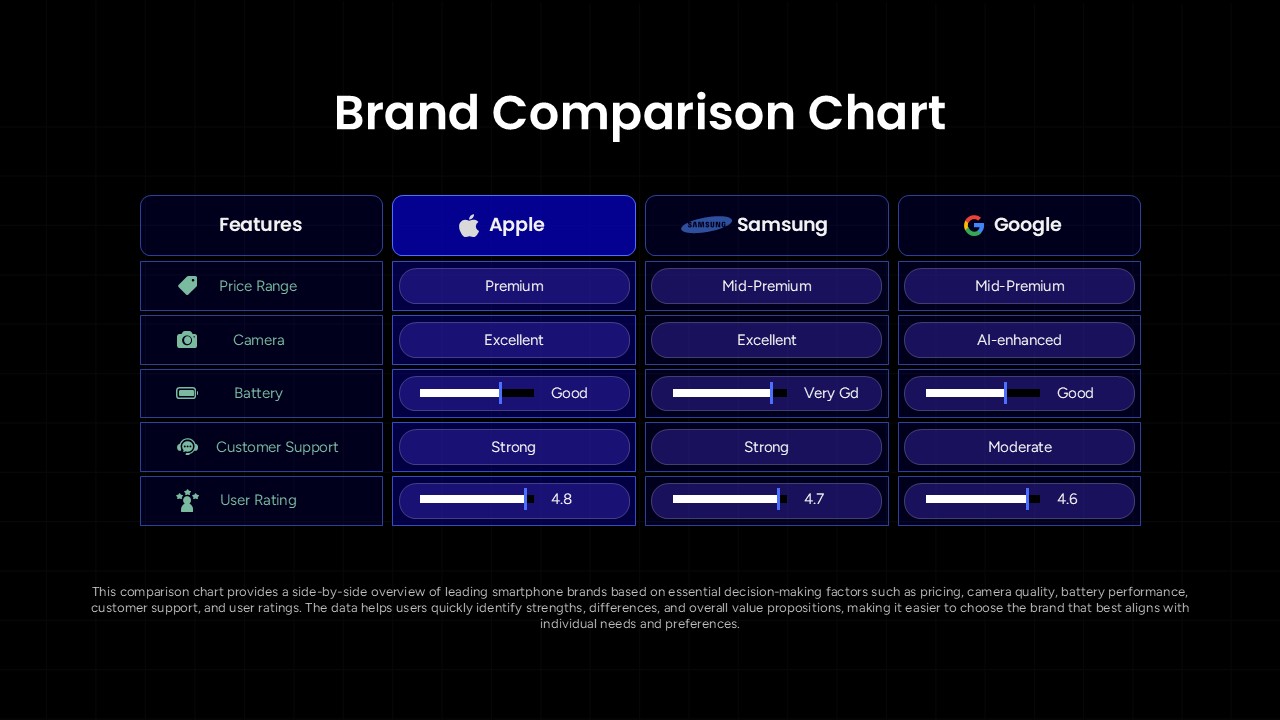
Brand Comparison Chart Template for Product and Competitive Analysis
Comparison Chart
Product Feature Comparison Table Template
Comparison Chart
Feature List Template PPT & Product Comparison Slides
Decks
Product Comparison PowerPoint Template
Comparison
Comparison Bar Chart template for PowerPoint & Google Slides
Comparison Chart
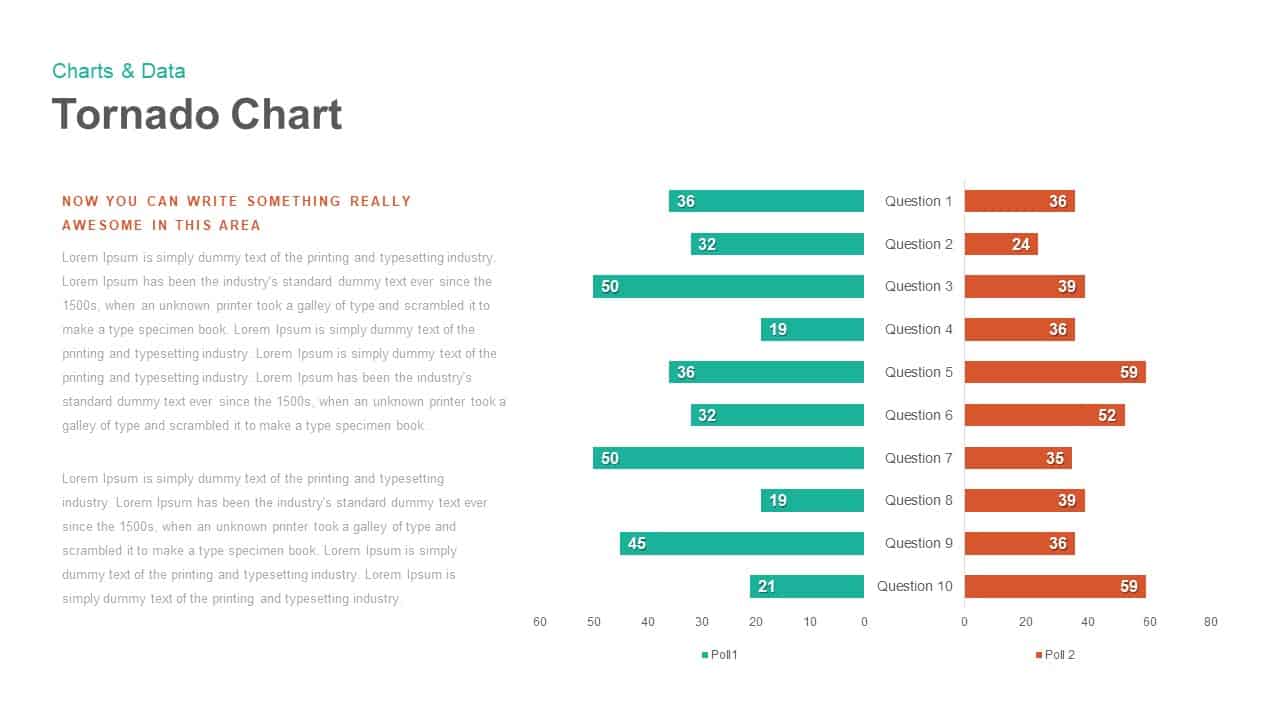
Tornado Chart Data Comparison Slide Template for PowerPoint & Google Slides
Bar/Column
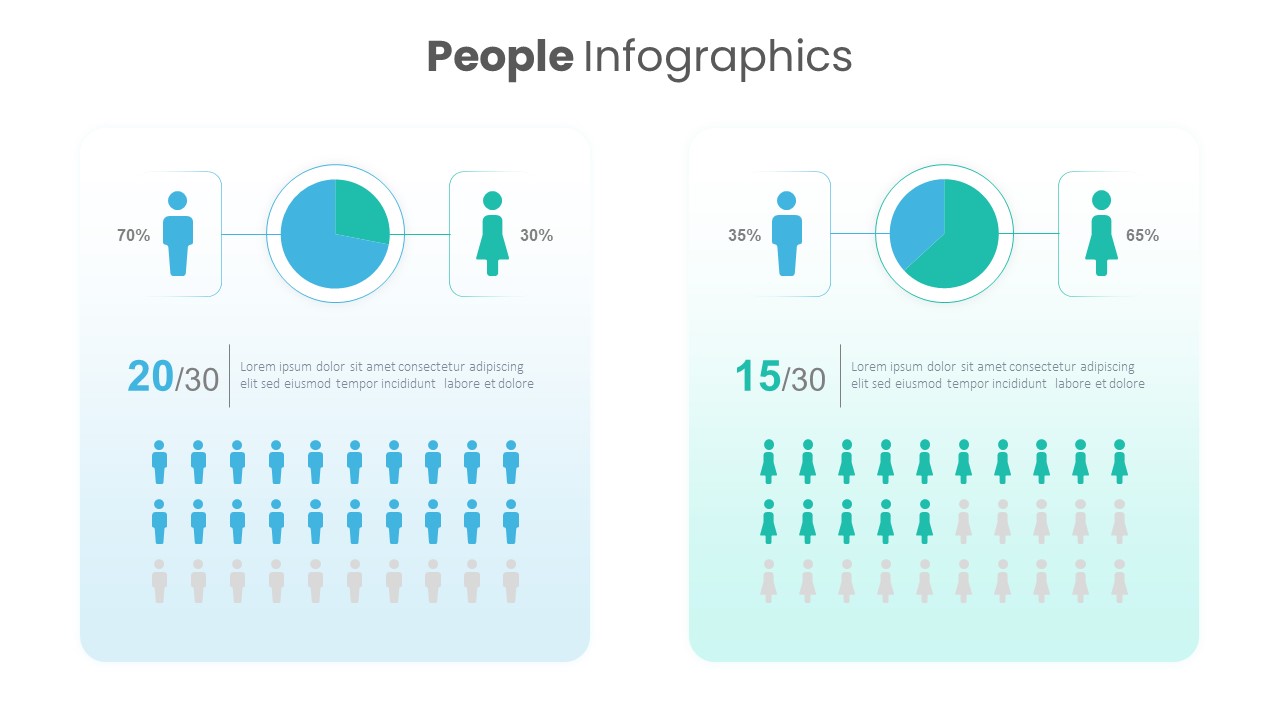
People Demographic Comparison Chart Template for PowerPoint & Google Slides
Comparison
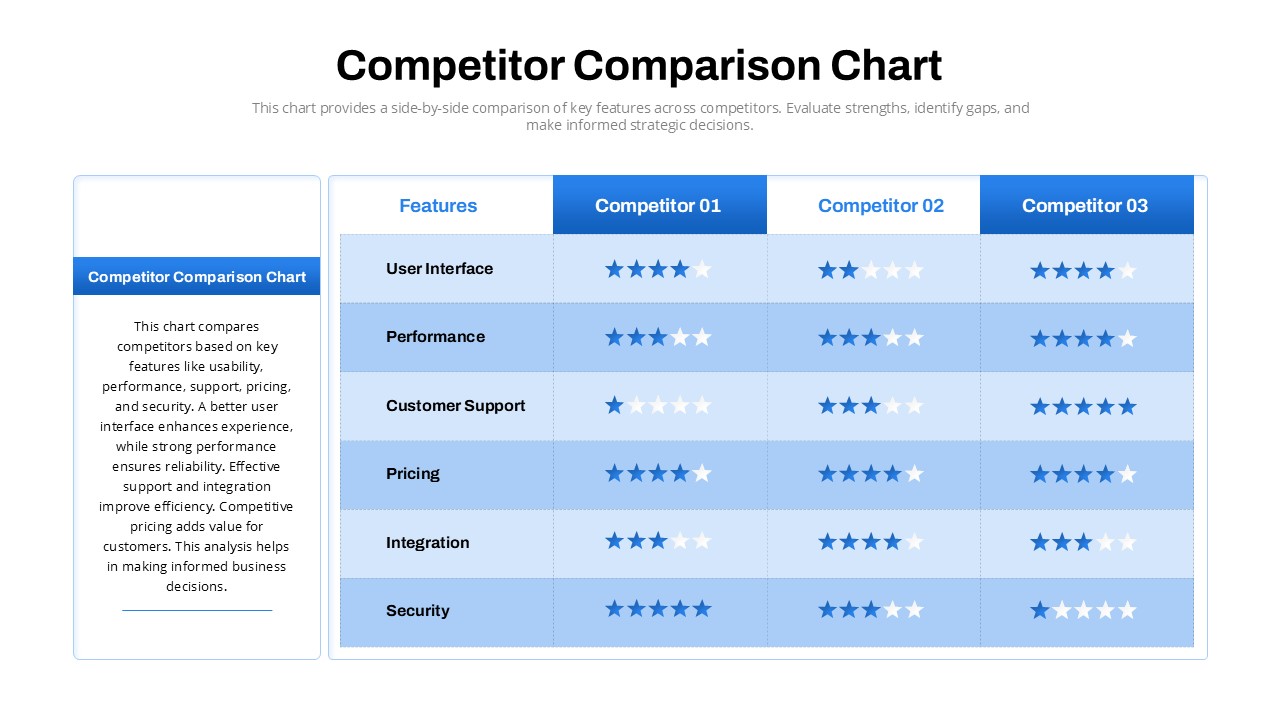
Competitor Comparison Chart Design Template for PowerPoint & Google Slides
Comparison
Skills Gap Analysis PowerPoint Template
Gap
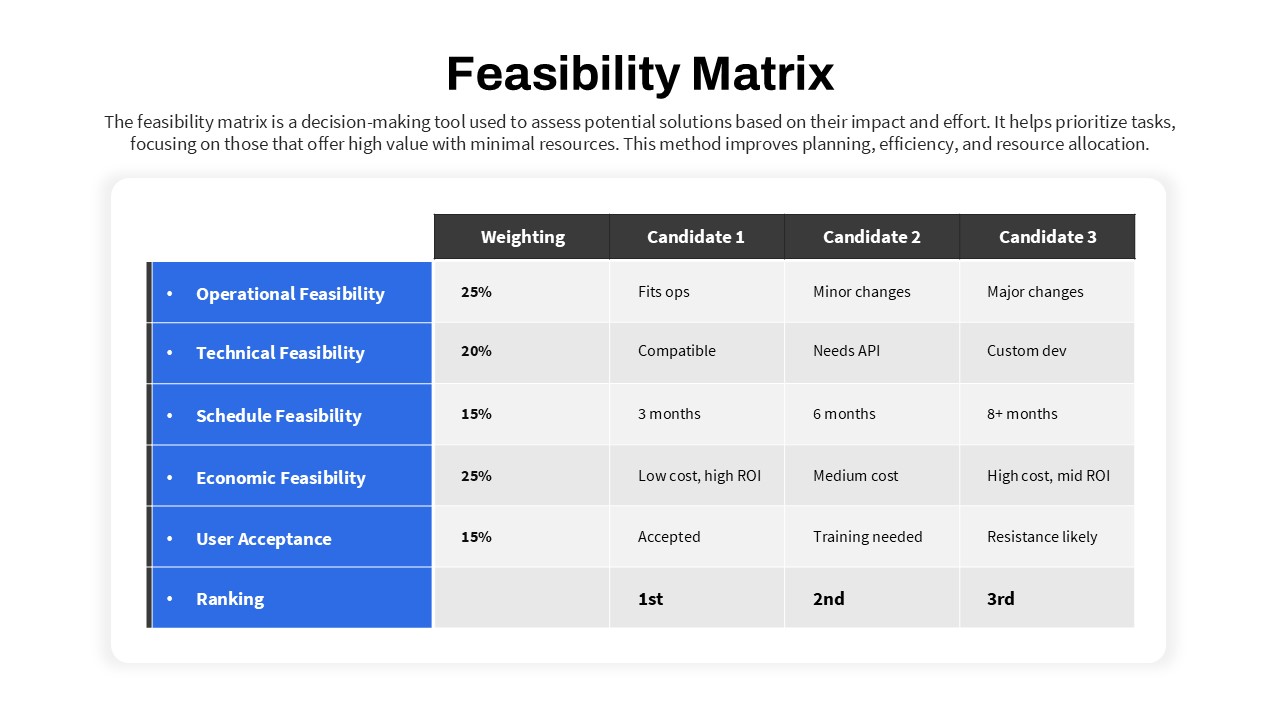
Feasibility Matrix Comparison Chart Template
Comparison Chart
3-Chart Comparison PowerPoint Template
Pie/Donut
Blank Comparison Chart PowerPoint Template
Comparison Chart
Process Comparison PowerPoint Template
Infographics
Comparison Chart Design for PowerPoint & Google Slides
Comparison

Product Roadmap Gantt Chart Timeline template for PowerPoint & Google Slides
Gantt Chart
Product Development Gantt Chart template
Gantt Chart
Organizational Structure Chart Template for Business Presentations
Org Chart