Brand Comparison Chart Template for Product and Competitive Analysis
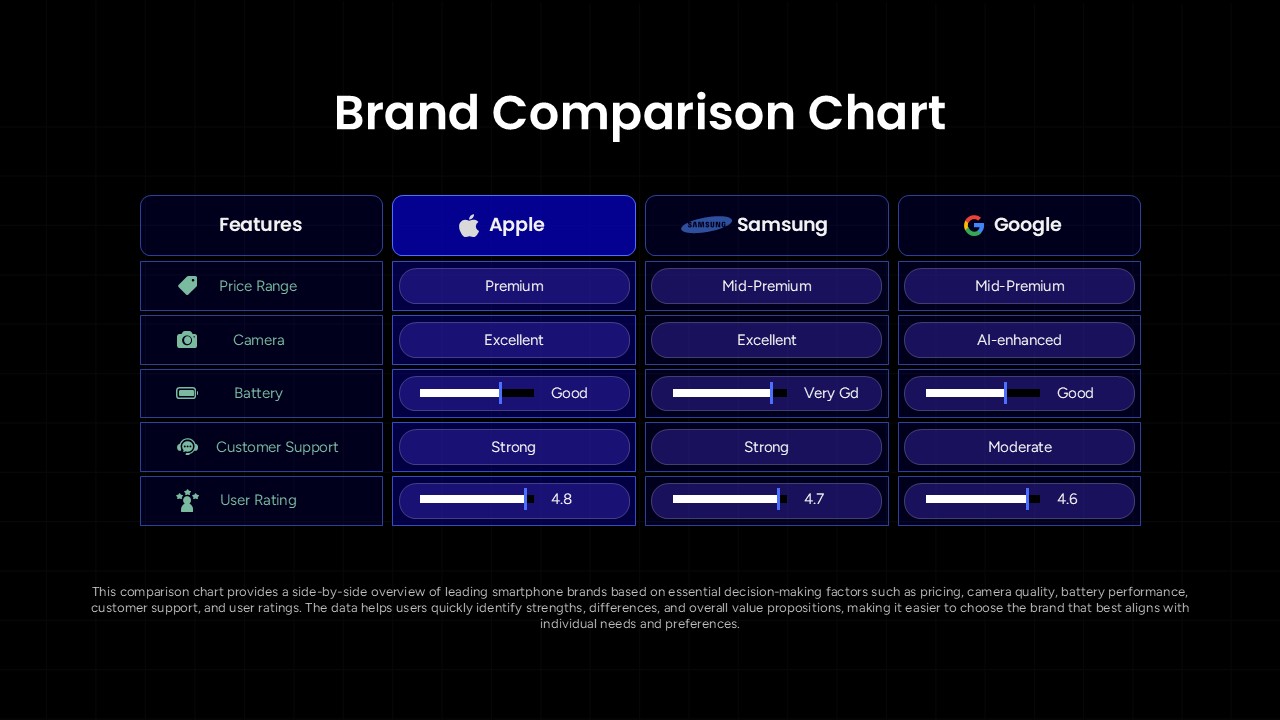
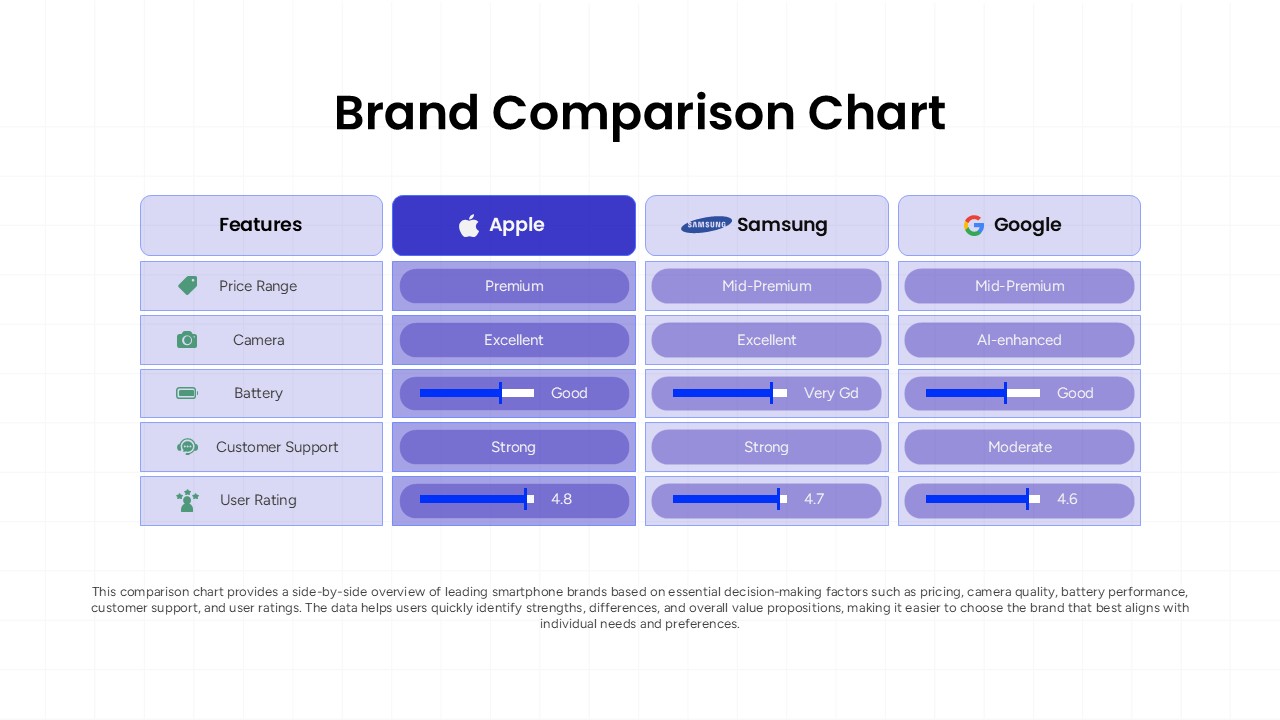
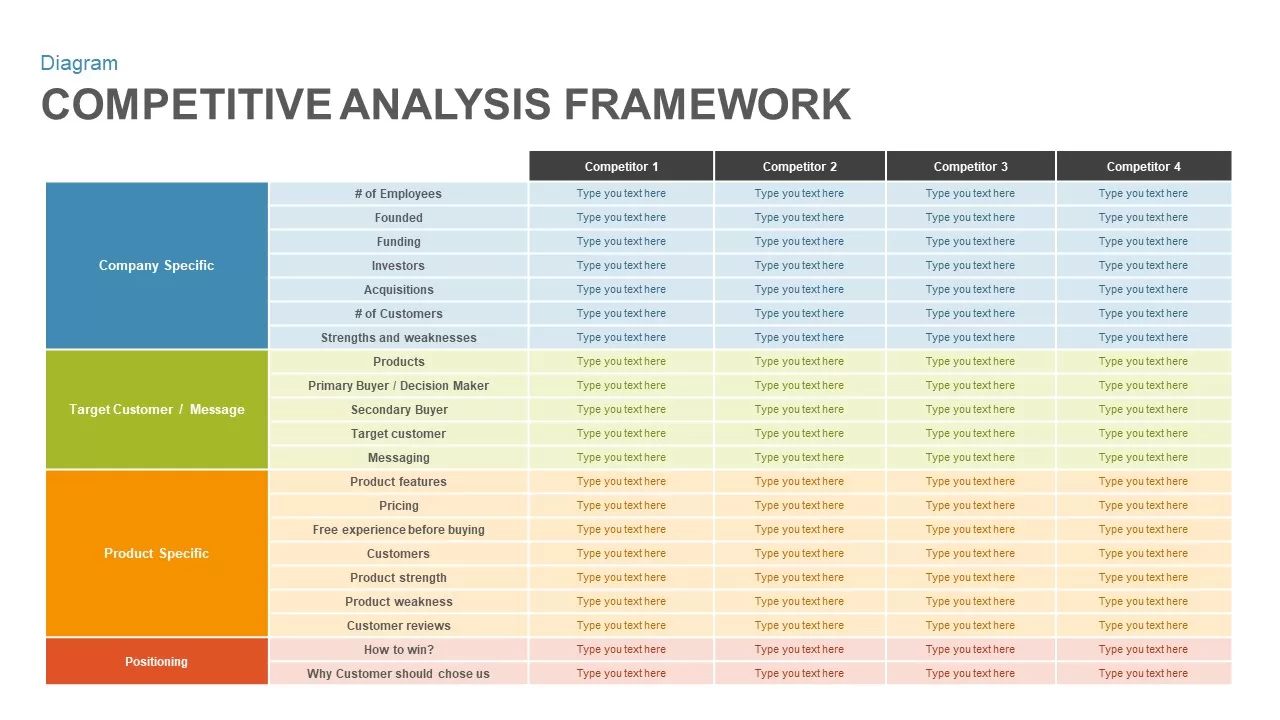
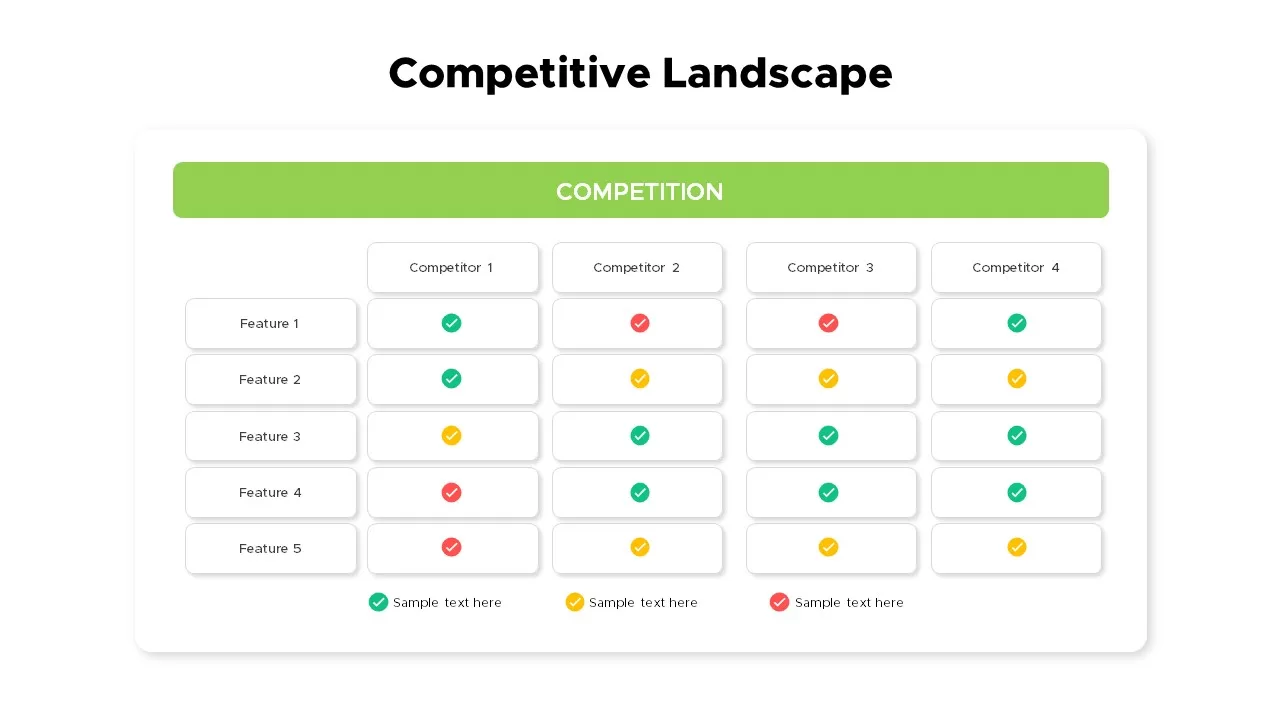
Making informed decisions often requires a clear side-by-side comparison. This type of evaluation framework is commonly used in marketing templates when presenting market positioning and competitive insights.This Brand Comparison Chart Template is designed to help teams present product comparisons, competitor evaluations, brand positioning, feature analysis, and market research findings in a structured and visually engaging format. The layout allows audiences to quickly identify similarities, differences, strengths, and trade-offs across multiple brands or offerings.
- Compare products, services, software platforms, consumer brands, or business solutions in a single view.
- Present key decision criteria such as pricing, performance, customer support, ratings, usability, features, and value propositions.
- Support product selection discussions, procurement reviews, vendor assessments, and competitive benchmarking projects.
- Help sales teams, marketing professionals, consultants, product managers, and business analysts communicate evaluation results clearly.
- Create evidence-based presentations that guide stakeholders through comparison criteria before reaching conclusions.
The cover slide introduces a structured comparison framework that can serve as the foundation for a complete decision-making presentation. Follow-up slides can explore individual evaluation categories, scoring methodologies, customer feedback, market positioning, strengths and weaknesses, and final recommendations. This approach creates a logical presentation flow that moves audiences from comparison criteria to actionable insights.
The template is particularly useful for technology evaluations, consumer product comparisons, SaaS platform assessments, supplier selection processes, market intelligence reports, and strategic planning presentations. The editable comparison matrix makes it easy to adapt the content for different industries and business scenarios.
Compatible with Microsoft PowerPoint and Google Slides, this template allows users to customize comparison categories, ratings, icons, brand names, colors, and performance indicators while maintaining a professional and consistent presentation style.
Frequently Asked Questions
How do I customize the comparison categories in this template?
Can I add more brands or companies to compare?
Login to download this file

Item ID
SB05940Designed By
Naseeba Sithara
Related Templates

Competitive Analysis Framework Template
Business Report
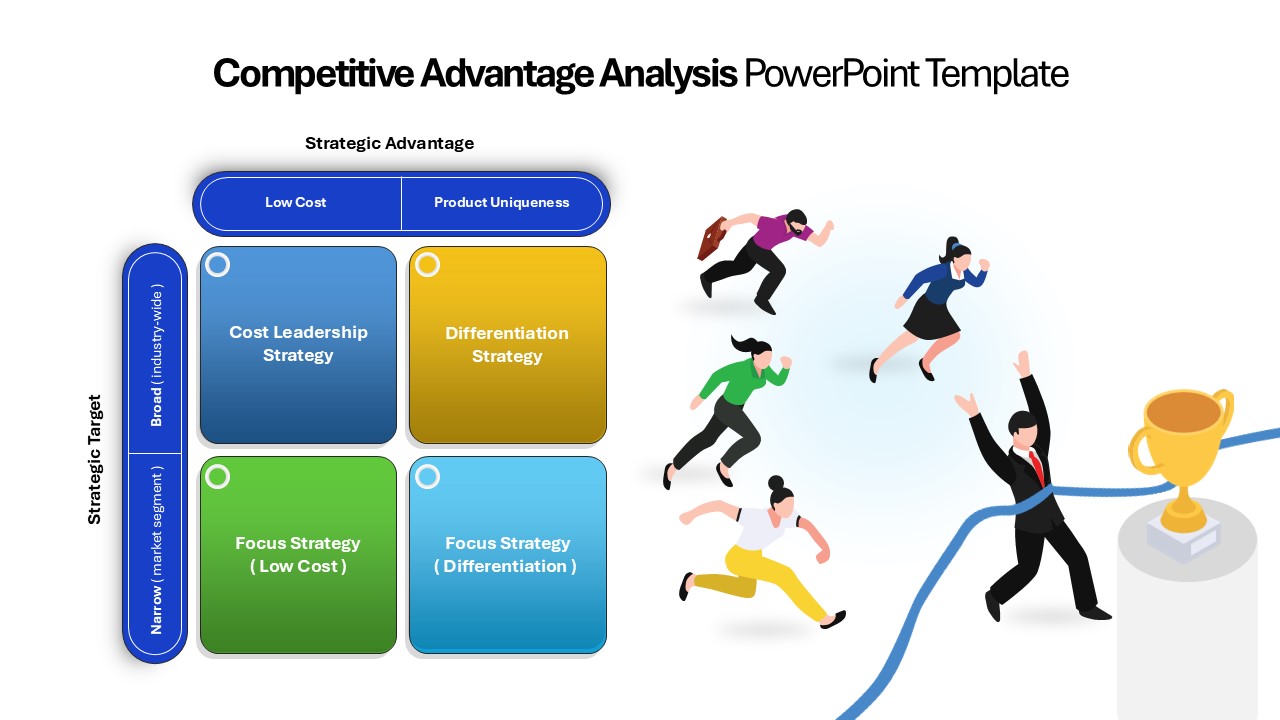
Competitive Advantage Analysis PowerPoint Template
Business Strategy
Interactive Product Comparison Bar Chart Template for PowerPoint & Google Slides
Bar/Column
Radar Chart Product Comparison Template for PowerPoint & Google Slides
Comparison Chart

Circular Product Comparison Chart Template for PowerPoint & Google Slides
Comparison Chart
Free Product Comparison Chart Template
Charts
Free
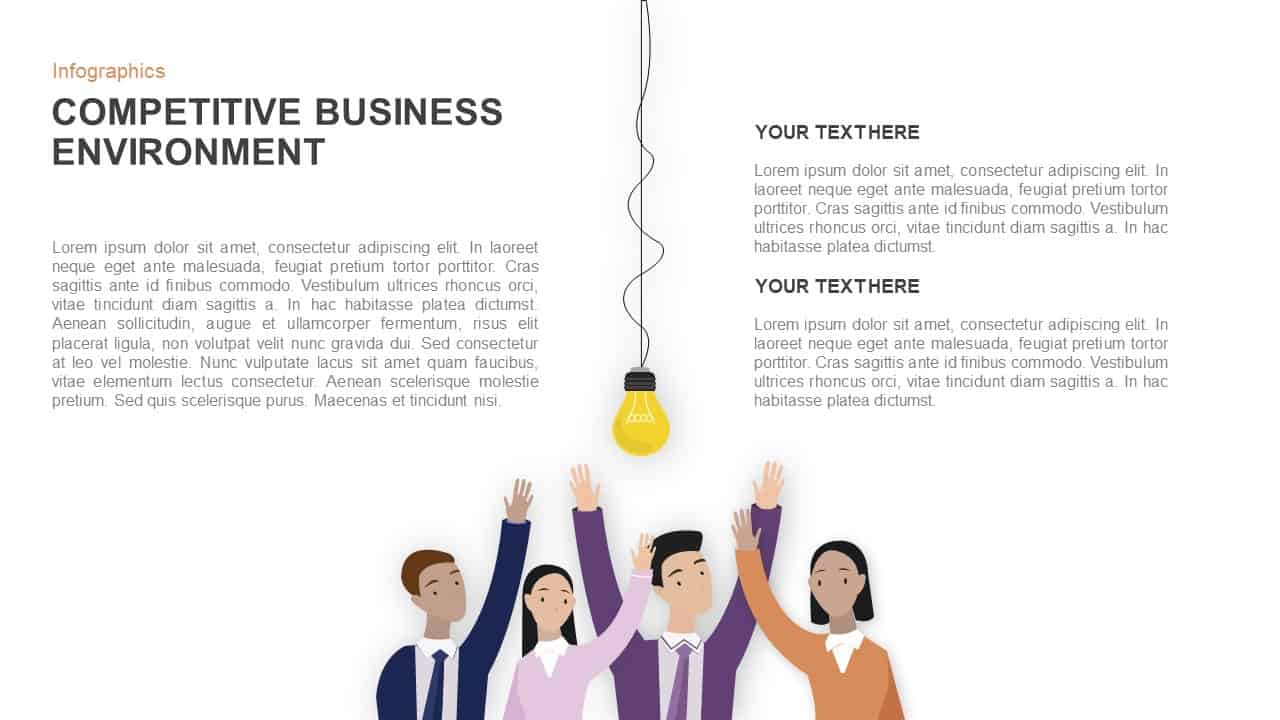
Competitive Business Environment Template for PowerPoint & Google Slides
Competitor Analysis
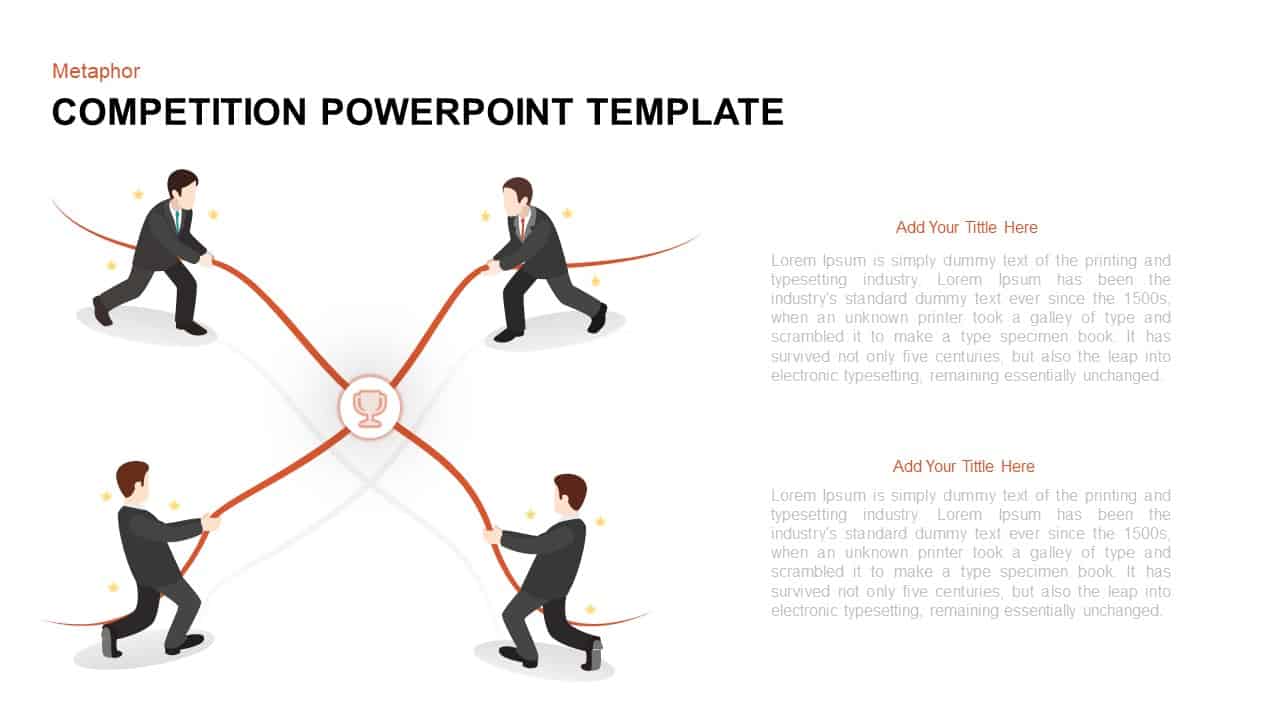
Competitive Tug-of-War Metaphor Template for PowerPoint & Google Slides
Business Strategy
Competitive Landscape Matrix Template for PowerPoint & Google Slides
Comparison
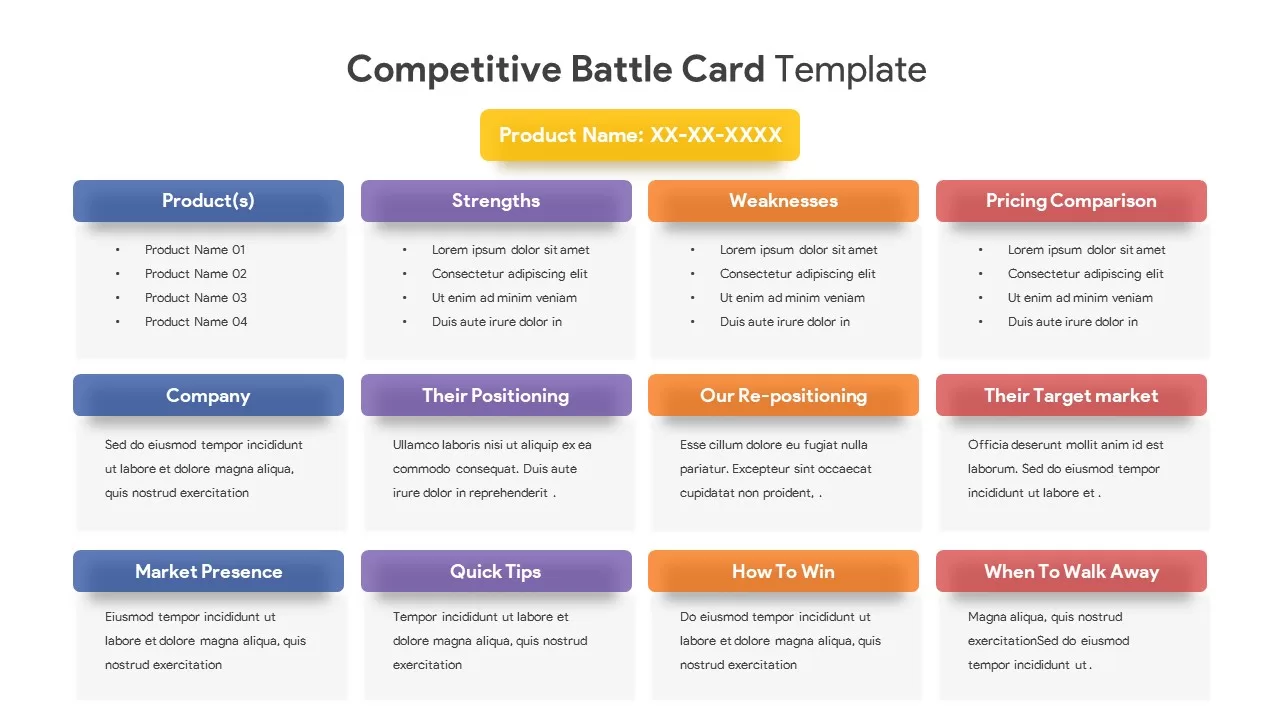
Competitive Battle Card Template
Competitor Analysis
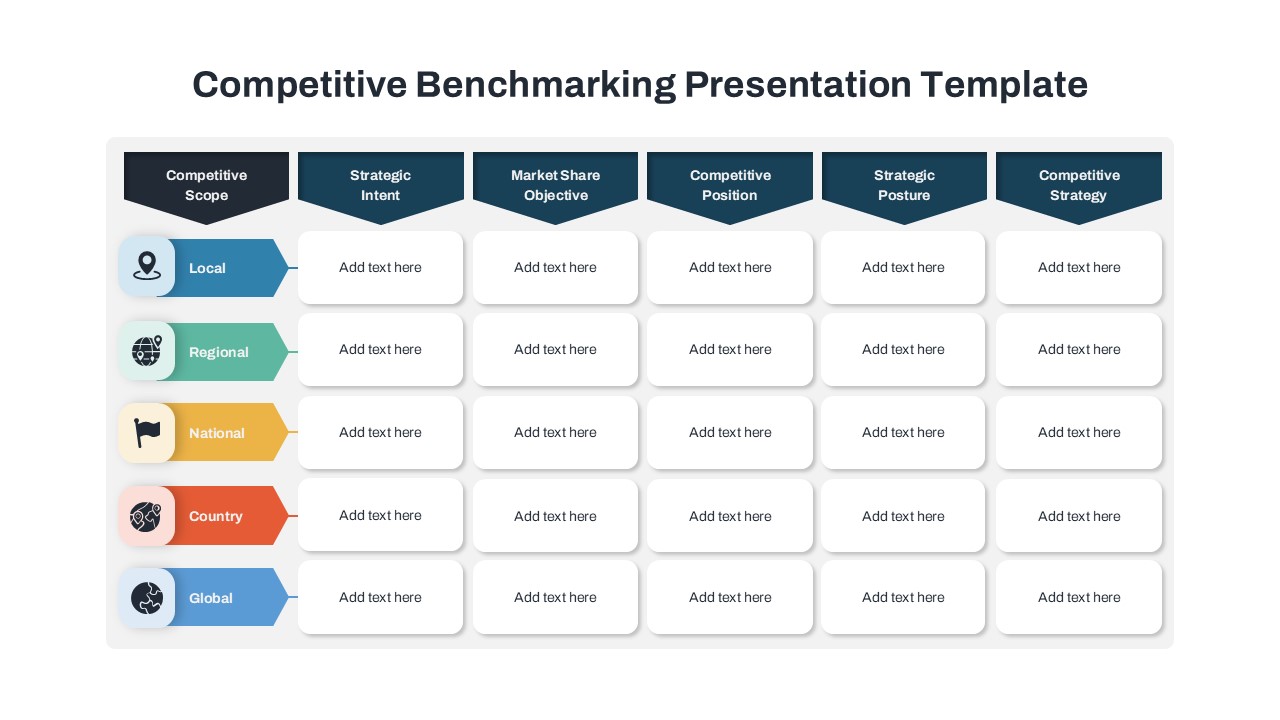
Competitive Benchmarking Template for PowerPoint & Google Slides
Comparison
Competitive Intelligence Circular Diagram for PowerPoint & Google Slides
Circular
Competitive Landscape Slide
Comparison
Skills Gap Analysis Comparison Chart Template for PowerPoint & Google Slides
Gap
Product Comparison PowerPoint Template
Comparison
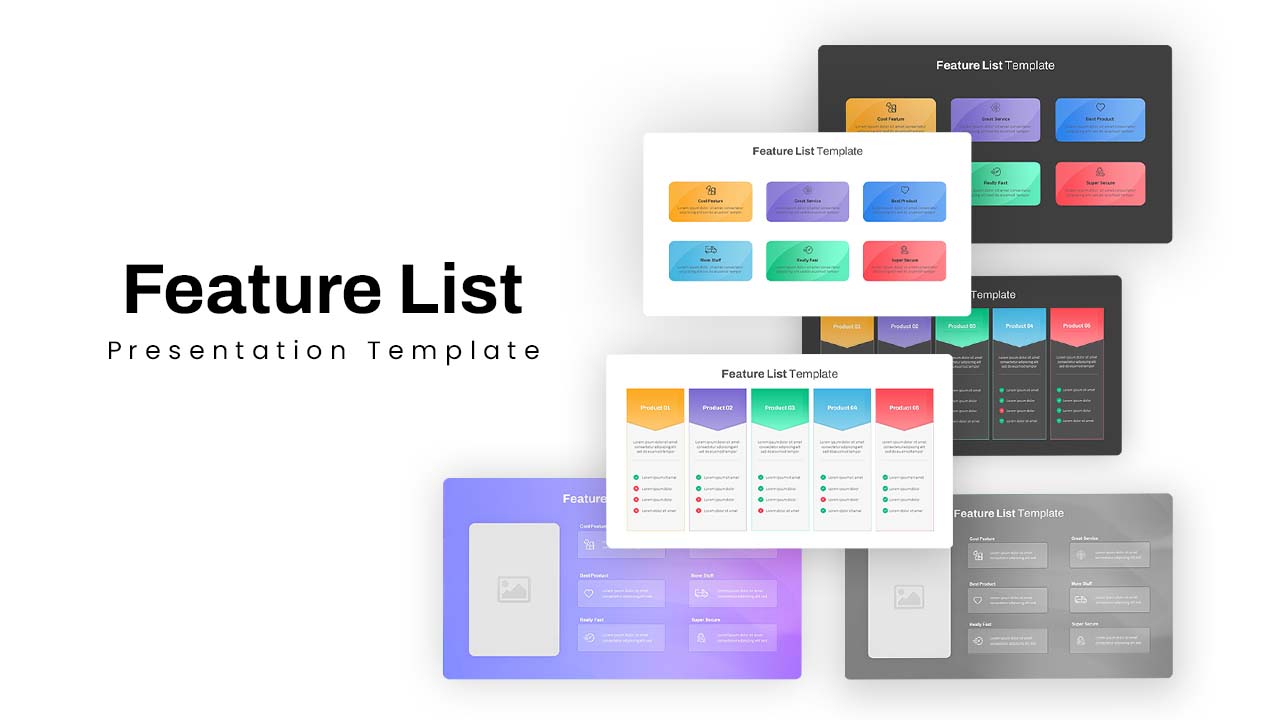
Feature List Template PPT & Product Comparison Slides
Decks
Product Feature Comparison Table Template for PowerPoint & Google Slides
Comparison Chart
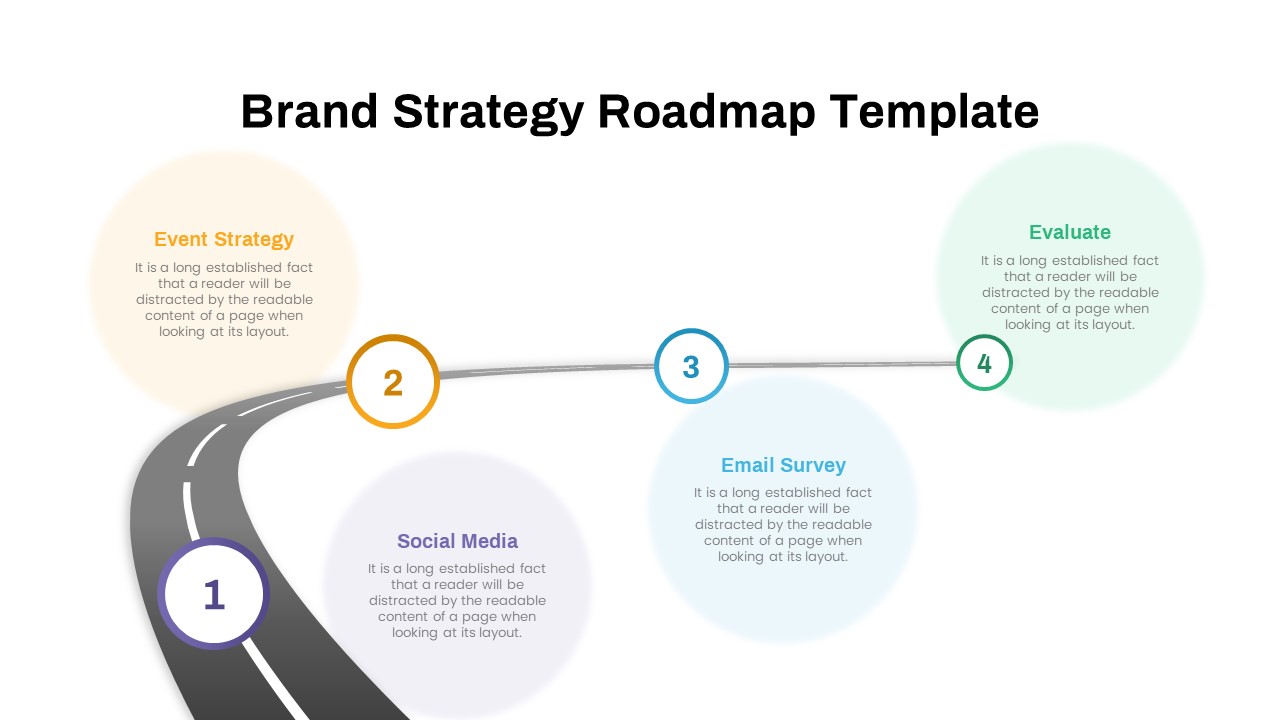
Brand Strategy Roadmap Diagram Template for PowerPoint & Google Slides
Roadmap
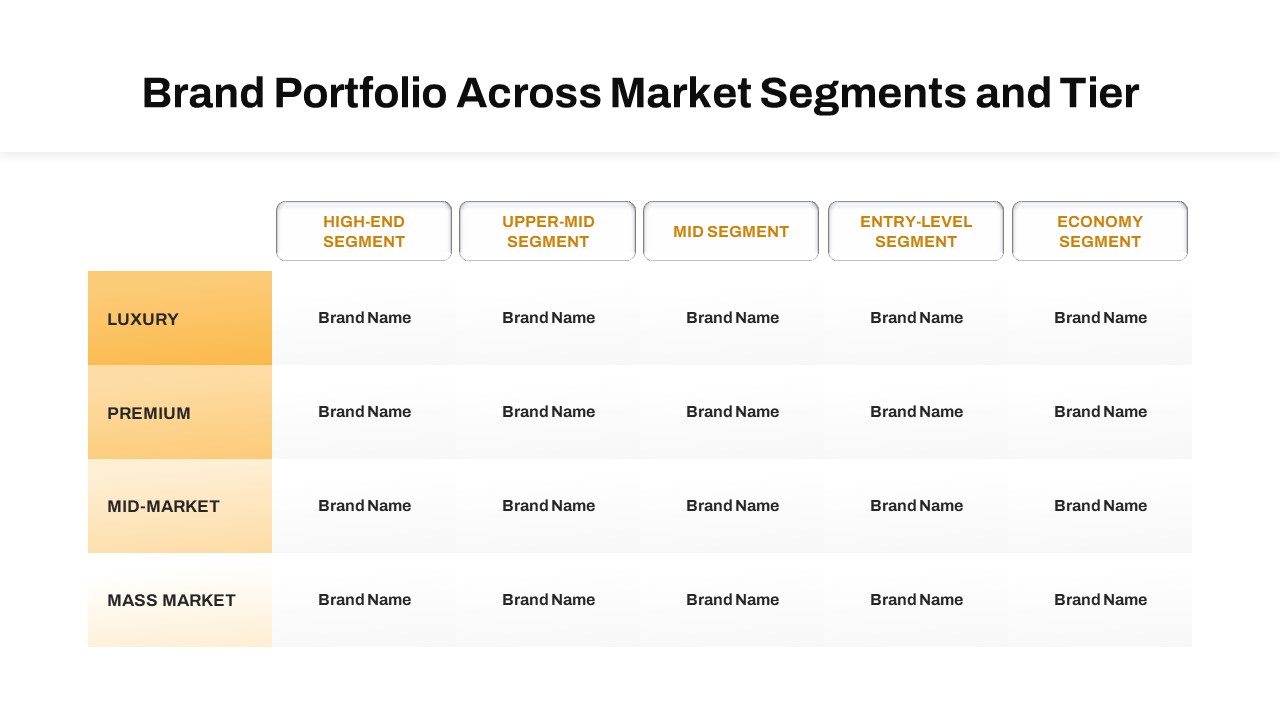
Brand Portfolio Market Segments PowerPoint Template
Business Report
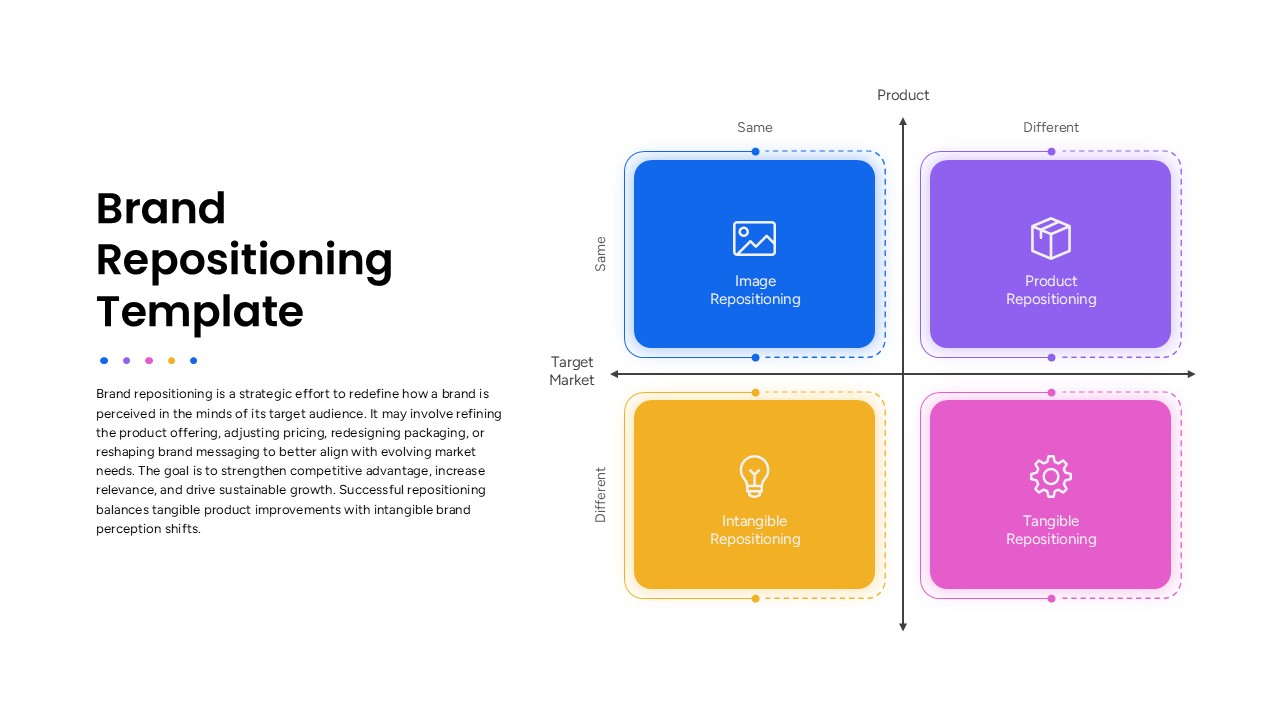
Brand Repositioning Strategy Quadrant Presentation Template
Business Strategy