


Charts Presentation Templates for PowerPoint and Google Slides
Present data with confidence and clarity using our Charts Presentation Templates for PowerPoint and Google Slides. These templates are ideal for visualizing performance metrics, survey results, trends, comparisons, and analytical insights. From pie charts and bar graphs to line charts and scatter plots, this category offers a variety of chart types to make your presentation more data-driven and visually compelling.
Fully editable and compatible with Microsoft PowerPoint (PPT) and Google Slides, these templates are perfect for professionals, educators, marketers, analysts, and anyone who needs to present data in a clean and engaging format.
![]() Filter
Filter
Filter
-

Virtualization Architecture Comparison Template for PowerPoint & Google Slides
Comparison Chart
Premium
-

Free Jeopardy Tournament of Champions Board Template for PowerPoint & Google Slides
Comparison Chart
Free
-
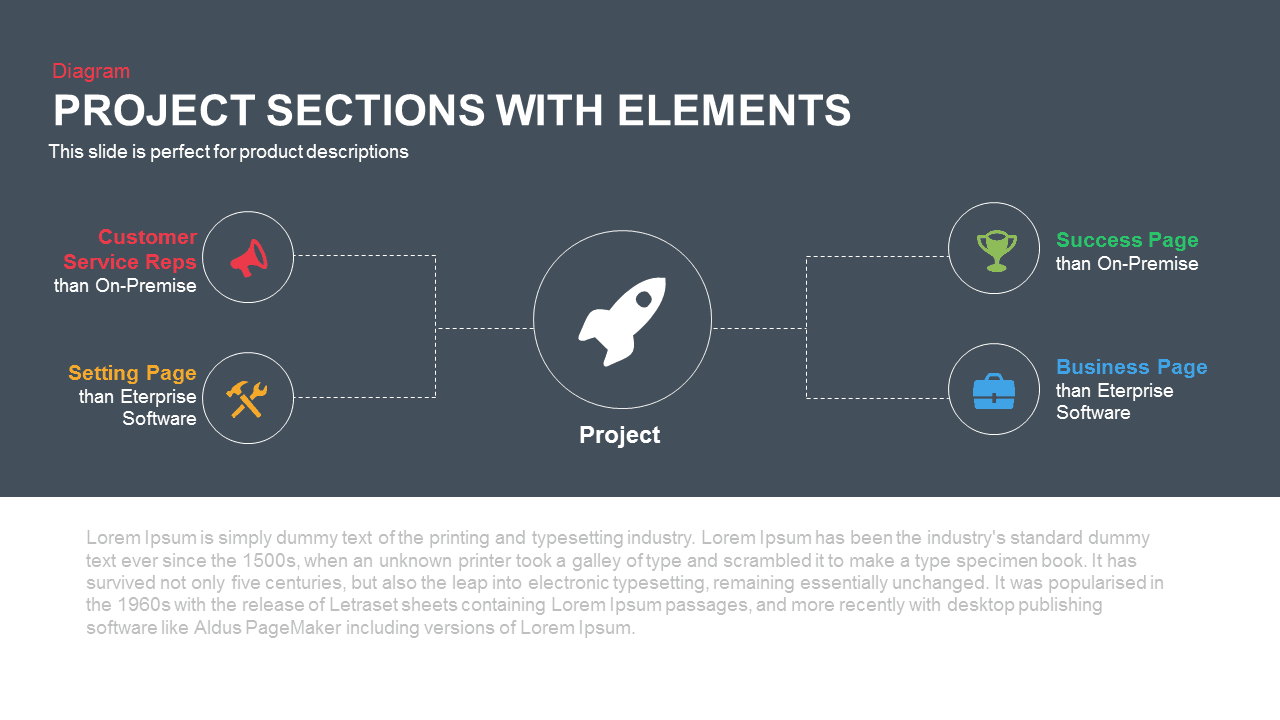
Project Sections Hub-and-Spoke Diagram template for PowerPoint & Google Slides
Flow Charts
Premium
-

Donut Chart Split Template for PowerPoint & Google Slides
Charts
Premium
-
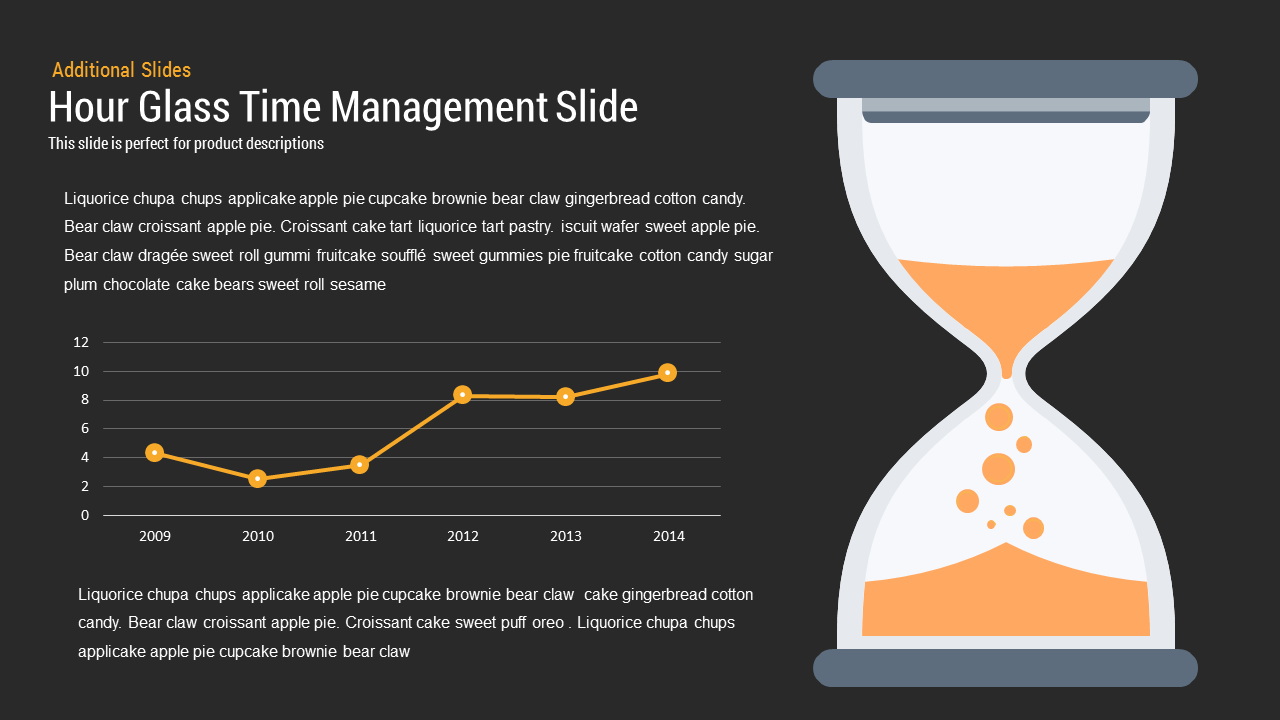
Hourglass Time Mgmt template for PowerPoint & Google Slides
Infographics
Premium
-

Smartphone Data User template for PowerPoint & Google Slides
Charts
Premium
-

Donut Chart template for PowerPoint & Google Slides
Pie/Donut
Premium
-
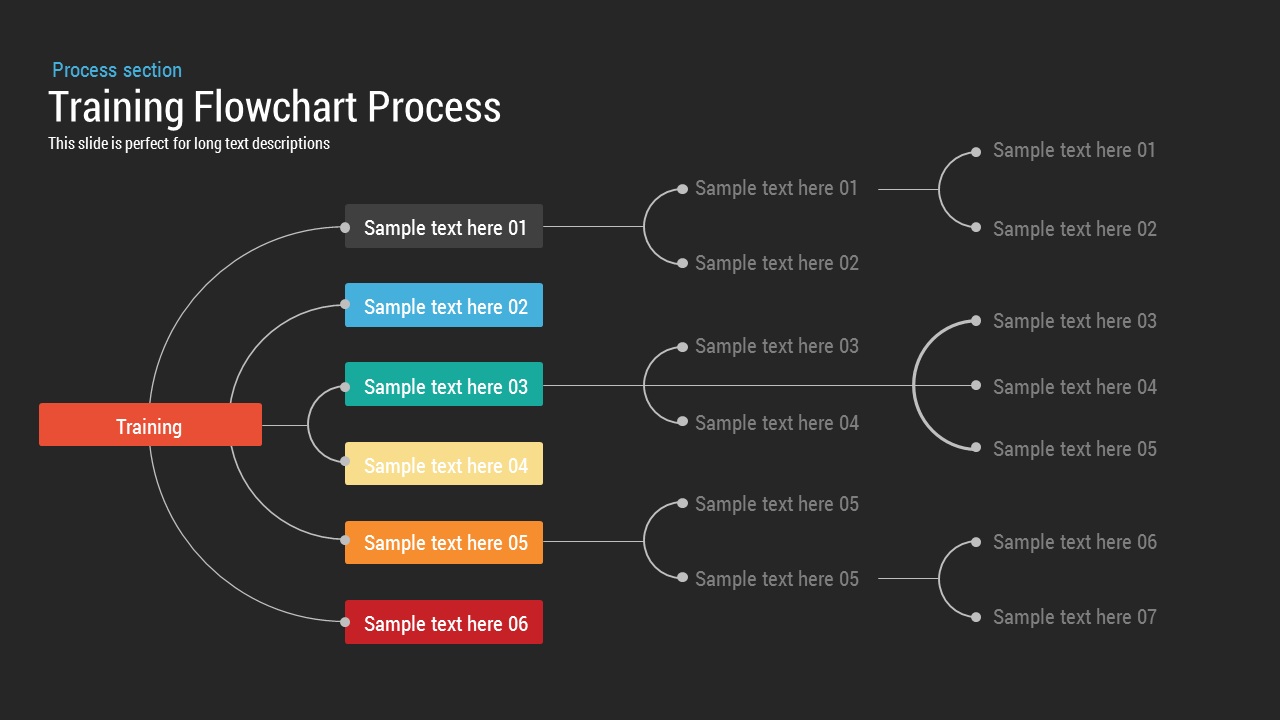
Training Flowchart template for PowerPoint & Google Slides
Flow Charts
Premium
-
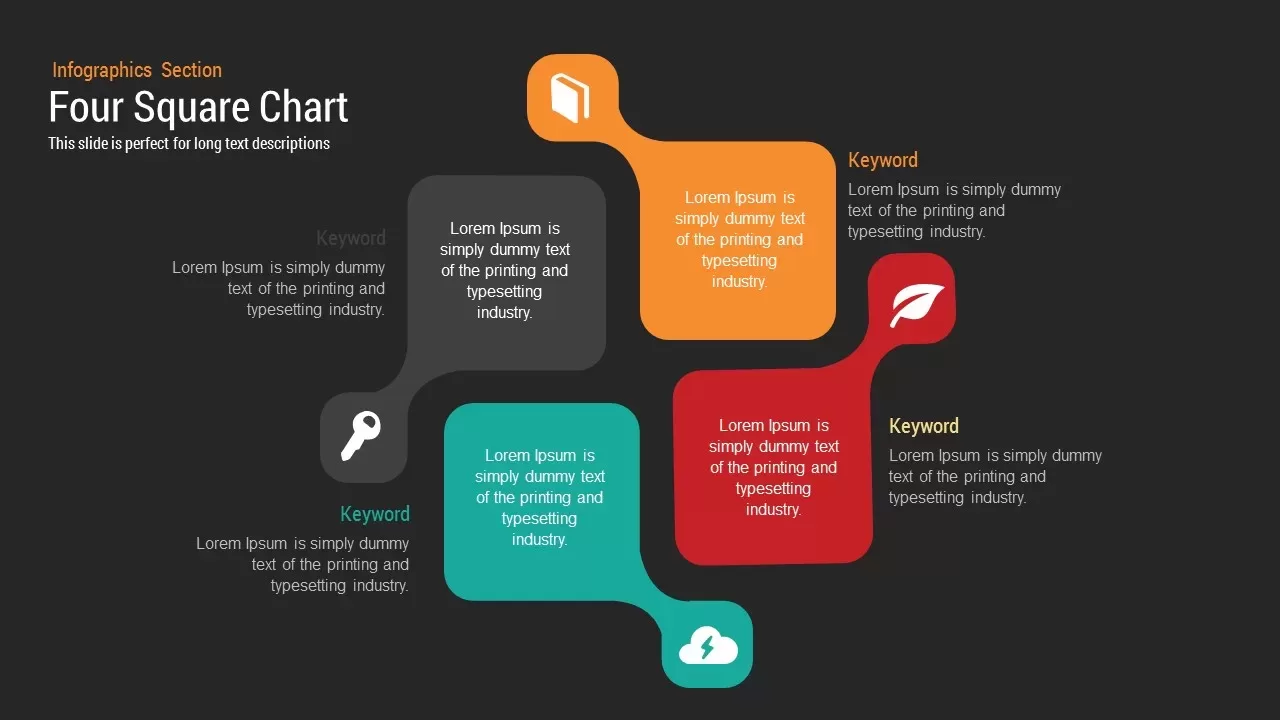
Four Square Chart template for PowerPoint & Google Slides
Charts
Premium