Charts Presentation Templates for PowerPoint and Google Slides
Present data with confidence and clarity using our Charts Presentation Templates for PowerPoint and Google Slides. These templates are ideal for visualizing performance metrics, survey results, trends, comparisons, and analytical insights. From pie charts and bar graphs to line charts and scatter plots, this category offers a variety of chart types to make your presentation more data-driven and visually compelling.
Fully editable and compatible with Microsoft PowerPoint (PPT) and Google Slides, these templates are perfect for professionals, educators, marketers, analysts, and anyone who needs to present data in a clean and engaging format.
![]() Filter
Filter
Filter
-
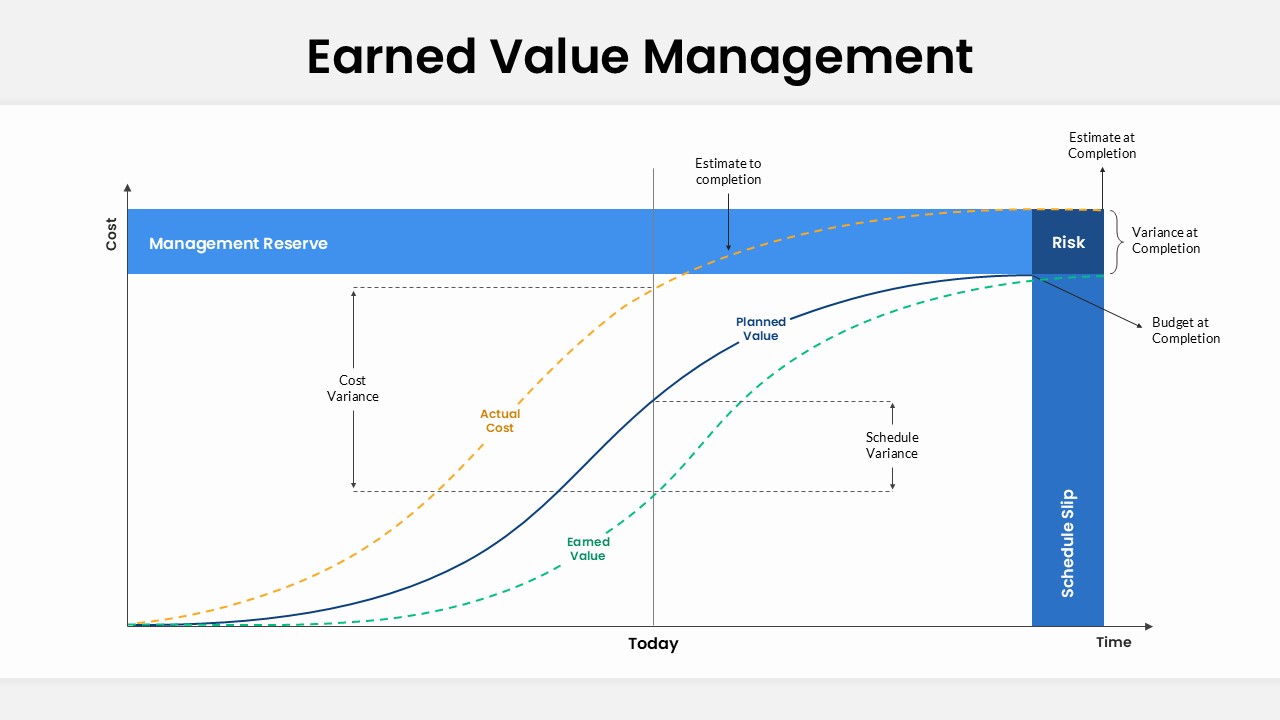
Earned Value Management (EVM) Slide Template for PowerPoint & Google Slides
Charts
Premium
-
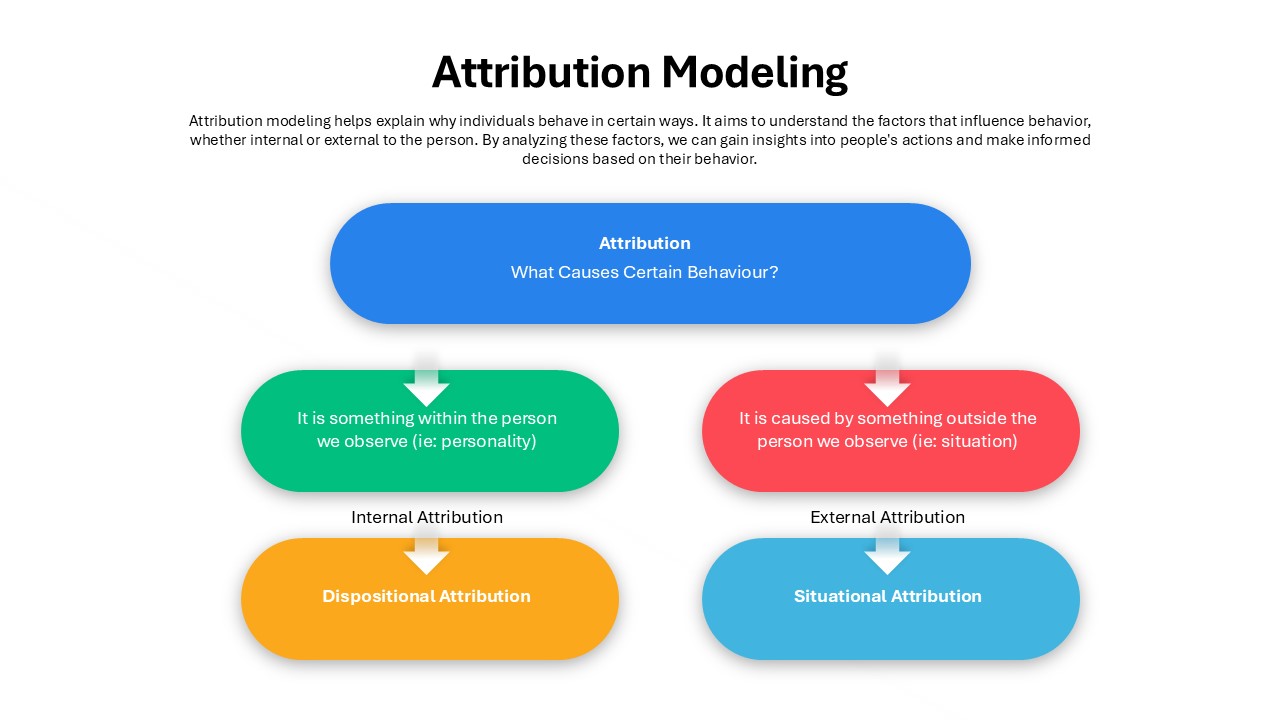
Attribution Modeling Flow Chart Template for PowerPoint & Google Slides
Flow Charts
Premium
-
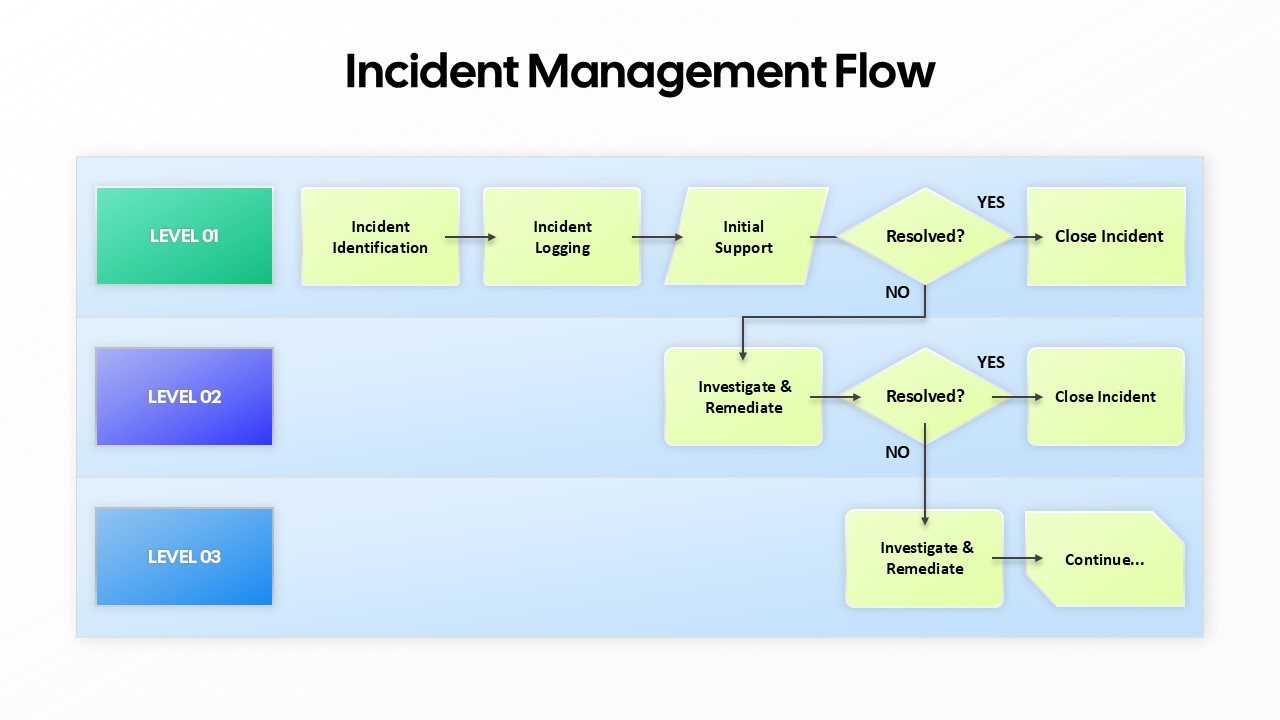
Incident Management Flow Process template for PowerPoint & Google Slides
Flow Charts
Premium
-

Feasibility Matrix Comparison Chart Template for PowerPoint & Google Slides
Comparison Chart
Premium
-
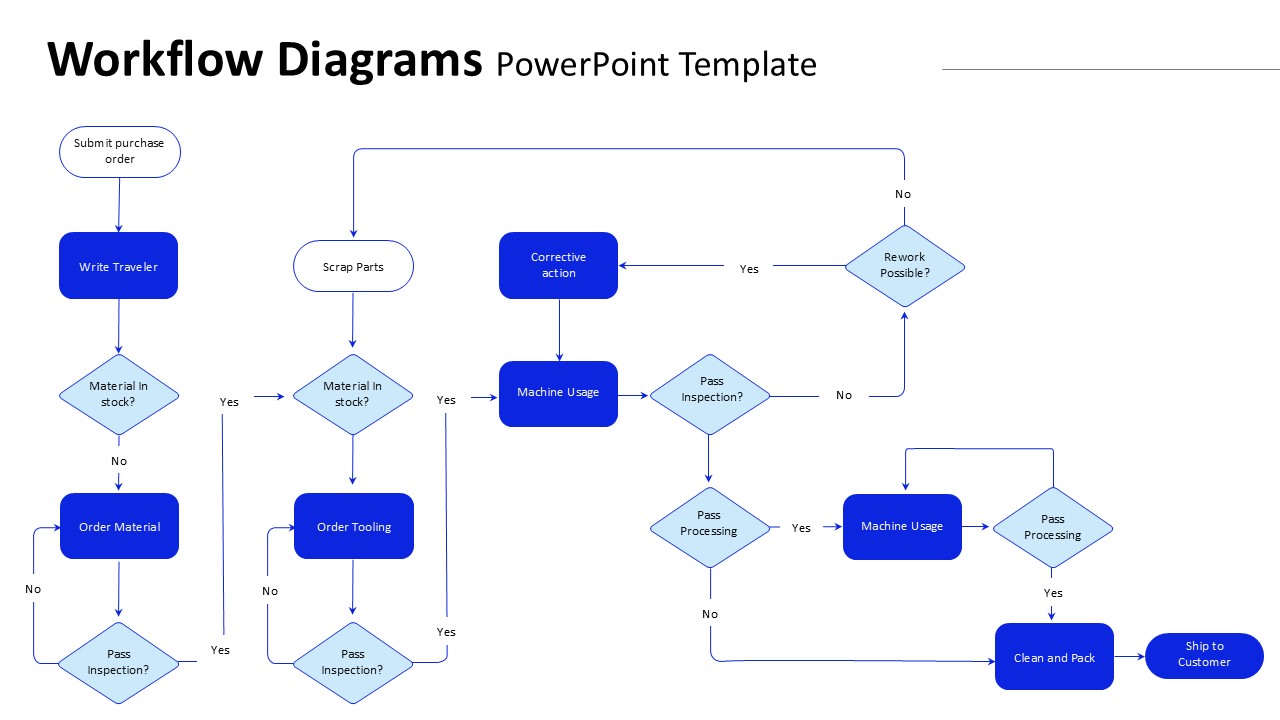
Manufacturing Workflow Diagram Template for PowerPoint & Google Slides
Flow Charts
Premium
-
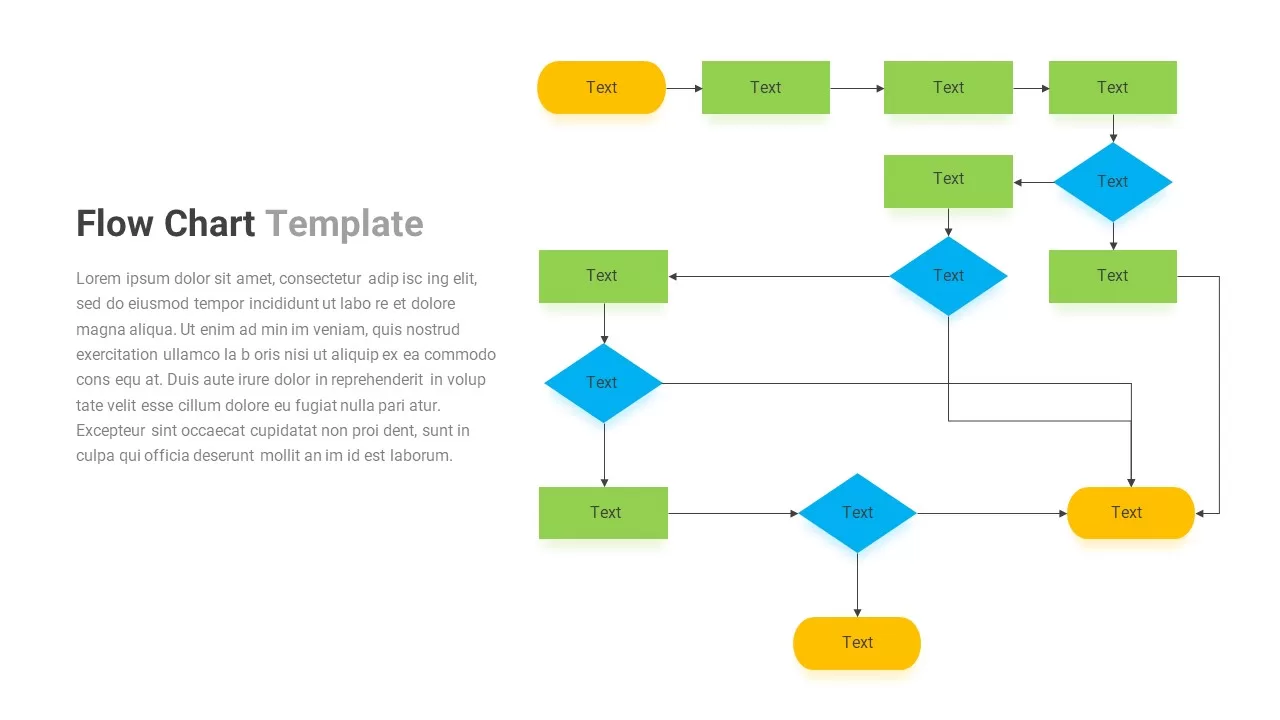
Flow Chart template for PowerPoint & Google Slides
Flow Charts
Premium
-
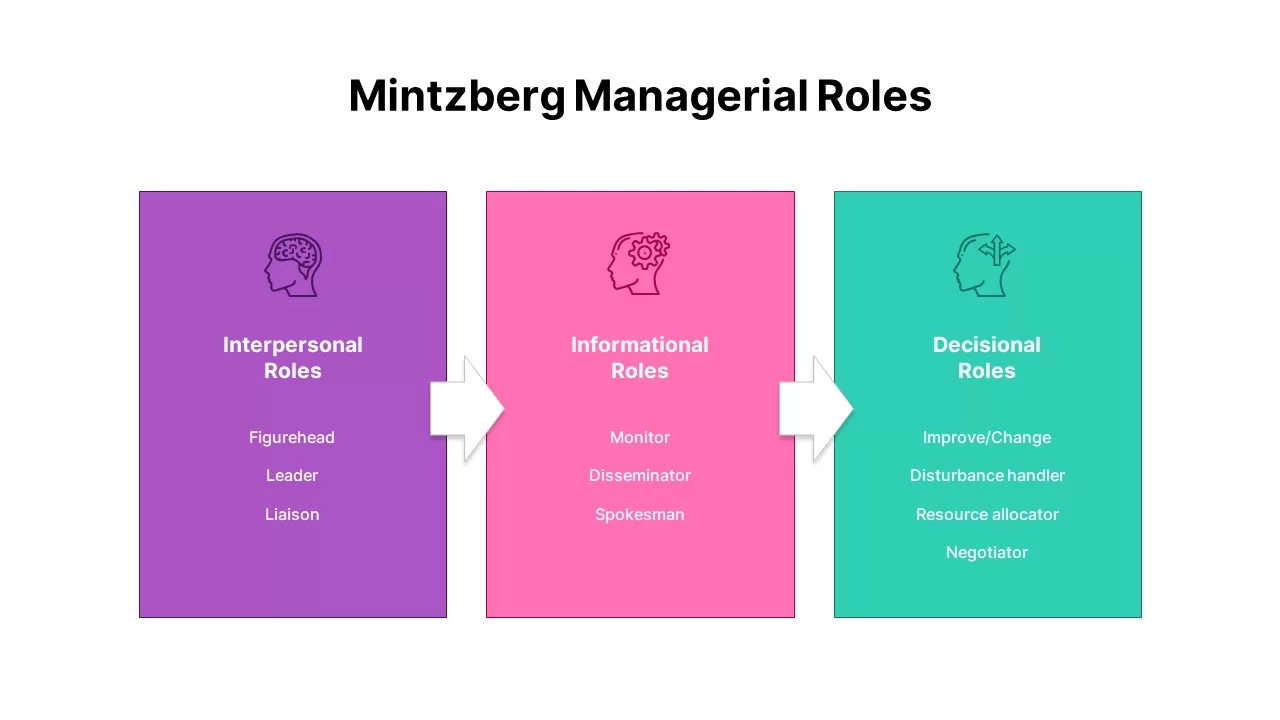
Mintzberg Managerial Roles Infographic Template for PowerPoint & Google Slides
Comparison Chart
Premium
-
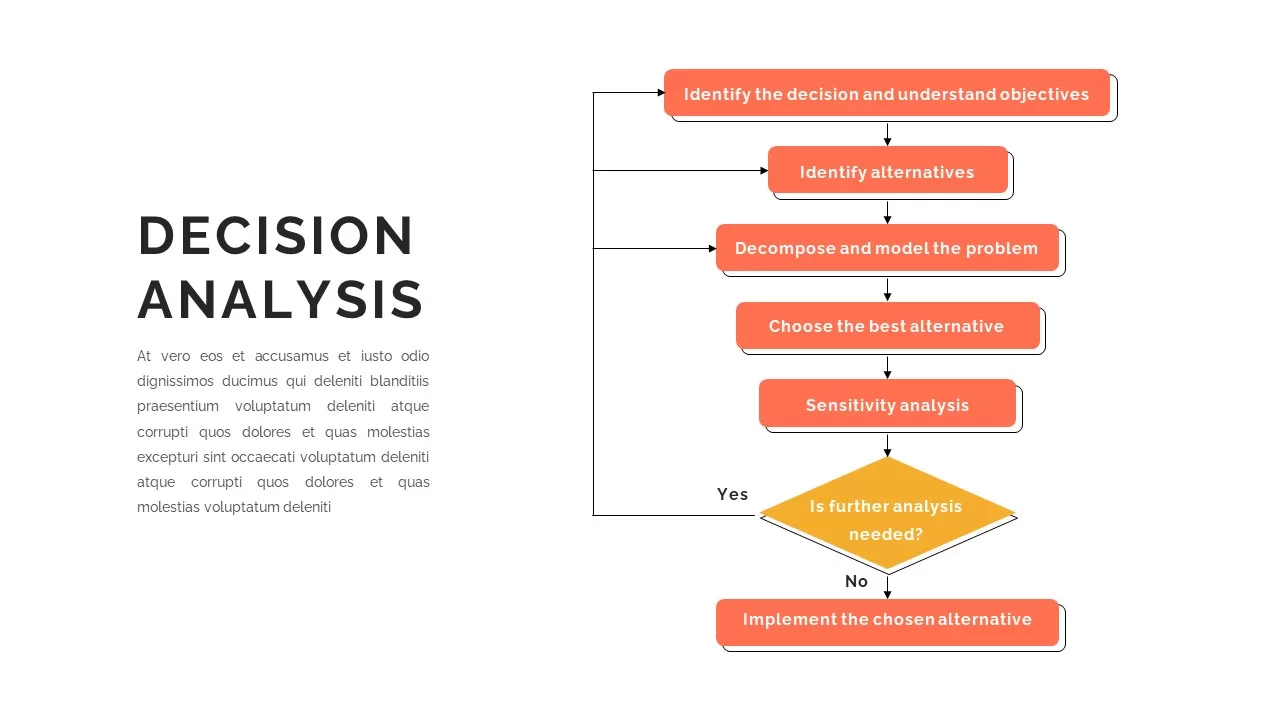
Decision Analysis Process Flowchart Template for PowerPoint & Google Slides
Flow Charts
Premium
-
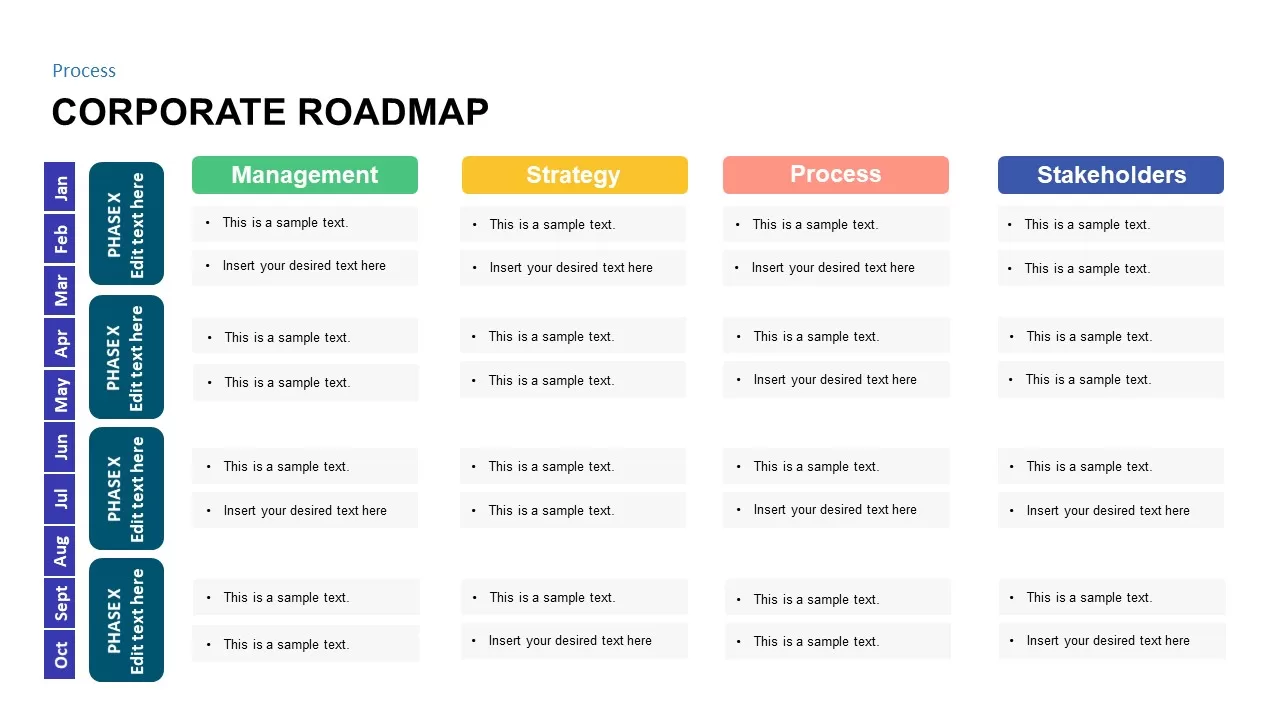
Corporate Roadmap Process Template for PowerPoint & Google Slides
Roadmap
Premium
-

Risk Management Heat Map Diagram Template for PowerPoint & Google Slides
Comparison Chart
Premium
-

Weekly Data Chart Slide for PowerPoint & Google Slides
Comparison Chart
Premium
-
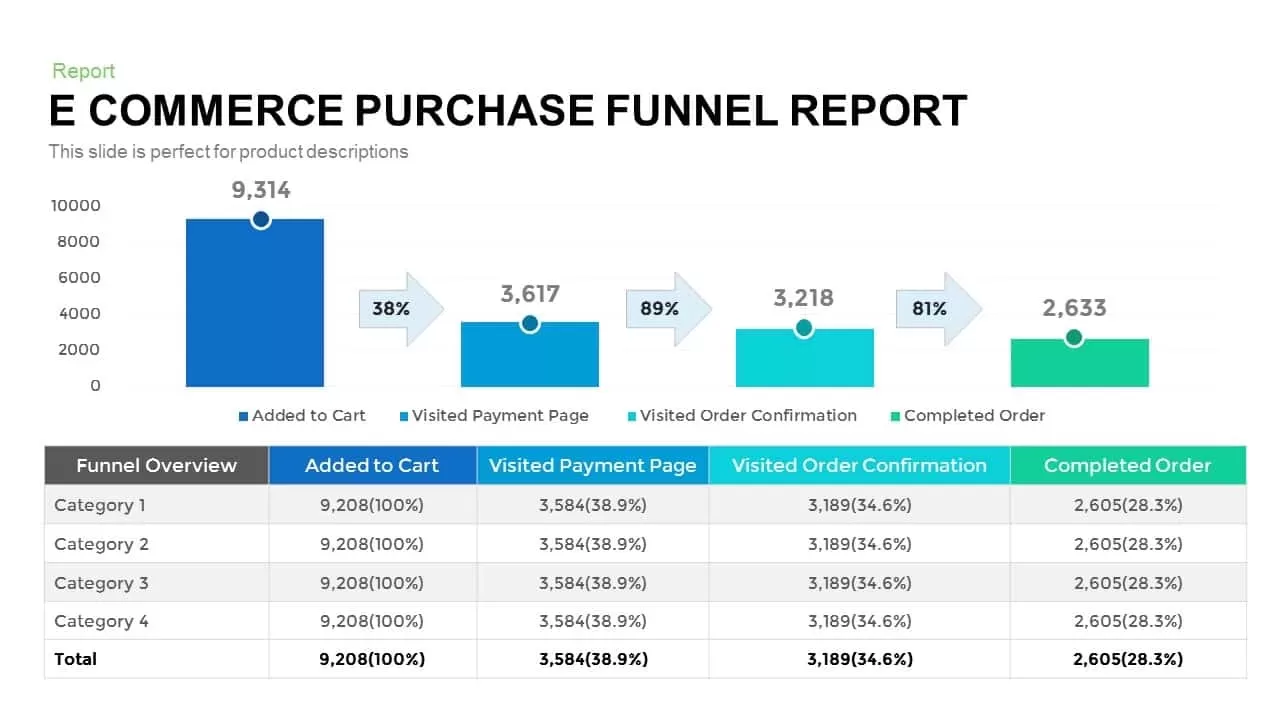
E-commerce Purchase Funnel Report template for PowerPoint & Google Slides
Funnel
Premium