


Charts Presentation Templates for PowerPoint and Google Slides
Present data with confidence and clarity using our Charts Presentation Templates for PowerPoint and Google Slides. These templates are ideal for visualizing performance metrics, survey results, trends, comparisons, and analytical insights. From pie charts and bar graphs to line charts and scatter plots, this category offers a variety of chart types to make your presentation more data-driven and visually compelling.
Fully editable and compatible with Microsoft PowerPoint (PPT) and Google Slides, these templates are perfect for professionals, educators, marketers, analysts, and anyone who needs to present data in a clean and engaging format.
![]() Filter
Filter
Filter
-
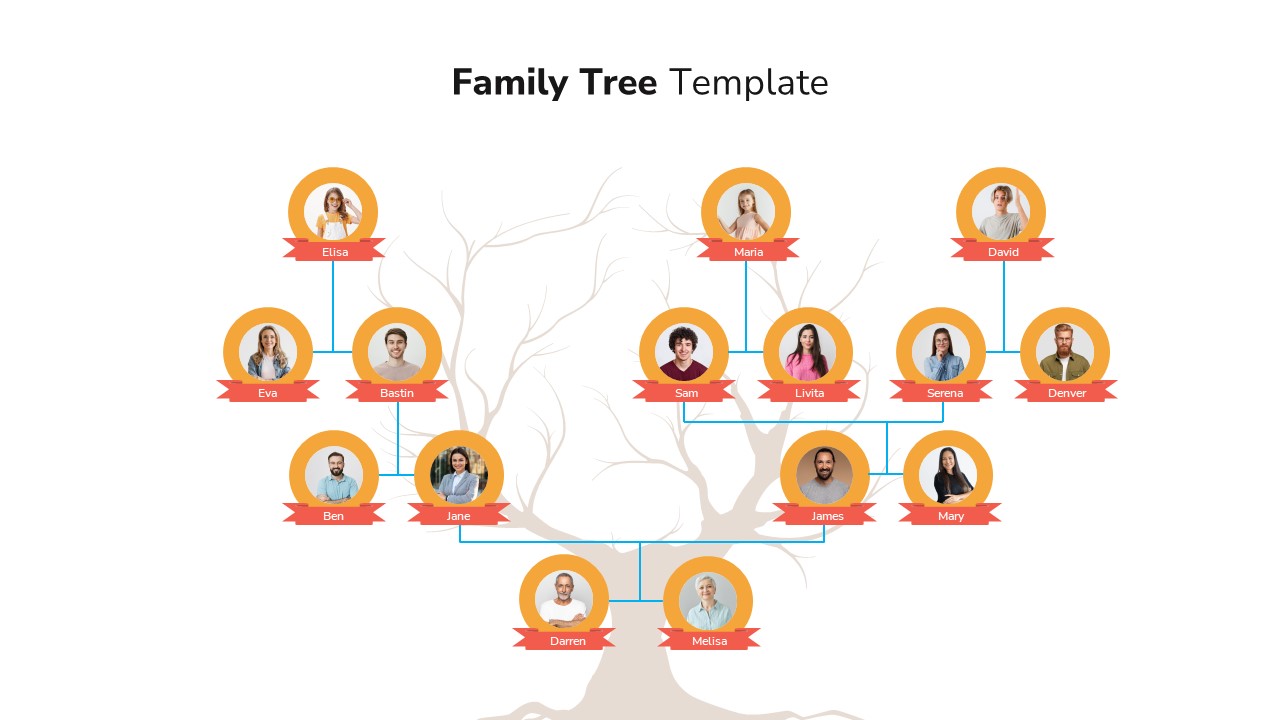
Classic Family Tree Diagram Layout Template for PowerPoint & Google Slides
Infographics
Premium
-

Agriculture Infographics Slide with Progress Rings & Metrics Template for PowerPoint & Google Slides
Pie/Donut
Premium
-
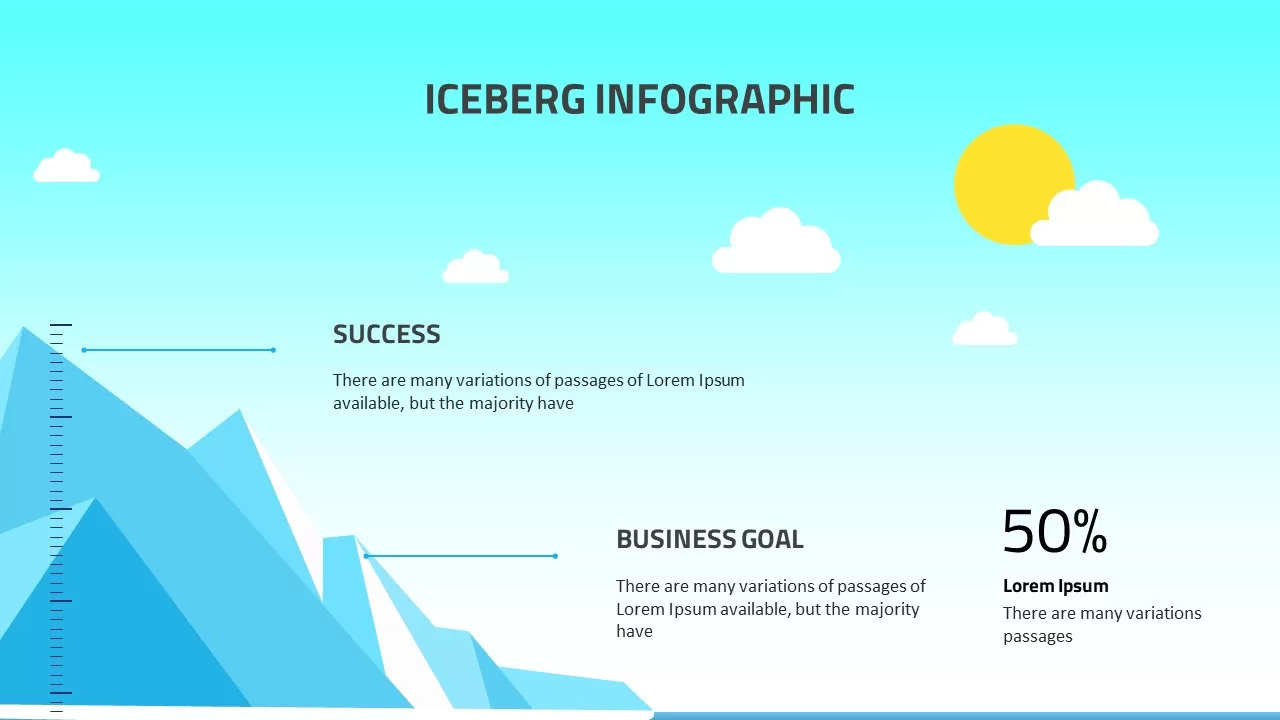
Iceberg Infographic for PowerPoint & Google Slides
Iceberg Charts
Premium
-
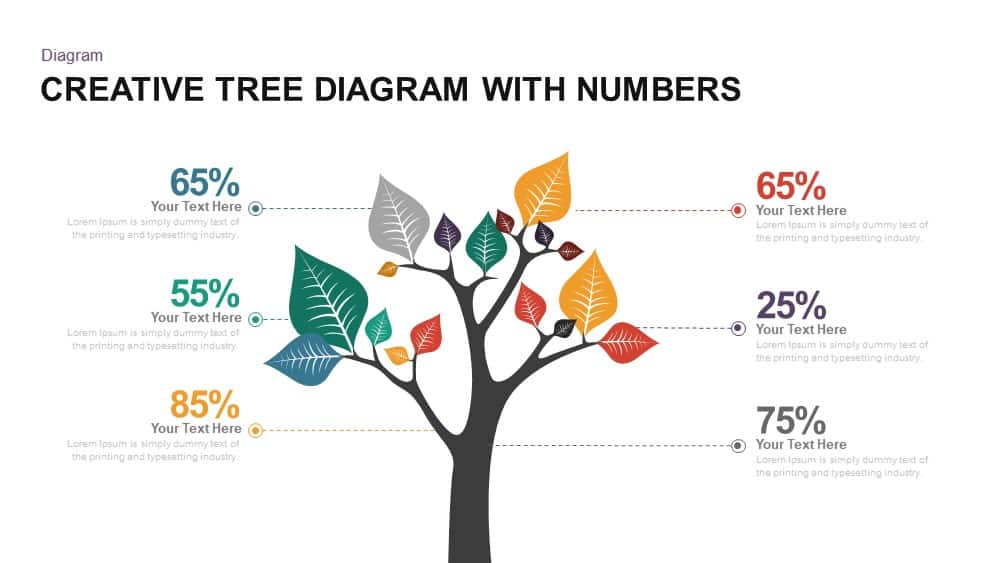
Creative Tree Diagram with Percentages Template for PowerPoint & Google Slides
Decision Tree
Premium
-
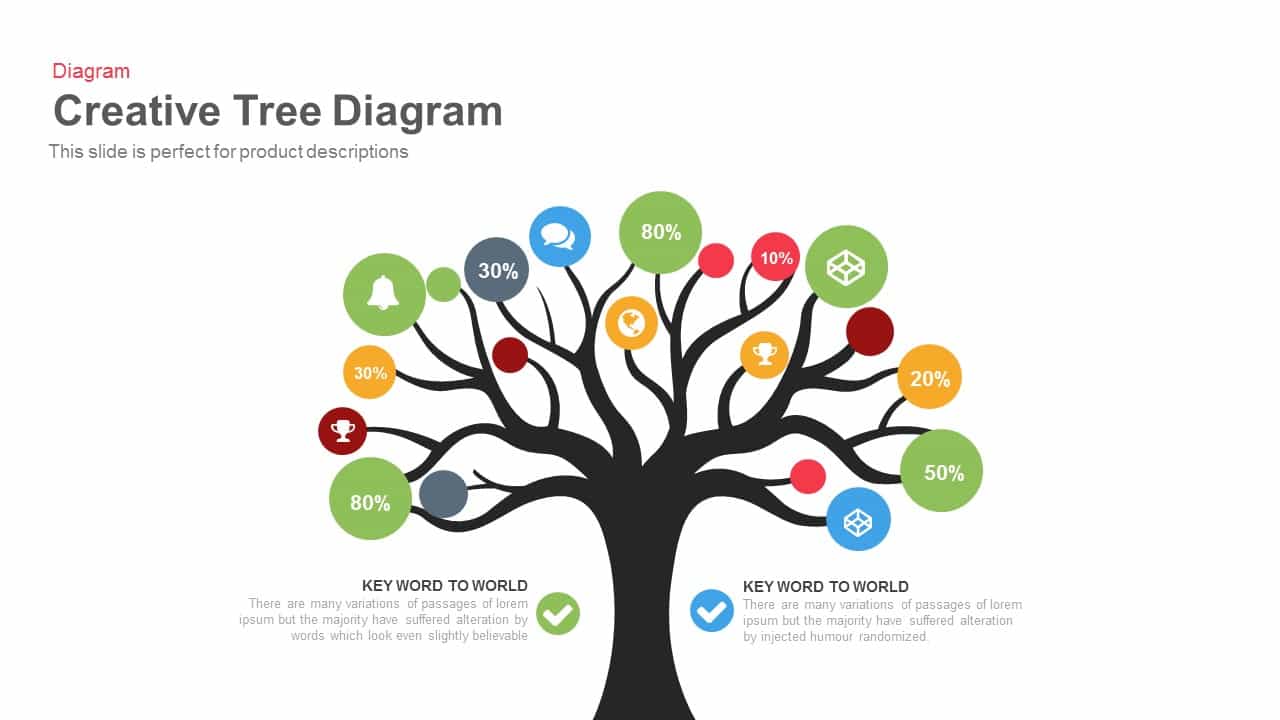
Engaging Creative Tree Diagram Slide Template for PowerPoint & Google Slides
Flow Charts
Premium
-

Five 3D Growth Arrow Infographic Slide Template for PowerPoint & Google Slides
Arrow
Premium
-

Creative Bar Chart template for PowerPoint & Google Slides
Charts
Premium
-
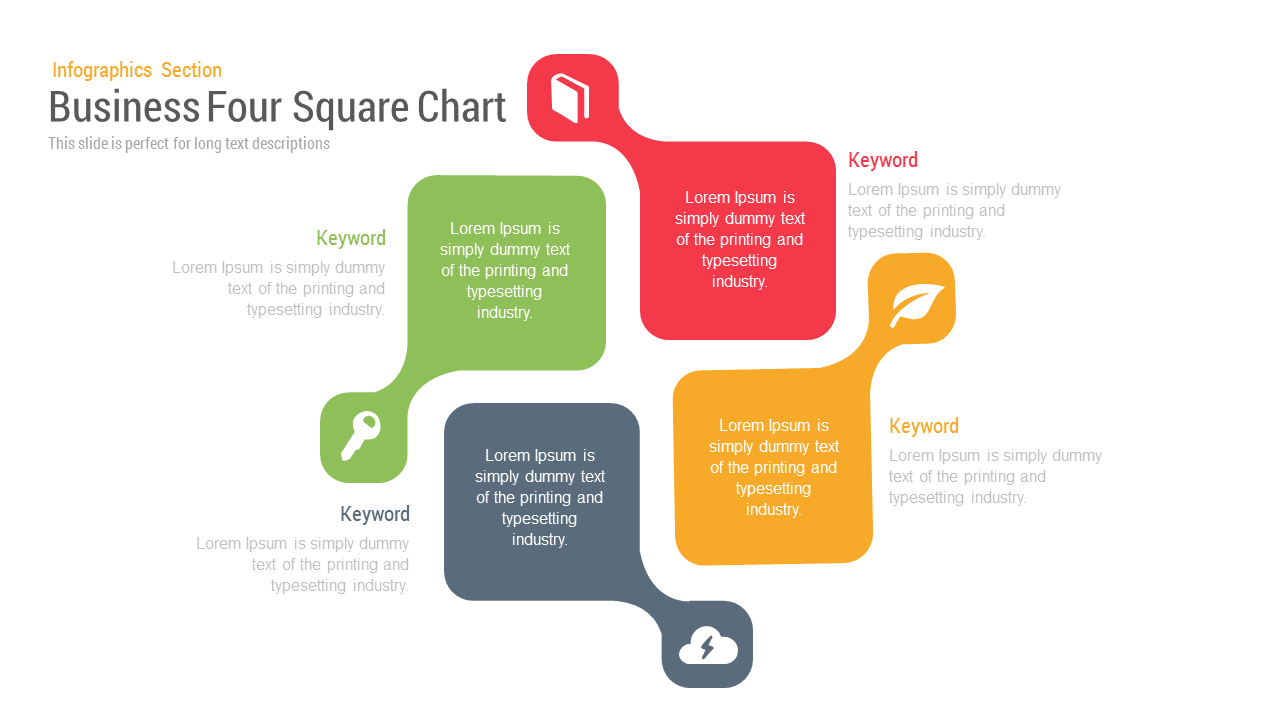
Business Four Square Chart template for PowerPoint & Google Slides
Business
Premium
-
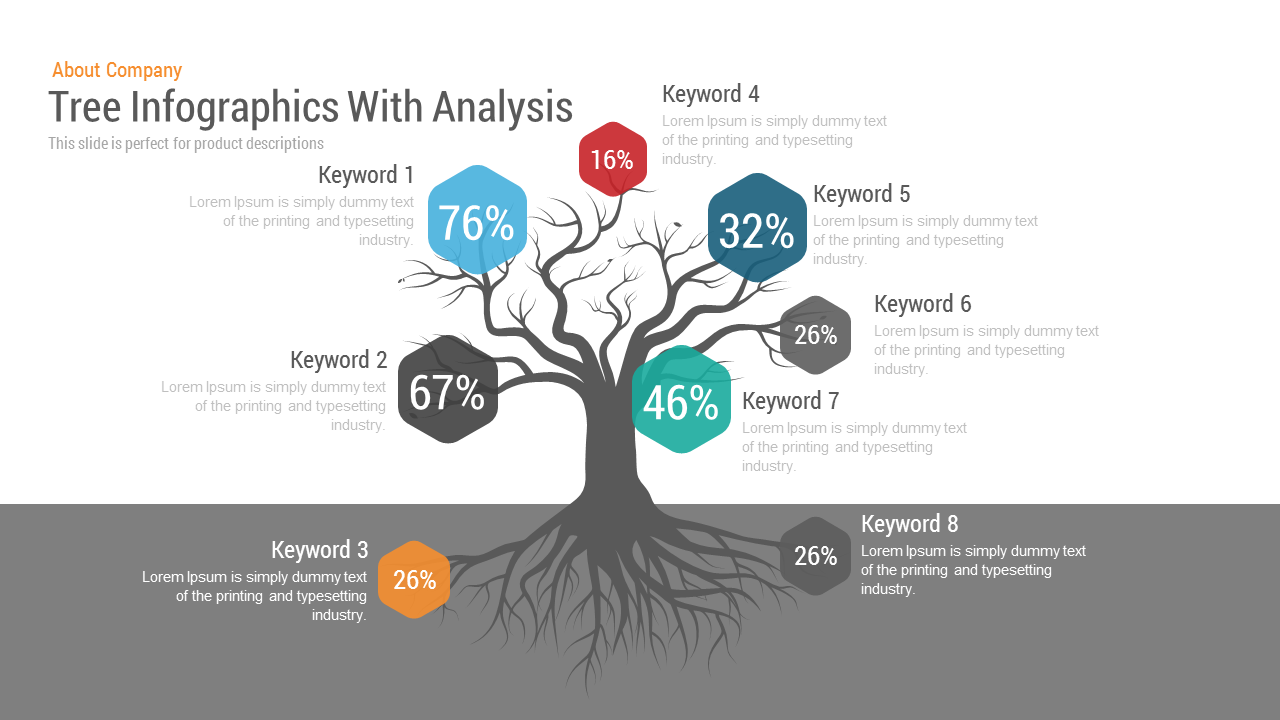
Tree Infographics template for PowerPoint & Google Slides
Decision Tree
Premium
-
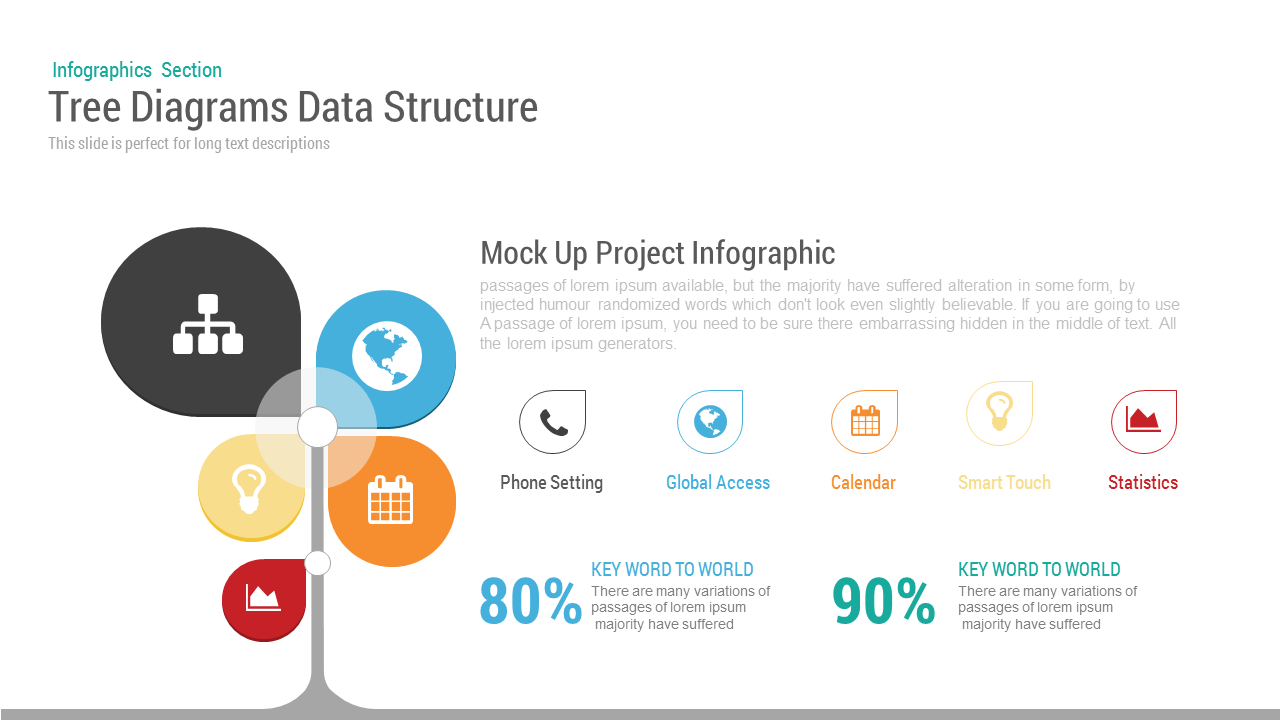
Tree Diagram template for PowerPoint & Google Slides
Decision Tree
Premium