Wastewater Treatment Process Flow Chart Template for PowerPoint & Google Slides


Water Treatment Process Flow Chart Slide Template for PowerPoint
Process diagrams are one of those things that either make complete sense to your audience or completely lose them. There is no in-between. When you are presenting something as technically layered as a wastewater treatment cycle, the way you visualize it matters just as much as the accuracy of the information itself. A poorly laid out flow chart forces your audience to work too hard just to follow the sequence, and by the time they figure out what connects to what, they have already missed the point you were trying to make.
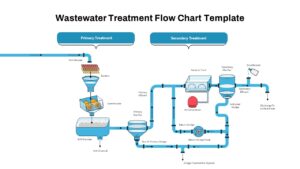
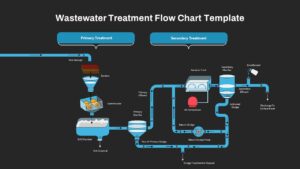
This water treatment process flow chart slide template for PowerPoint takes care of that problem with a clear, detailed diagram that maps the full wastewater management cycle from raw sewage entry to final discharge, covering both primary and secondary treatment stages in a single, well-organized slide.
The flow starts with raw sewage entering the system and moving through screens and a comminutor for debris removal. From there it progresses into a grit chamber where solids settle out for disposal. The liquid fraction then advances into the primary clarifier, producing primary effluent and primary sludge, with the sludge routed separately for treatment and disposal. The effluent continues into an aeration tank powered by an air compressor to promote microbial digestion, followed by a secondary clarifier that separates activated sludge for return via a dedicated pump. The clarified water then receives a disinfectant dose before discharge to surface water, completing the treatment cycle.
Every stage is labeled clearly. Every connection is shown with directional arrows that make the sequence easy to follow even for an audience that is not deeply familiar with the technical details. That kind of clarity is what makes a process diagram actually useful in a presentation rather than just decorative.
A Fully Editable Water Treatment Flow Chart for PowerPoint and Google Slides
The template is built on master slides for both PowerPoint and Google Slides, with fully editable vector shapes, text labels, and connector arrows throughout. You can change component colors, swap icons for custom process steps, or adjust line widths to match your organization’s branding without touching the underlying structure of the diagram. Grouped elements and alignment guides keep the spacing consistent when you need to rearrange steps or extend the flow to include tertiary treatment stages.
High-resolution graphics render crisply on widescreens, projectors, and printed whitepapers, which matters when you are presenting to a mixed audience of engineers, executives, and regulators who may all be viewing the diagram in different formats. The single-slide format also makes it easy to pull into existing decks, technical reports, or training materials without having to rebuild the layout from scratch every time you need it.
Who Is It For
Utility managers, environmental engineers, and facility operators will get the most immediate use out of this slide when presenting treatment plant designs, operational reports, or compliance briefings to technical and non-technical stakeholders alike. Training coordinators can also use it as a visual anchor for new-staff onboarding sessions and safety workshops, where having a clear and accurate process diagram on screen can save a lot of back-and-forth explanation.
Other Uses
The flow chart structure is not limited to wastewater applications. Repurpose the diagram for chemical process workflows, manufacturing line overviews, or any multi-stage operational system that benefits from a clean, step-by-step visual representation. Relabel the components, adjust the color coding, and the underlying layout carries the logic of almost any linear process you need to present clearly and professionally.
Login to download this file

Item ID
SB03854
Related Templates

Dermatology Diagnosis and Treatment Slide for PowerPoint & Google Slides
Health
Animated Process Flow Chart Template for PowerPoint & Google Slides
Infographics
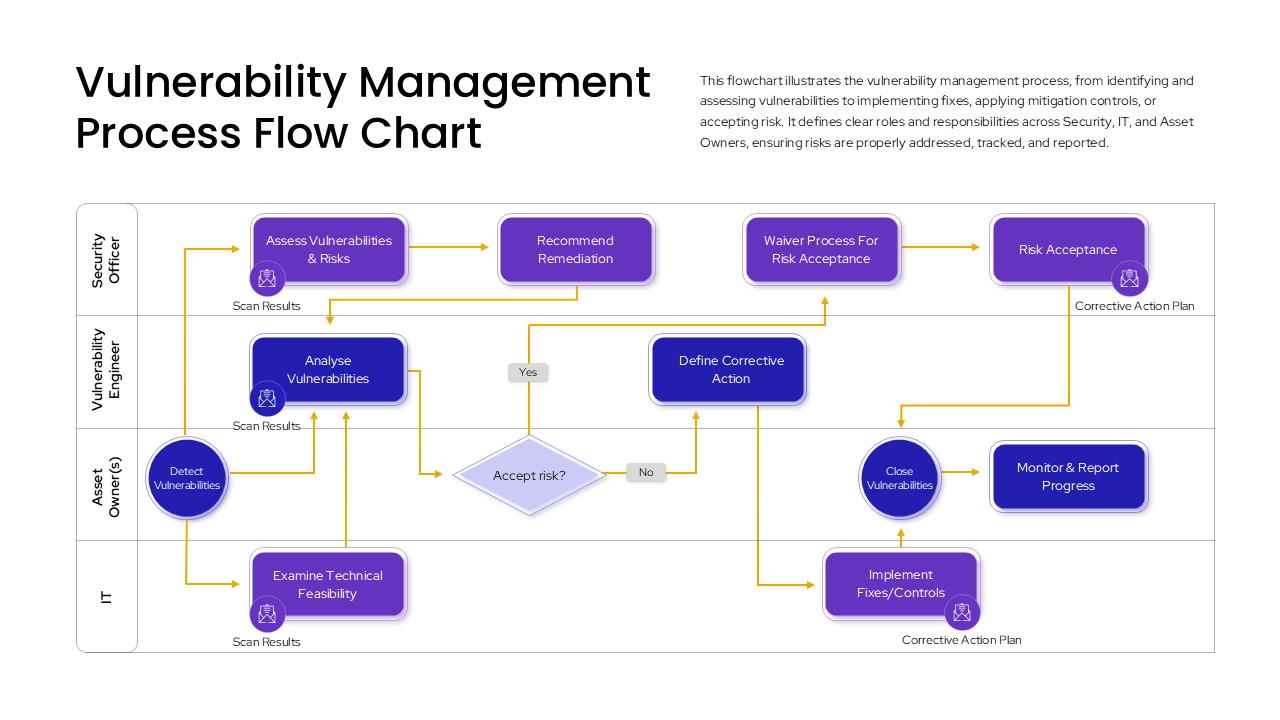
Vulnerability Management Process Flow Chart
Flow Charts
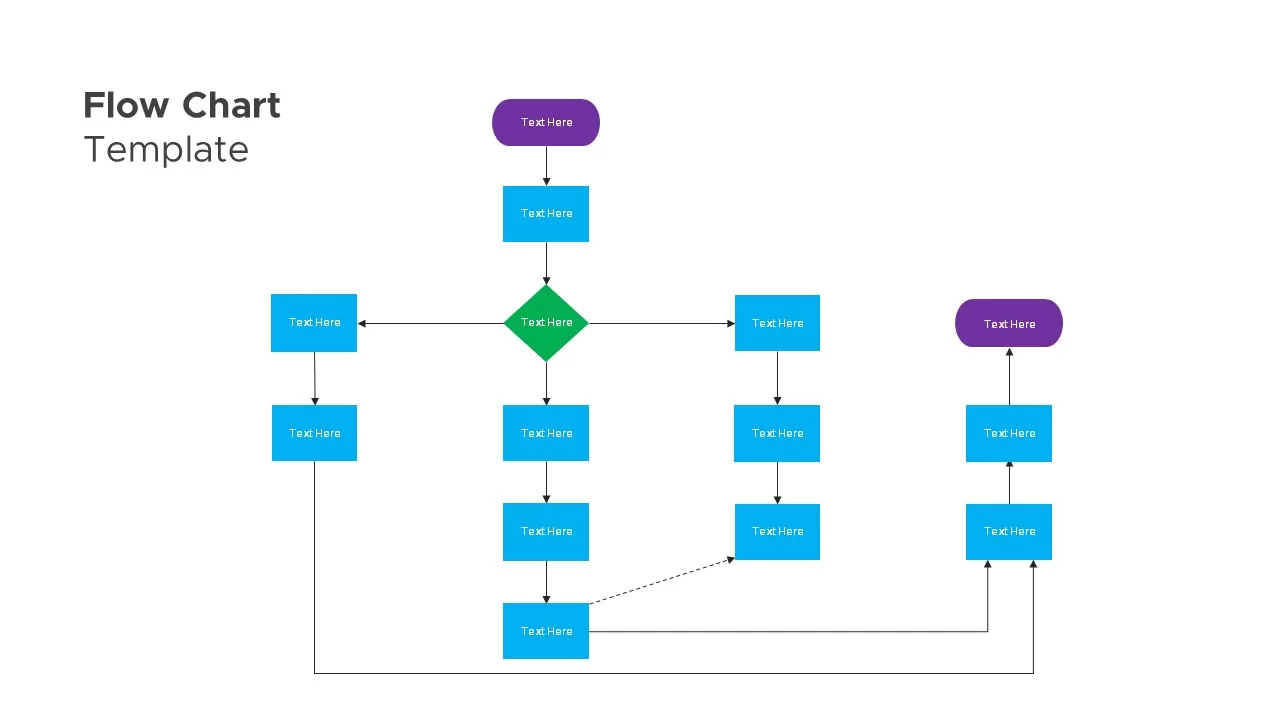
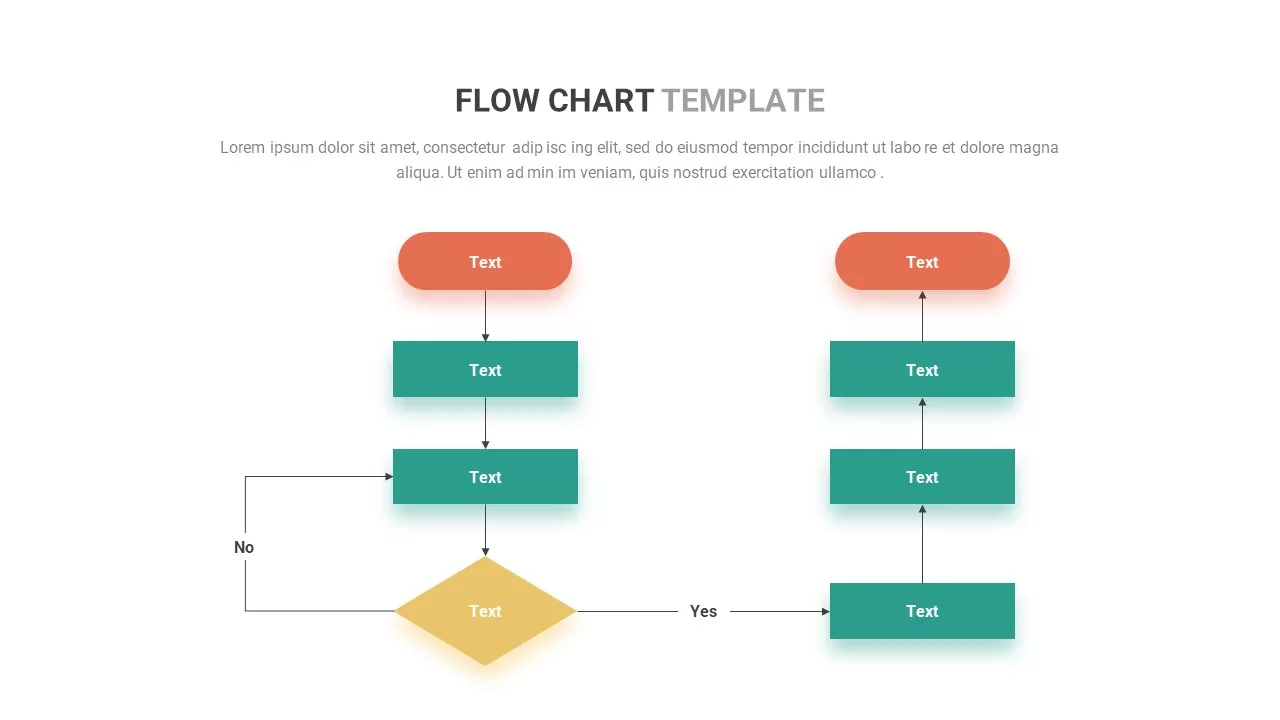
Flow Chart template for PowerPoint & Google Slides
Flow Charts
FlowChart PowerPoint Template
Flow Charts
Flow Chart Diagram Template for PowerPoint & Google Slides
Flow Charts
Flow Chart Diagram template for PowerPoint & Google Slides
Flow Charts
Flow Chart Infographics Template
Flow Charts
Flow Chart Template for PowerPoint & Google Slides
Flow Charts
Flow Chart Decision Tree Template for PowerPoint & Google Slides
Flow Charts
Flow Chart Template for PowerPoint & Google Slides
Flow Charts
Flow Chart template for PowerPoint & Google Slides
Flow Charts
Free Circular Multi-Step Flow Chart Diagram Template for PowerPoint & Google Slides
Flow Charts
Free
Cross Functional Swimlane Flow Chart Template for PowerPoint & Google Slides
Flow Charts
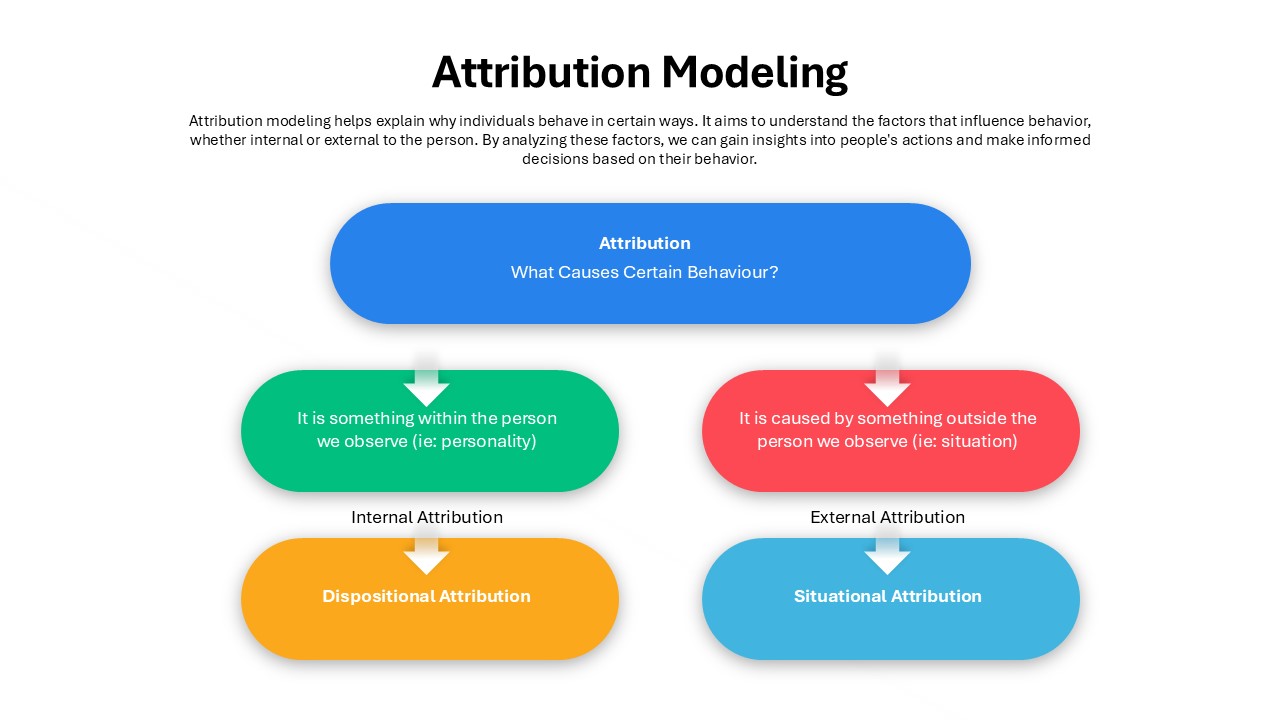
Attribution Modeling Flow Chart Template for PowerPoint & Google Slides
Flow Charts
Flow Chart Infographics for PowerPoint & Google Slides
Flow Charts
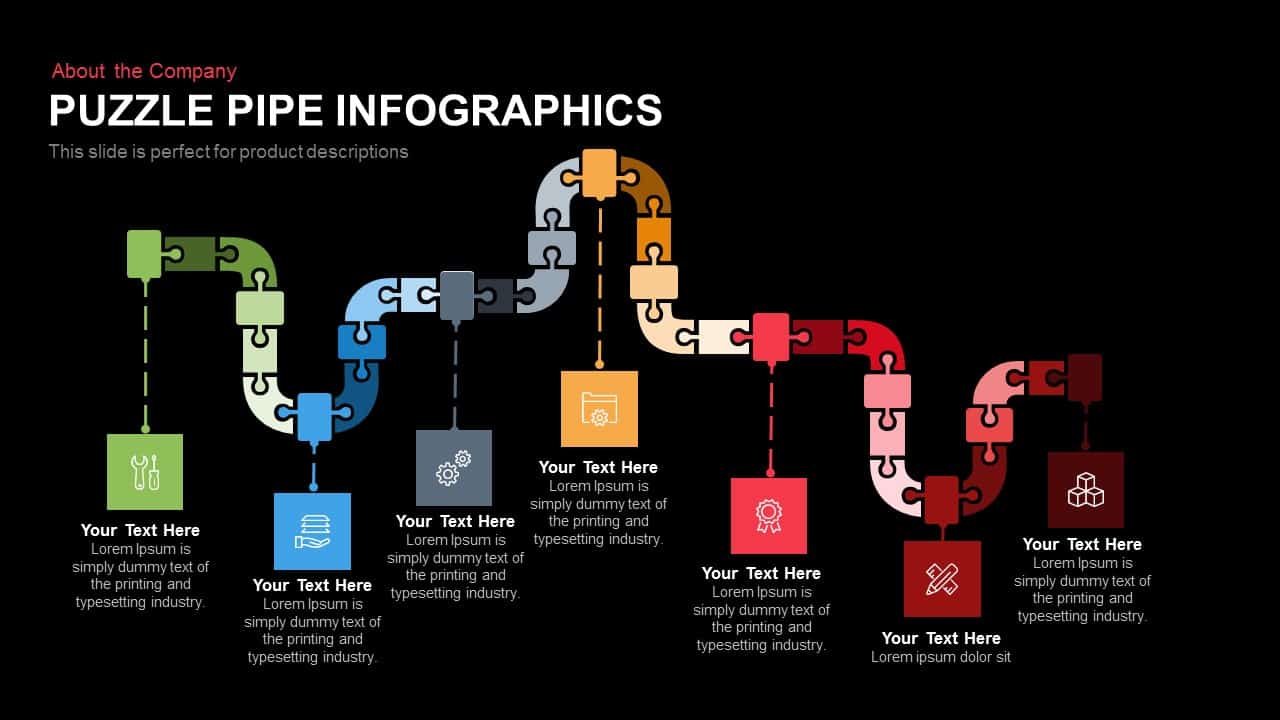
Puzzle Pipe Infographics Process Flow Template for PowerPoint & Google Slides
Process

10 Stages Business Flow Process Diagram template for PowerPoint & Google Slides
Business
5 Stage Linear Process Flow Diagram Template
Process
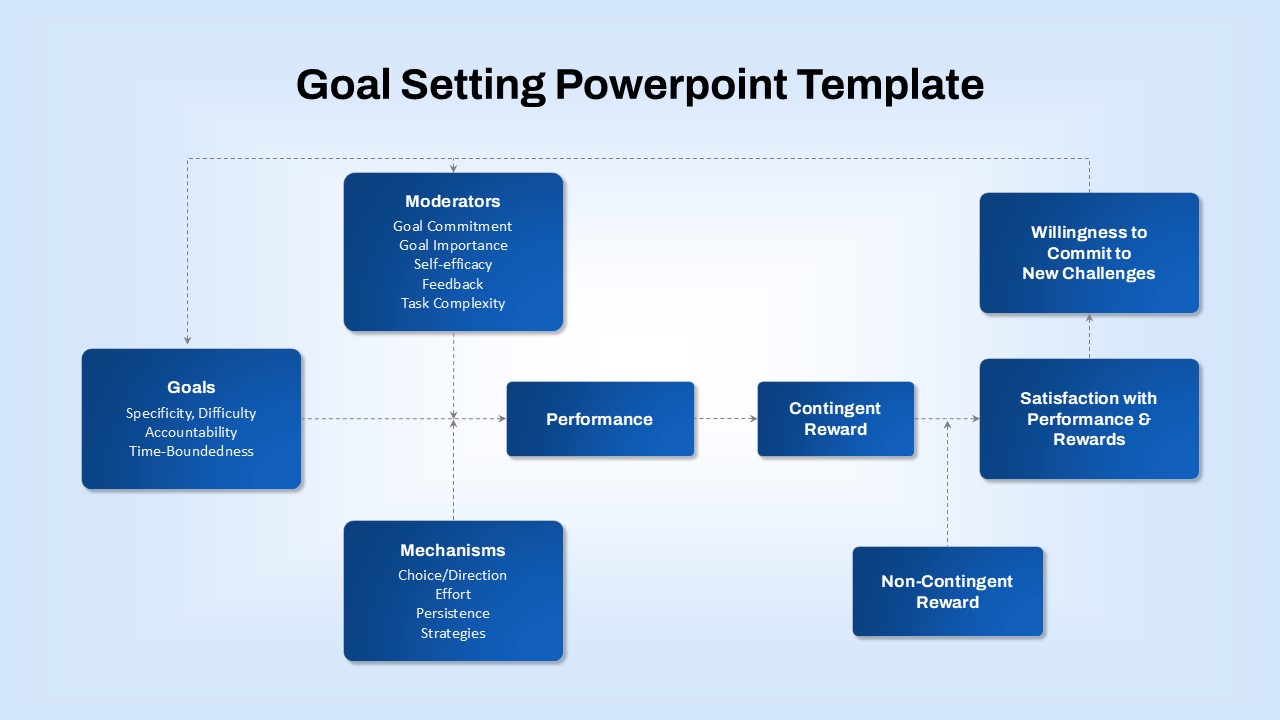
Goal-Setting Process Flow Diagram Template for PowerPoint & Google Slides
Goals