Column and Bar Chart Templates for PowerPoint and Keynote
Download column and bar chart PowerPoint templates and give the best graphical representation of your statistical data. You can compare, interpret and conclude solutions from discrete categories of data with our data-driven bar chart template.
In some phases of the business, you need to present a piece of information which can’t be conveyed verbally. That time you need to design a layout from scratch, it’s not a simple thing to do so. That is why SlideBazaar brings the most professionally designed column bar chart template. It will lessen your hectic work and showcase your statistical data exceptionally and creatively. Using a column chart template in your presentation assists in deriving measurable conclusions from different categorical data.
![]() Filter
Filter
Filter

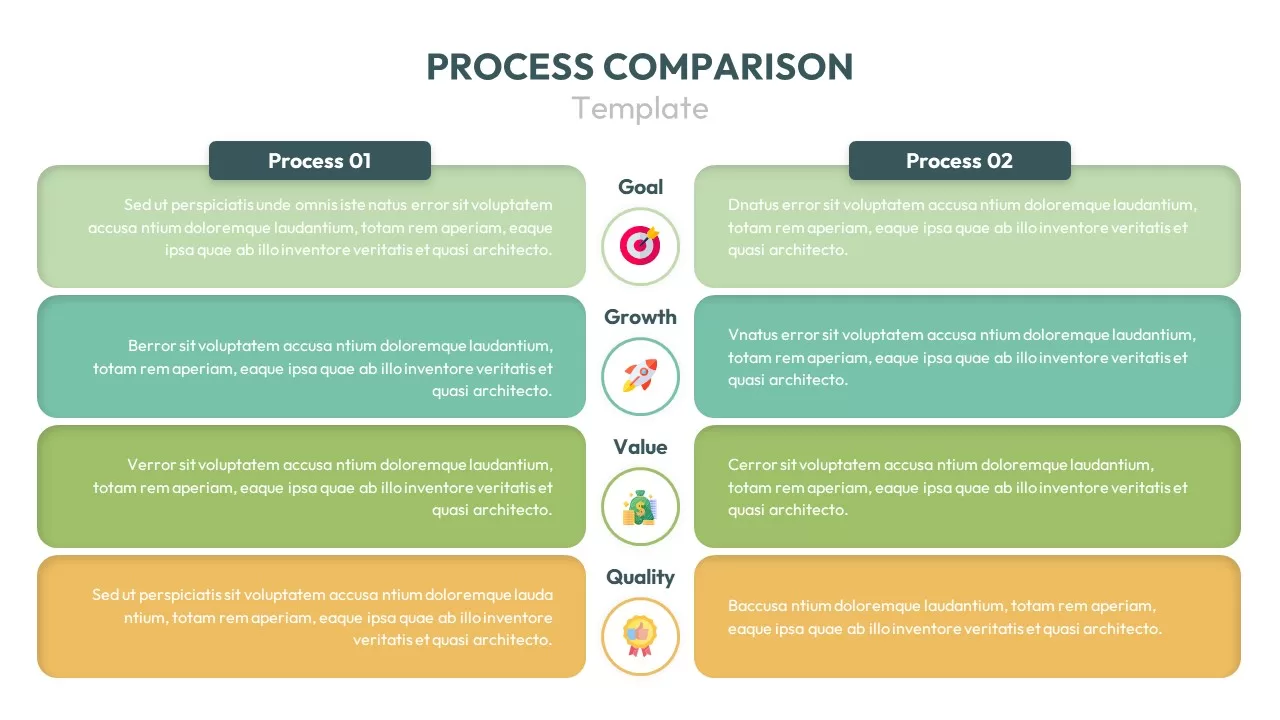
2 Options Comparison Table PowerPoint Template
PowerPoint Templates
Premium

Free Data Analysis PowerPoint Template
Free PowerPoint Templates
Free

HR Report PowerPoint Template
Column and Bar chart
Premium
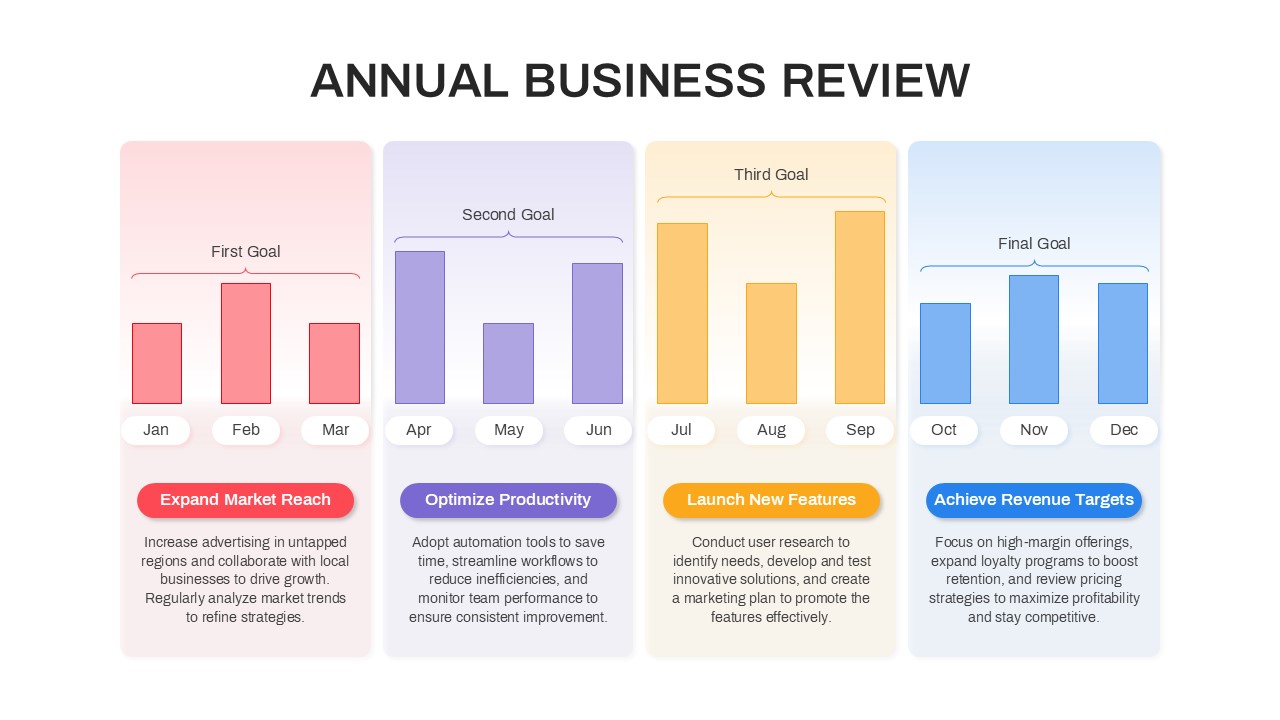
Annual Business Review PowerPoint Template
PowerPoint Templates
Premium

Quarterly Credit Loss Provisions Chart PowerPoint Template
Business PowerPoint Templates
Premium

Jump Line Chart PowerPoint Template
Column and Bar chart
Premium
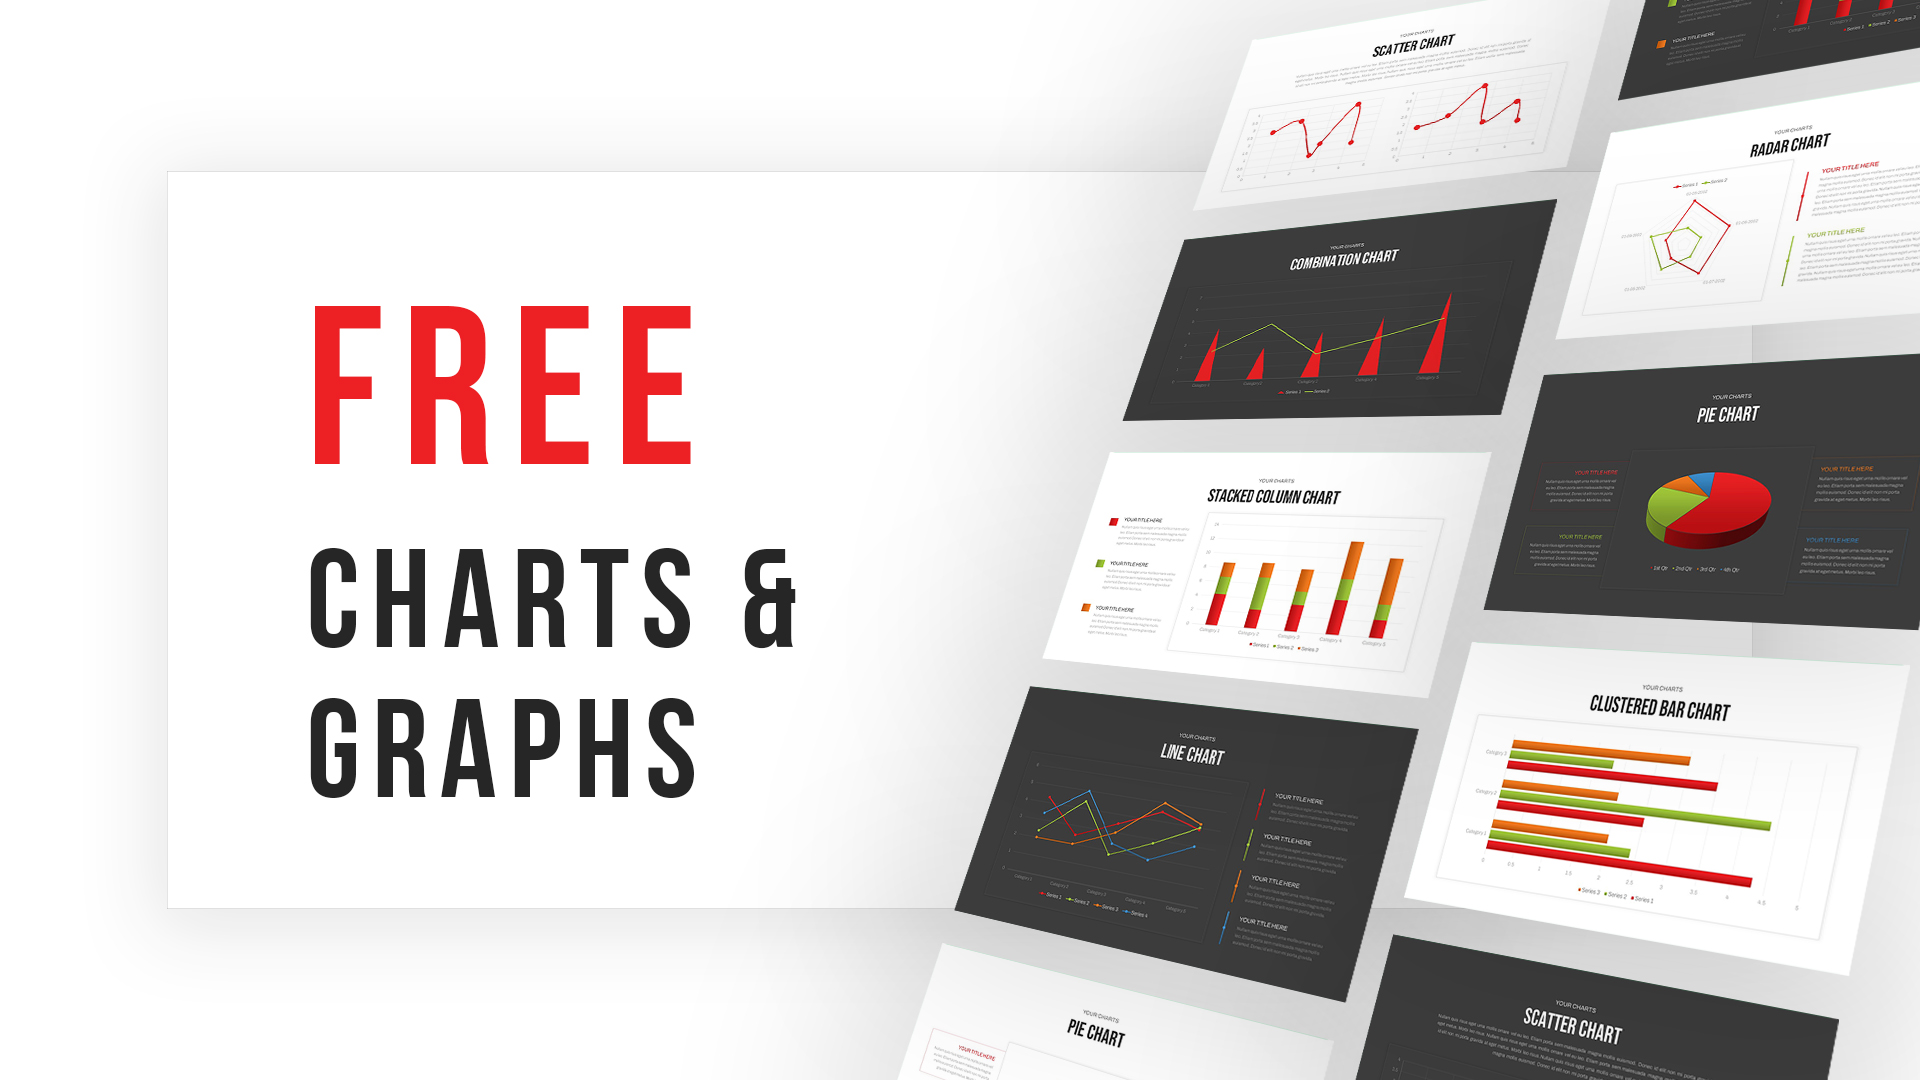
Free Charts & Graphs Deck PowerPoint Template
PowerPoint Templates
Free

Waterfall Chart PowerPoint Template
PowerPoint Charts
Premium

Timeline Bar Chart PowerPoint
Column and Bar chart
Premium

Vertical Dot Chart PowerPoint Template
PowerPoint Charts
Premium

Line Chart PowerPoint Template
PowerPoint Charts
Premium
Rectangle Area Chart Template
PowerPoint Charts
Premium
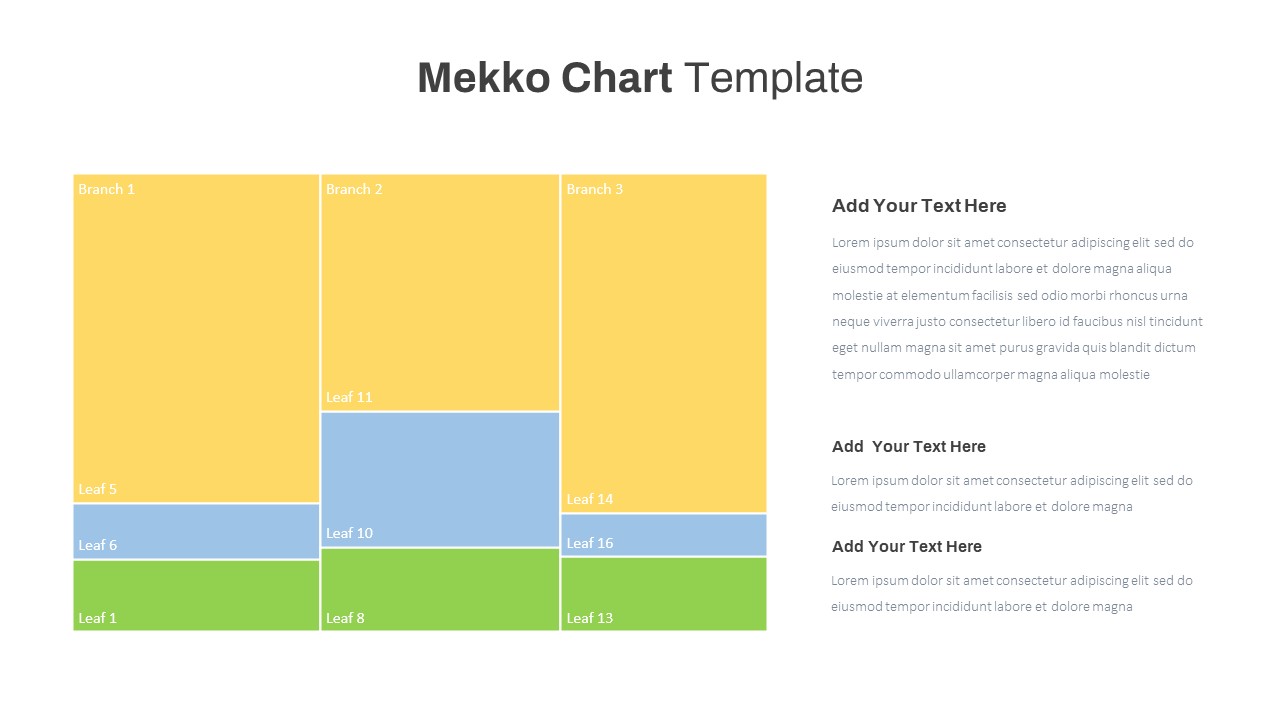
Mekko Chart Template
PowerPoint Templates
Premium
Grouped Column Chart PowerPoint Template
Column and Bar chart
Premium
100% Stacked Column Chart PowerPoint Template
Column and Bar chart
Premium
Clustered Bar Chart PowerPoint Template
Column and Bar chart
Premium
Waterfall Column Chart PowerPoint Template
Column and Bar chart
Premium
Multiple Column Chart PowerPoint Template
Column and Bar chart
Premium
Free Simple Column Chart PowerPoint Template
Column and Bar chart
Free
Simple Bar Chart PowerPoint Template
Column and Bar chart
Premium
Animated Stacked Bar Chart PowerPoint Template
Column and Bar chart
Premium
Free Stacked Column Chart Template
Column and Bar chart
Free
Monthly Recurring Revenue PowerPoint Template
PowerPoint Templates
Premium
Stacked Bar Chart Template For PowerPoint
Column and Bar chart
Premium
One Pager Annual Report Template
Column and Bar chart
Premium
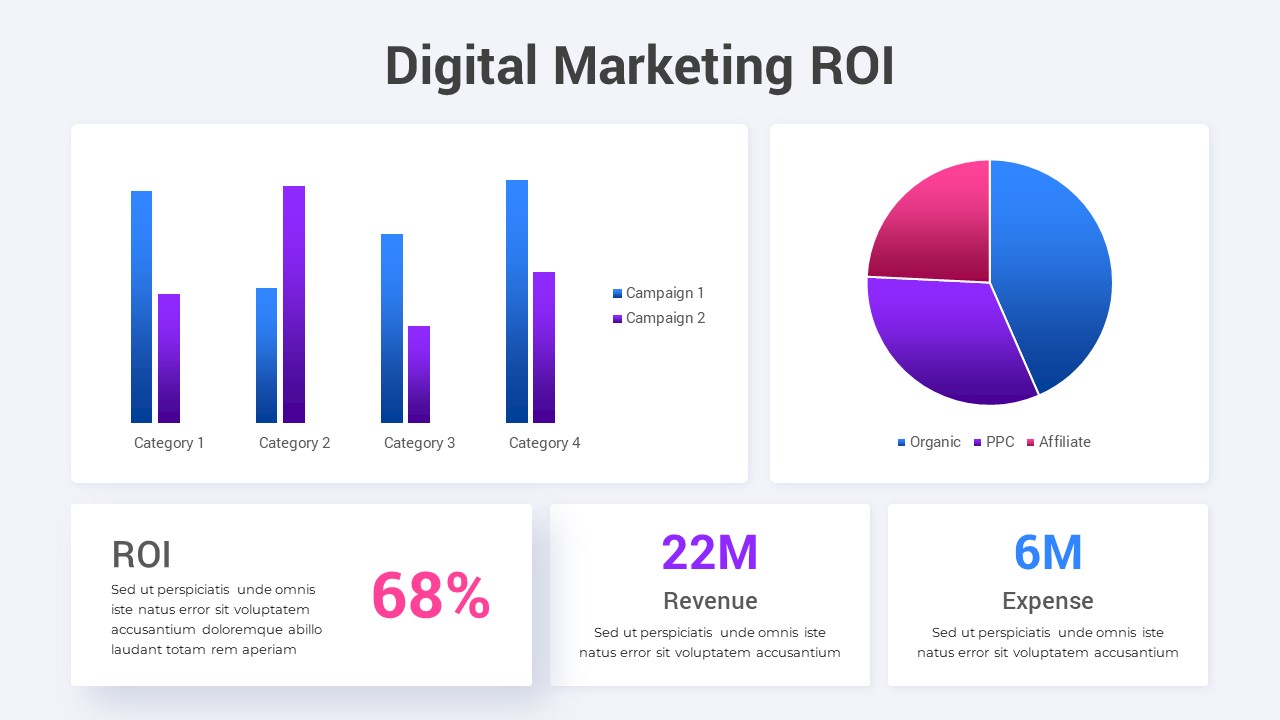
Digital Marketing ROI Template
Infographic
Premium
Stacked Bar Chart PowerPoint Template
Column and Bar chart
Premium
Stacked Bar Chart Template
Column and Bar chart
Premium
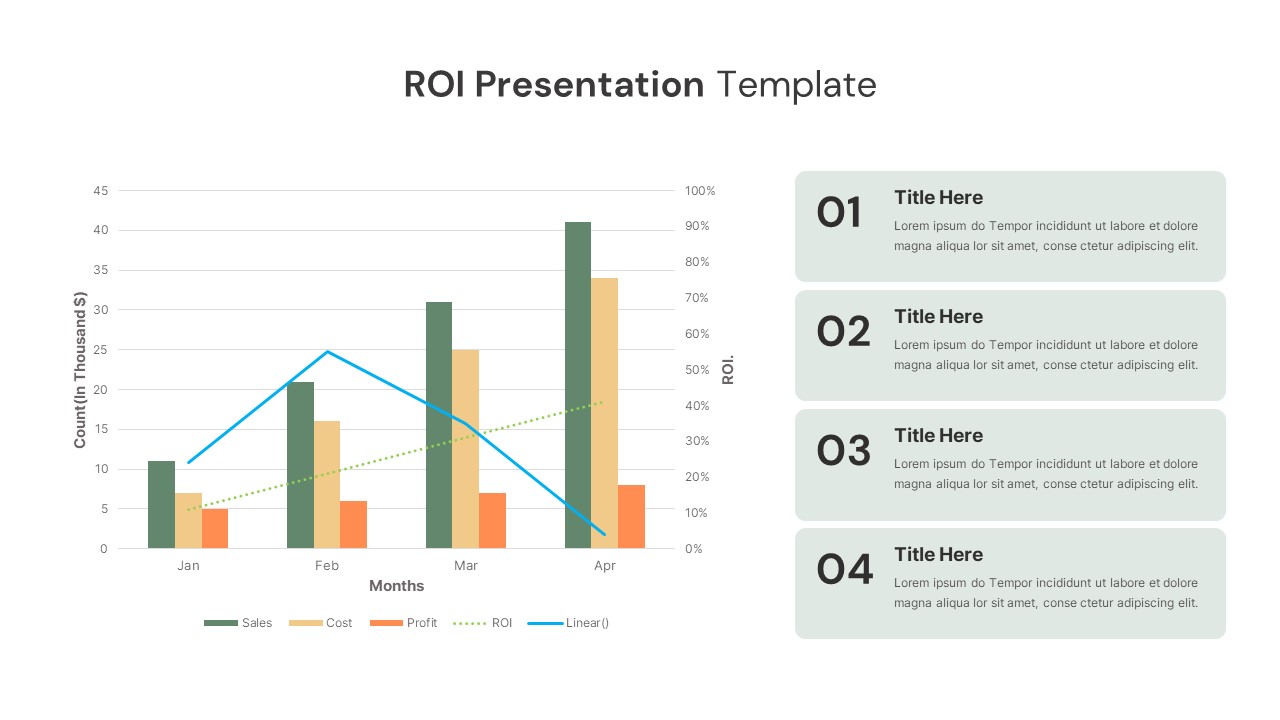
ROI Presentation
Infographic
Premium
KPI Dashboard Template
Infographic
Premium
KPI Dashboard Infographic
Infographic
Premium
Percentage Infographic
Column and Bar chart
Premium
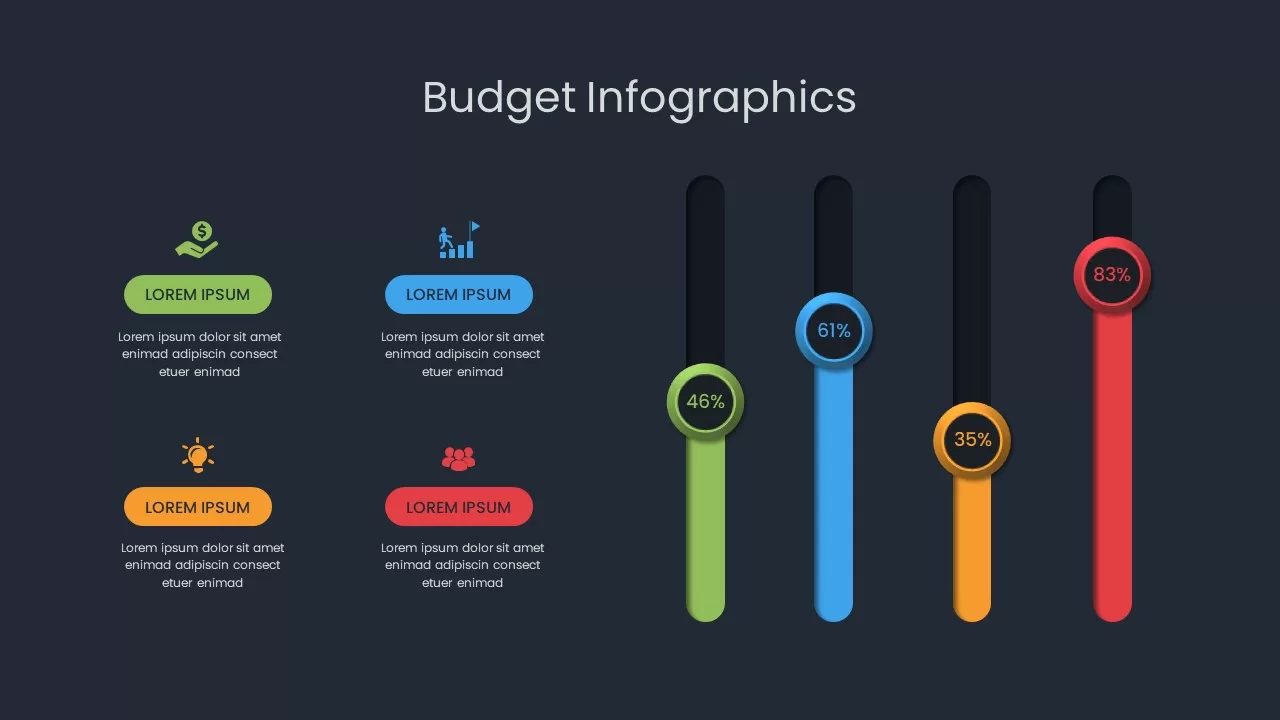
Budget Infographic Template
3D Shapes
Premium

Thesis Defense PowerPoint Template
professional
Premium
Process Comparison Chart
PowerPoint Charts
Premium