Percentage Infographics template for PowerPoint & Google Slides


Description
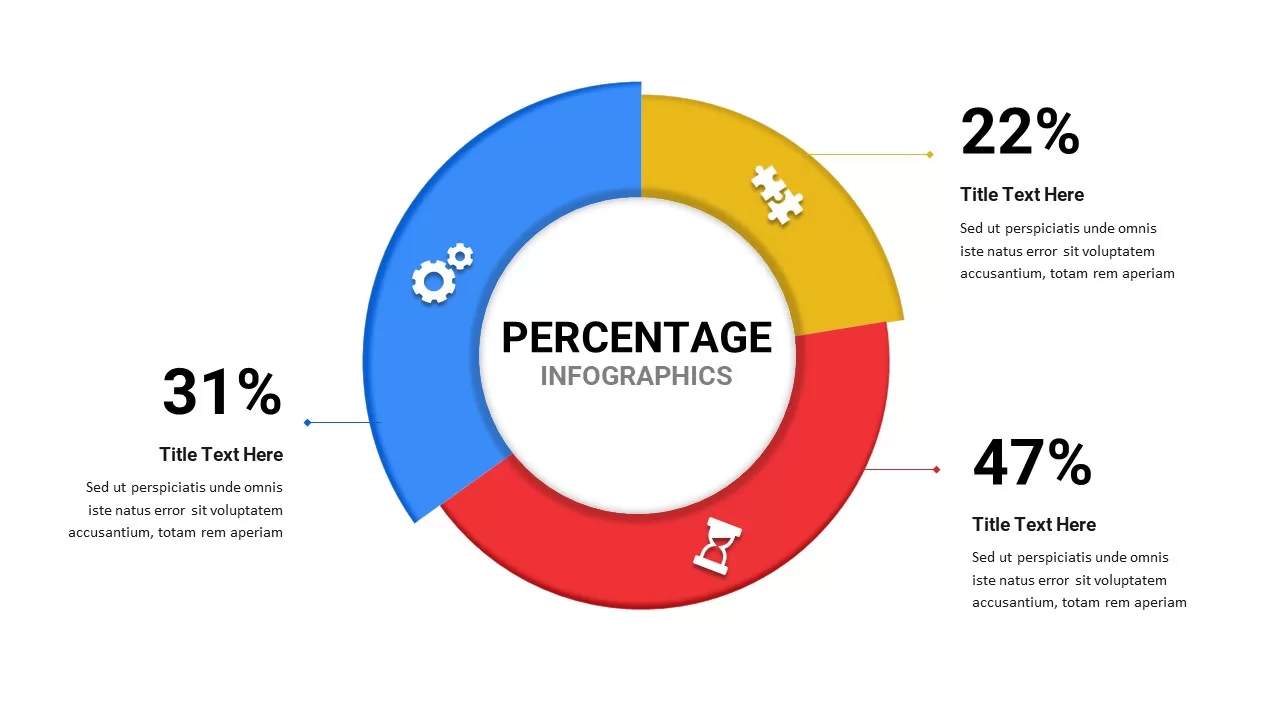
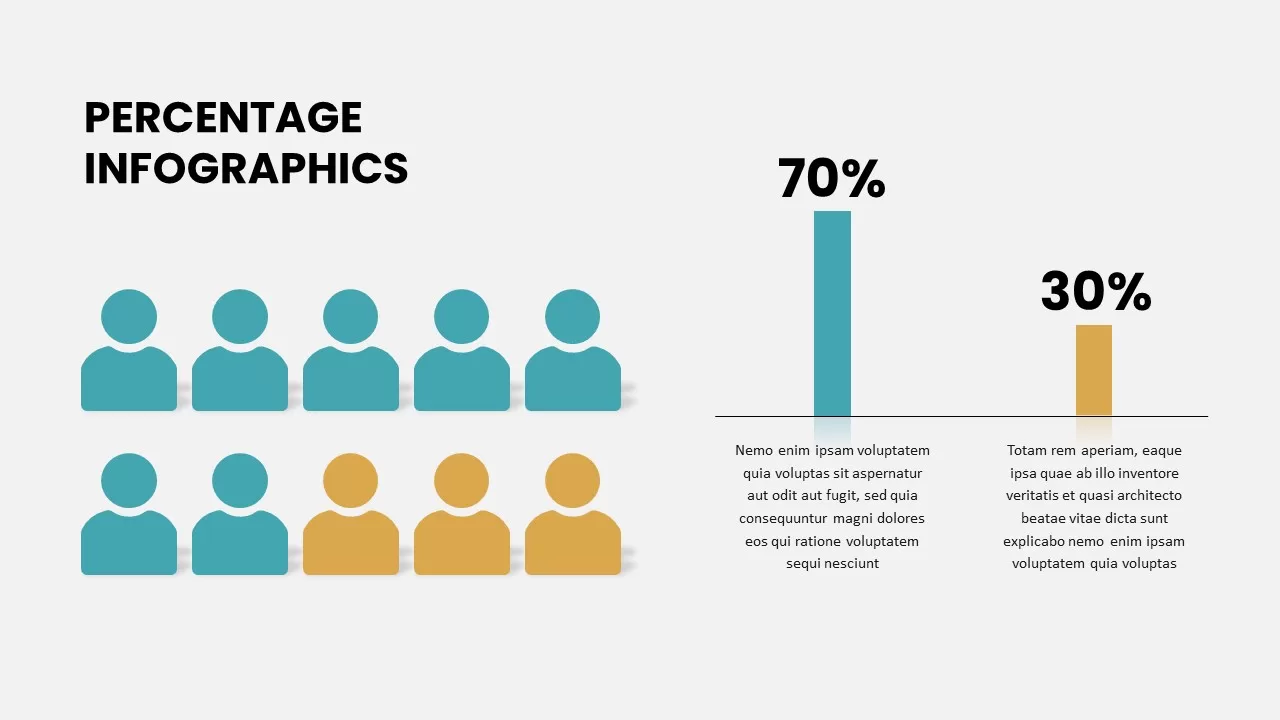
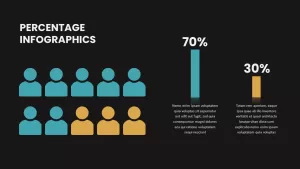
This Percentage Infographics slide is designed to present percentage-based data in a visually appealing way. The template features two distinct sections: one displaying a population breakdown using icons (blue and yellow figures representing different groups) and the other showcasing bar graphs that display 70% and 30% data points, making it ideal for comparing two categories.
Each section is customizable, allowing you to input your own data while the simple yet vibrant design ensures the data remains clear and easy to understand. The layout includes placeholders for titles and descriptions, making it perfect for showcasing survey results, market research, or project performance metrics. The combination of pictorial icons and graphical elements ensures that your audience can grasp the key information quickly.
Fully editable and compatible with both PowerPoint and Google Slides, this template is a great tool for presenting data visually and professionally across various platforms.
Who is it for
This slide is ideal for business analysts, marketers, project managers, or anyone who needs to present data in a visually engaging format. It’s particularly useful for professionals presenting survey results, statistics, financial figures, or any other percentage-based information to stakeholders, teams, or clients.
Other Uses
In addition to presenting percentage data, this template can be used to highlight demographic breakdowns, performance comparisons, or even voting results. It can be easily adapted for use in marketing campaigns, budget tracking, or team performance evaluations.
Login to download this file

Item ID
SB02613
Related Templates

Percentage Infographics Free
Comparison
Free
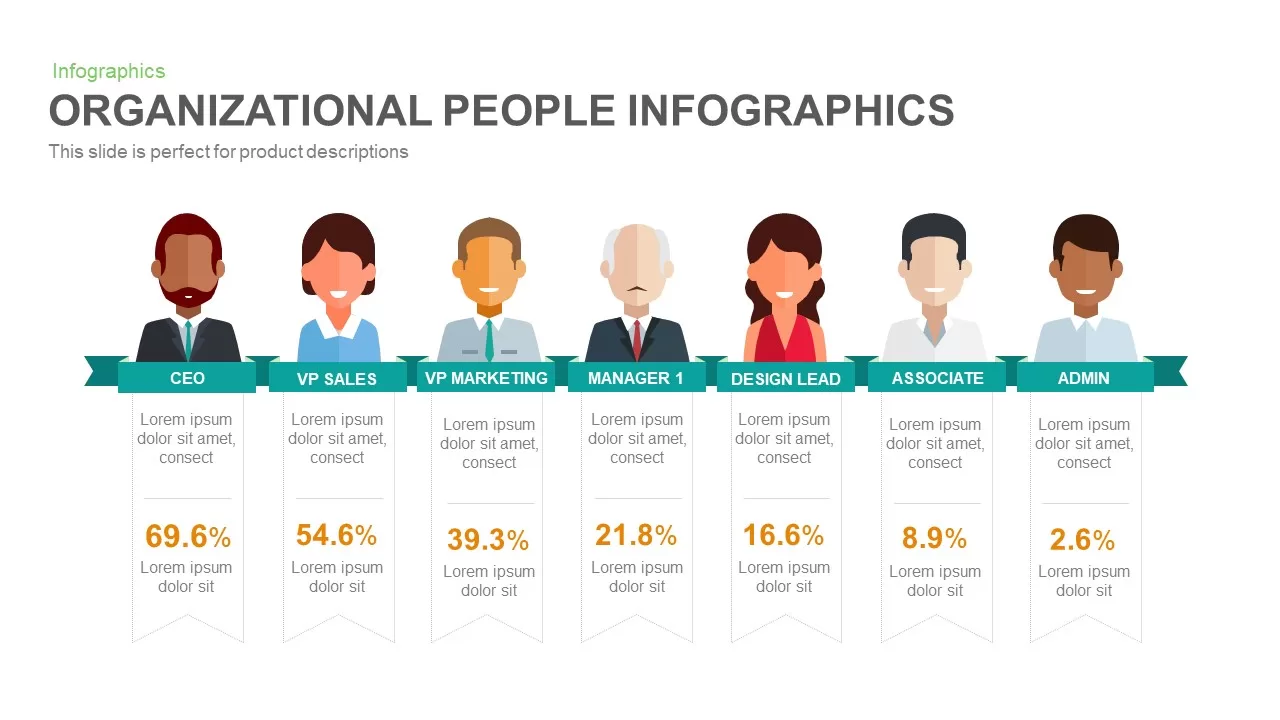
Organizational People Percentage Chart template for PowerPoint & Google Slides
Org Chart

Dual Percentage Comparison Metaphor Template for PowerPoint & Google Slides
Comparison
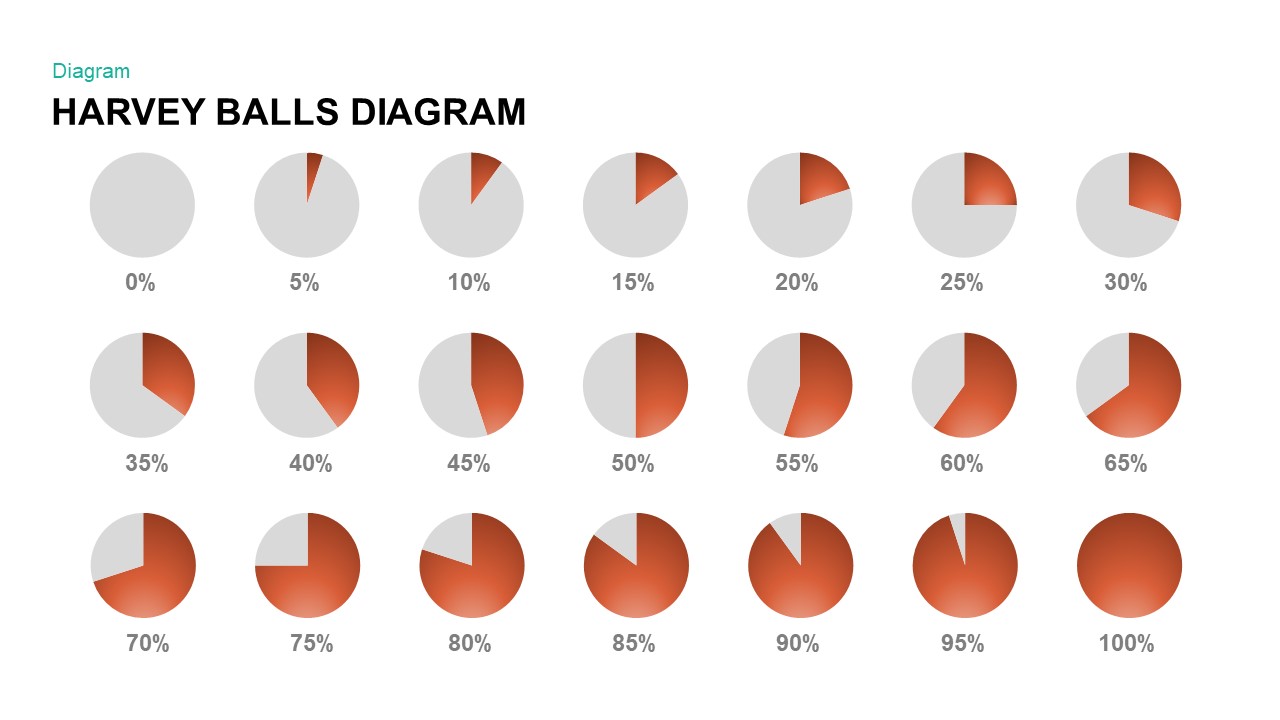
Harvey Balls Percentage Infographic Template for PowerPoint & Google Slides
Harvey Balls
Bottle Data Percentage Infographic Template for PowerPoint & Google Slides
Infographics
North America Percentage Map Infographic Template for PowerPoint & Google Slides
World Maps
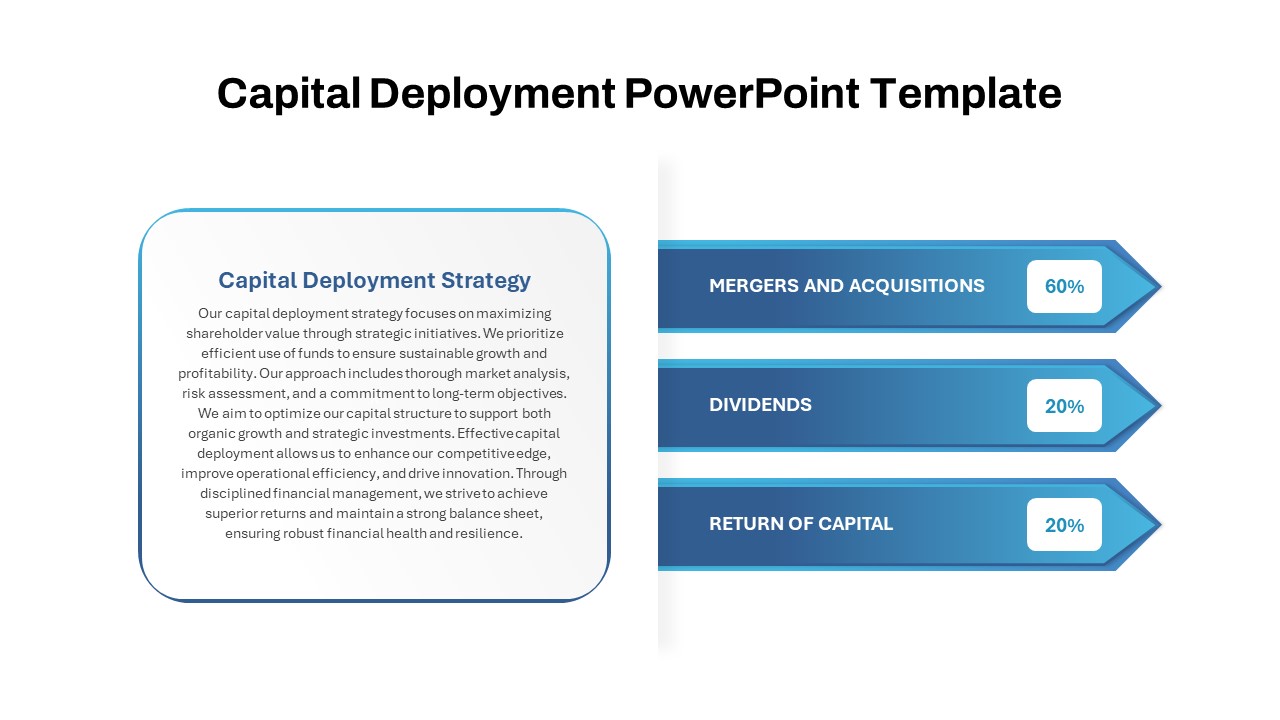
Capital Deployment Percentage Breakdown Template for PowerPoint & Google Slides
Pitch Deck
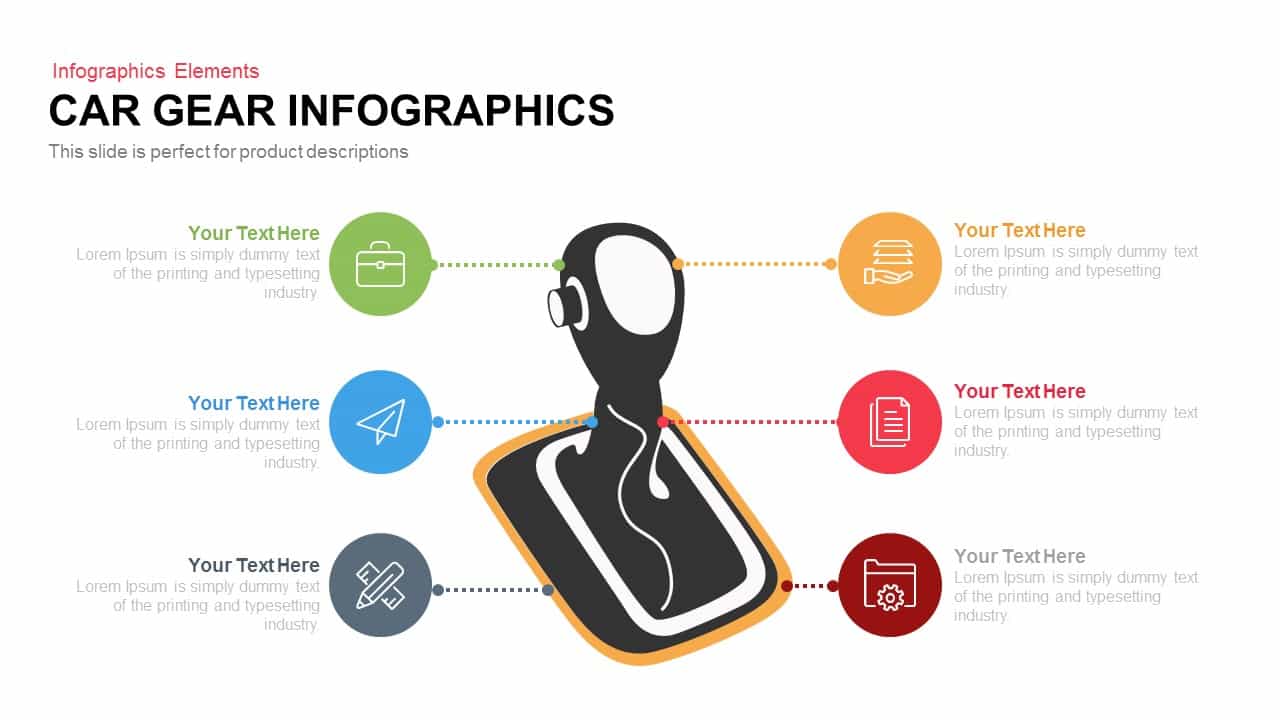
Car Gear Infographics Template for PowerPoint & Google Slides
Infographics
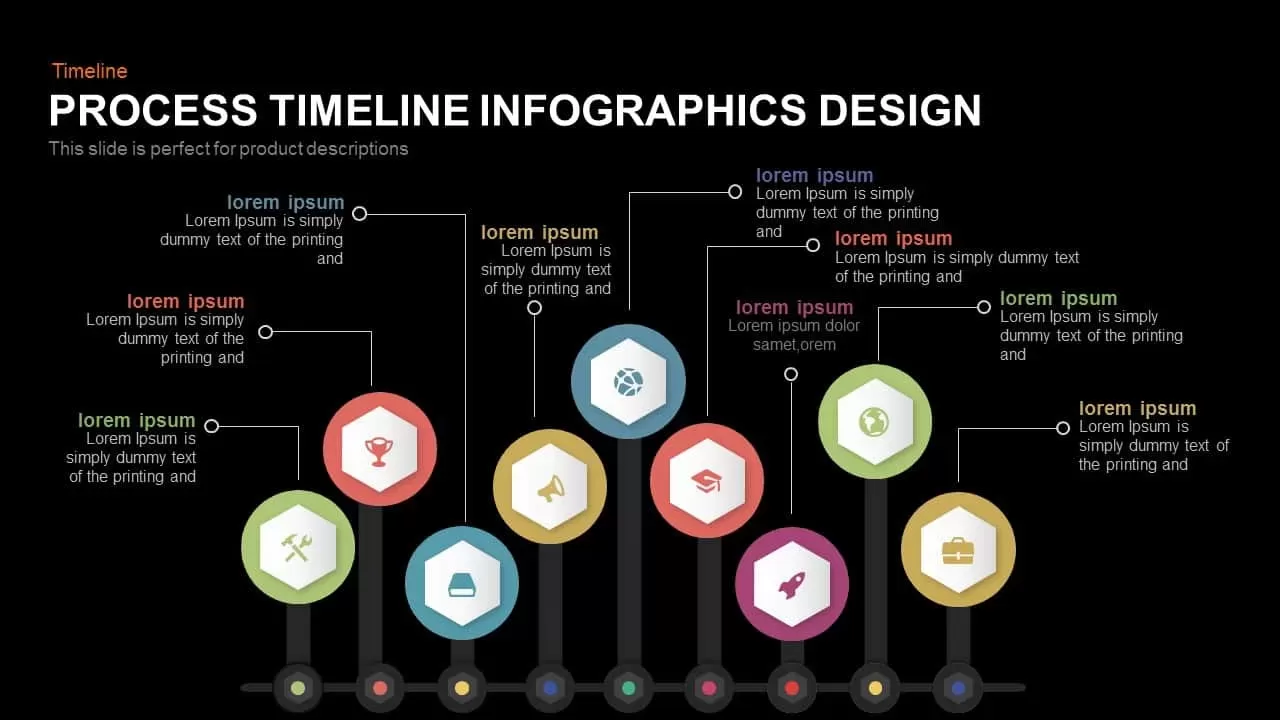
Process Timeline Infographics Design template for PowerPoint & Google Slides
Timeline
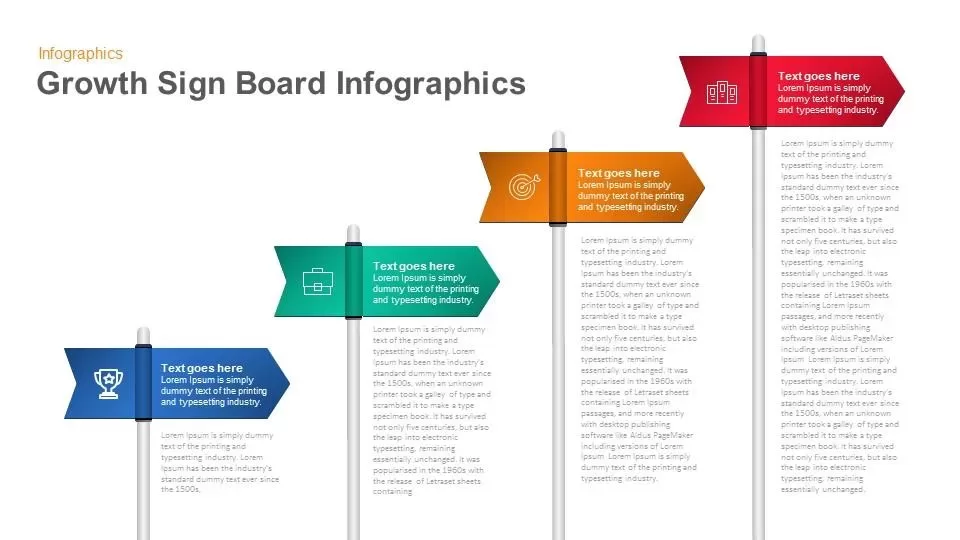
Growth Sign Board Infographics template for PowerPoint & Google Slides
Timeline
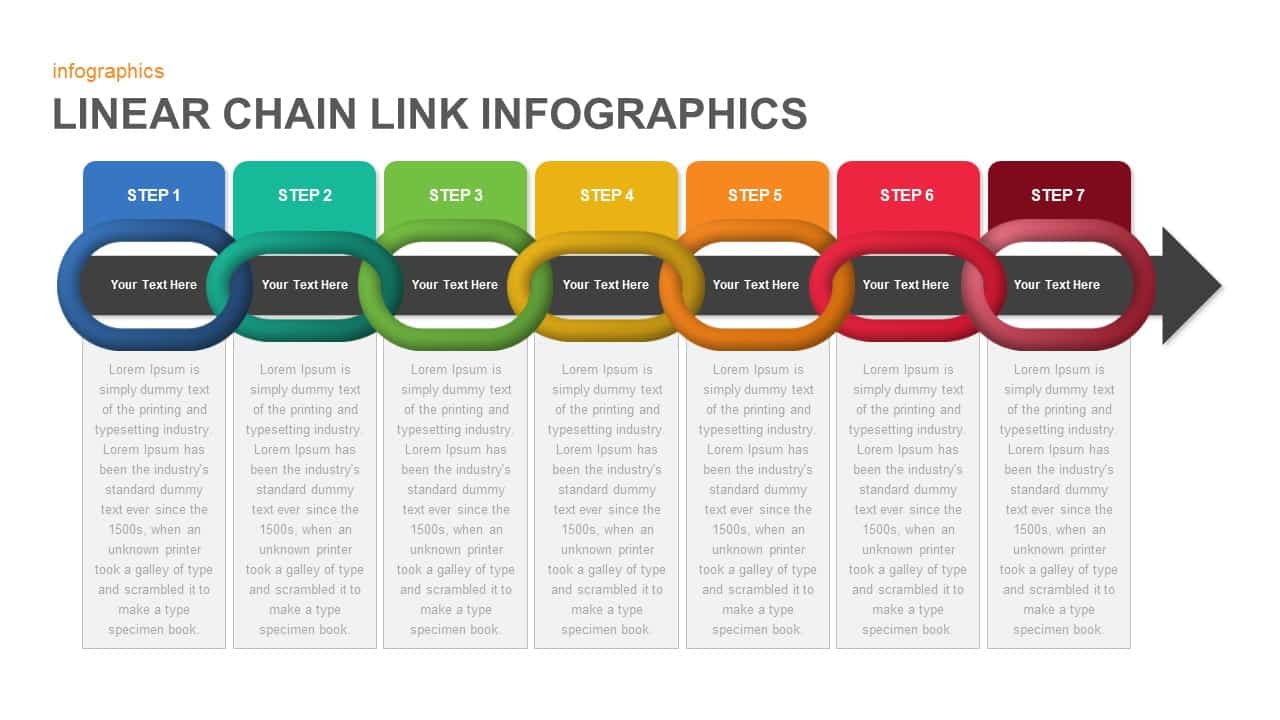
Linear Chain Link Infographics Template for PowerPoint & Google Slides
Process
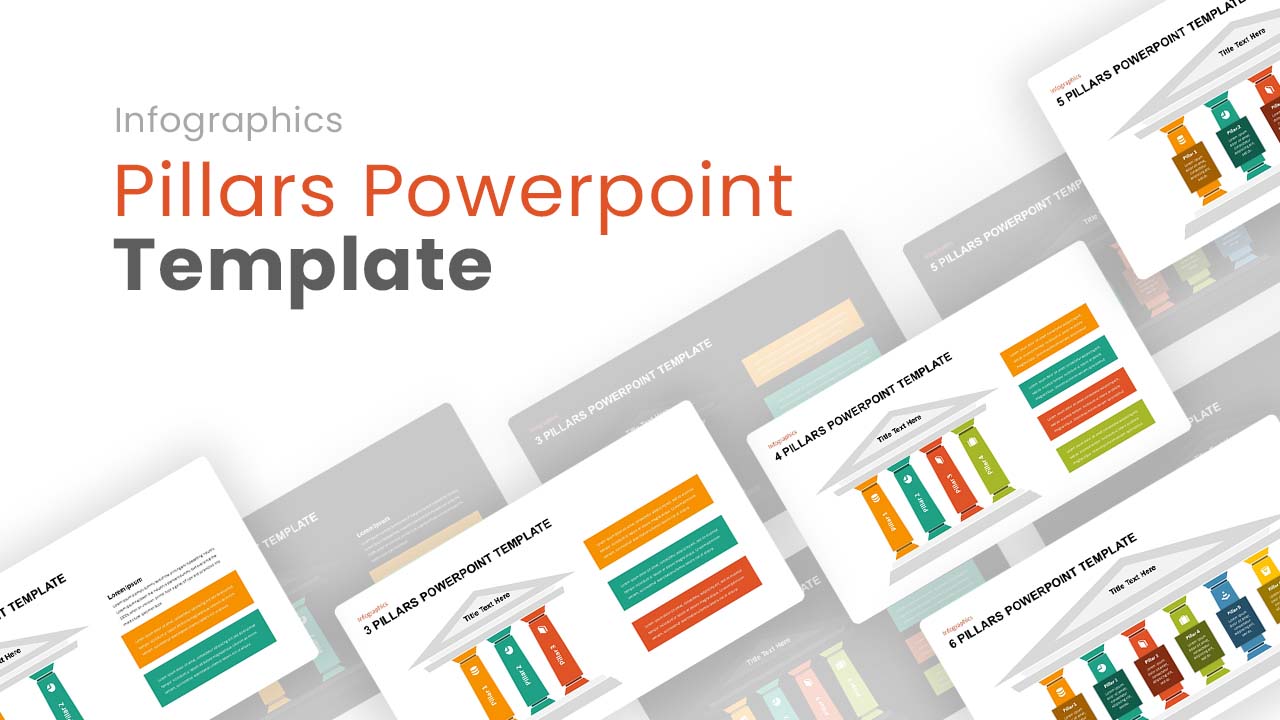
Editable Pillars Infographics Pack Template for PowerPoint & Google Slides
Infographics
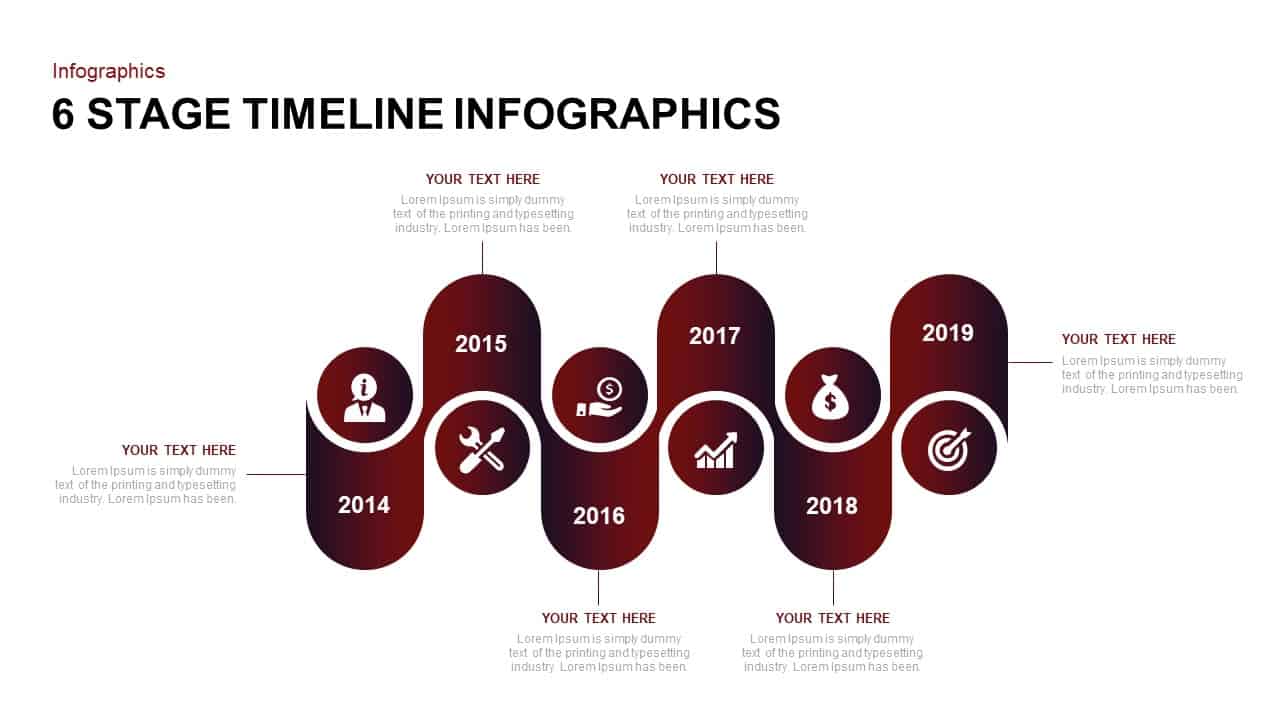
Six-Stage Timeline Infographics Slide Template for PowerPoint & Google Slides
Timeline
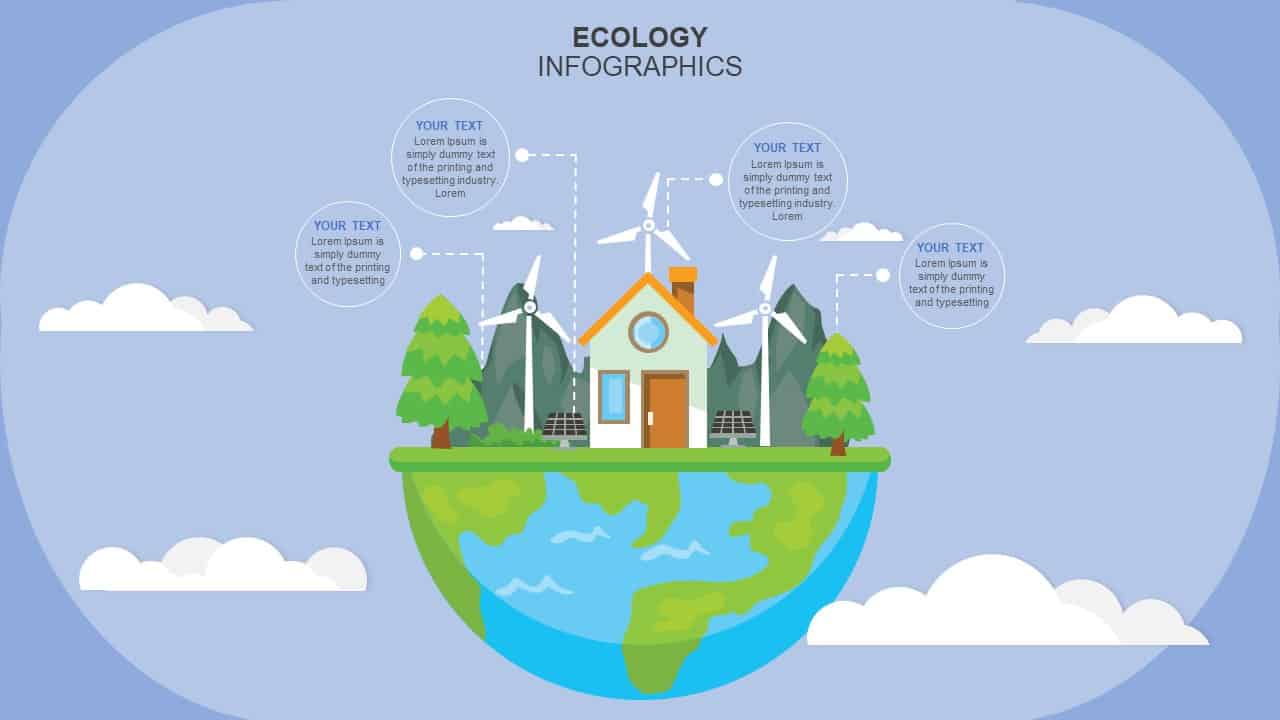
Ecology Infographics Overview template for PowerPoint & Google Slides
Business Proposal
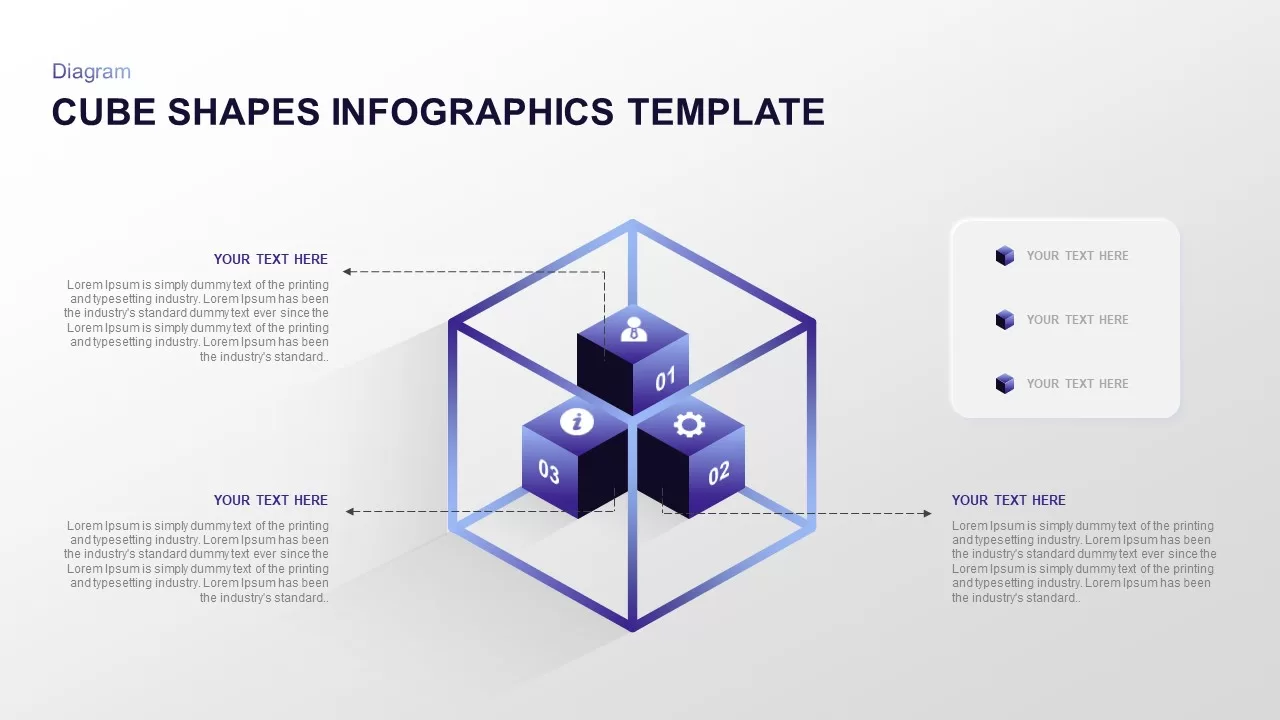
Isometric 3D Cube Shapes Infographics Template for PowerPoint & Google Slides
Infographics
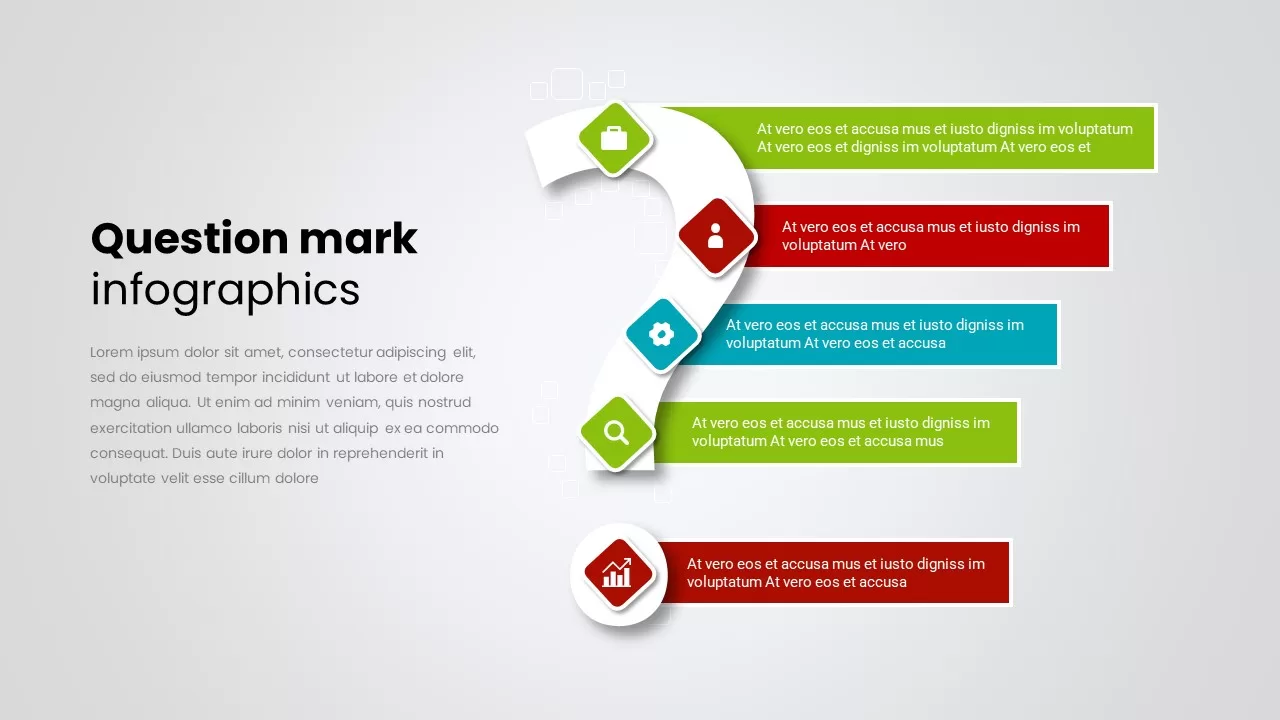
Question Mark Infographics template for PowerPoint & Google Slides
Infographics
Before and After Comparison Infographics Template for PowerPoint & Google Slides
Comparison
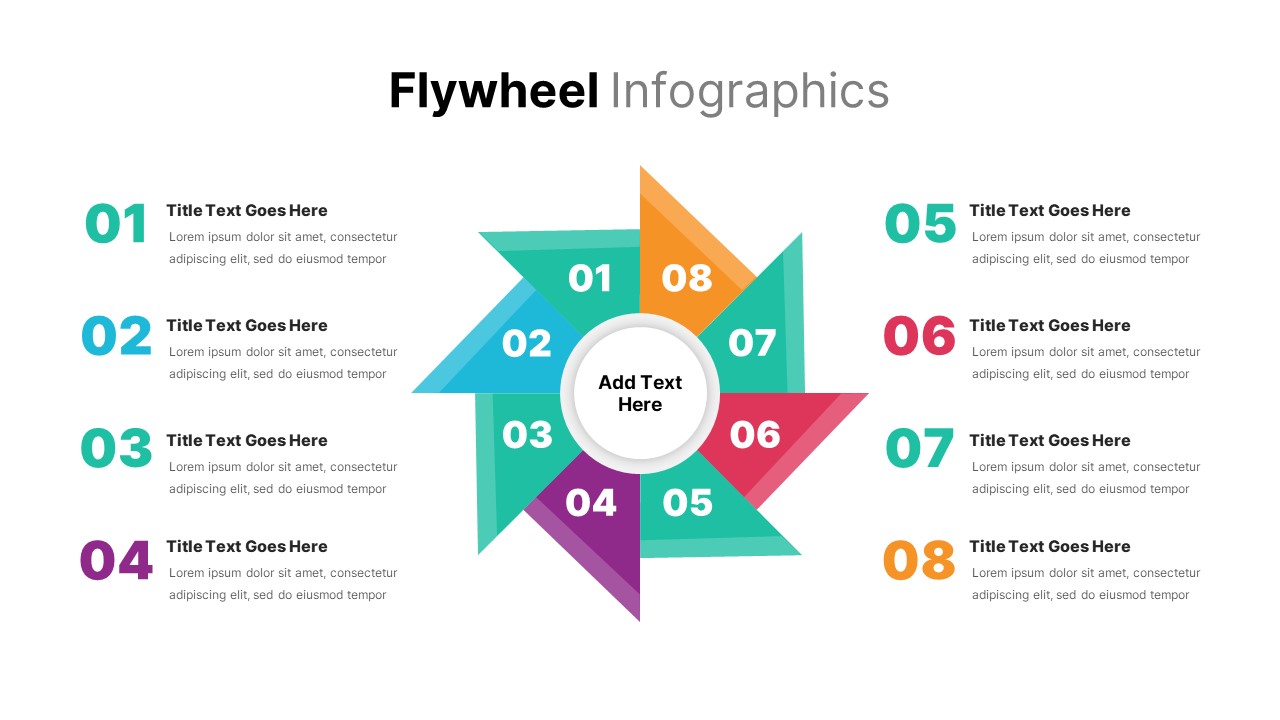
Flywheel Infographics template for PowerPoint & Google Slides
Business Strategy
Conflict Infographics Comparison Template for PowerPoint & Google Slides
Infographics
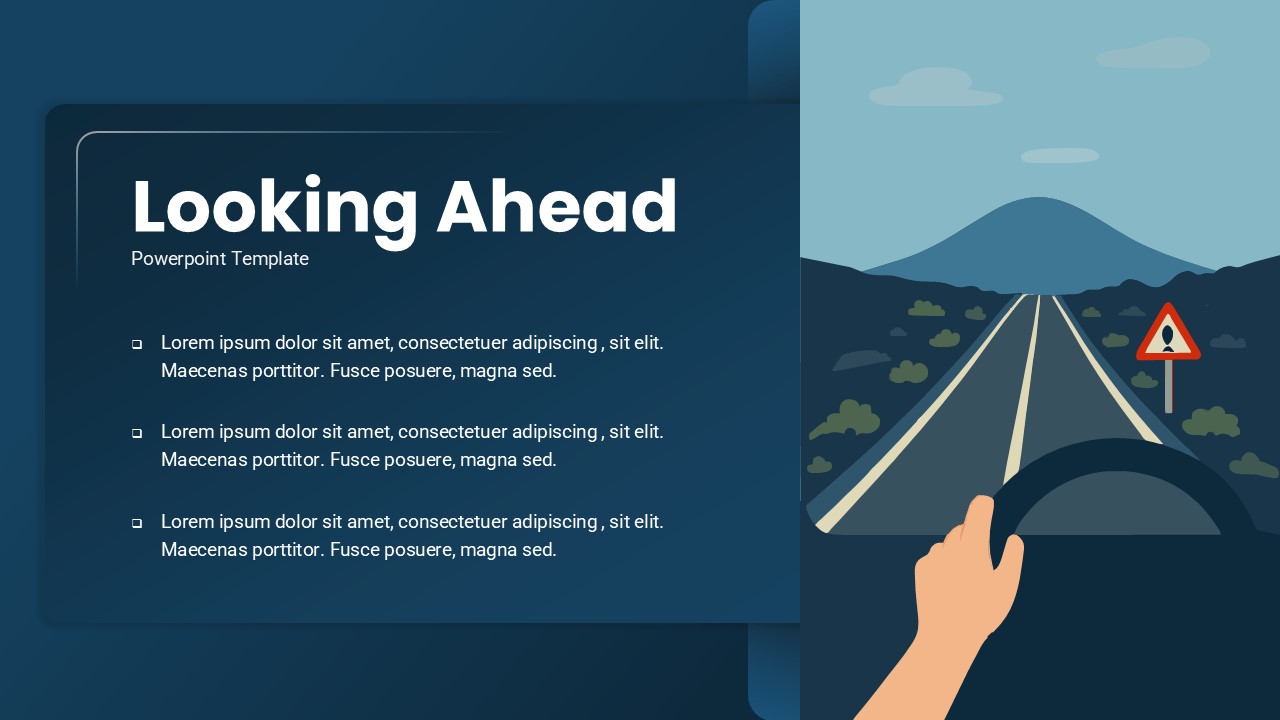
Looking Ahead 3-Slide Infographics Pack Template for PowerPoint & Google Slides
Business