Four-Stage Start-Up Plan Arc Diagram Template for PowerPoint & Google Slides


Description
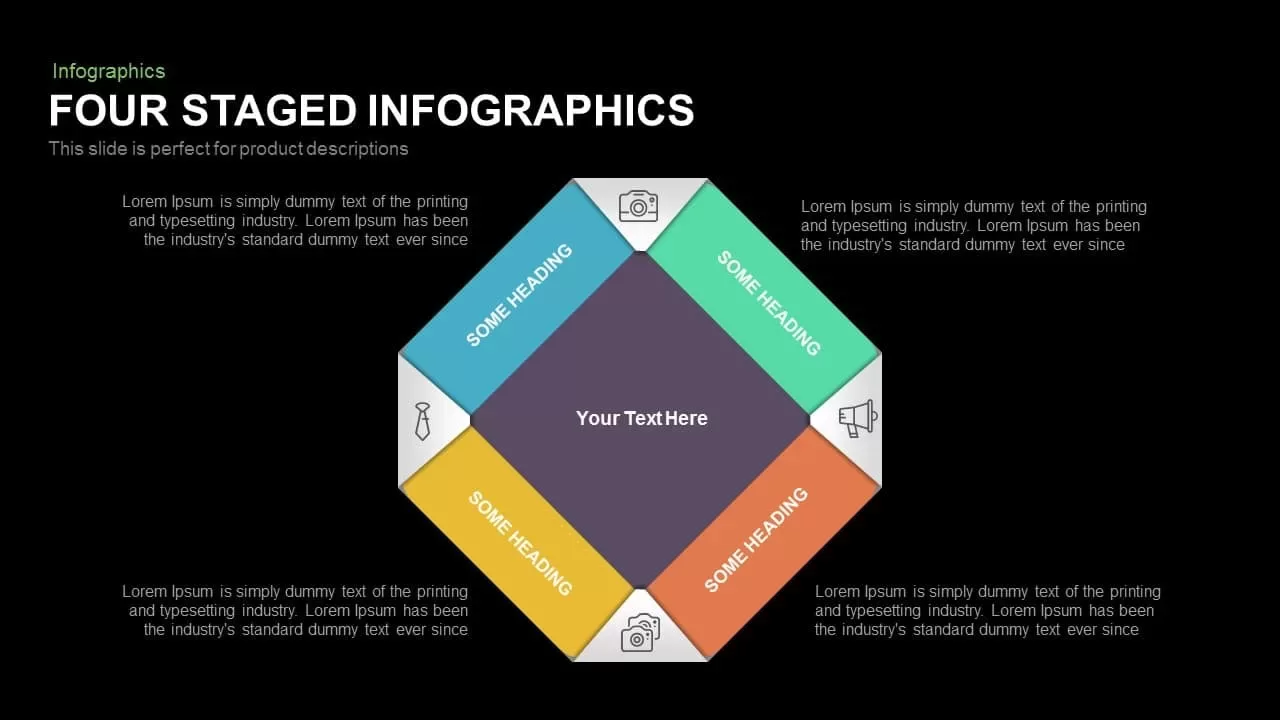
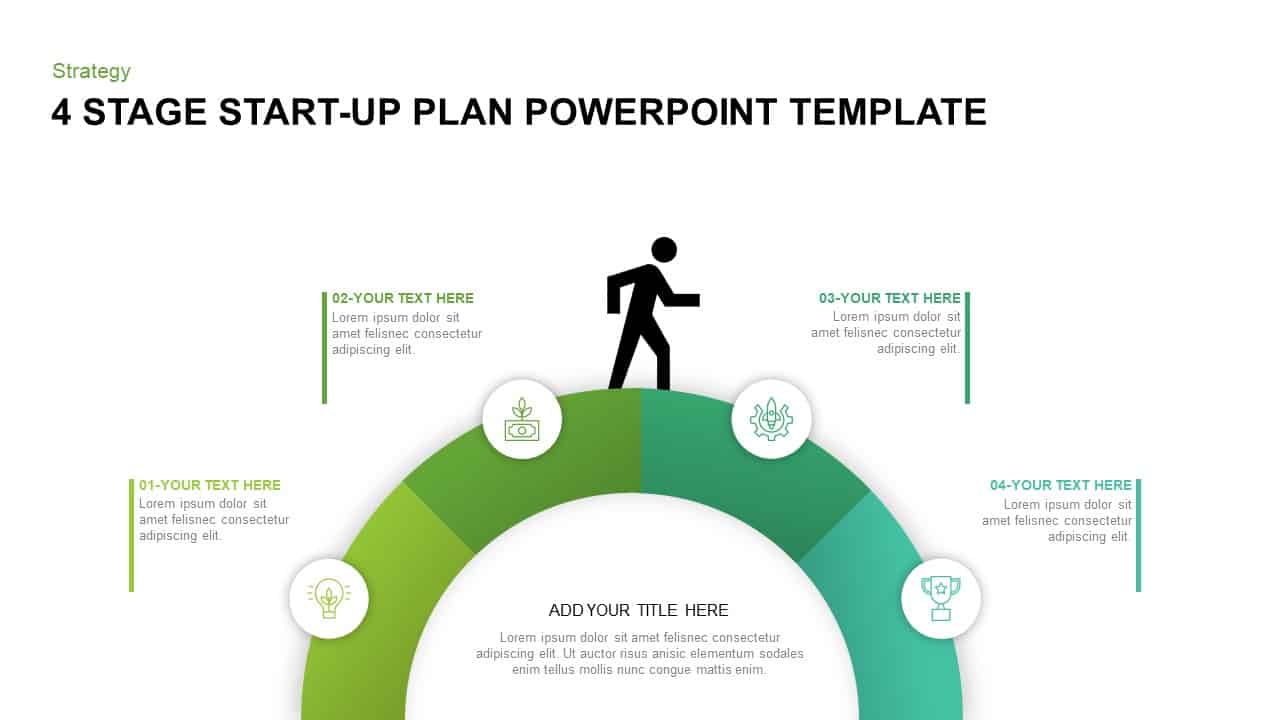
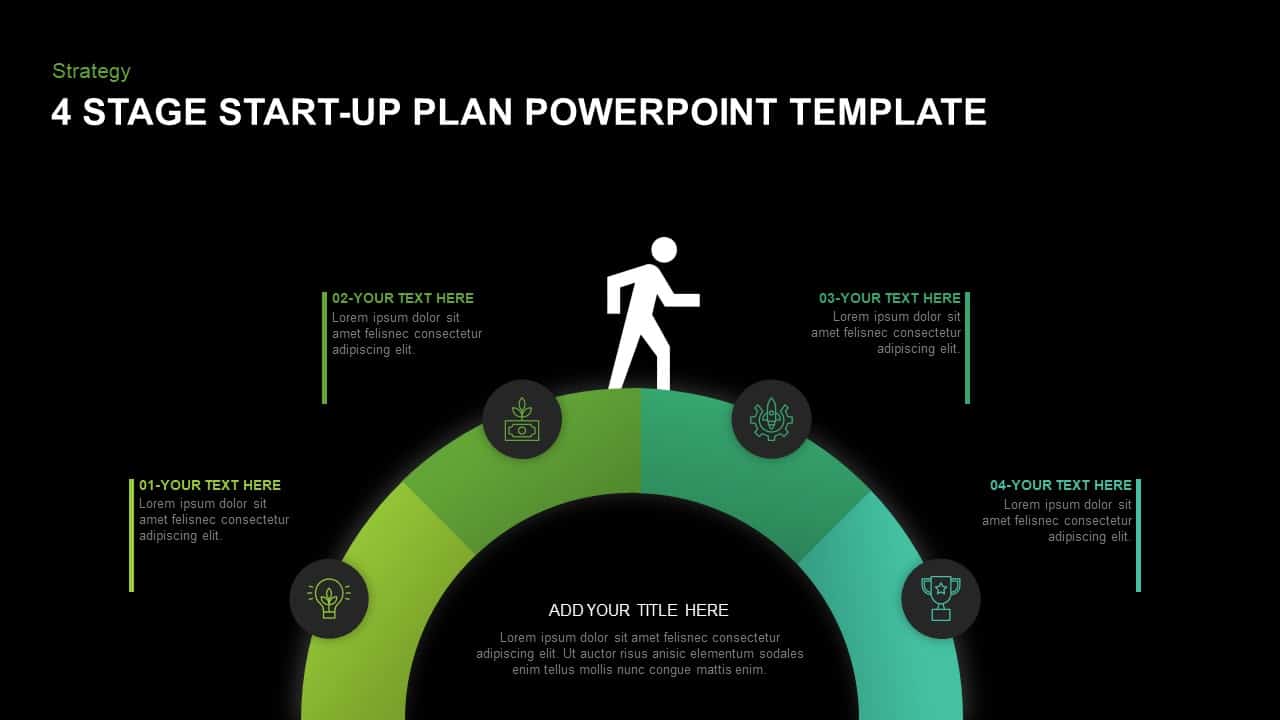
Leverage this four-stage start-up plan arc diagram to map your venture’s key phases—from ideation through success—with clarity and style. The semi-circular gradient arc features four editable segments in green and cyan, each linked to a round icon placeholder for idea generation, seed funding, development, and launch milestones. A central figure walking atop the arc adds a dynamic visual cue for progress. Vector shapes, text placeholders, and master-slide integration enable you to swap icons, adjust segment hues, and update labels in seconds. The minimalist white background, subtle drop shadows, and clean typography maintain audience focus on your roadmap, while built-in animations reveal each stage sequentially for engaging presentations.
Optimized for both PowerPoint and Google Slides, this template uses SmartArt-style elements for pixel-perfect scaling on any screen. Hide or highlight individual segments to emphasize specific phases, recolor gradients to match your branding, and apply global font updates via the theme pane—eliminating manual edits and version-control headaches. Accessibility features, including high-contrast text options and alt-text fields for icons, ensure inclusive communication for all viewers.
Beyond start-up planning, this diagram adapts seamlessly to project roadmaps, product development cycles, marketing funnels, or training pathways. Duplicate, reorder, or resize segments to suit any four-step process, and leverage the central arc motif to anchor your narrative. Whether you’re a founder pitching investors, a project lead outlining deliverables, or a consultant framing strategy, this arc diagram empowers you to present complex plans with confidence and precision.
Who is it for
Entrepreneurs, project managers, start-up consultants, business strategists, and workshop facilitators will benefit from this diagram when outlining phased roadmaps and key milestones.
Other Uses
Repurpose this slide to visualize product development cycles, marketing campaign stages, training program modules, strategic roadmaps, or any four-step process with clear progression.
Login to download this file

Item ID
SB01353
Related Templates

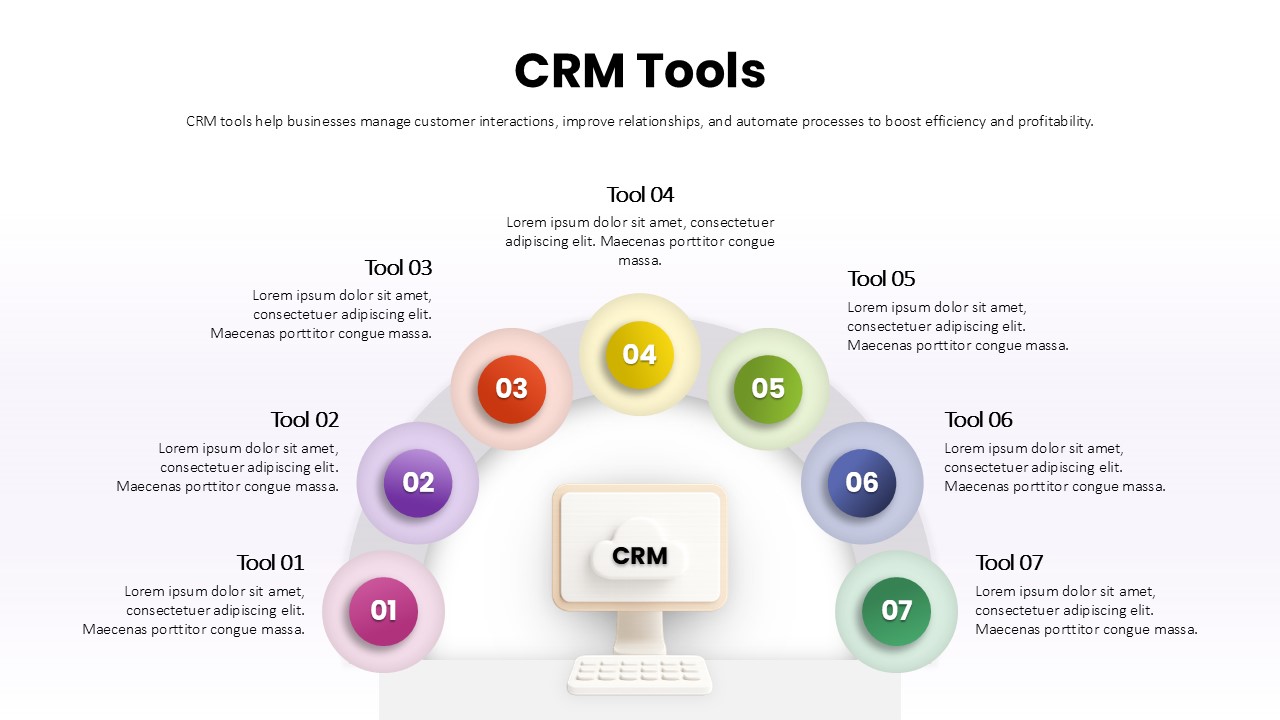
Seven-Part CRM Tools Arc Diagram Template for PowerPoint & Google Slides
Digital Marketing
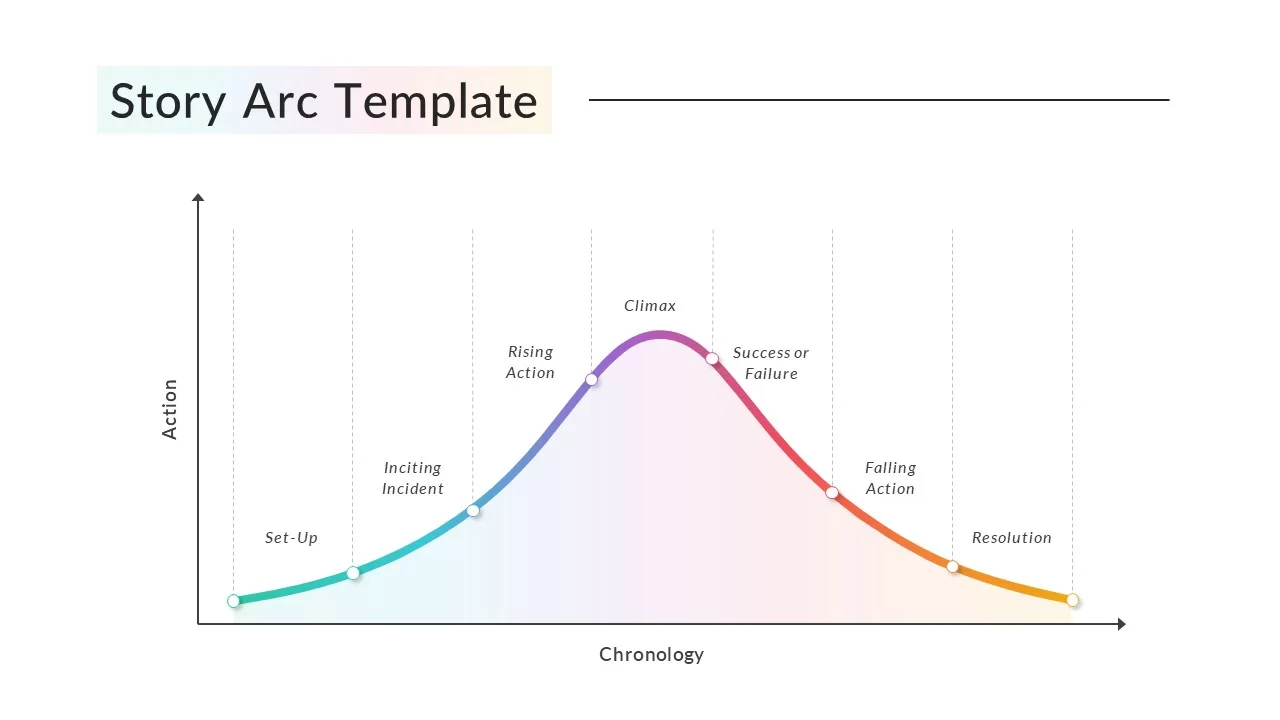
Story Arc Template
Timeline
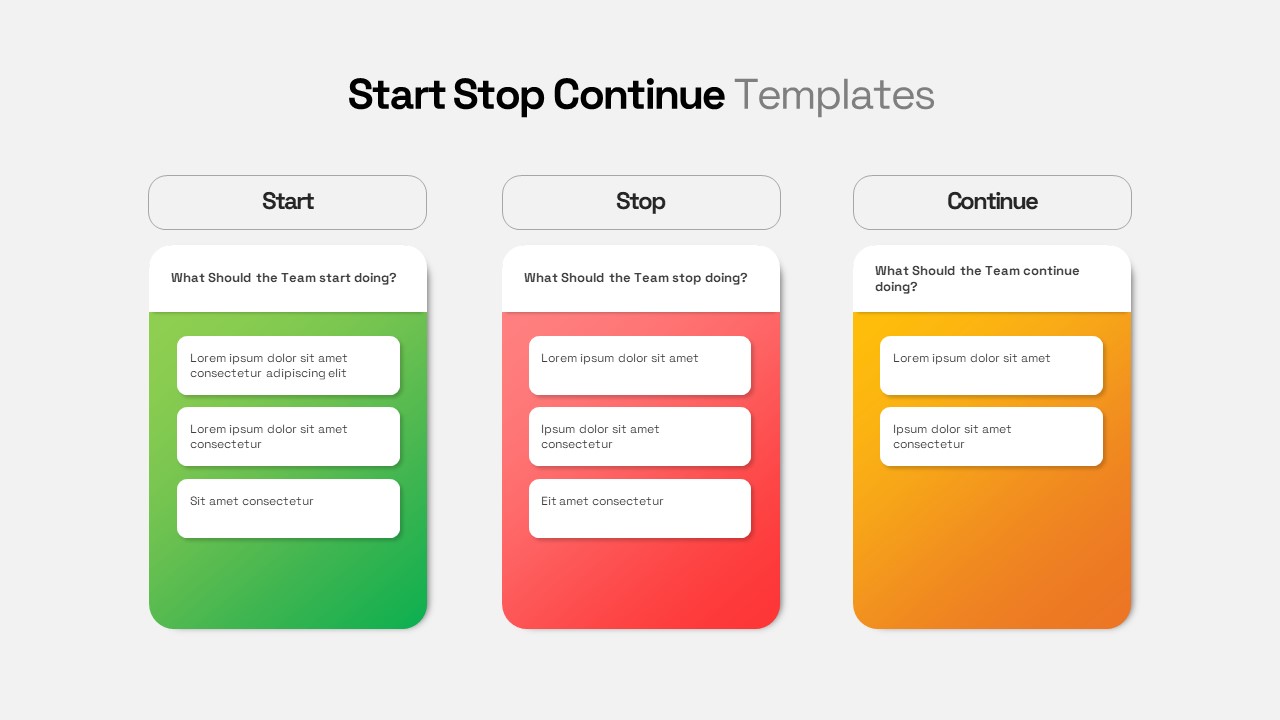
Start Stop Continue for PowerPoint & Google Slides
Business

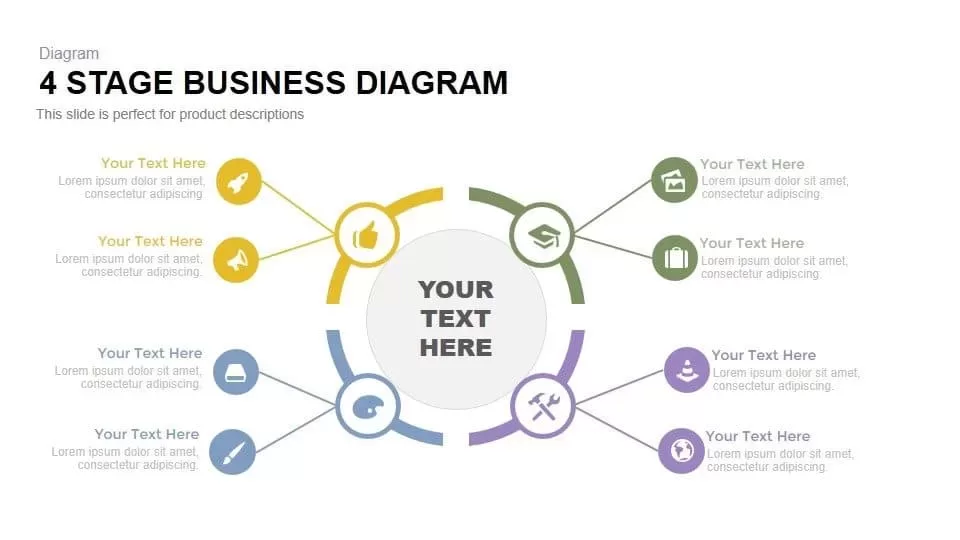
Four-Stage Business Circular Diagram Template for PowerPoint & Google Slides
Process
Professional Four-Stage Funnel Diagram Template for PowerPoint & Google Slides
Funnel
Four-Stage Linear Infographic Diagram Template for PowerPoint & Google Slides
Process
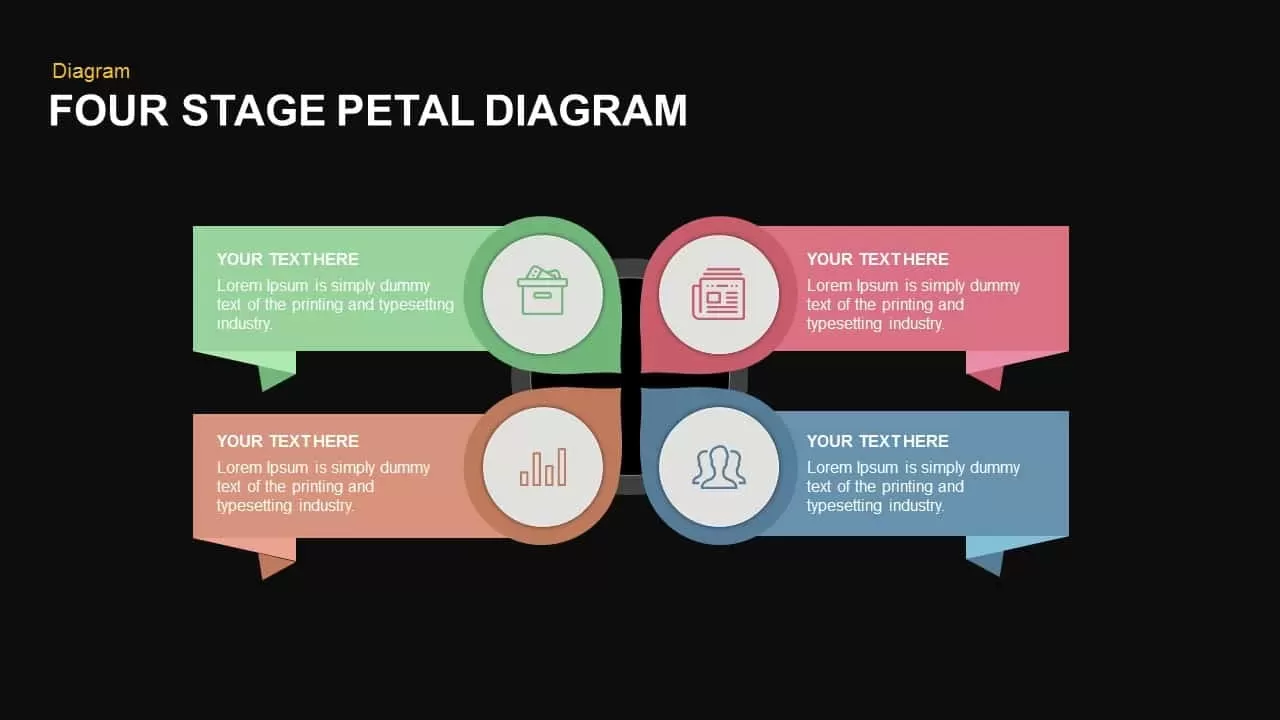
Modern Four-Stage Petal Diagram Template for PowerPoint & Google Slides
Circular
Four and Five-Stage Funnel Diagram Template for PowerPoint & Google Slides
Funnel

Modern Four Stage Gear Diagram Template for PowerPoint & Google Slides
Process
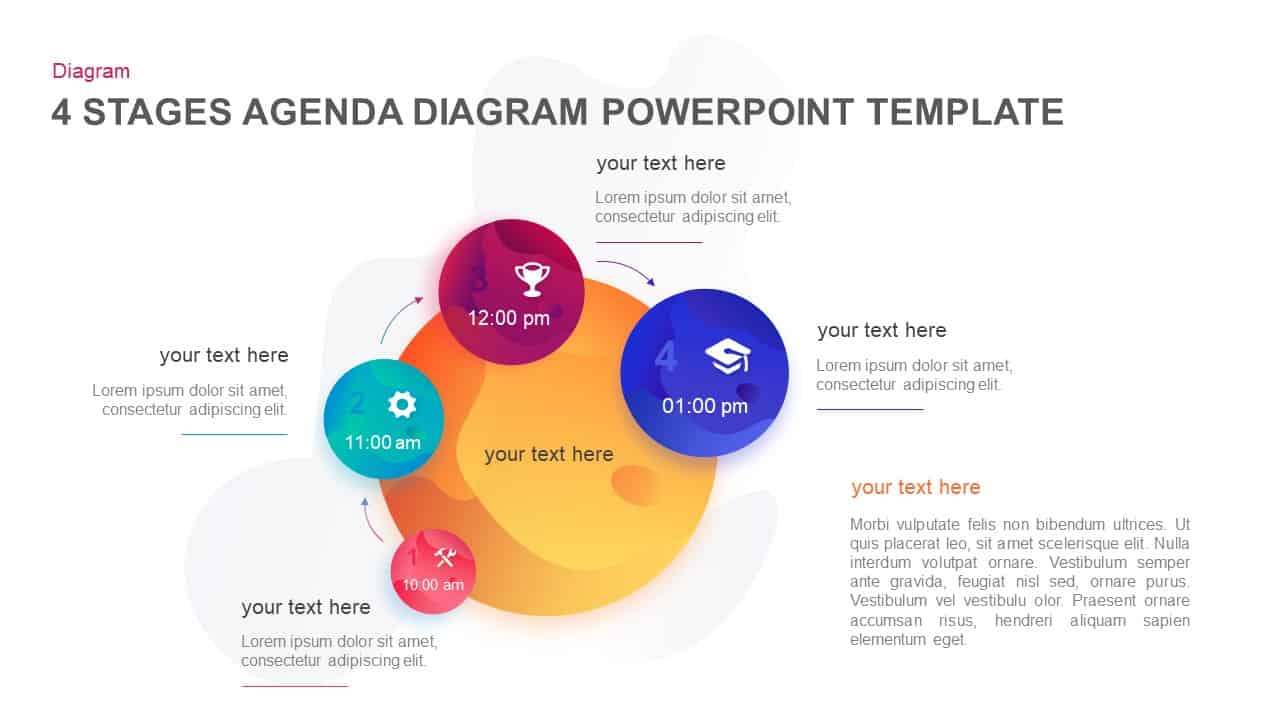
Four-Stage Agenda Circle Diagram Slide Template for PowerPoint & Google Slides
Agenda
Four-Stage Circular Diagram Infographic Template for PowerPoint & Google Slides
Circular
Four-Stage Gear Process Diagram Template for PowerPoint & Google Slides
Process
Four-Stage Cycle Process Diagram Template for PowerPoint & Google Slides
Process
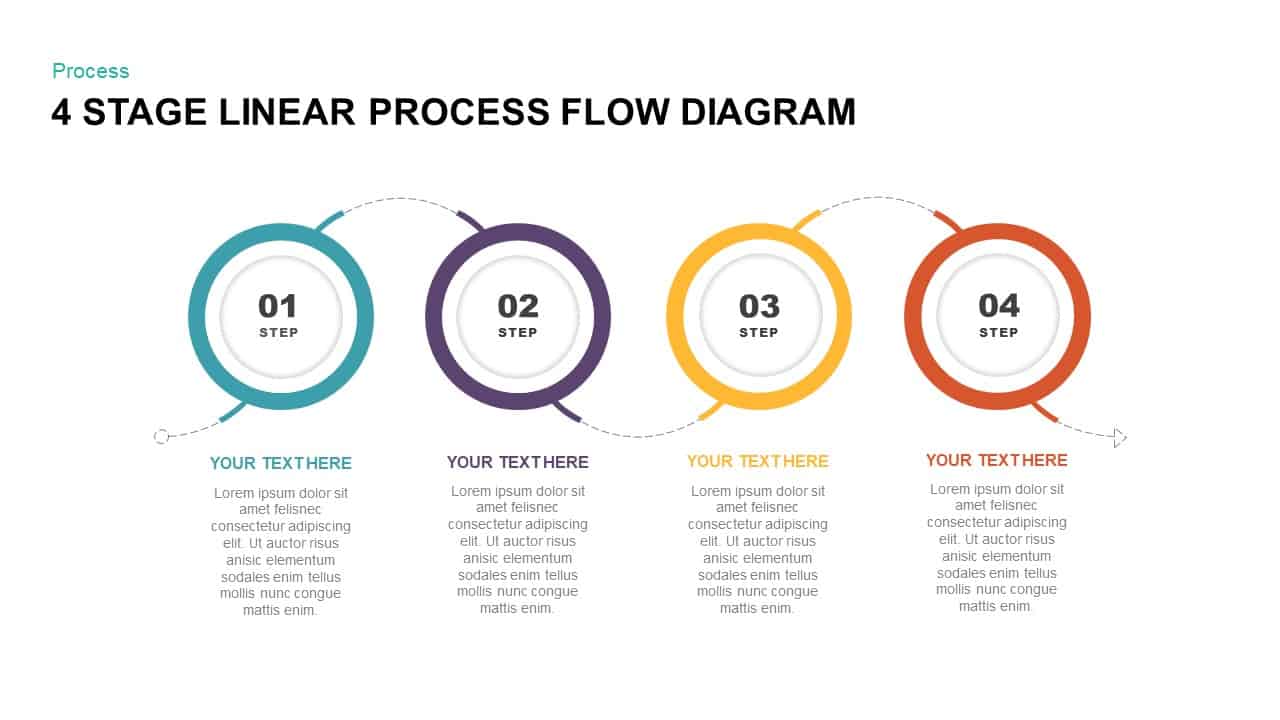
Four-Stage Linear Process Flow Diagram Template for PowerPoint & Google Slides
Process
Four-Stage Circular Flow Diagram Template for PowerPoint & Google Slides
Circular
Four-Stage Funnel Diagram Infographic Template for PowerPoint & Google Slides
Funnel
Four-Stage Funnel Diagram Infographic Template for PowerPoint & Google Slides
Funnel
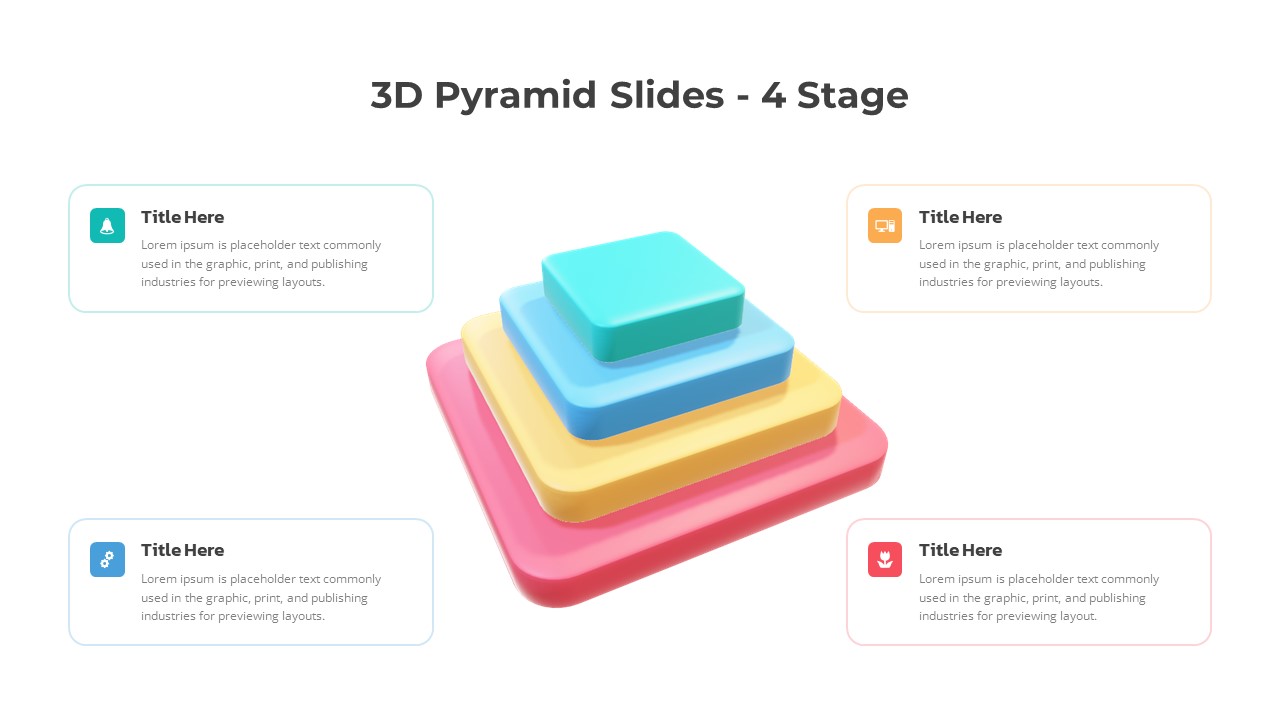
3D Four-Stage Pyramid Diagram Template for PowerPoint & Google Slides
Pyramid
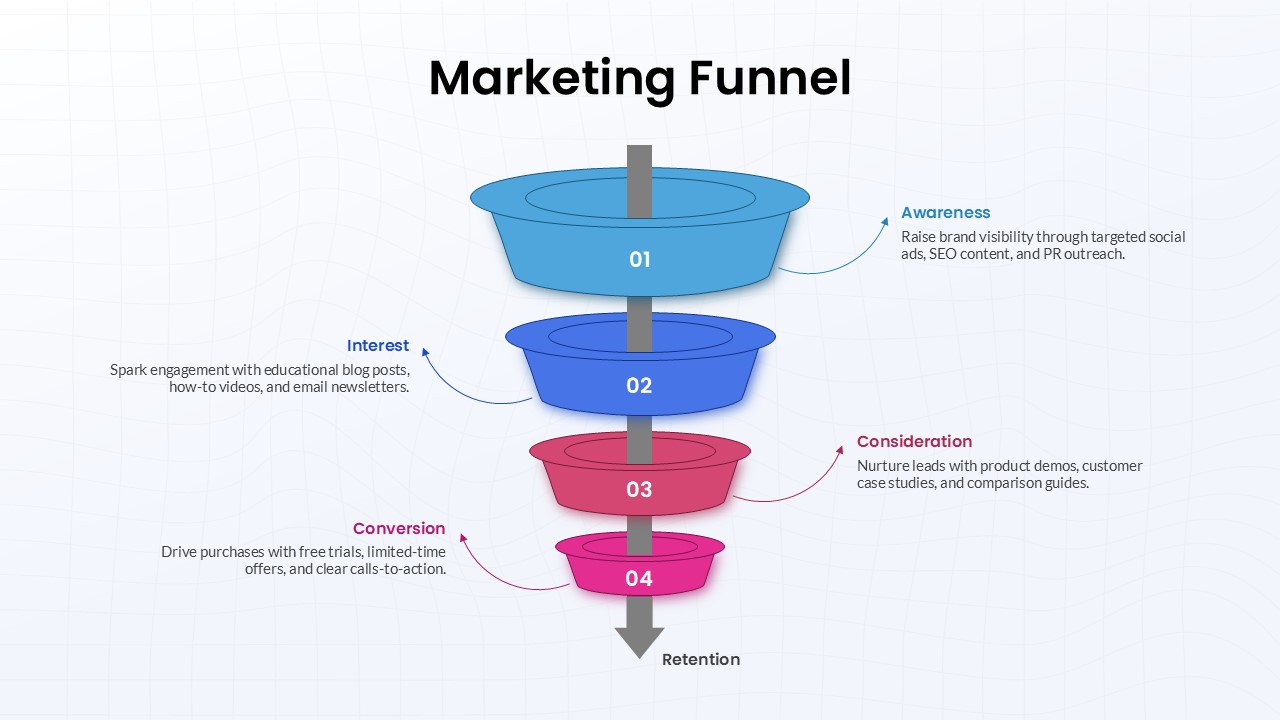
Four-Stage Marketing Funnel Diagram Template for PowerPoint & Google Slides
Marketing Funnel
Three Four Five Stage Timeline Infographic Template for PowerPoint & Google Slides
Timeline
Colorful Four-Stage Infographic Process Template for PowerPoint & Google Slides
Process
Four-Stage Circular Process Flow Template for PowerPoint & Google Slides
Process
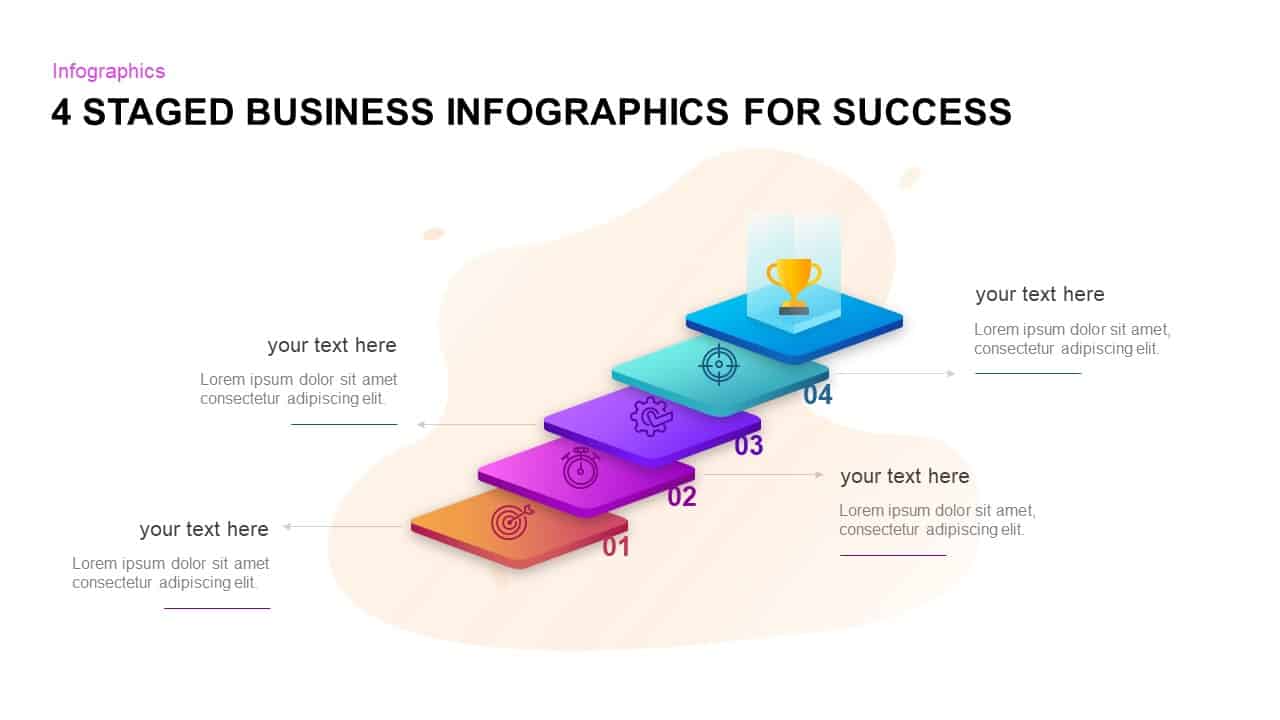
Four-Stage Business Success Infographic Template for PowerPoint & Google Slides
Process
Four-Stage Cylinder Agenda Slide Template for PowerPoint & Google Slides
Agenda
Four-Stage Business Planning Table Template for PowerPoint & Google Slides
Business Plan
Four-Stage Process Cycle PowerPoint Template
Process
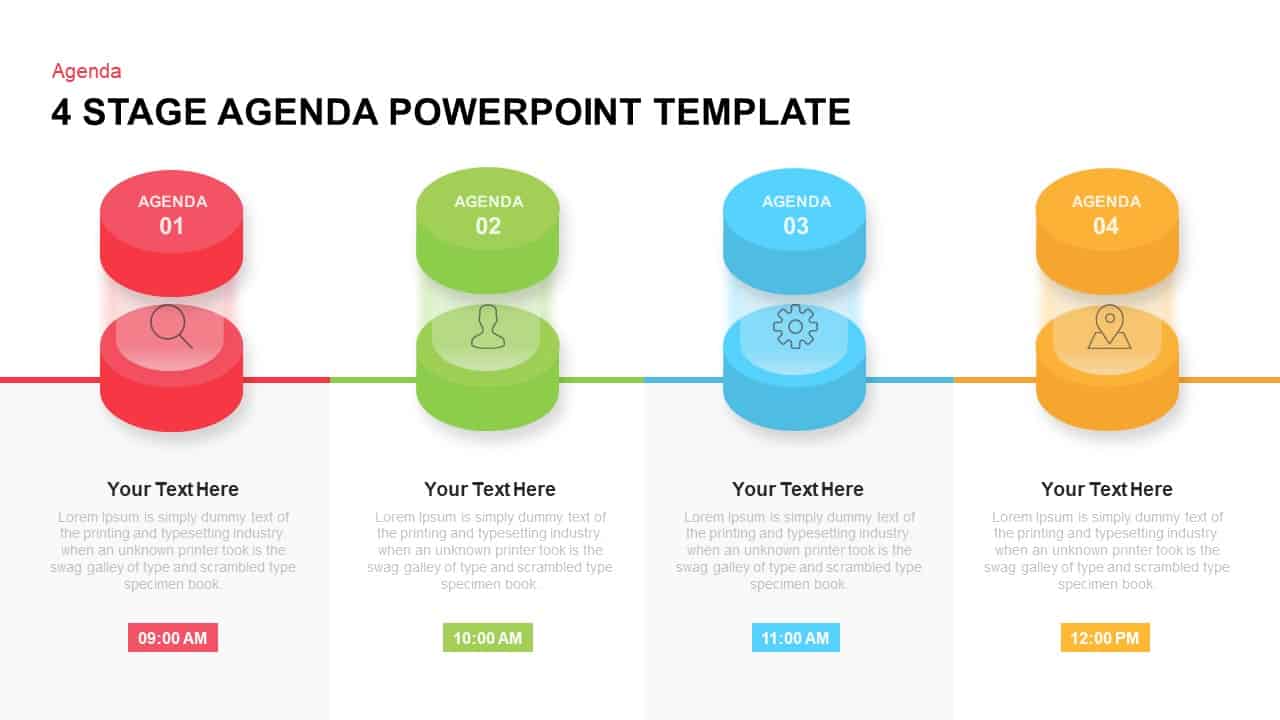
Four-Stage Agenda Infographic Slide Template for PowerPoint & Google Slides
Agenda
Four-Stage Communication Skills Diamond Template for PowerPoint & Google Slides
Circular
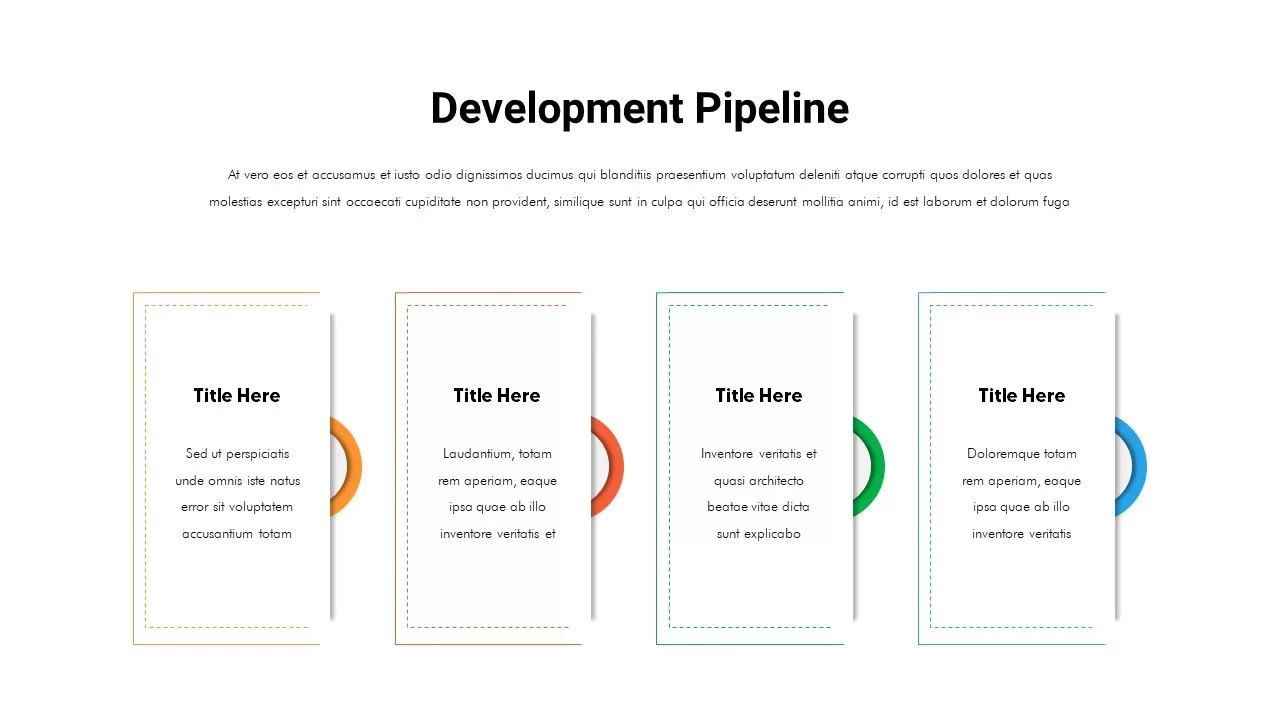
Four-Stage Development Pipeline Template for PowerPoint & Google Slides
Process
Four-Stage Circle Arrow Infographic Template for PowerPoint & Google Slides
Circular
Four-Stage Circle Arrow Infographic Template for PowerPoint & Google Slides
Circular
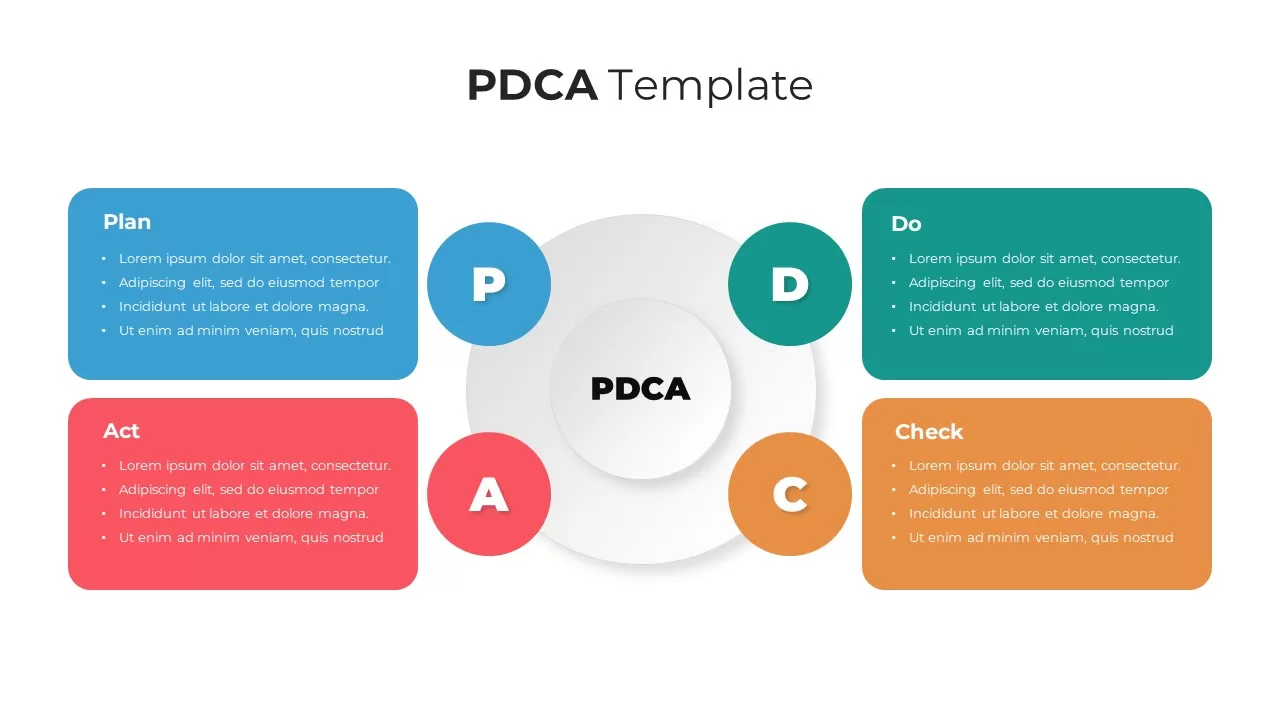
PDCA Four-Stage Cycle Infographic Template for PowerPoint & Google Slides
Process
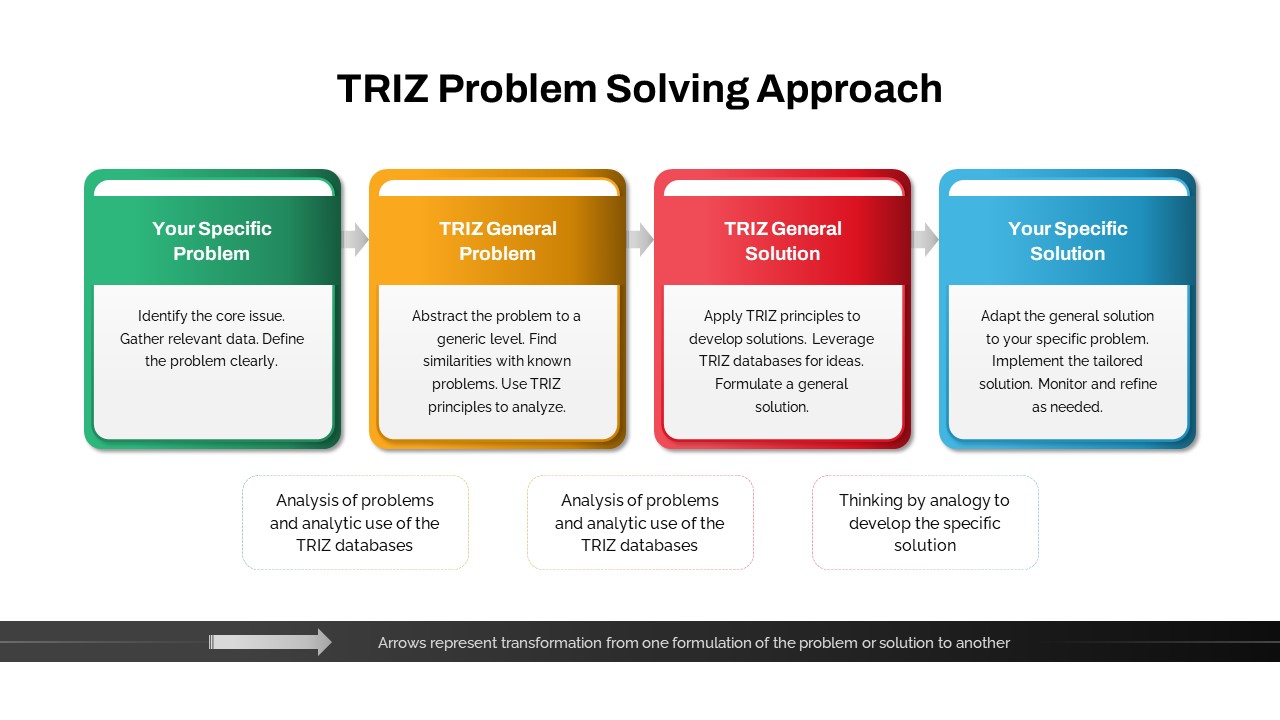
TRIZ Four-Stage Problem Solving Approach Template for PowerPoint & Google Slides
Process
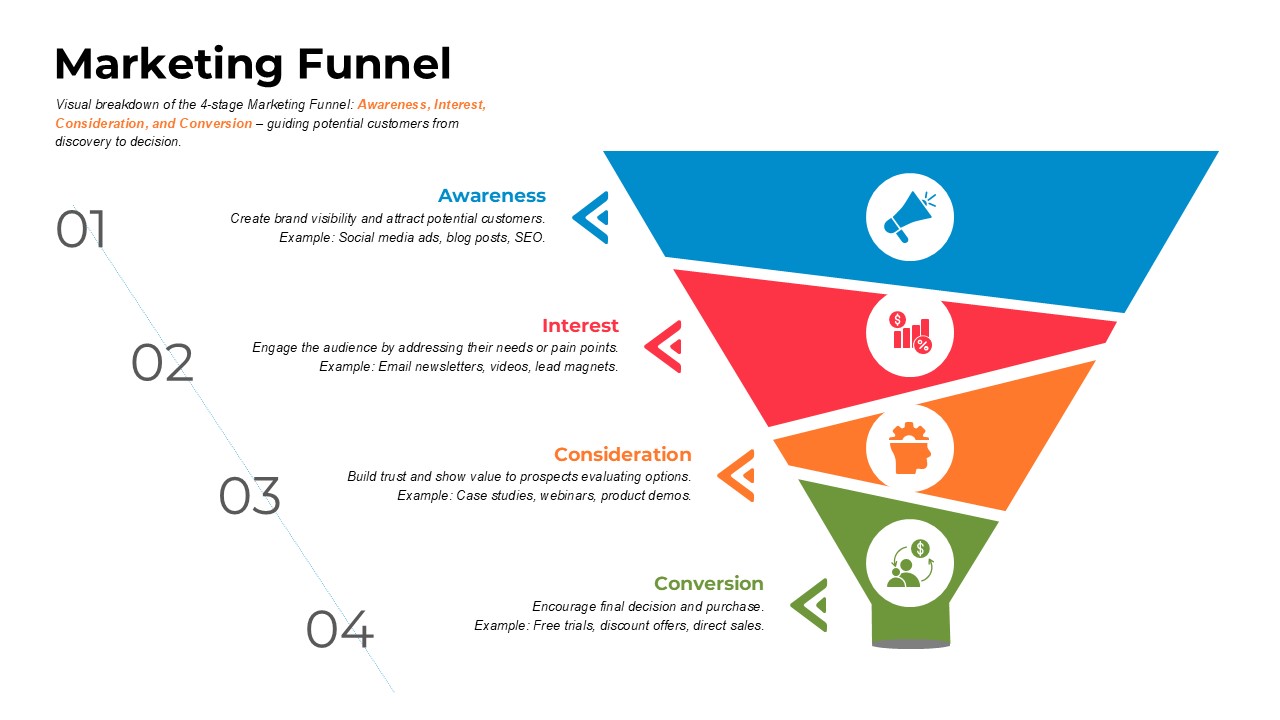
Four-Stage Marketing Funnel Template for PowerPoint & Google Slides
Marketing Funnel
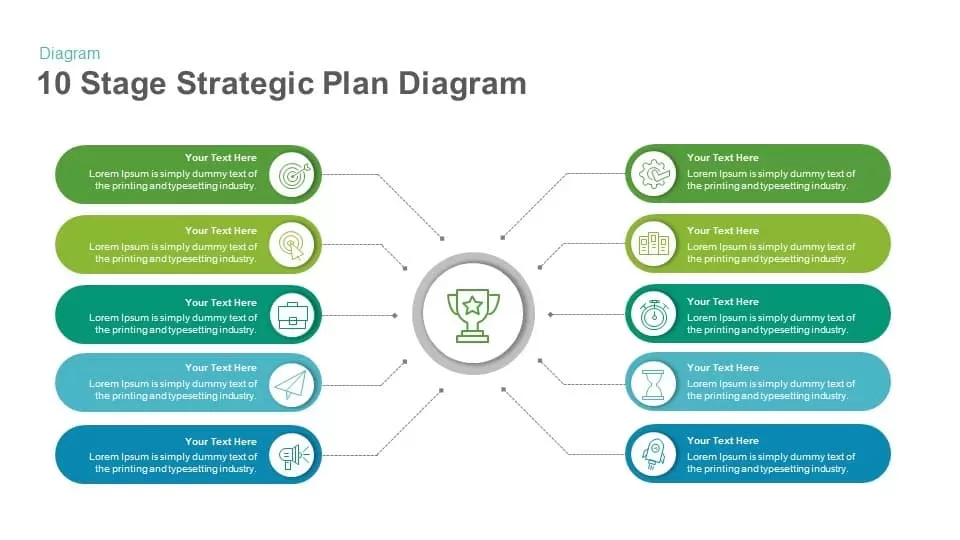
10 Stage Strategic Plan Diagram template for PowerPoint & Google Slides
Process
Four-Plan Pricing Table Comparison Template for PowerPoint & Google Slides
Comparison
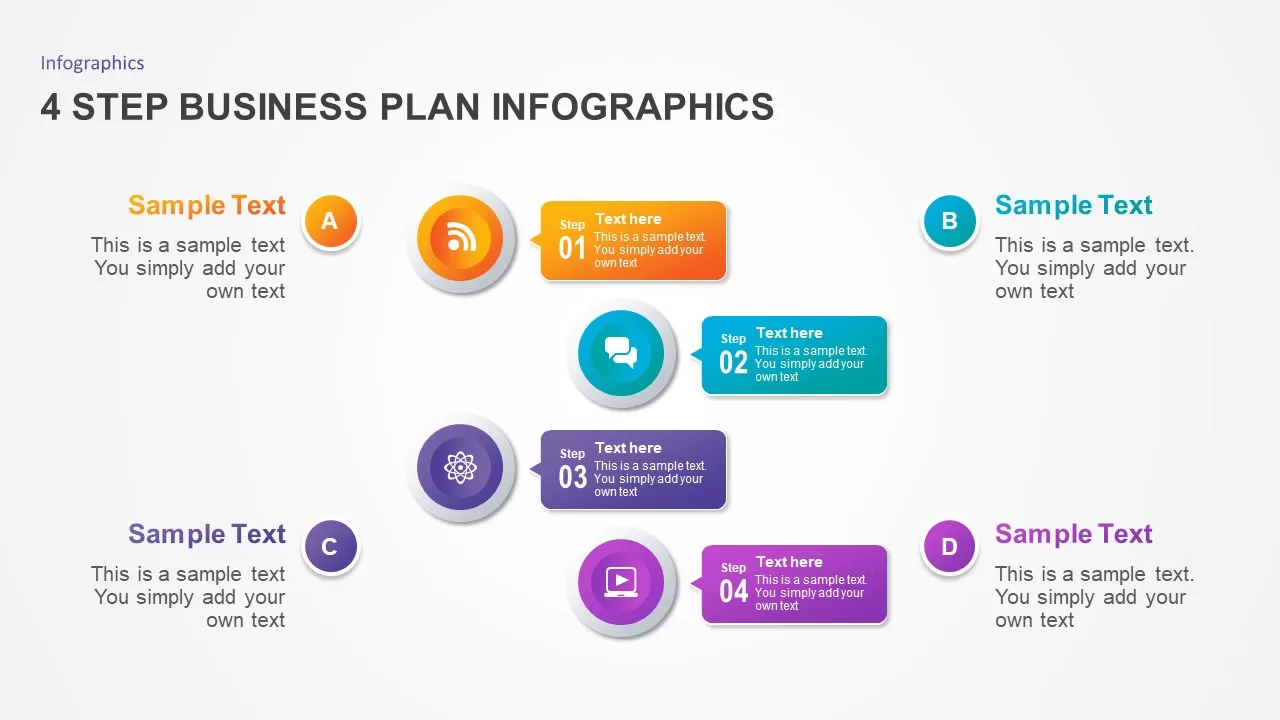
Four-Step Business Plan Infographics Template for PowerPoint & Google Slides
Business Plan
3D Four Arrow Infographics Diagram Template for PowerPoint & Google Slides
Arrow
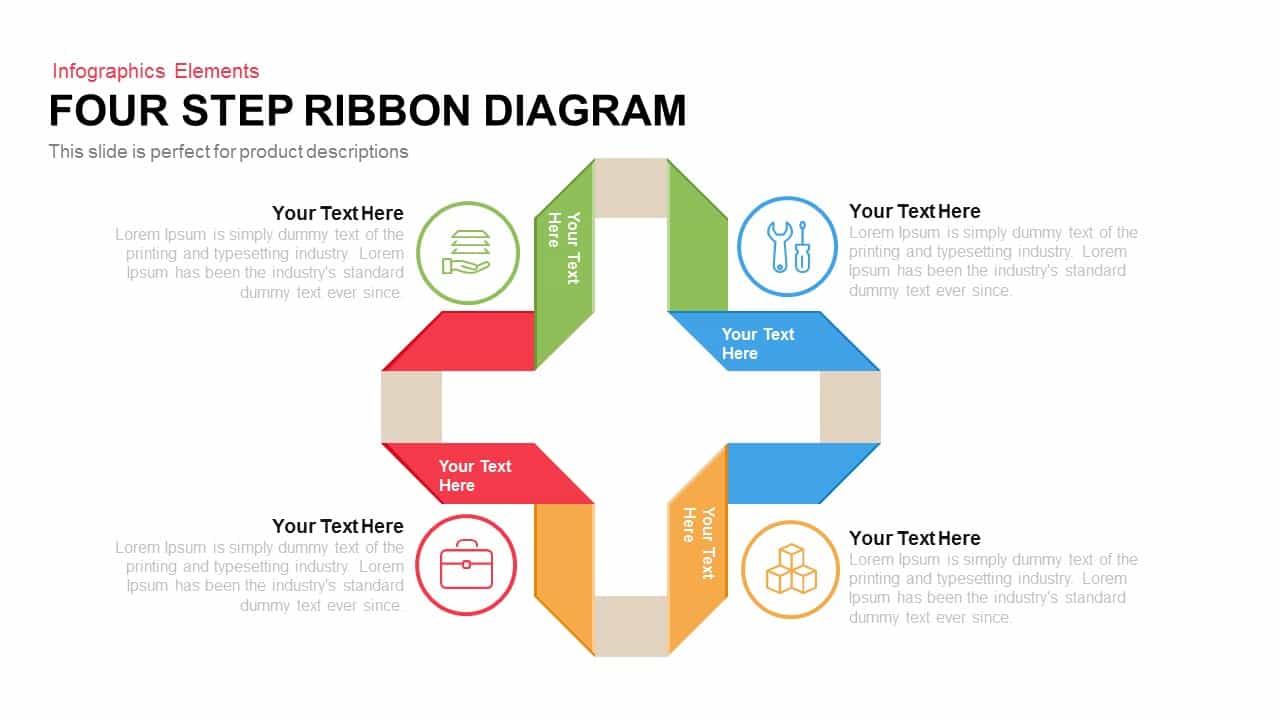
Four Step Ribbon Diagram Template for PowerPoint & Google Slides
Infographics
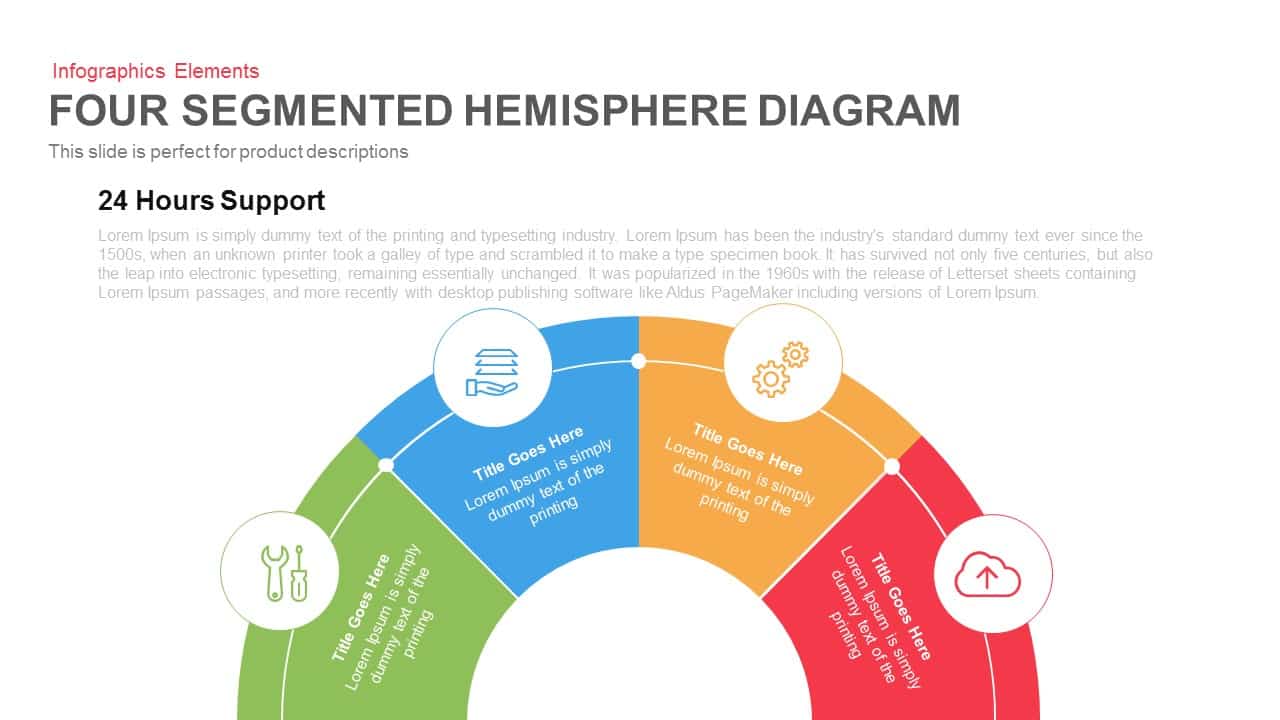
Four Segmented Hemisphere Diagram Template for PowerPoint & Google Slides
Process
Diamond Mind Map Diagram Four Branches Template for PowerPoint & Google Slides
Mind Maps
Four Section Comparison Chart Diagram Template for PowerPoint & Google Slides
Infographics
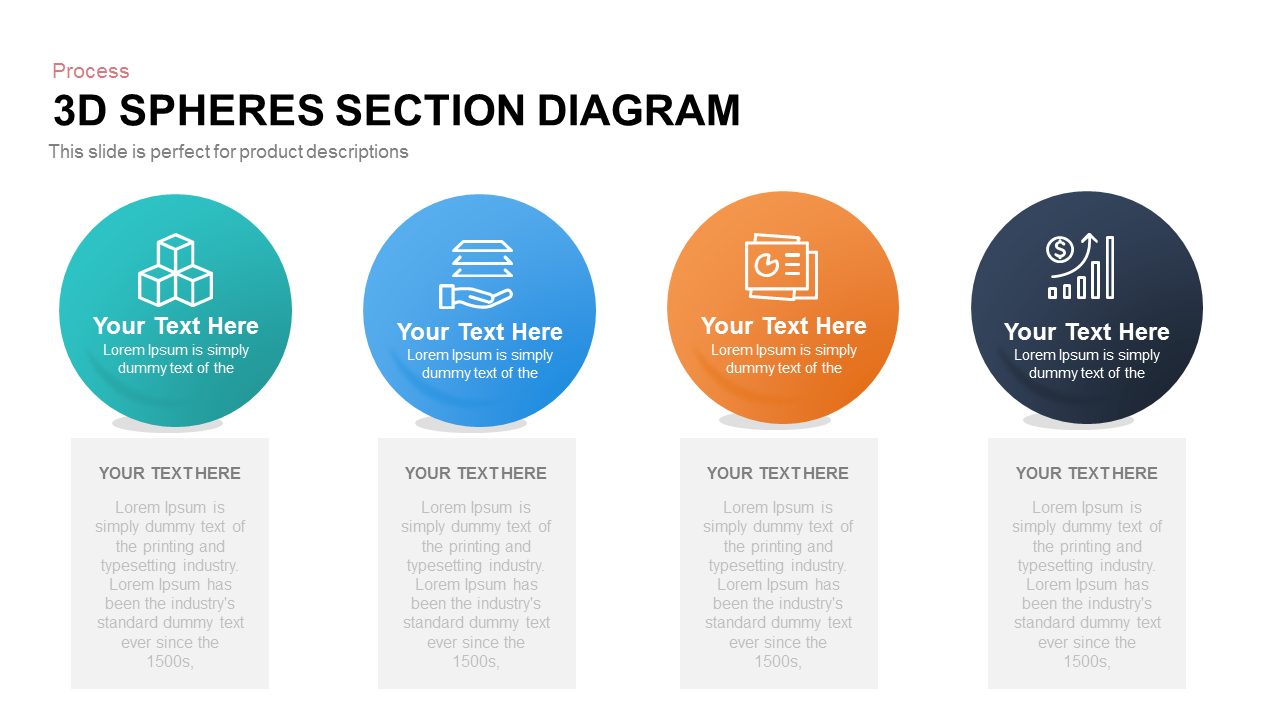
Four-Part 3D Spheres Section Diagram template for PowerPoint & Google Slides
Process
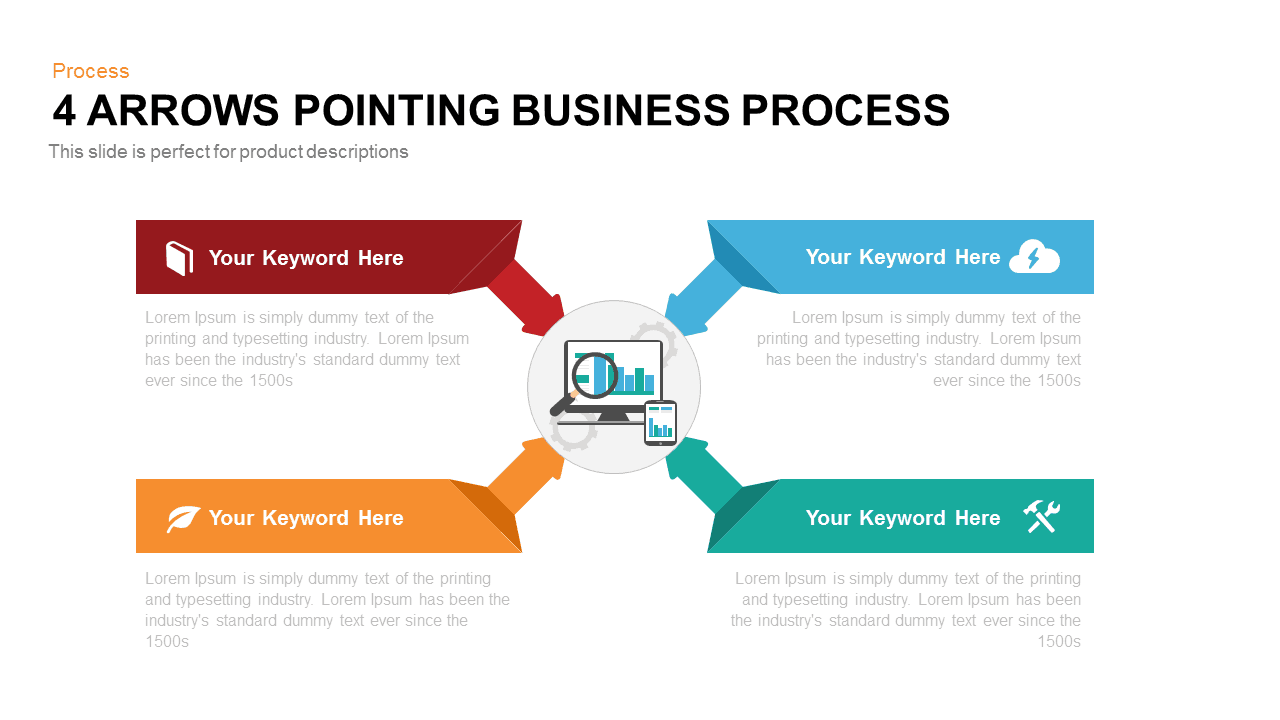
Four Arrows Business Process Diagram template for PowerPoint & Google Slides
Process
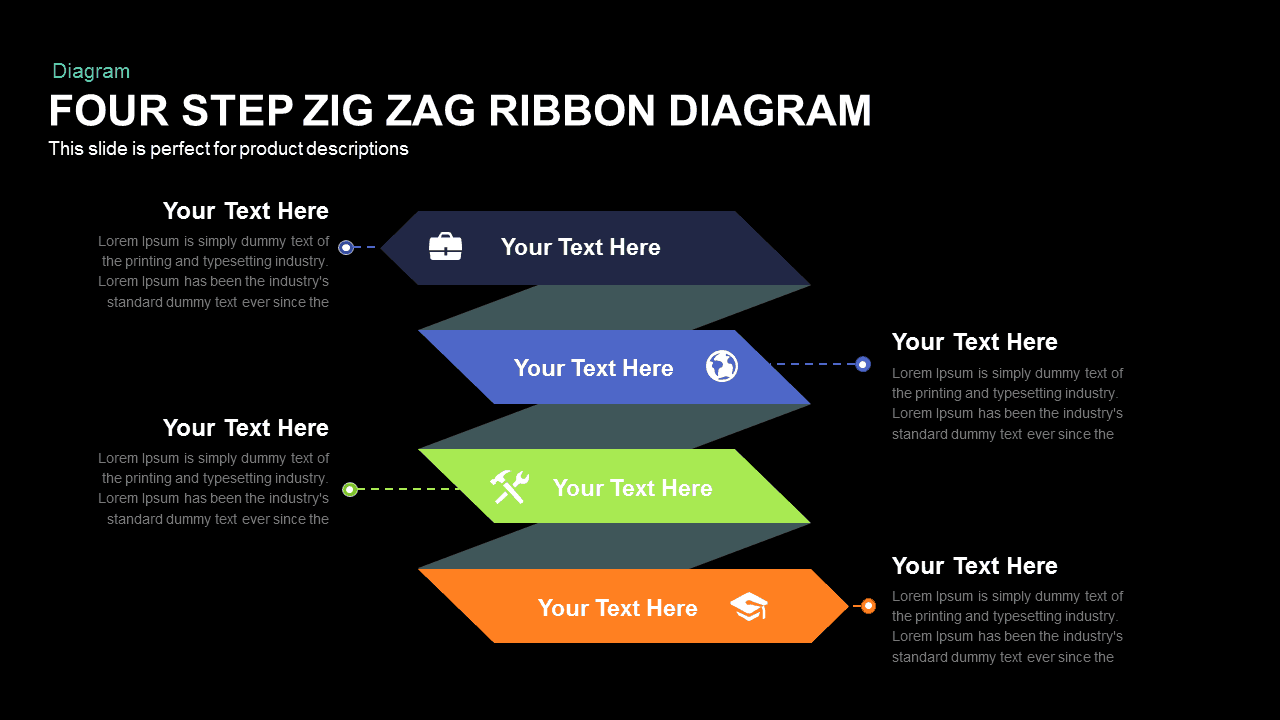
Four-Step Zigzag Ribbon Diagram template for PowerPoint & Google Slides
Arrow
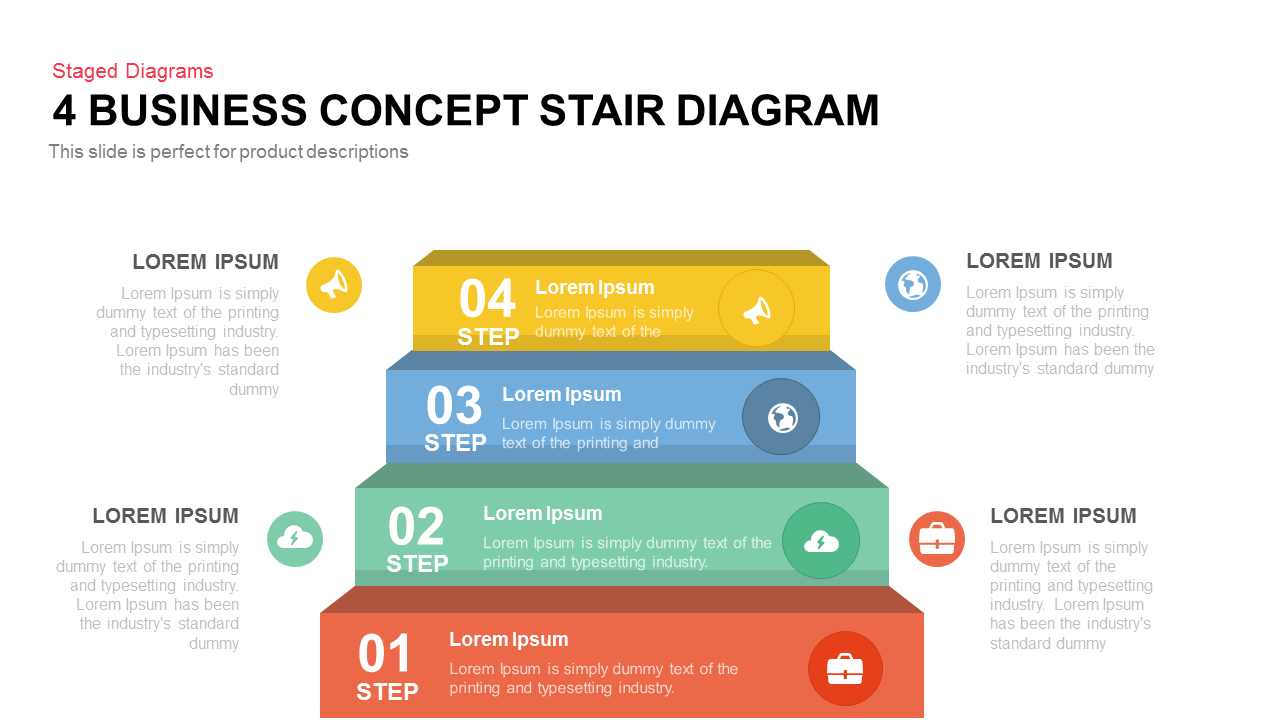
Four-Step Business Staircase Diagram template for PowerPoint & Google Slides
Process

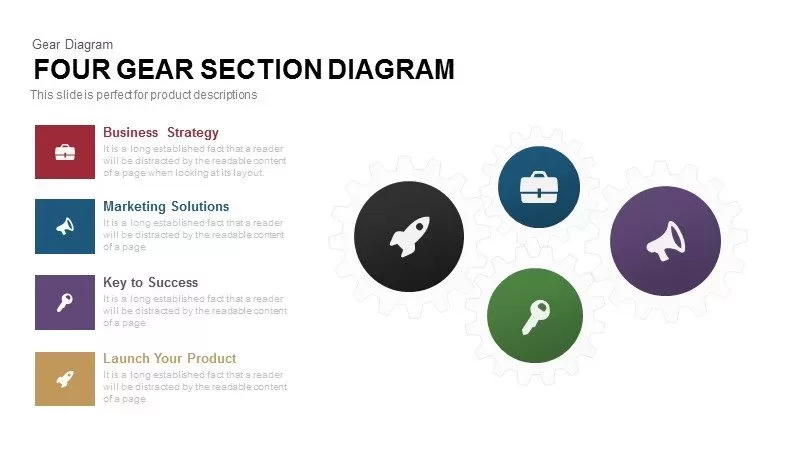
Four Gear Section Diagram Template for PowerPoint & Google Slides
Circular
Four-Circle Venn Process Diagram template for PowerPoint & Google Slides
Process
Pie Segment Diagram Four-Step Process Template for PowerPoint & Google Slides
Pie/Donut
Four Directional Arrow Diagram Template for PowerPoint & Google Slides
Arrow
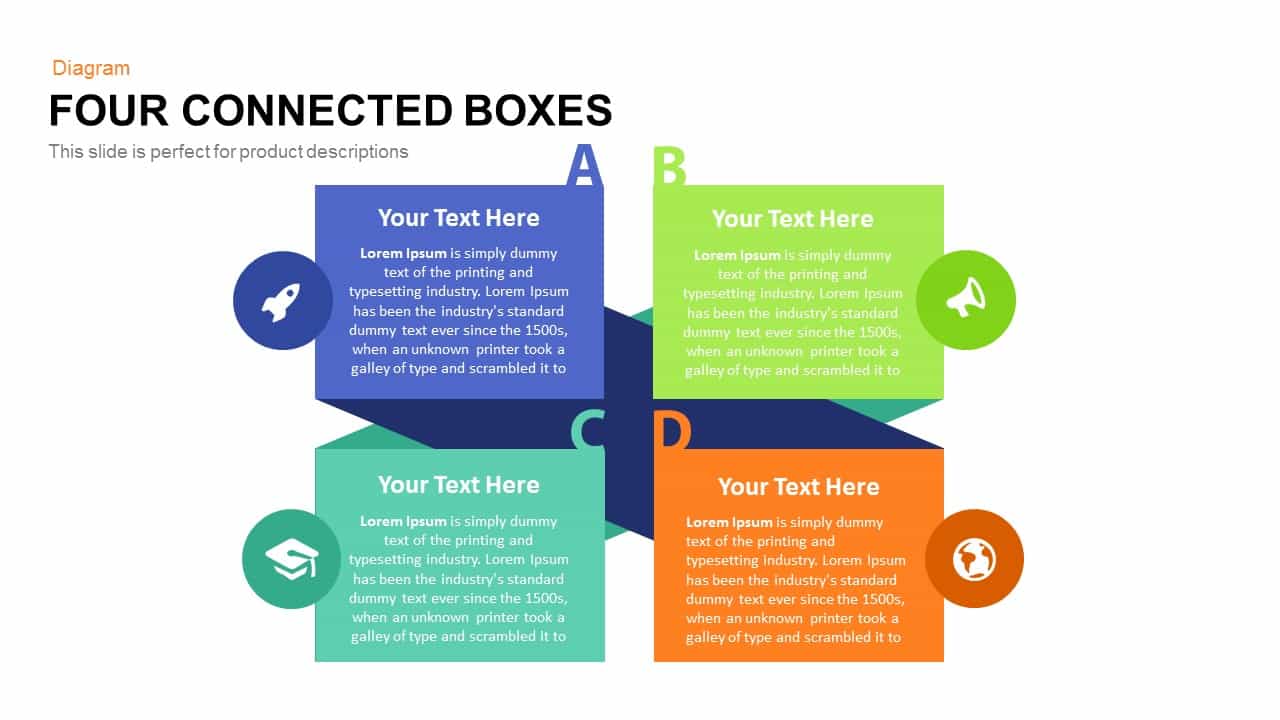
4 Connected Box PowerPoint Template and Keynote Diagram
Business Models
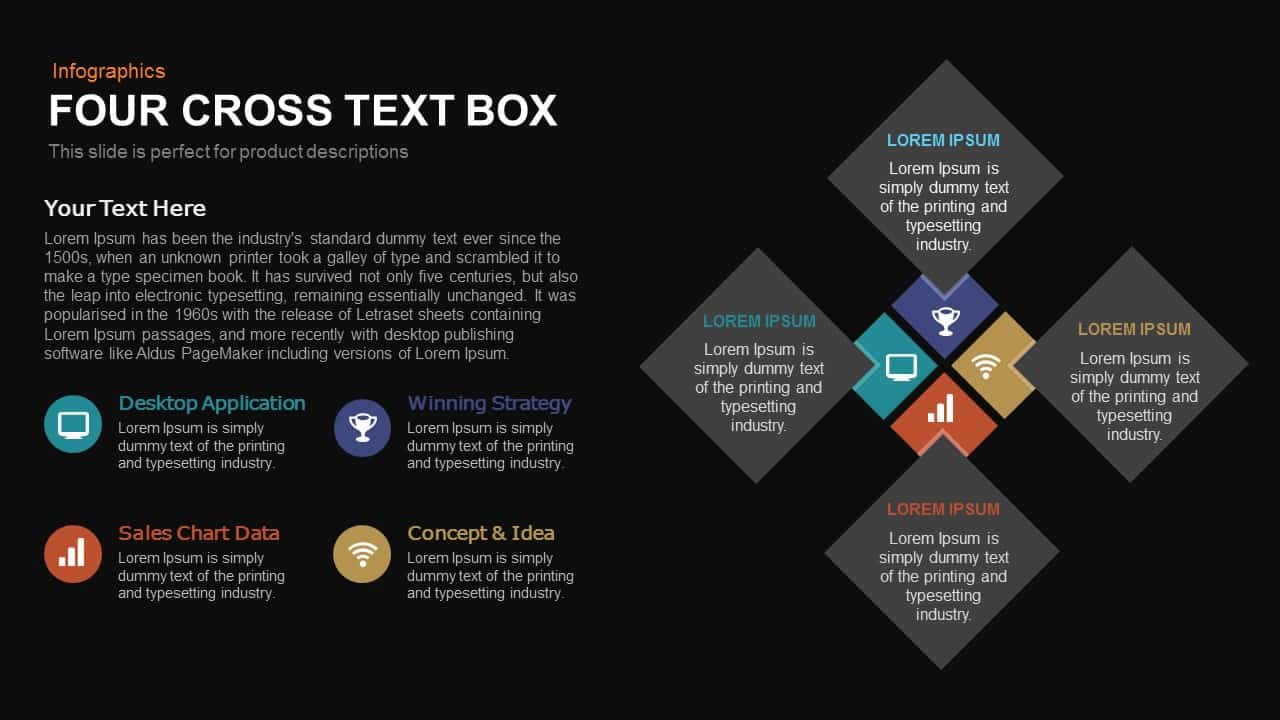
Four-Cross Text Box Diagram Template for PowerPoint & Google Slides
Comparison
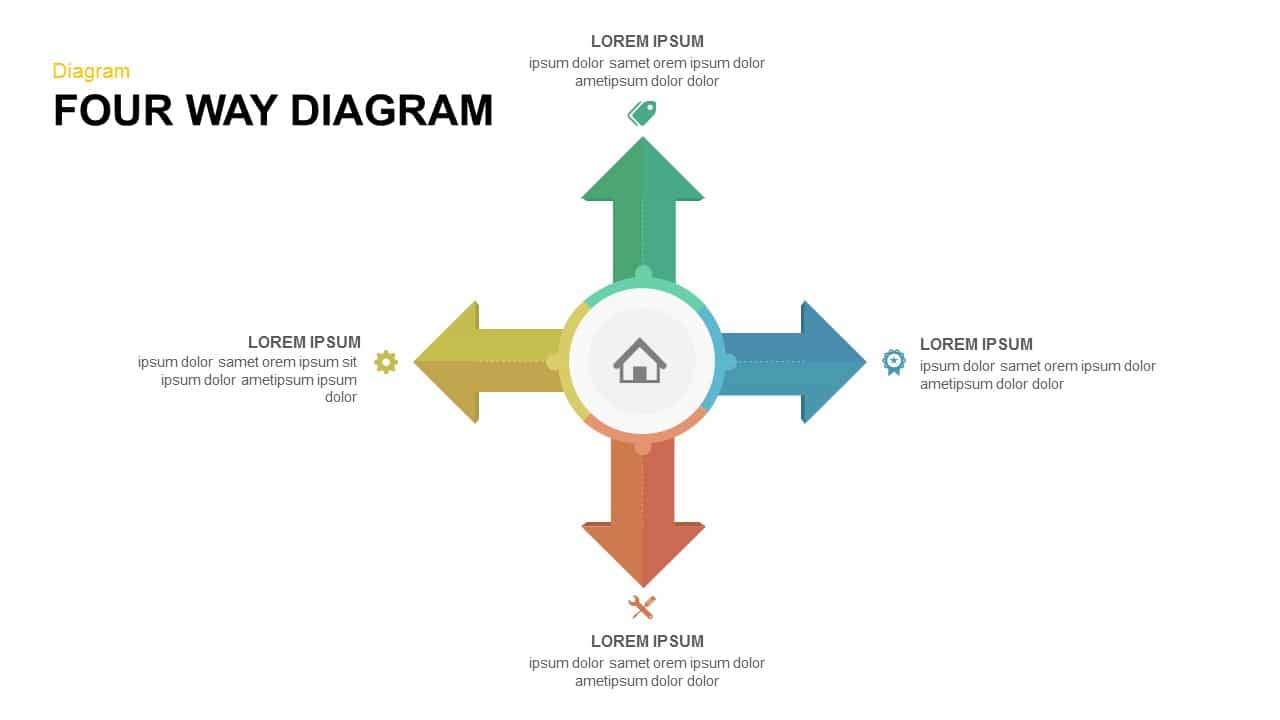
Four-Way Directional Arrow Diagram Template for PowerPoint & Google Slides
Arrow
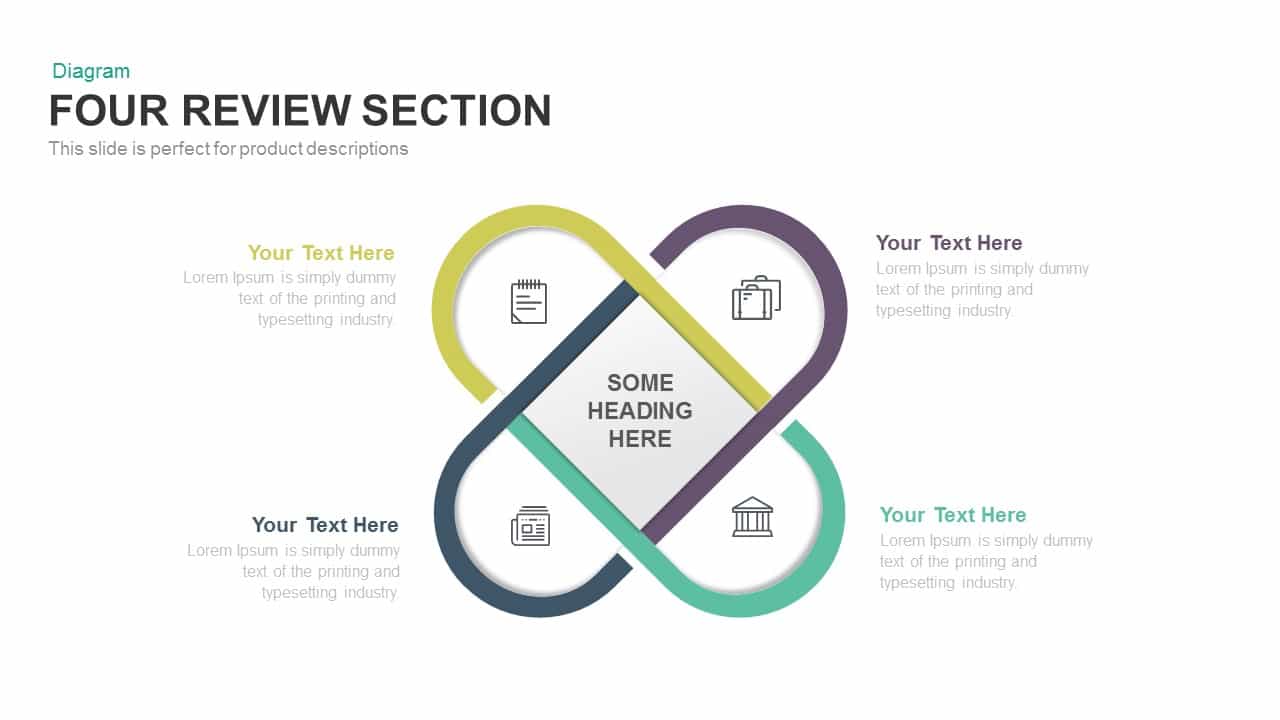
Clean Four-Section Review Diagram Template for PowerPoint & Google Slides
Agenda
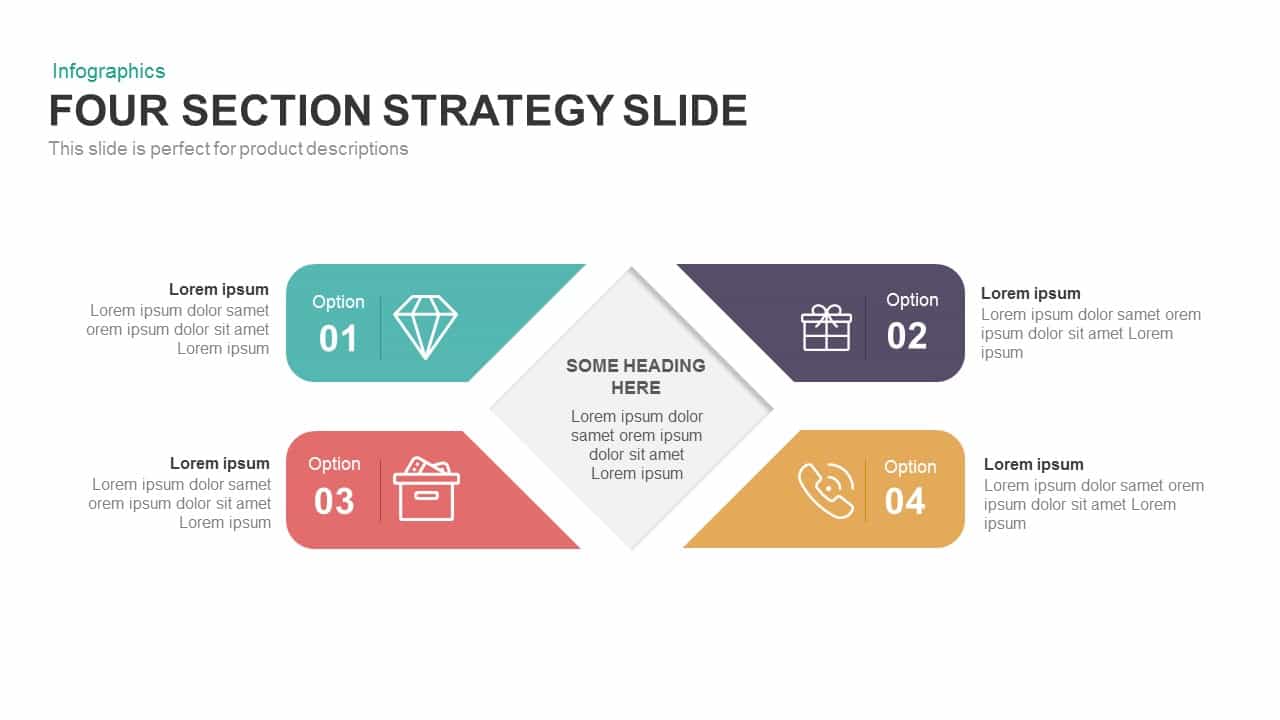
Four Section Strategy PowerPoint Template
Business Strategy
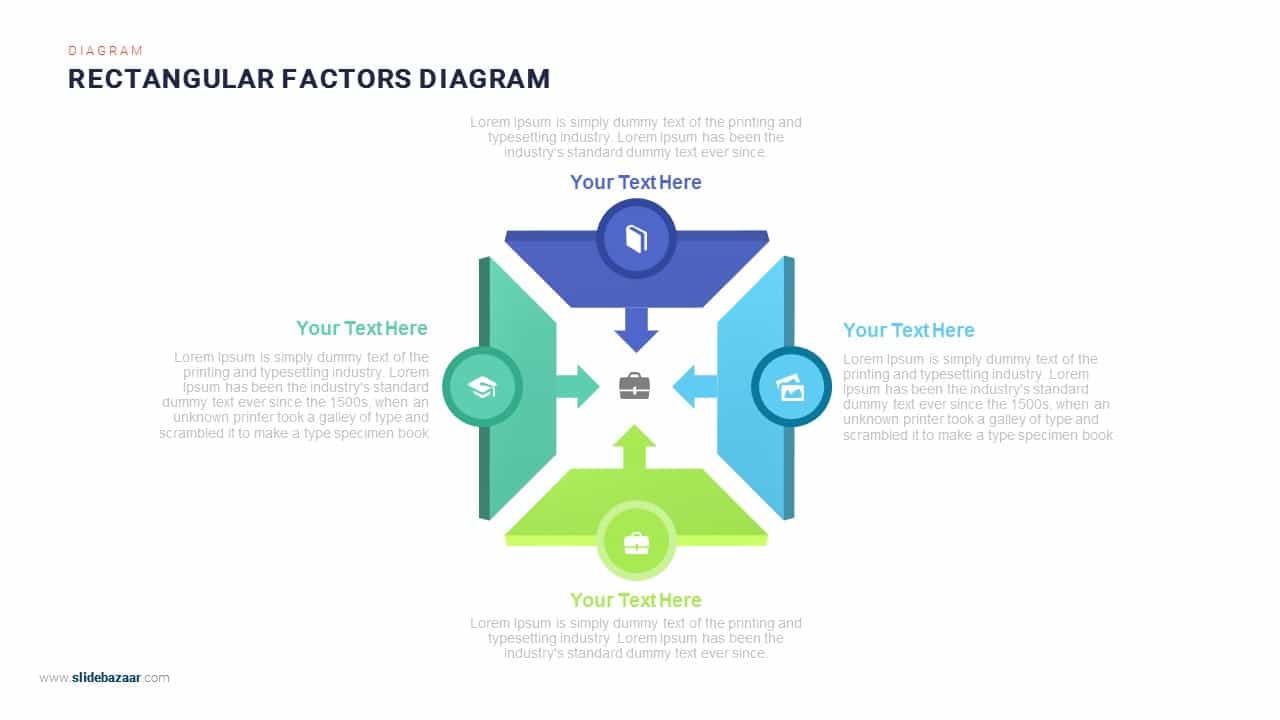
Four-Arrows Rectangular Factors Diagram Template for PowerPoint & Google Slides
Process
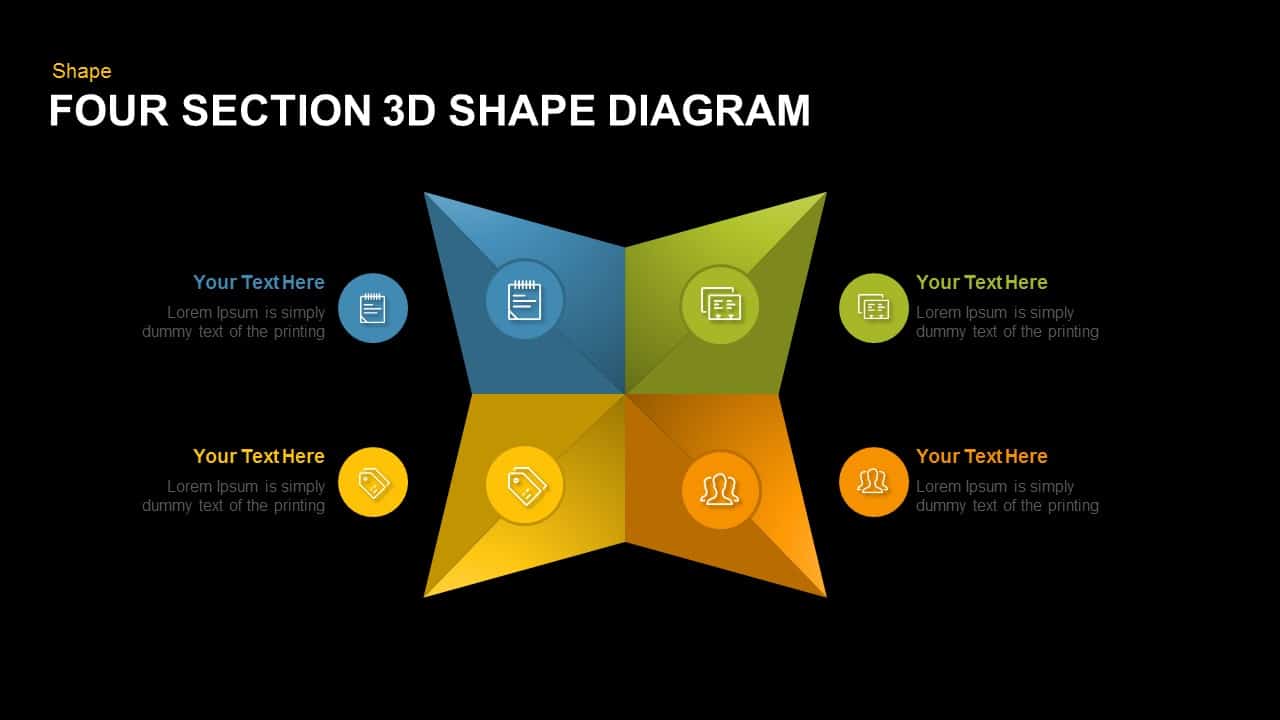
Editable Four-Section 3D Shape Diagram Template for PowerPoint & Google Slides
Comparison
Four-Circle Hub and Spoke Diagram Template for PowerPoint & Google Slides
Process

Flat Four-Box Business Layout Diagram Template for PowerPoint & Google Slides
Process
Four Section Diagram template for PowerPoint & Google Slides
Process
Four-Section Arrow Infographic Diagram Template for PowerPoint & Google Slides
Arrow
Four-Point Arrow Cycle Diagram Template for PowerPoint & Google Slides
Arrow
Four-Level Business Pyramid Diagram Template for PowerPoint & Google Slides
Pyramid
Four Section Circular Text Boxes Diagram Template for PowerPoint & Google Slides
Circular
Four-Staged Business Arrow Diagram Template for PowerPoint & Google Slides
Process
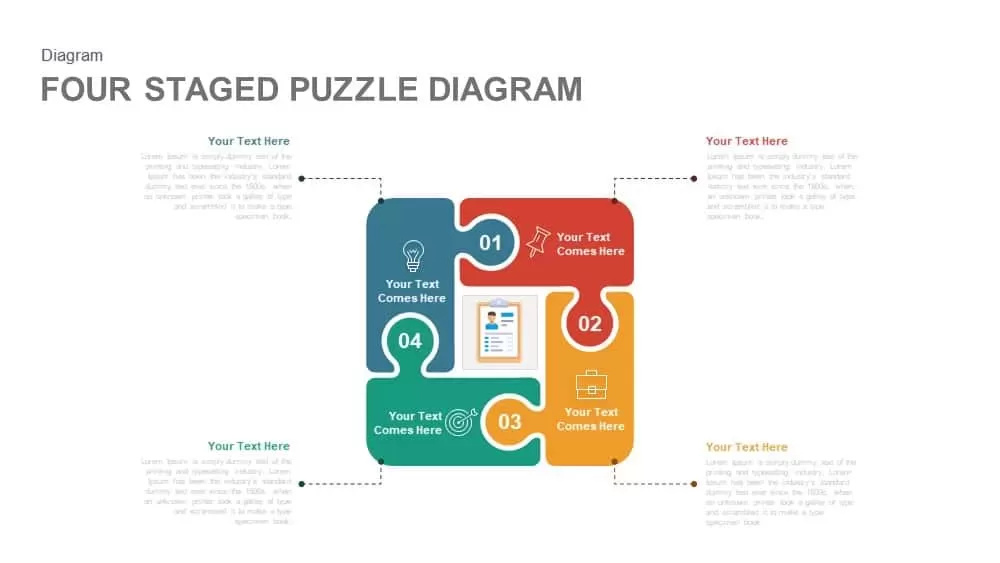
Four-Staged Puzzle Diagram Slide Template for PowerPoint & Google Slides
Process

Four-Plus Process Flow Diagram Template for PowerPoint & Google Slides
Process
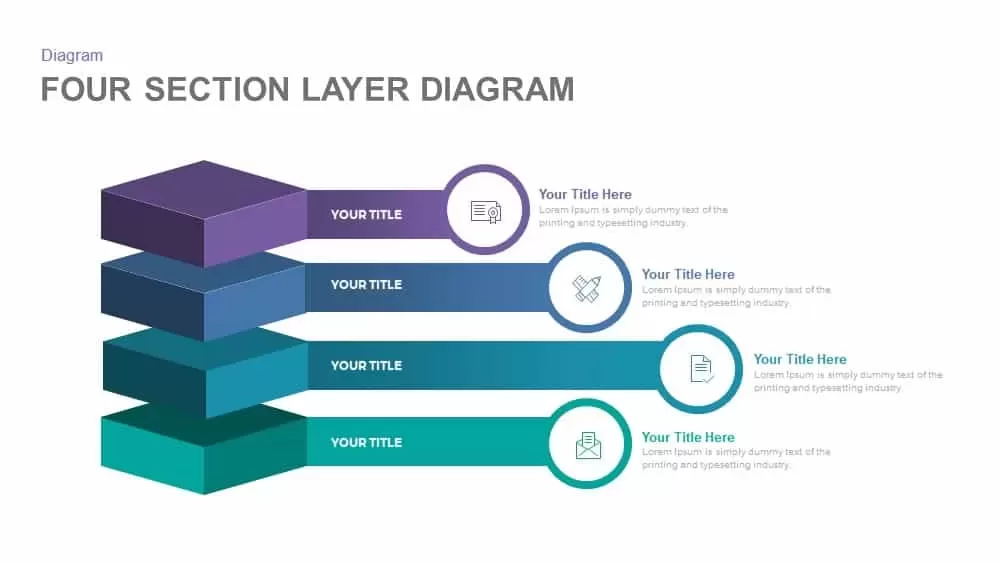
4 Section Layer PowerPoint Template and Google Slides
Process
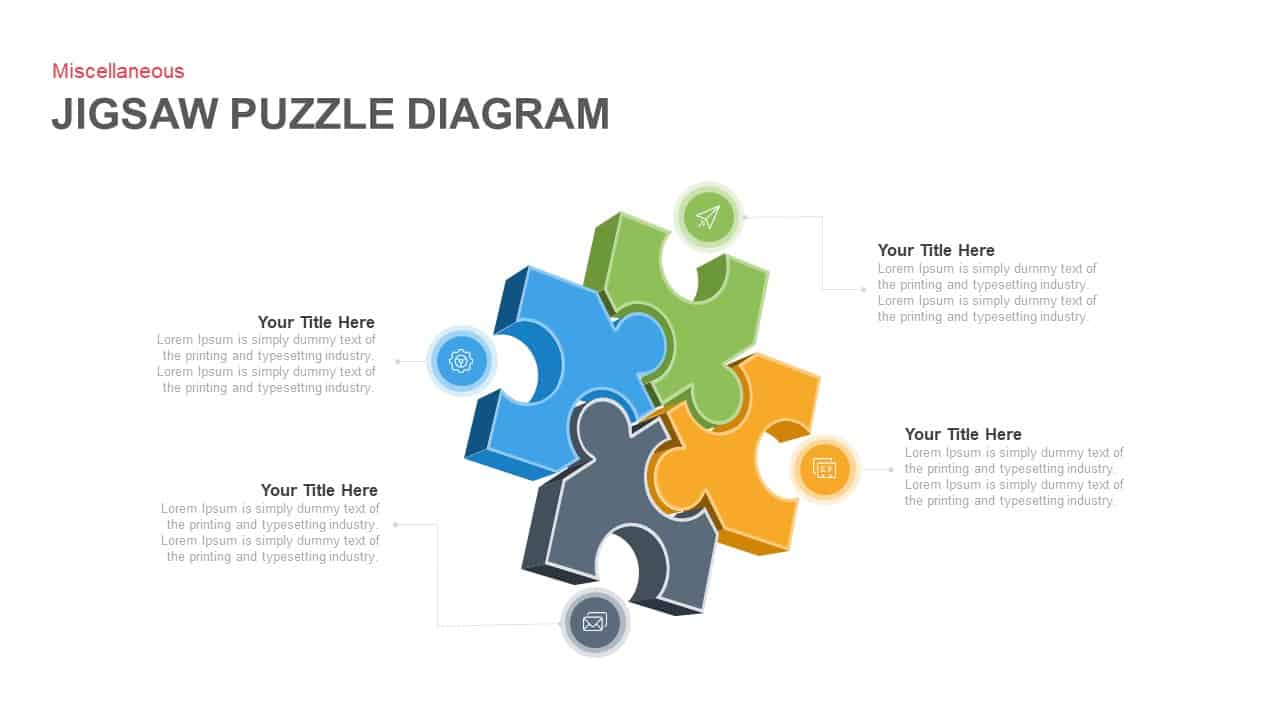
Four-Piece Jigsaw Puzzle Diagram Template for PowerPoint & Google Slides
Process
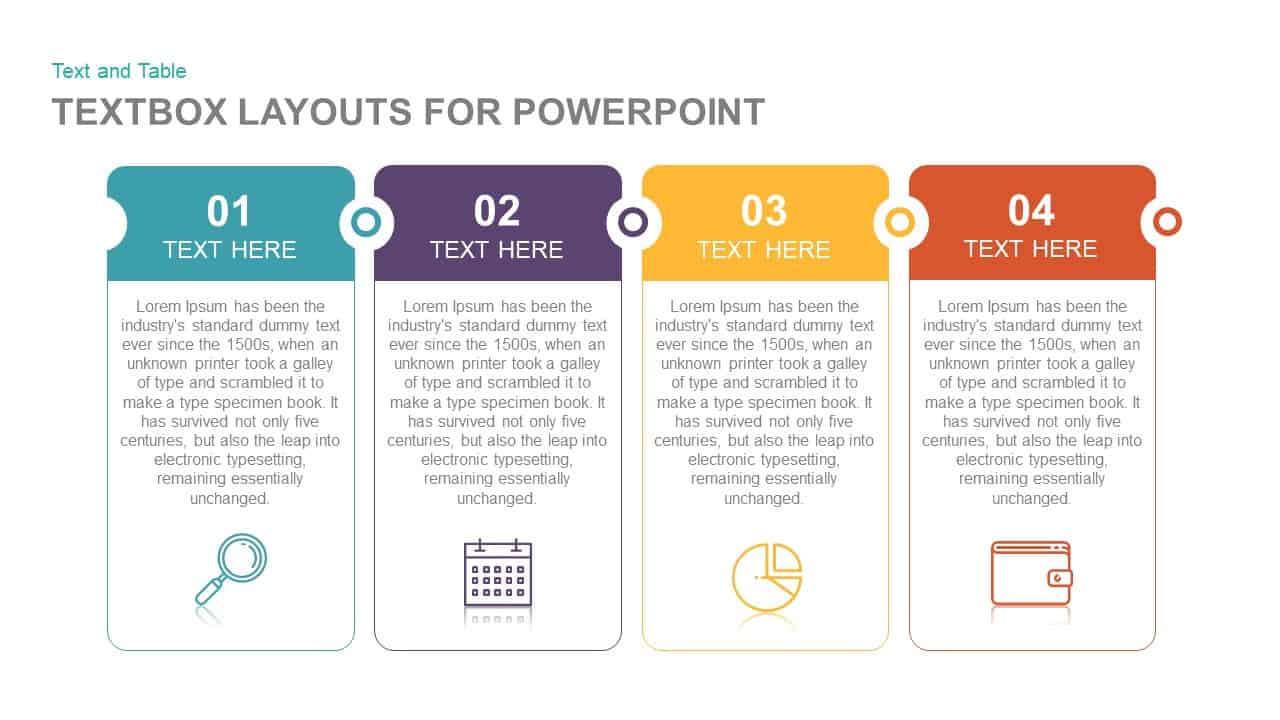
Four-Step Textbox Layout Diagram Template for PowerPoint & Google Slides
Business Report
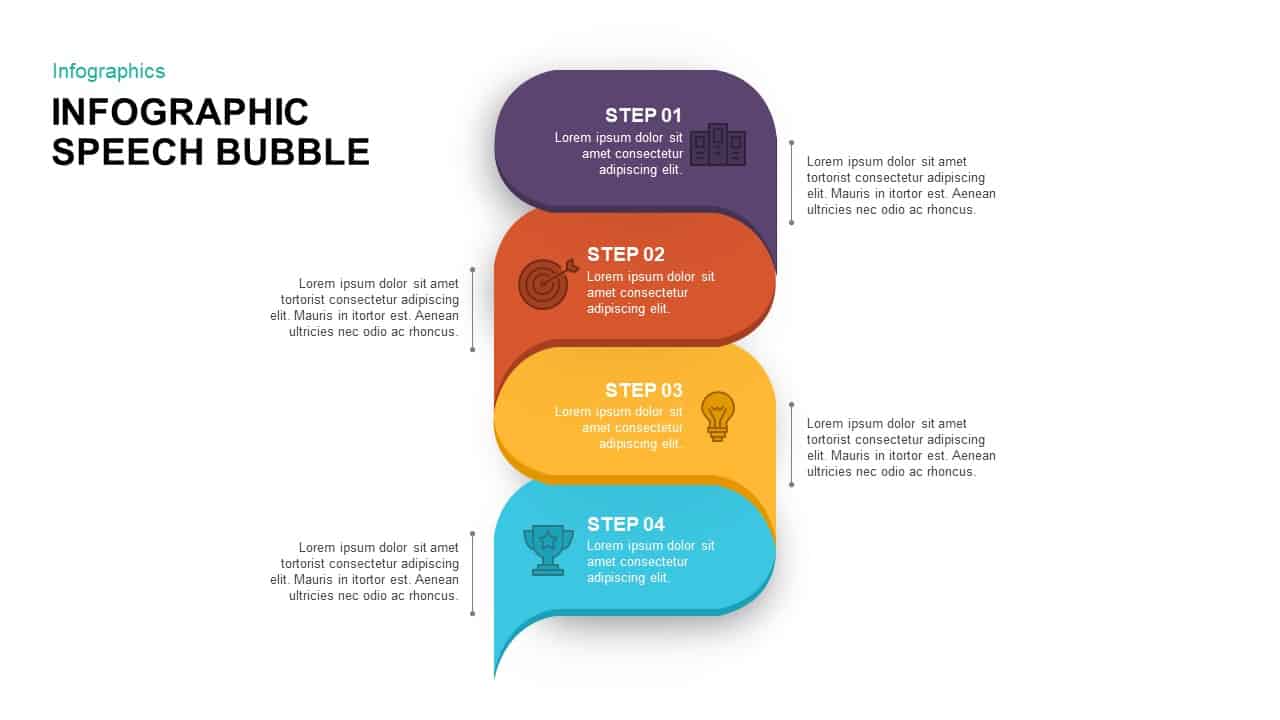
Four-Step Speech Bubble Diagram Template for PowerPoint & Google Slides
Process
Four-Quadrant SWOT Analysis Diagram Template for PowerPoint & Google Slides
SWOT
Concentric Four-Layer Core Diagram Template for PowerPoint & Google Slides
Circular
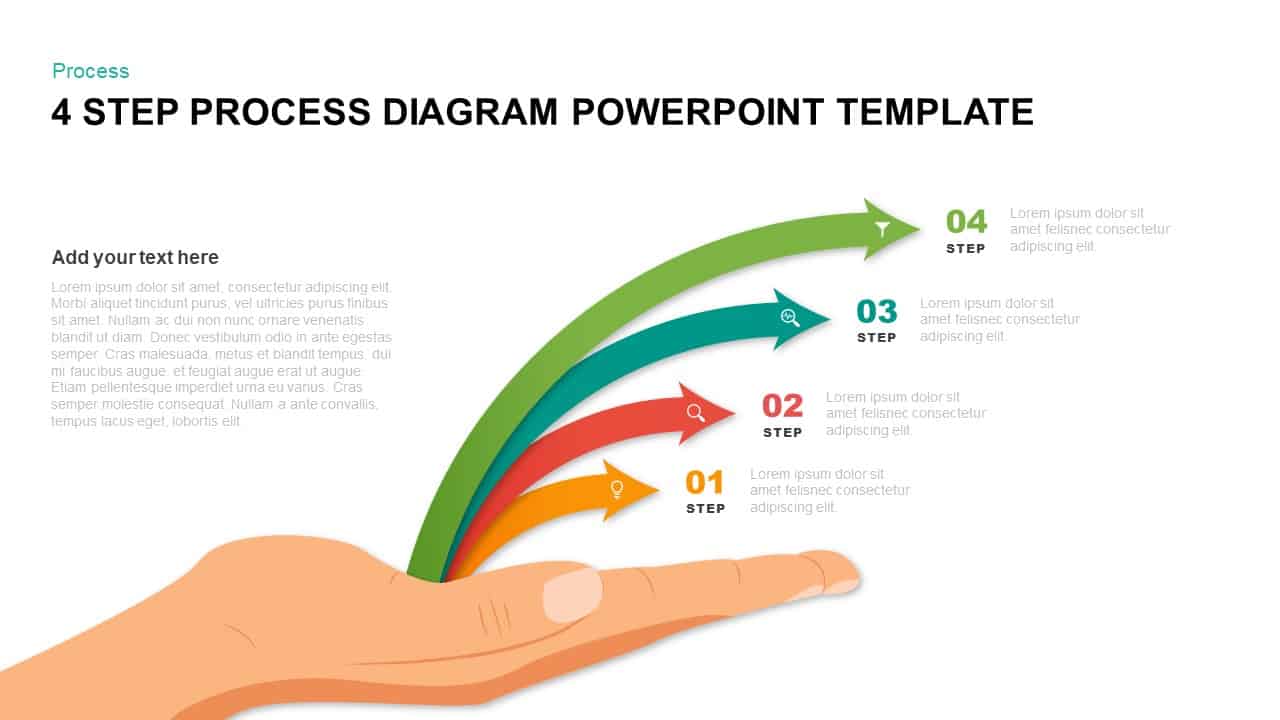
Hand-Held Four-Step Process Diagram Template for PowerPoint & Google Slides
Process
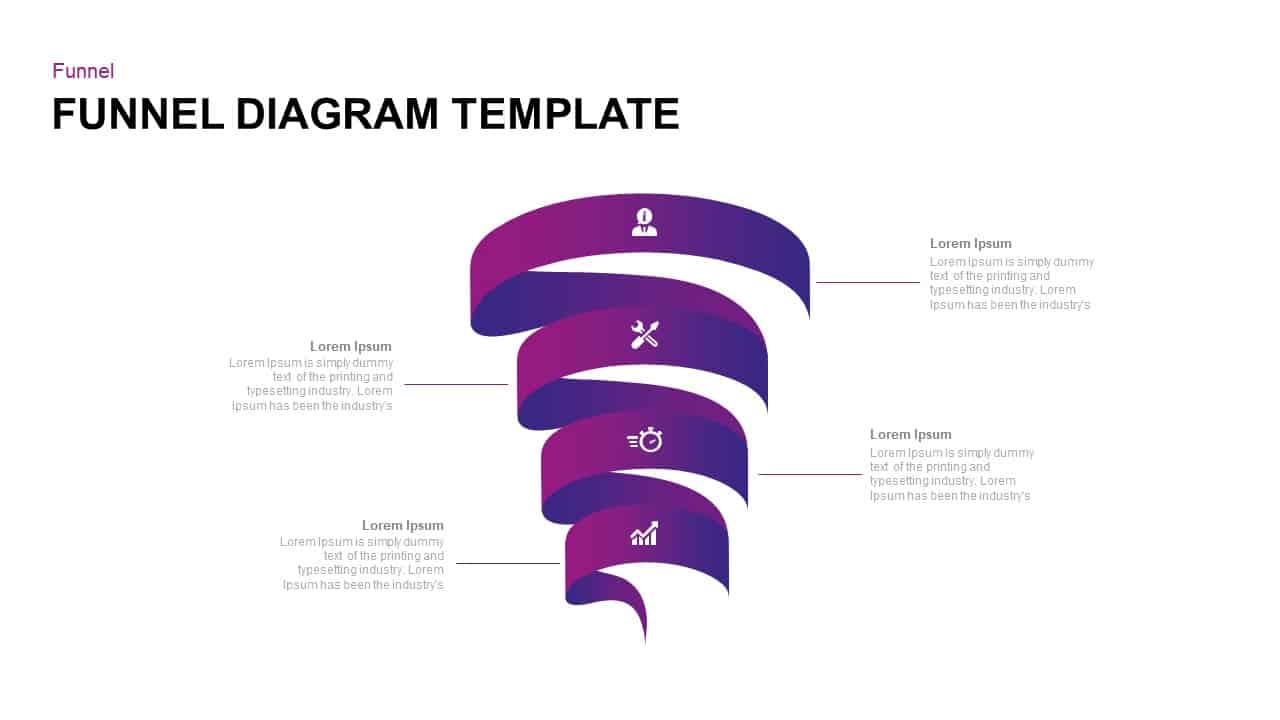
Four-Step Spiral Funnel Diagram Template for PowerPoint & Google Slides
Funnel
Four-Part SWOT Analysis Diagram Template for PowerPoint & Google Slides
SWOT
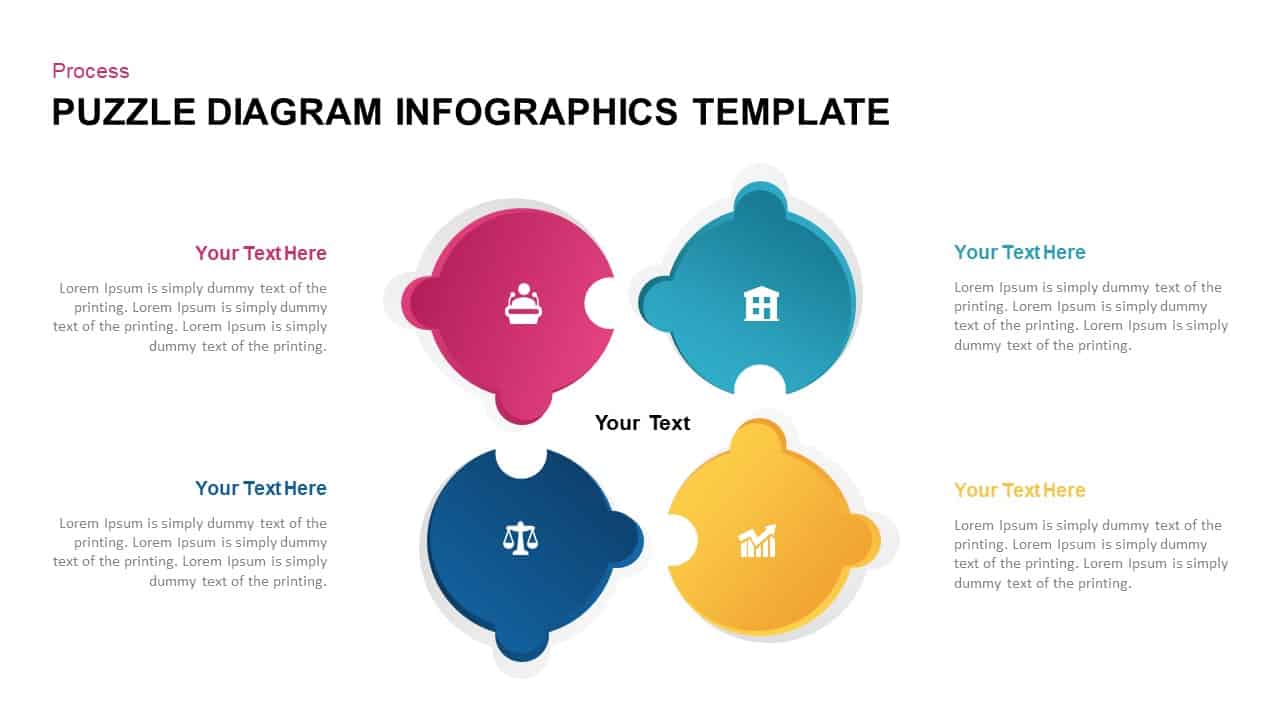
Four-Step Puzzle Diagram Infographic Template for PowerPoint & Google Slides
Process
Four Section Diagram Infographics template for PowerPoint & Google Slides
Process
4 Types of Business Structure PowerPoint Template
Business Strategy

Four Section Infographic Diagram Template for PowerPoint & Google Slides
Circular
Four-Phase Maturity Model Diagram Template for PowerPoint & Google Slides
Process
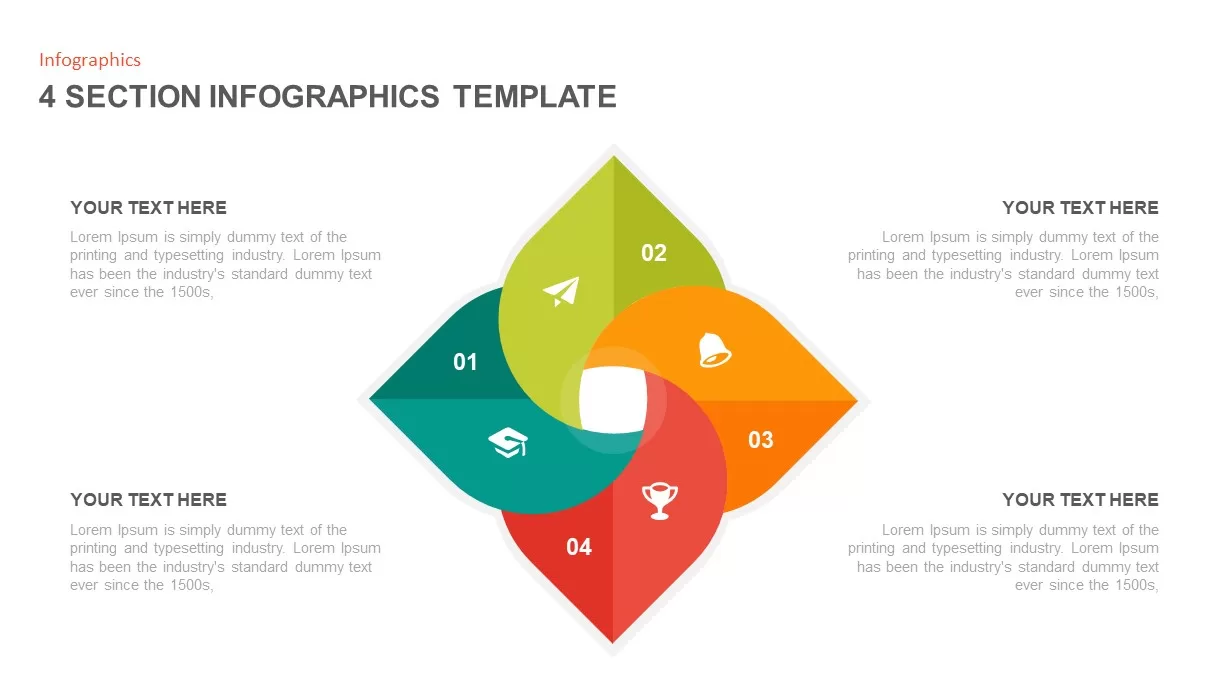
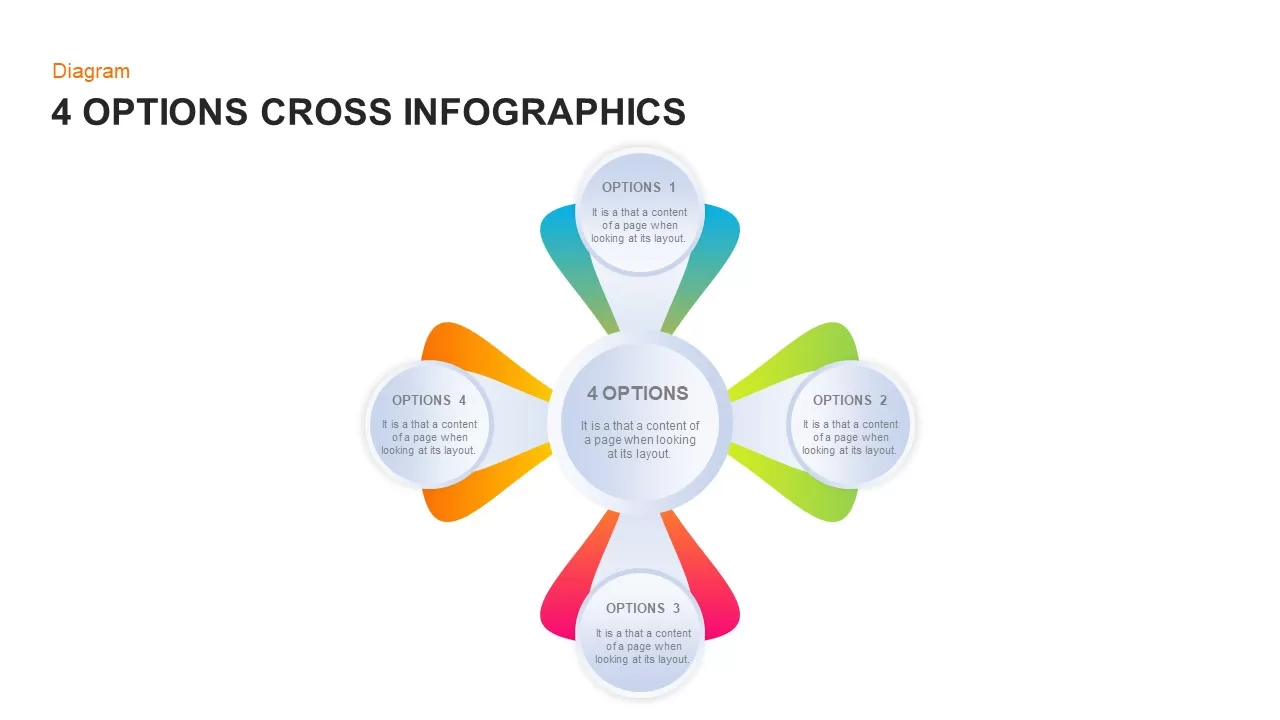
Four-Option Cross Infographic Diagram Template for PowerPoint & Google Slides
Comparison
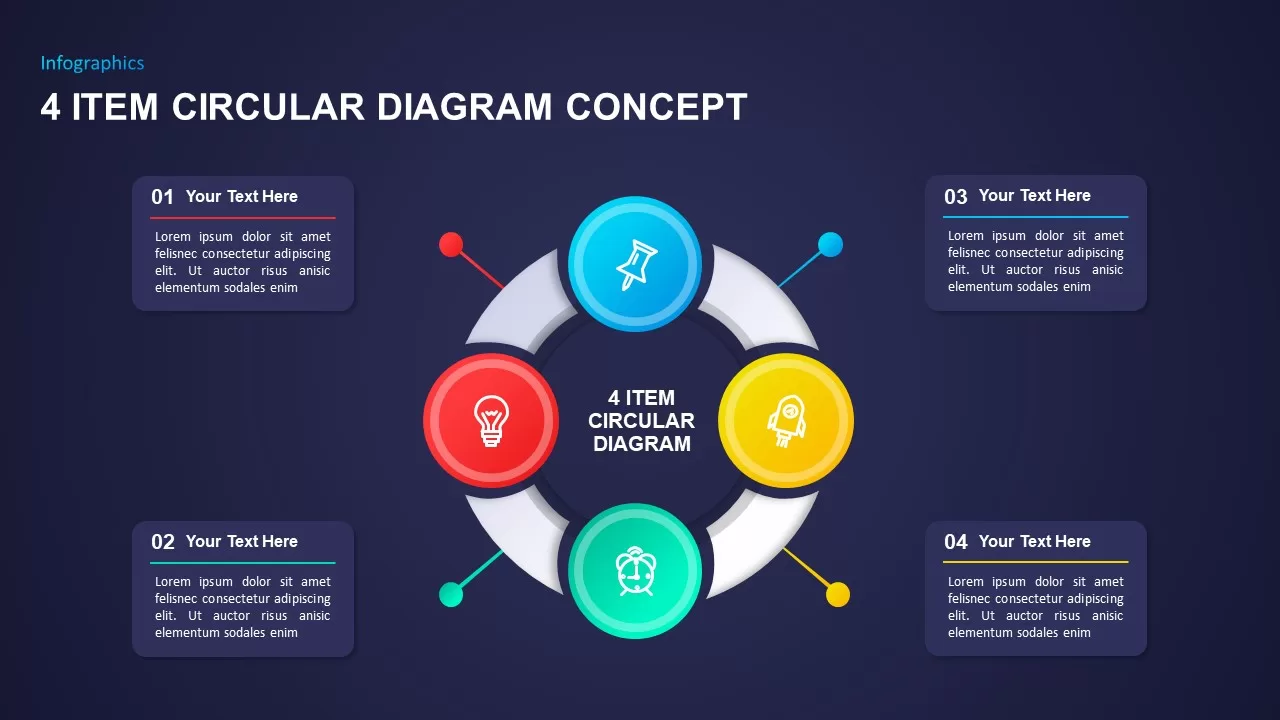
Four-Item Circular Diagram Concept Template for PowerPoint & Google Slides
Circular
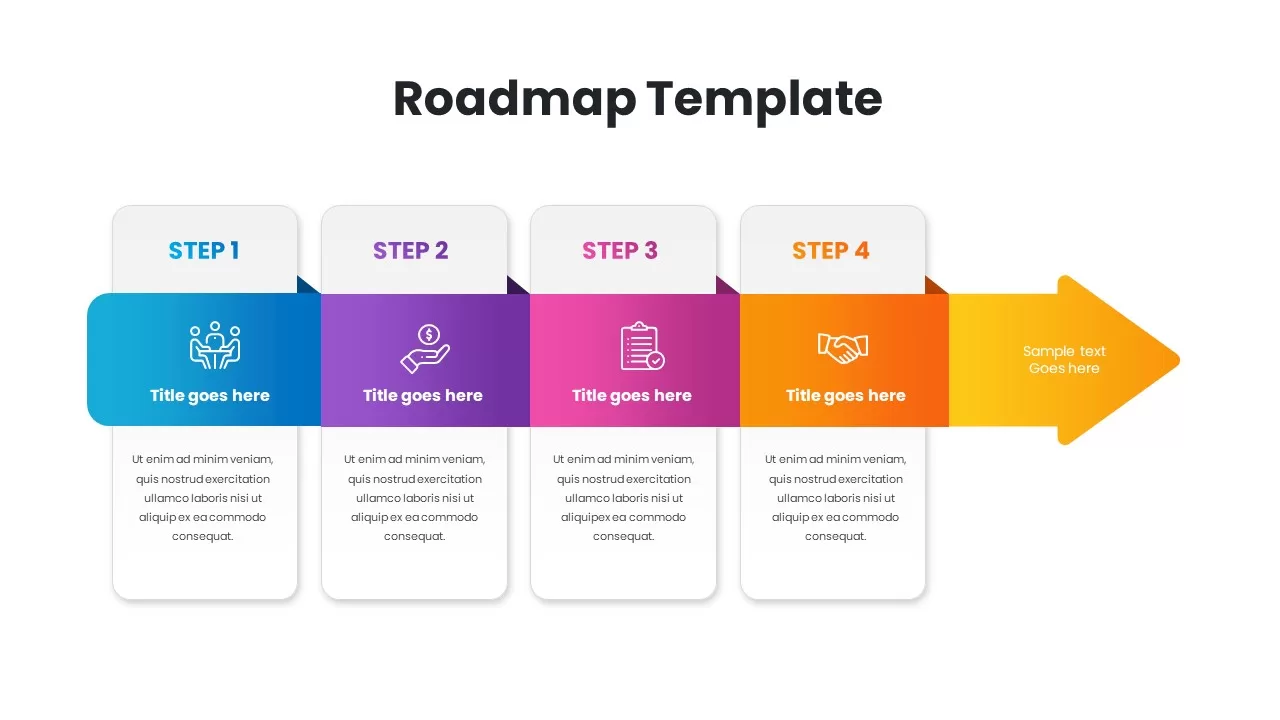
Roadmap Template for PowerPoint Presentation
Roadmap
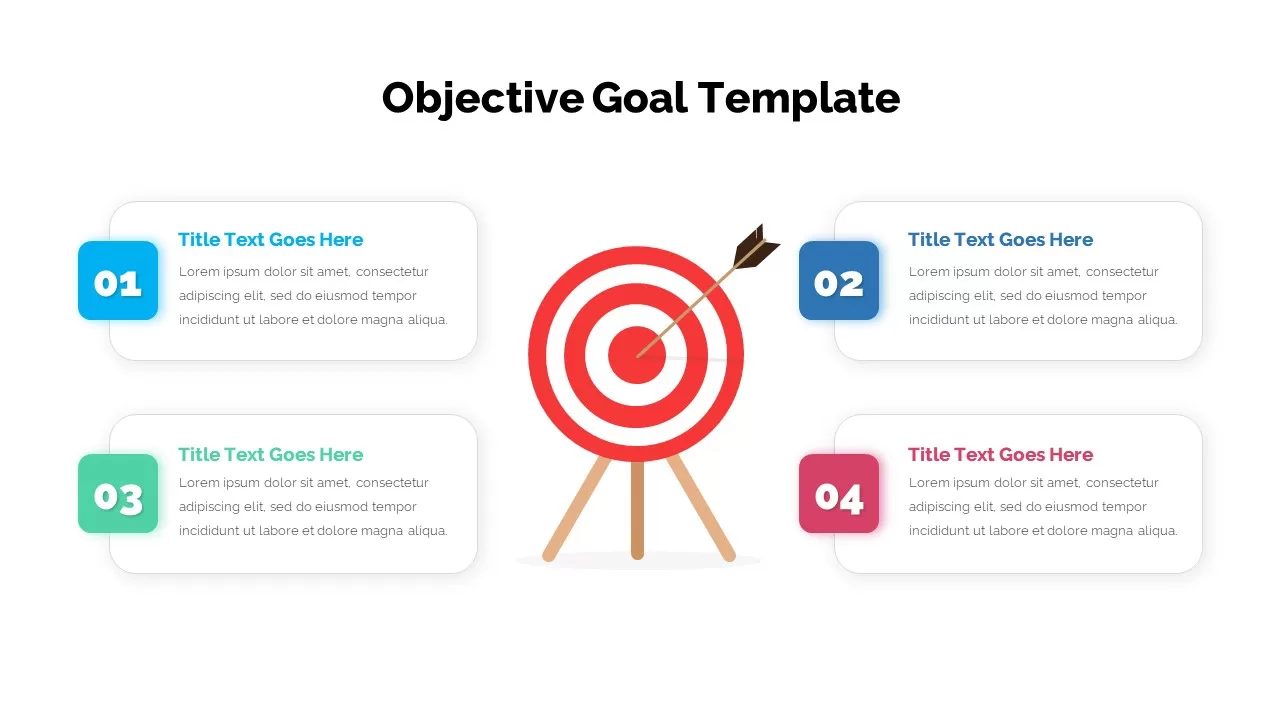
Four-Step Objective Goal Diagram Template for PowerPoint & Google Slides
Goals
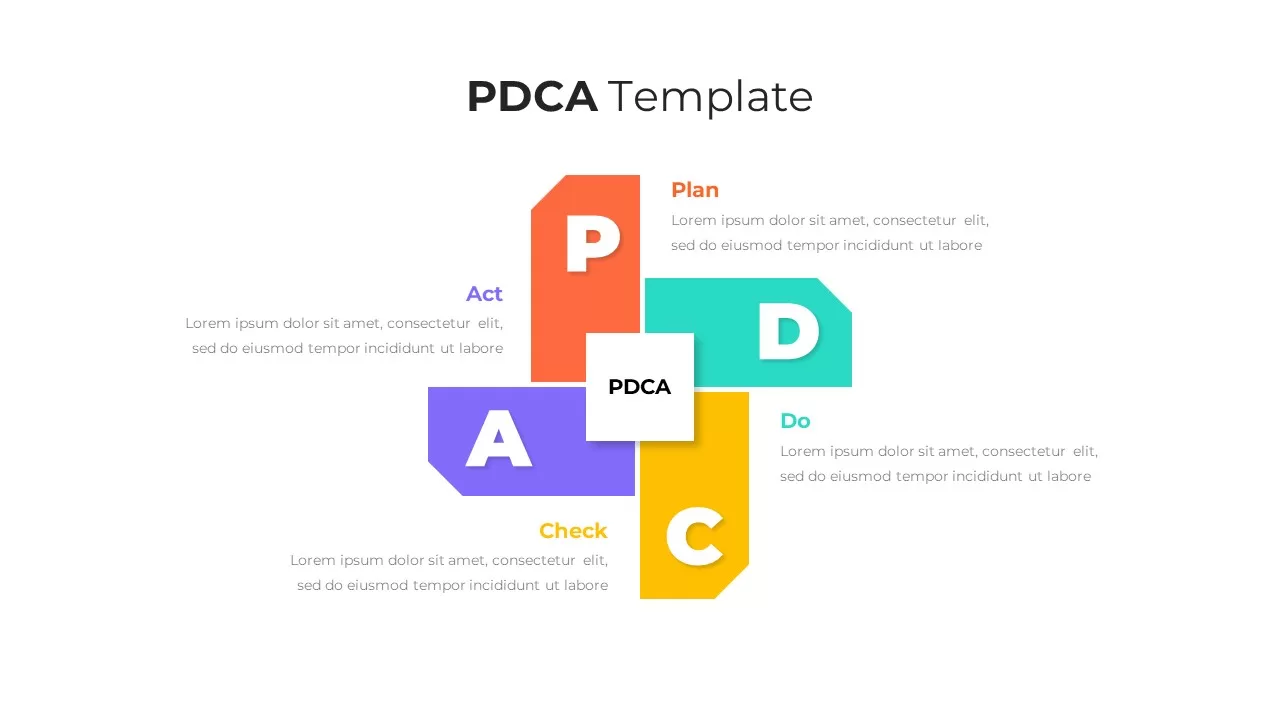
Elegant PDCA Four-Step Process Diagram Template for PowerPoint & Google Slides
Process
Four-Arrow Curved Hub-and-Spoke Diagram Template for PowerPoint & Google Slides
Arrow
Hand-Drawn Four-Step Curved Arrow Diagram Template for PowerPoint & Google Slides
Arrow
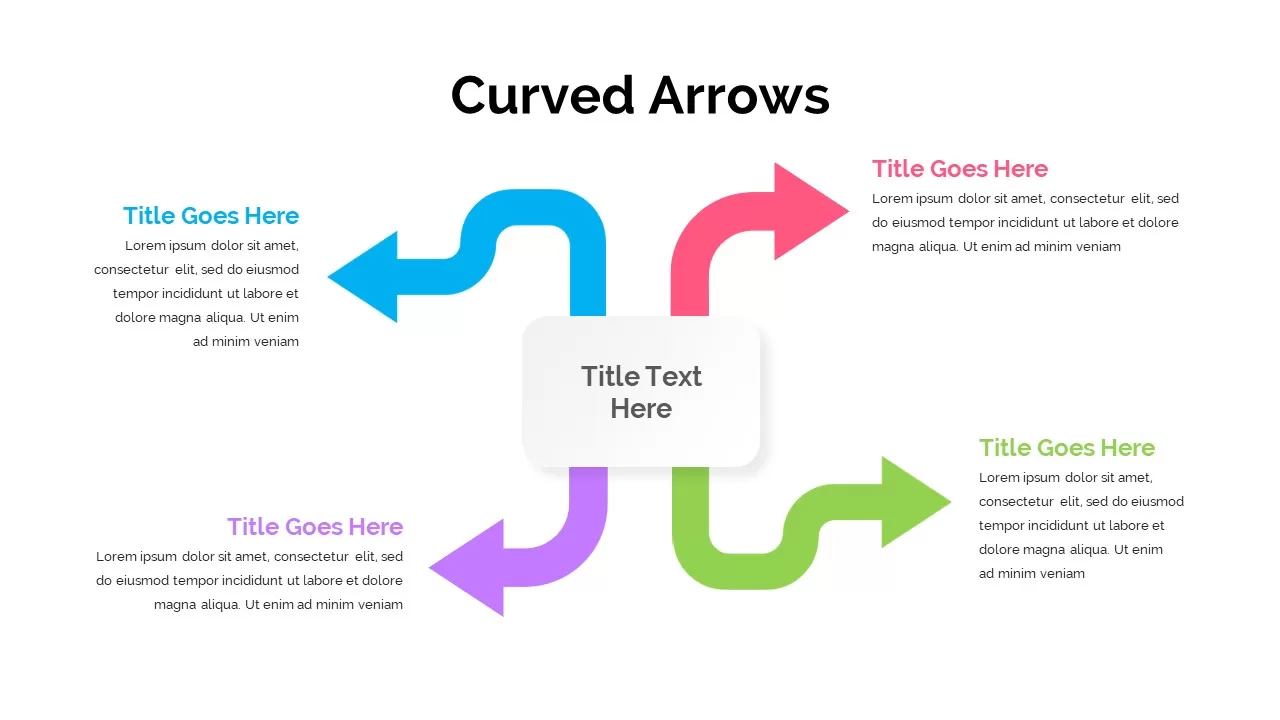
Four-Step Curved Arrow Diagram Template for PowerPoint & Google Slides
Arrow
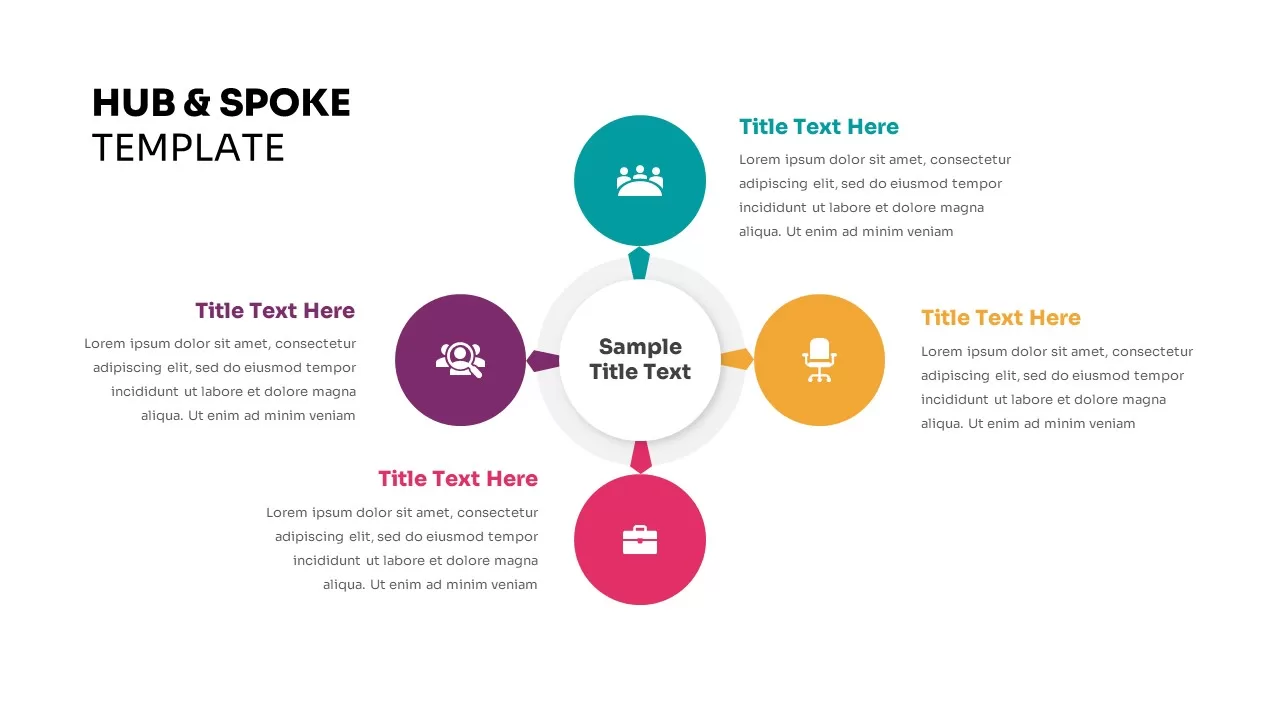
Four-Point Hub and Spoke Diagram Template for PowerPoint & Google Slides
Business Strategy
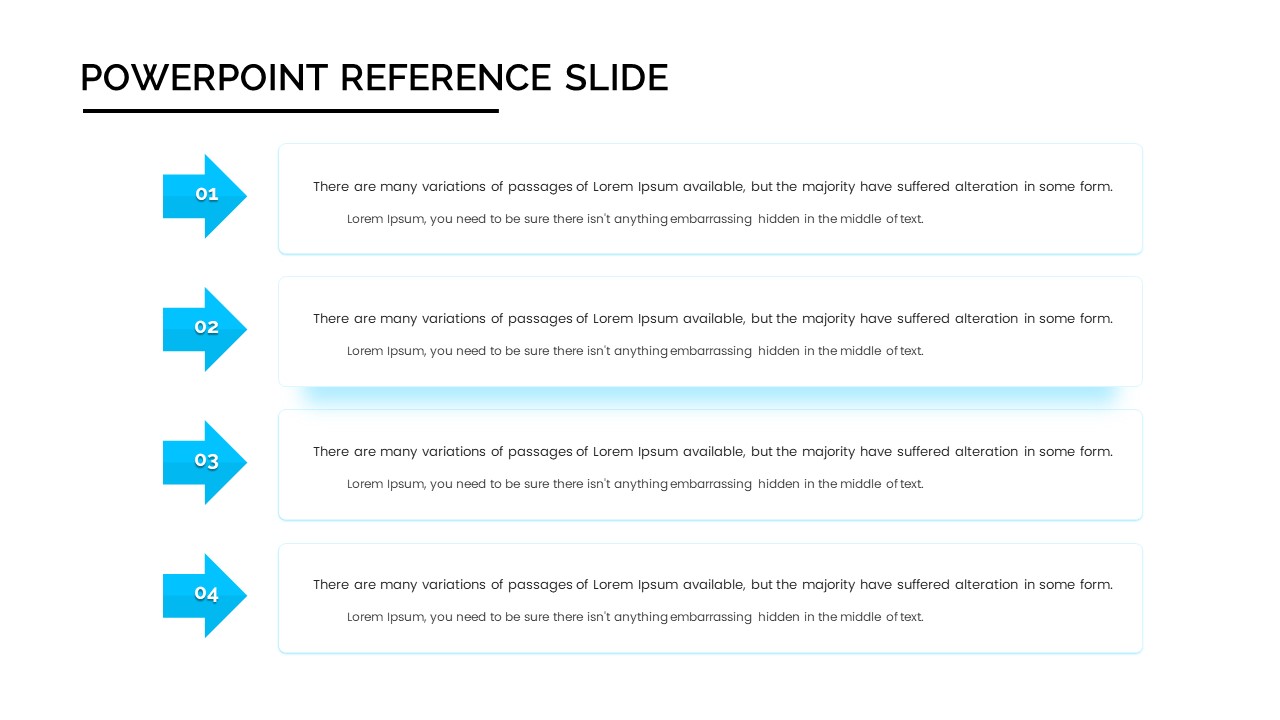
Four-Step Arrow Reference Diagram Slide Template for PowerPoint & Google Slides
Arrow
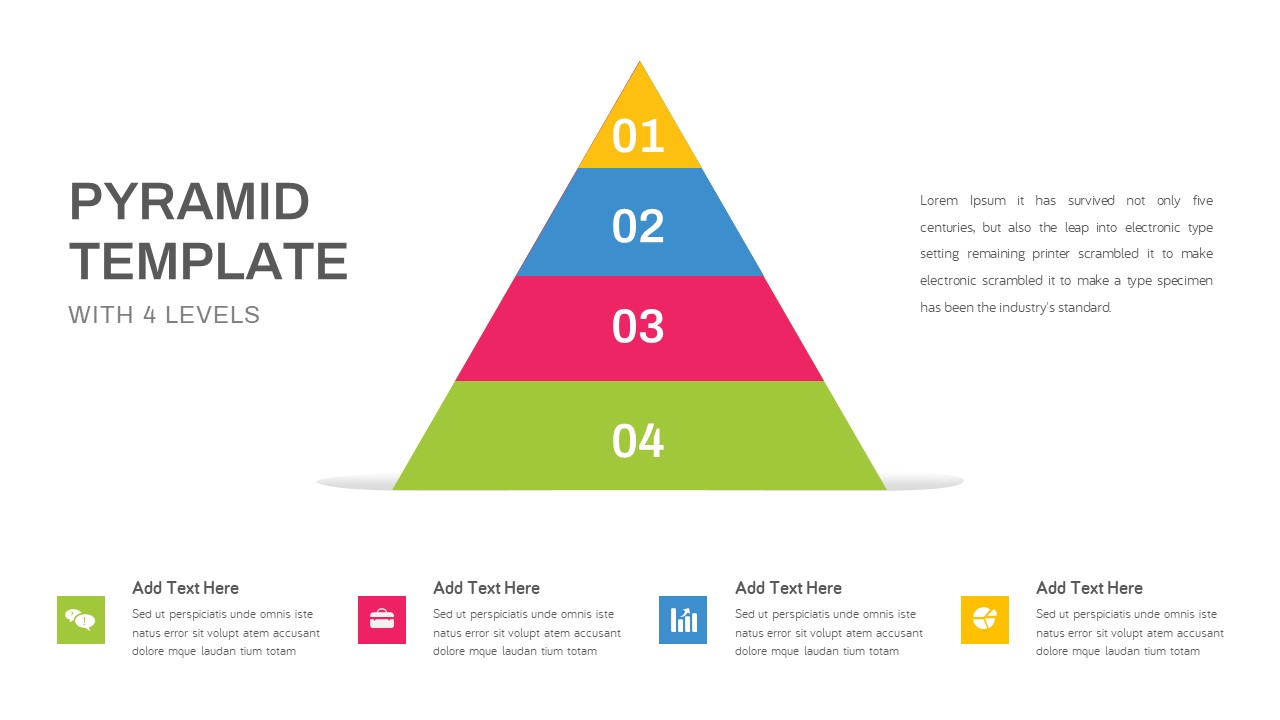
Four-Level Colorful Pyramid Diagram Template for PowerPoint & Google Slides
Pyramid
Modern Four-Level Pyramid Diagram Template for PowerPoint & Google Slides
Pyramid
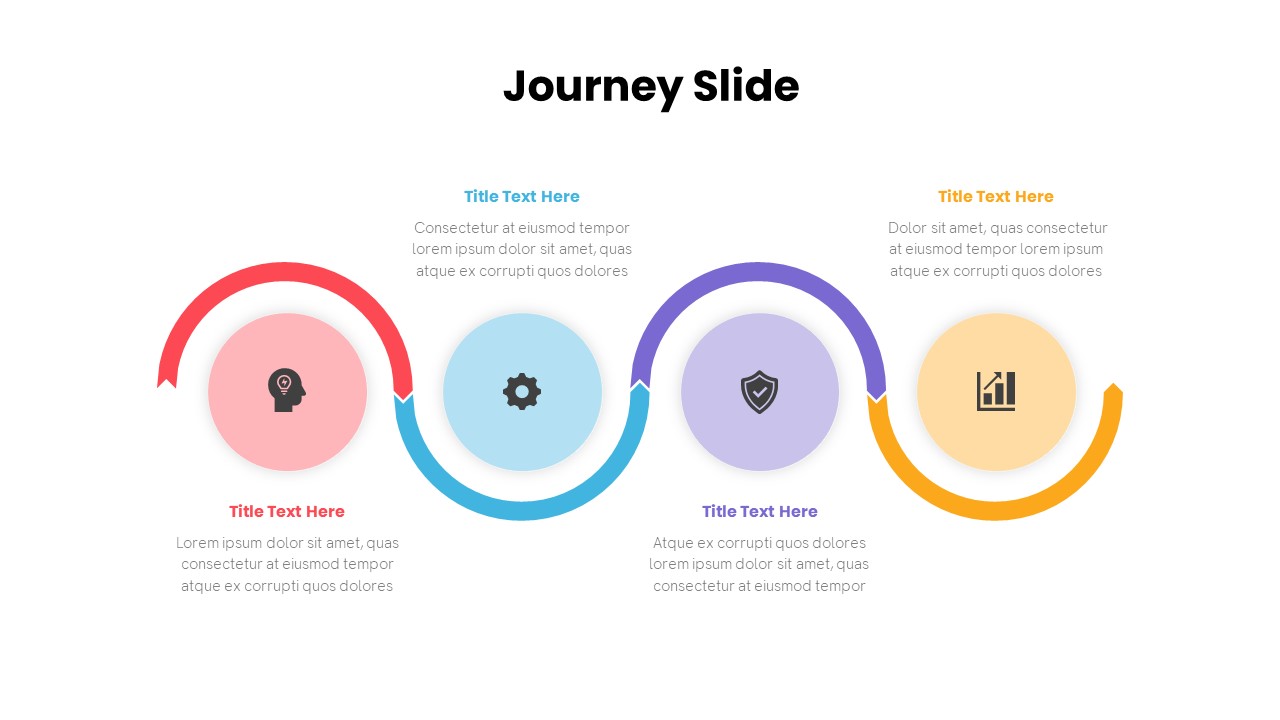
Free Journey Slide PowerPoint Presentation Template
Process
Free
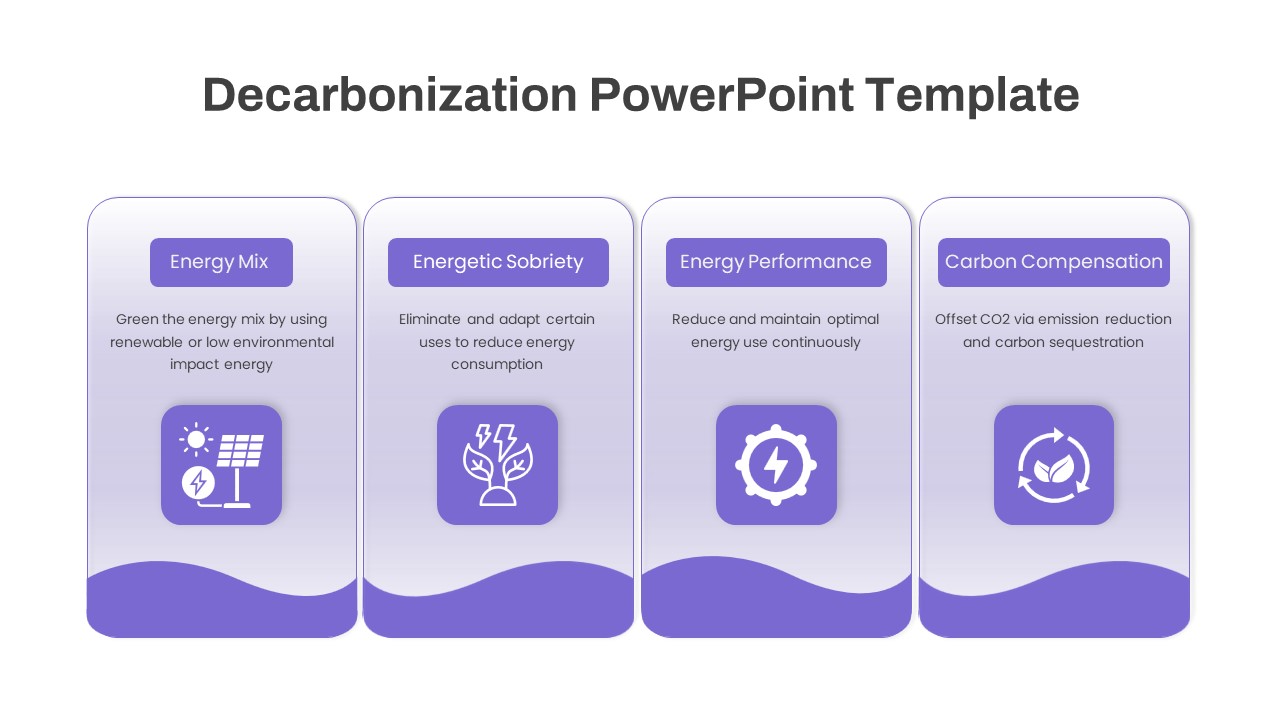
Four-Phase Decarbonization Diagram Template for PowerPoint & Google Slides
Process
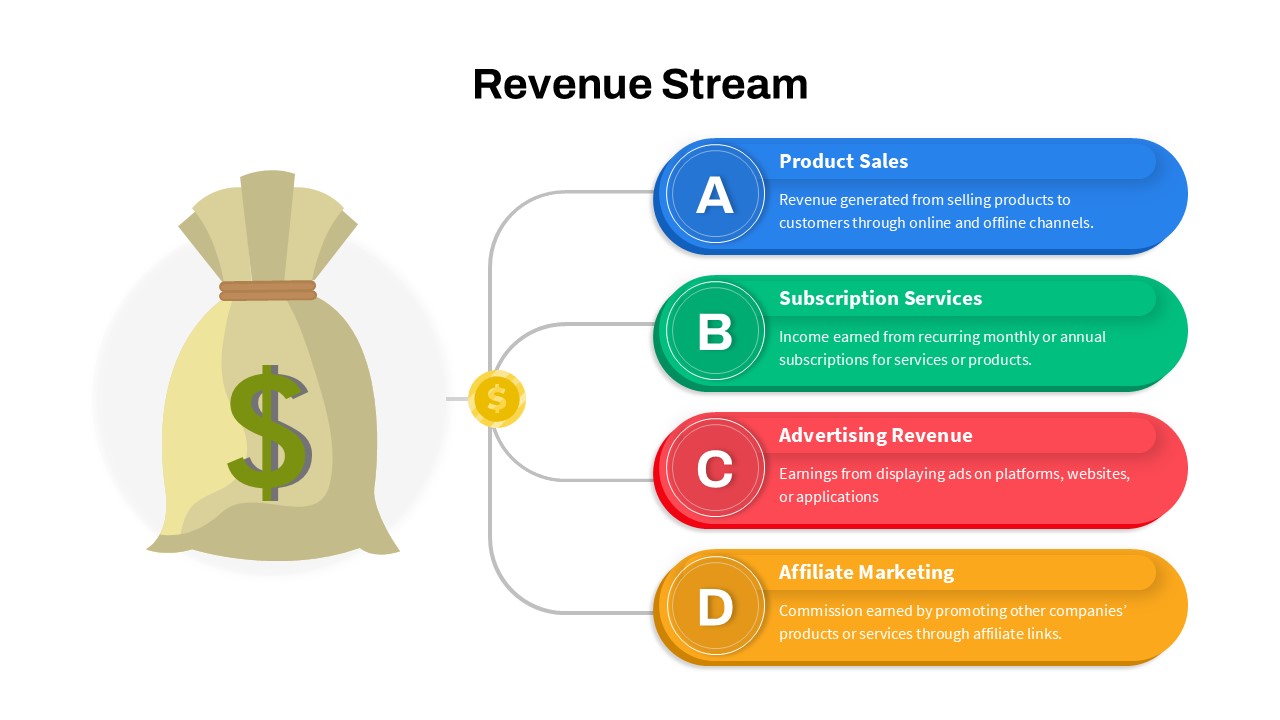
Revenue Streams: Four Channels Diagram Template for PowerPoint & Google Slides
Business Models
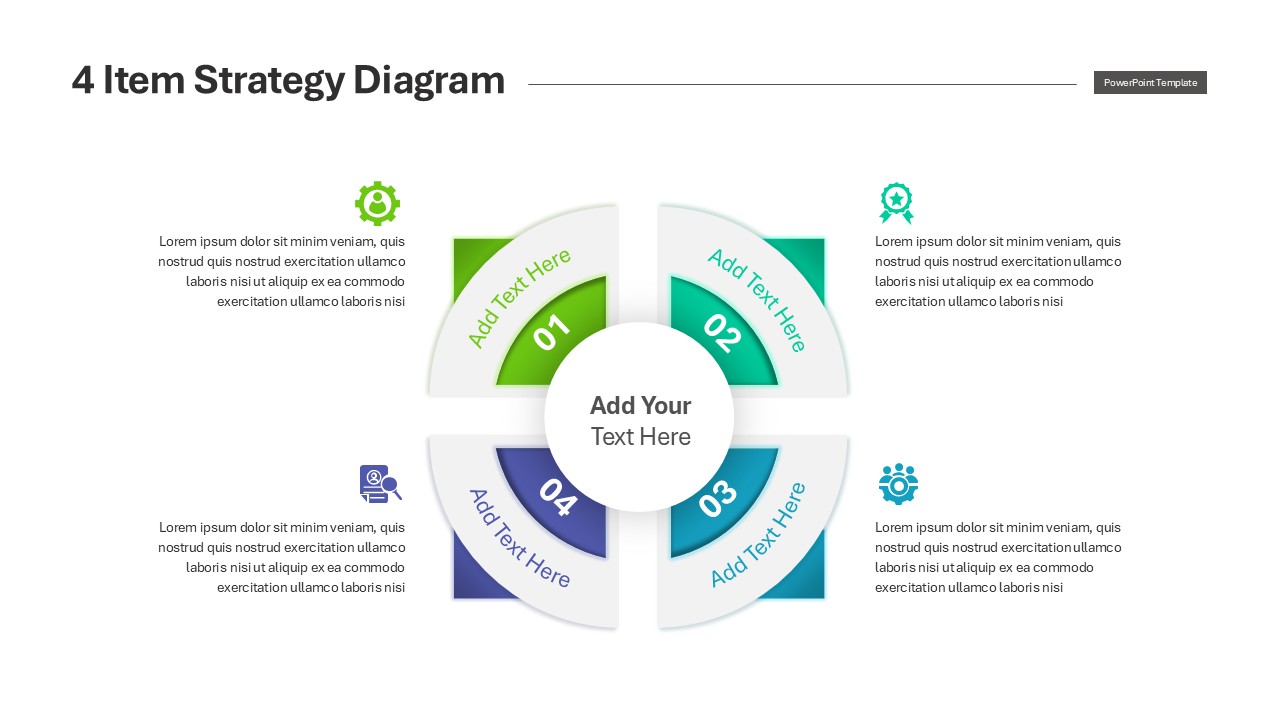
Engaging Four-Option Strategy Diagram Template for PowerPoint & Google Slides
Business Strategy
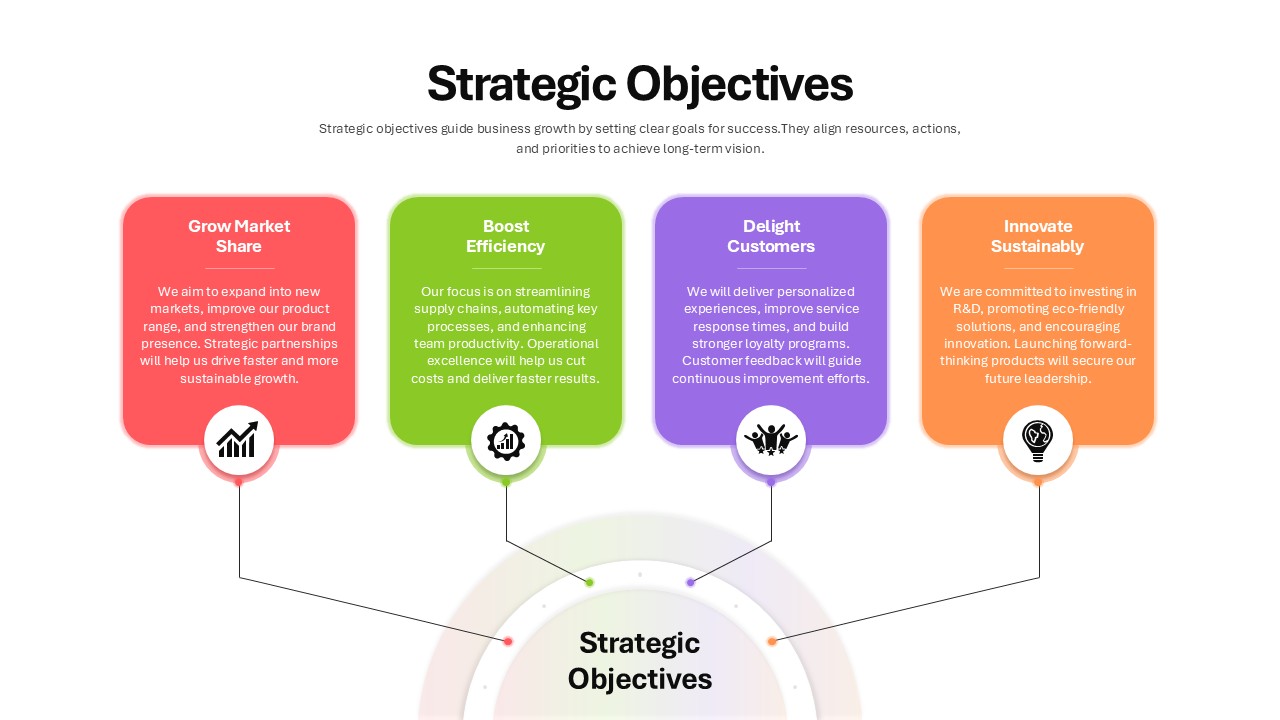
Four Strategic Objectives Radial Diagram Template for PowerPoint & Google Slides
Business Strategy
Four-Level Colorful Pyramid Diagram Template for PowerPoint & Google Slides
Pyramid

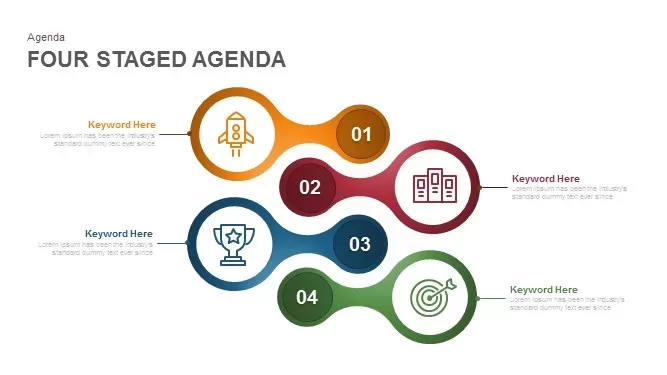
Four Staged Agenda Diagram for PowerPoint & Google Slides
Agenda