Customer Experience Template
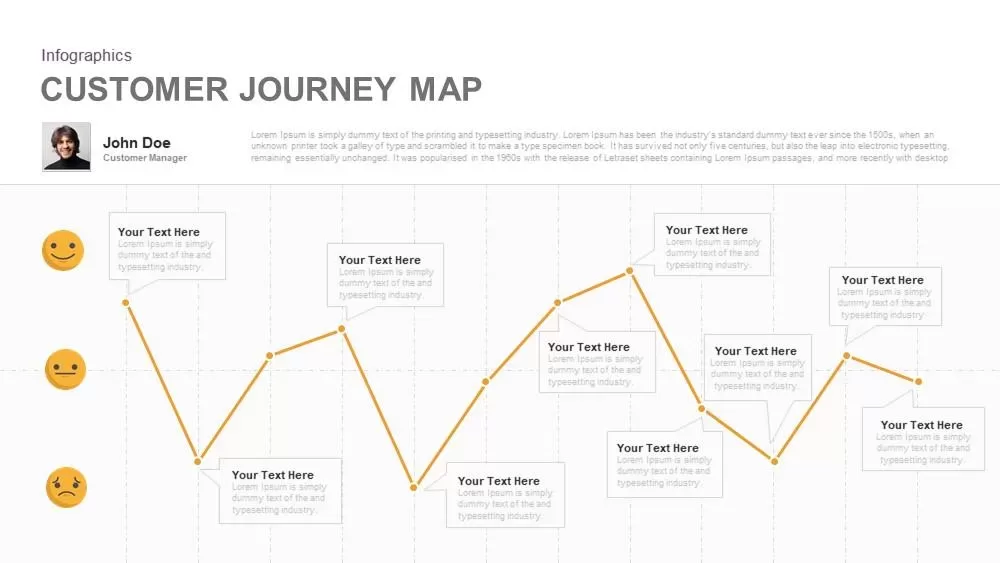
The customer experience diagram powerpoint template perfectly displays marketing and sales strategy. Customer experience or user experience focuses on customer satisfaction with a product. Companies need to hold customers happy from their first purchase. This is the company’s goal that stays there in the market. This customer map template offers a user experience map in the three variant designs. It is also known as a customer journey map powerpoint to track the feedback and reviews. There are touch points in the diagram that enables the user to organize and outline the problems. A journey map will tell the story of a customer’s journey from the beginning to the end. In short, customer experience refers to the interactions and experiences your customer has with your company product/services and business receptions, from first contact to becoming a happy and loyal customer.
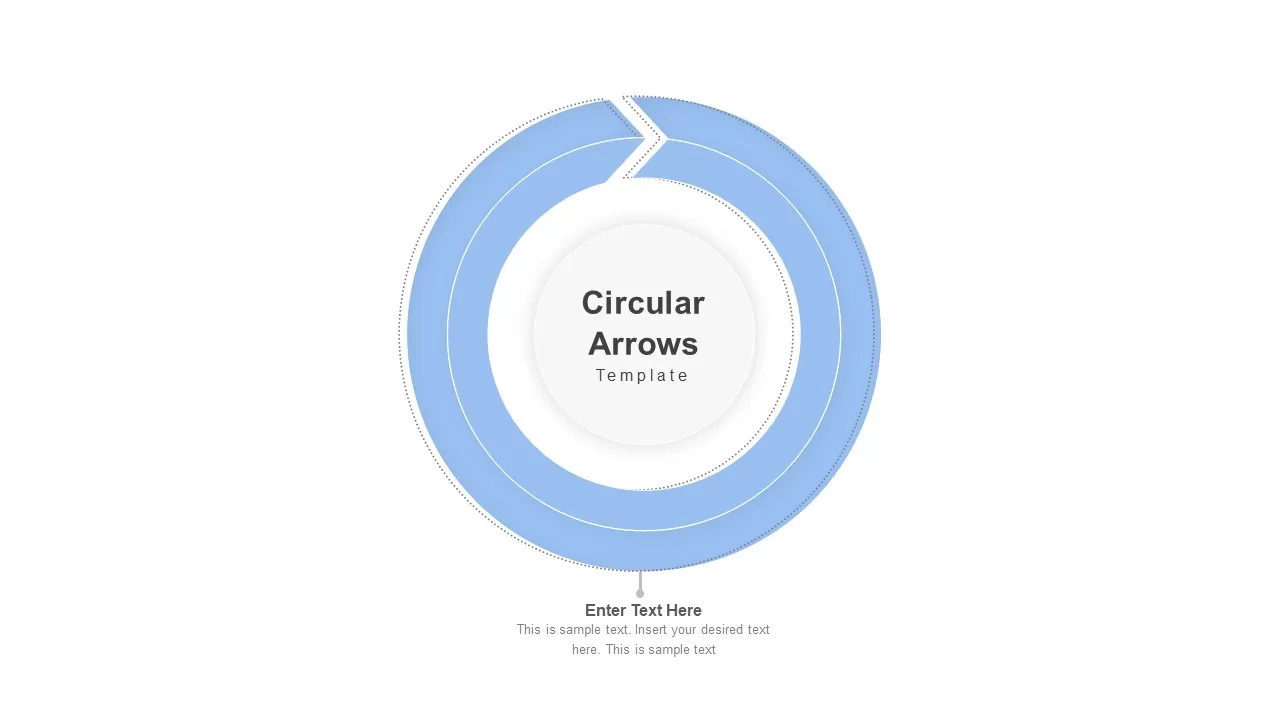
The customer strategy experience map for powerpoint presentations is a set of timelines, circular, and table designs to illustrate customer experience in powerpoint. The circular diagram shows the seven concepts in this set with the chevron arrow ppt rotation. These concepts are need generation, internal consideration, engagement, evaluation, the moment of purchase, delivery\installation, and usage. These are the steps of the customer journey right from beginning to end. Besides, the center circle of the diagram is divided into three sections before, during, and after. For example, before a customer begins their journey towards a product company should focus on need generation and internal consideration. Similarly, engagement and evaluation are when a customer cross-checks the product value. Finally, after a purchase, delivery and usage are customer journey phases. This is a perfectly created user experience diagram to learn about your sales team.
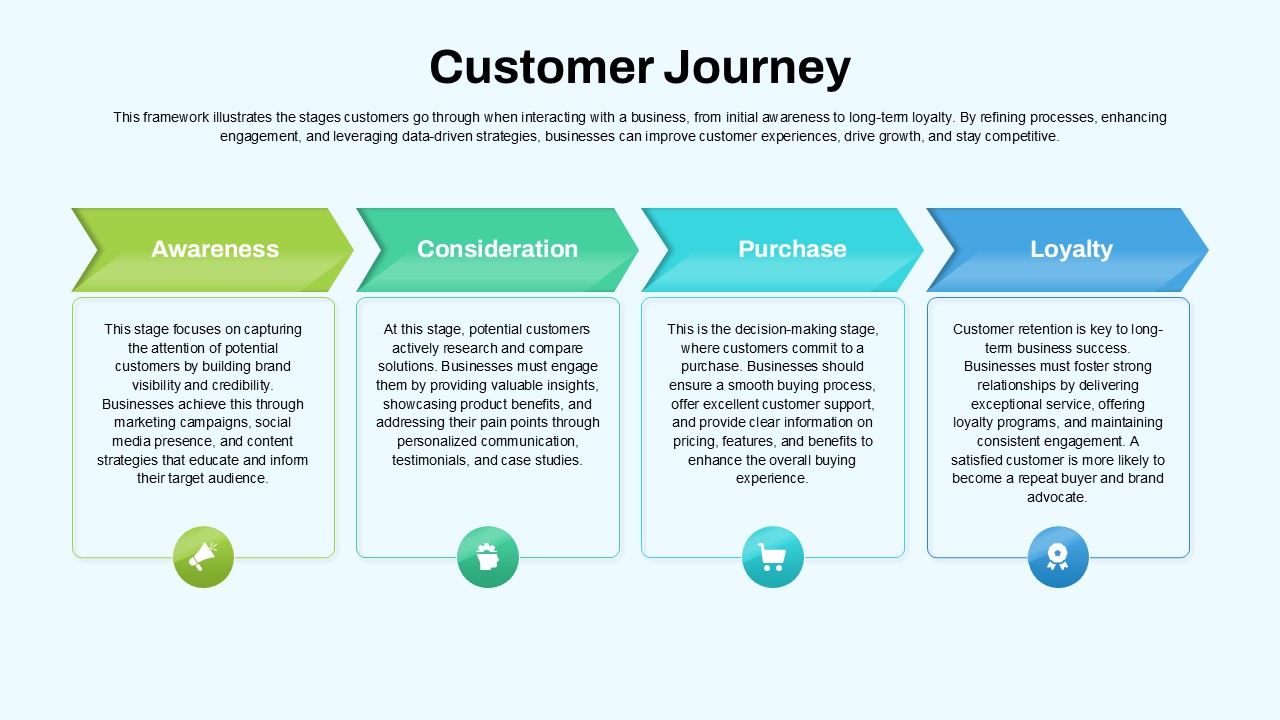
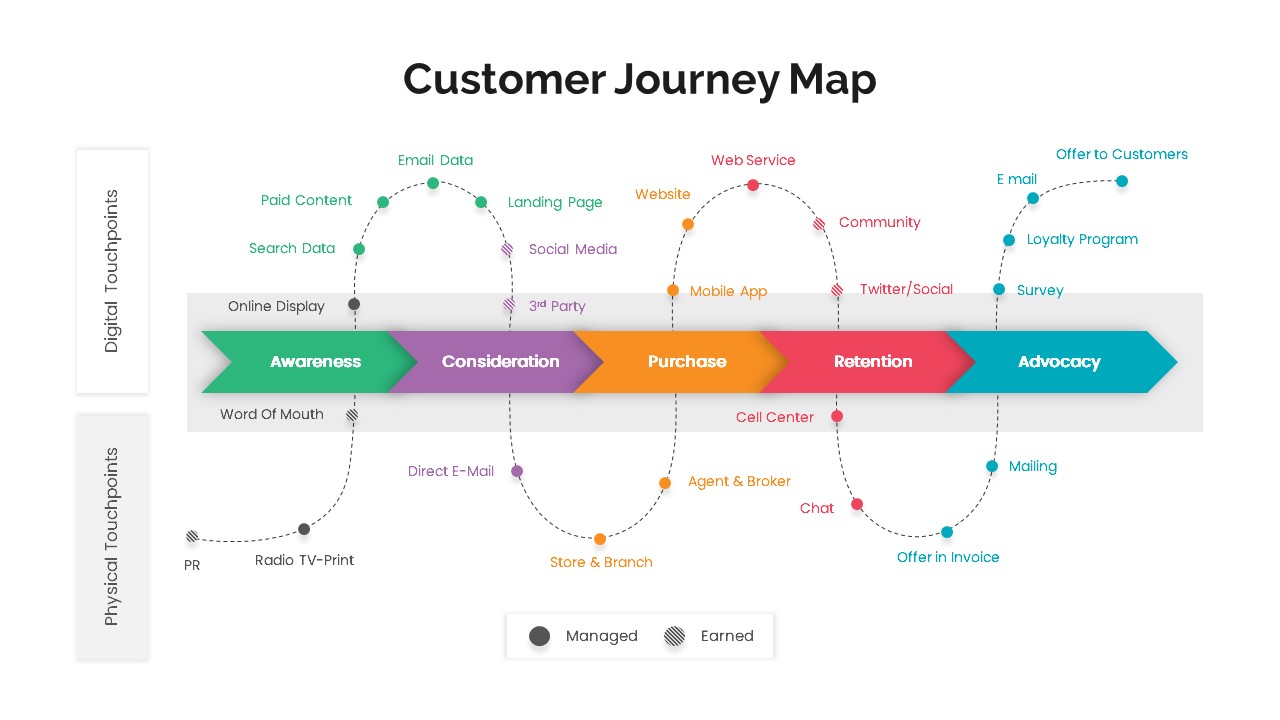
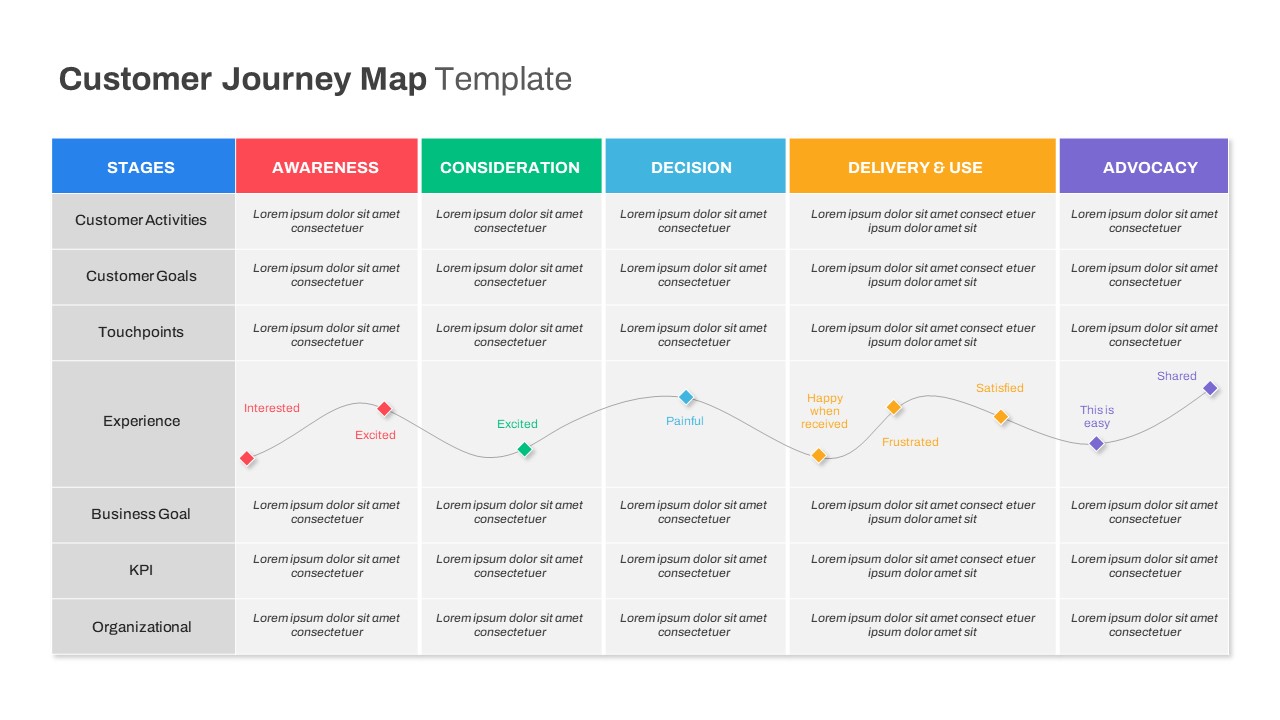
The customer strategy experience diagram template for the powerpoint presentation shows the stages of the customer with a table powerpoint graph. The touch points are spotted as colored marks to show customer feelings. For example, happy is in green, satisfied is in yellow, and unhappy is shown in red color codes—this ideal table for customer journey map powerpoint slideshows. Besides, the arrow timeline template allows a five-stage process of the customer experience journey. The graphical representation tool for the customer experience journey is ideal for displaying customer interactions.
Login to download this file


