Annual Growth Trend Analysis PowerPoint Template
Unlock Your Growth Potential with Our Annual Trend Analysis Template
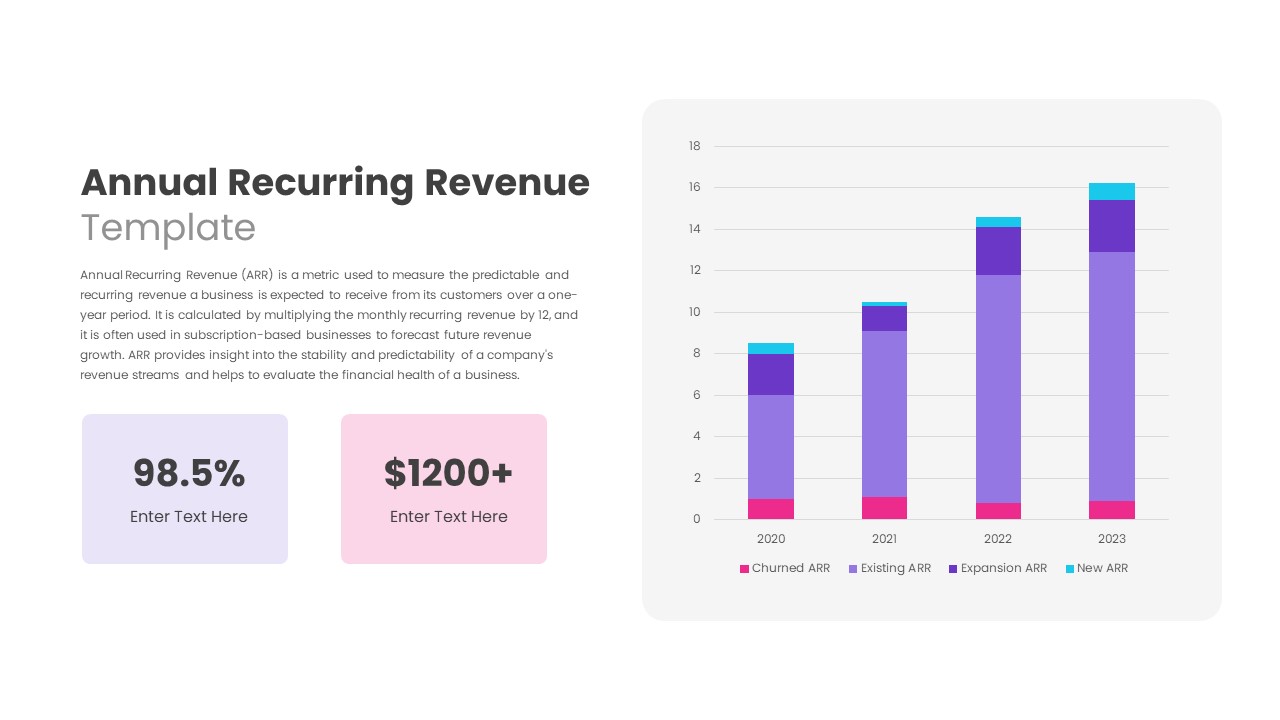
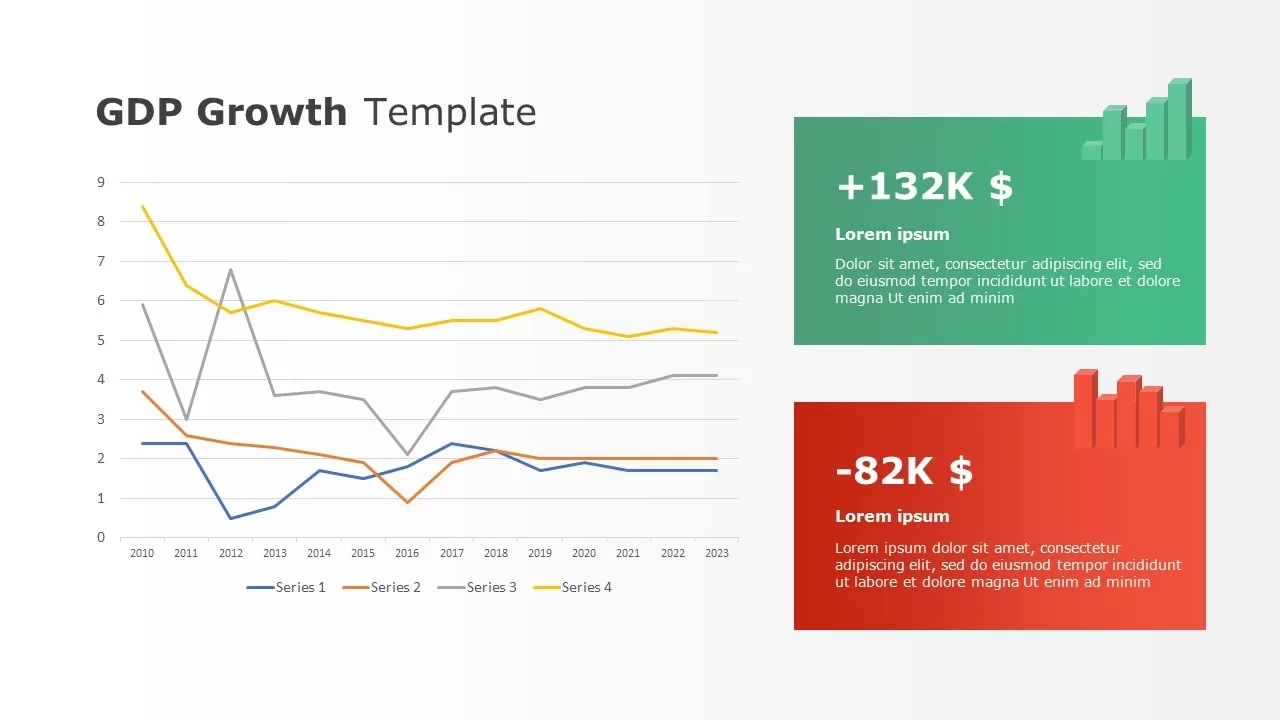
Our Growth Trend Analysis Template is designed to communicate your company’s annual growth trends over the past year. This PowerPoint template features an increasing bar chart and arrow graph, which precisely report your company’s adjusted book value over the last 12 years. The general bar chart showcases growing bars and a trend line, providing a clear and visually appealing representation of your company’s performance over the years. By using this template, you can highlight key growth metrics and trends, making it easier to present and analyze your company’s financial progress and strategic achievements professionally.
What is the best use of a bar chart?
The best use of a bar chart is to compare discrete categories of data, making it ideal for visualizing differences and trends over time. Bar charts excel in presenting categorical data clearly and effectively, allowing viewers to easily interpret and analyze information. They are particularly useful for highlighting changes in performance, such as sales figures, market share, or population demographics. By varying the length of bars, these charts provide an intuitive way to compare multiple groups or track progress across different periods. Bar charts are versatile and widely used in business reports, academic research, and data presentations for their simplicity and clarity.
The annual growth trend analysis PowerPoint Template is perfect for showcasing your company’s yearly performance and growth trends through a statistical tool. You can provide clear and concise data to potential investors for investment purposes. Use the template to highlight key growth areas and guide decision-making processes for future strategies. Present detailed growth analysis to board members, making it easier to discuss and review the company’s progress and future plans. Besides, you can compare your company’s growth trends with industry benchmarks to identify strengths and areas for improvement. Moreover, as a general presentation tool for inserting data-driven insights, this template is fit to display sales, research, and marketing data.
The annual growth trend PowerPoint template illustrates the adjusted book value of a company over the years, showcasing both gradual and compound growth rates. Presenters can easily customize each feature to insert their own data and personalize the presentation. This template provides a visually appealing way to highlight financial progress. Download it now to enhance your presentations!
Login to download this file


