Donut Chart for PowerPoint & Google Slides


Description
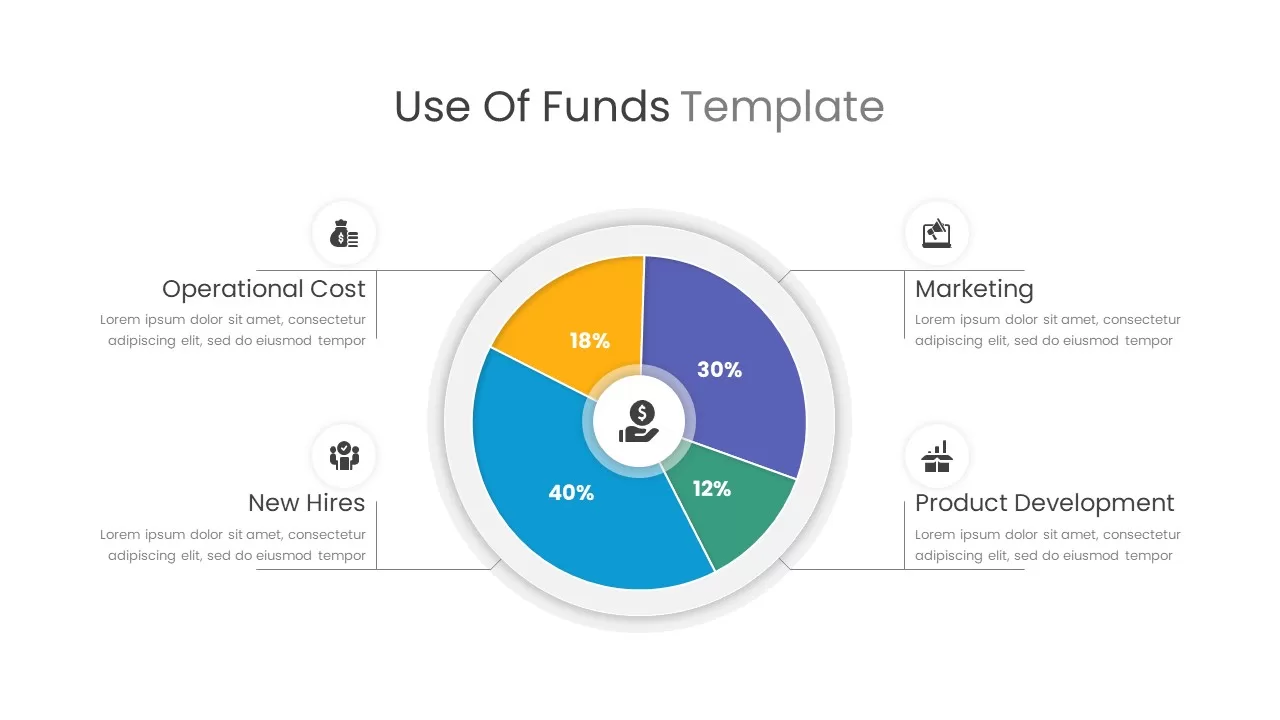
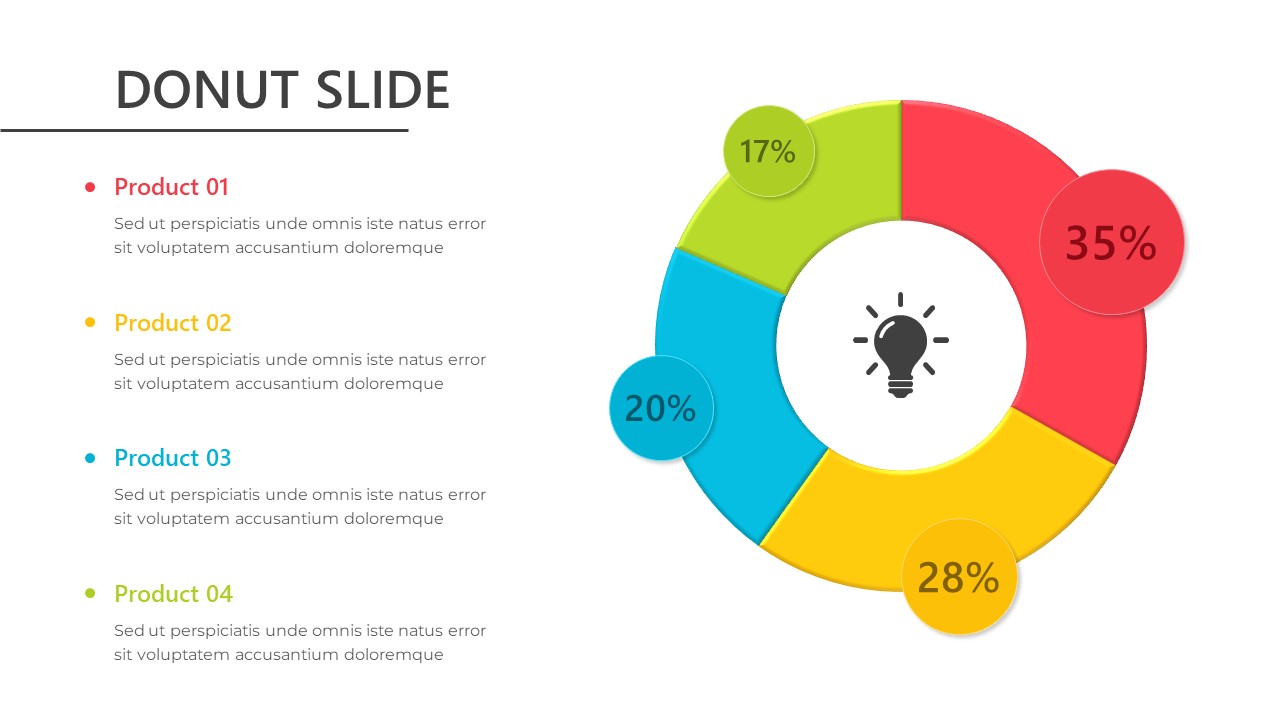
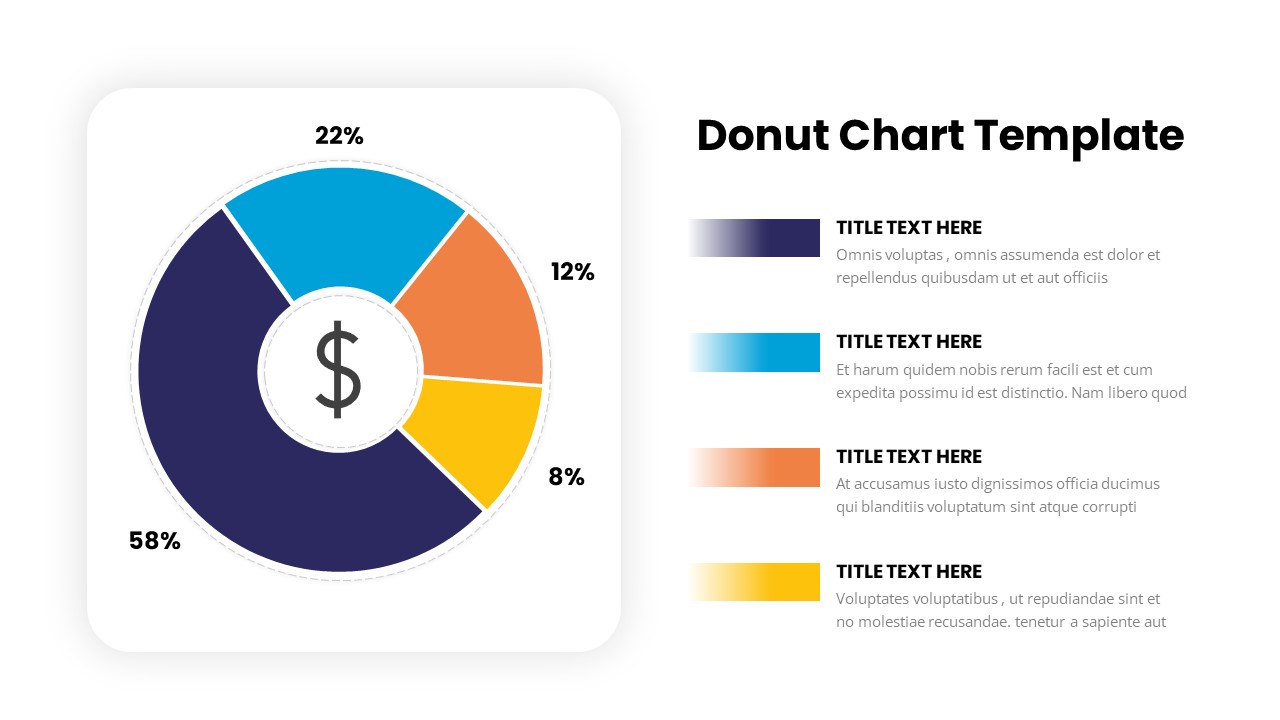
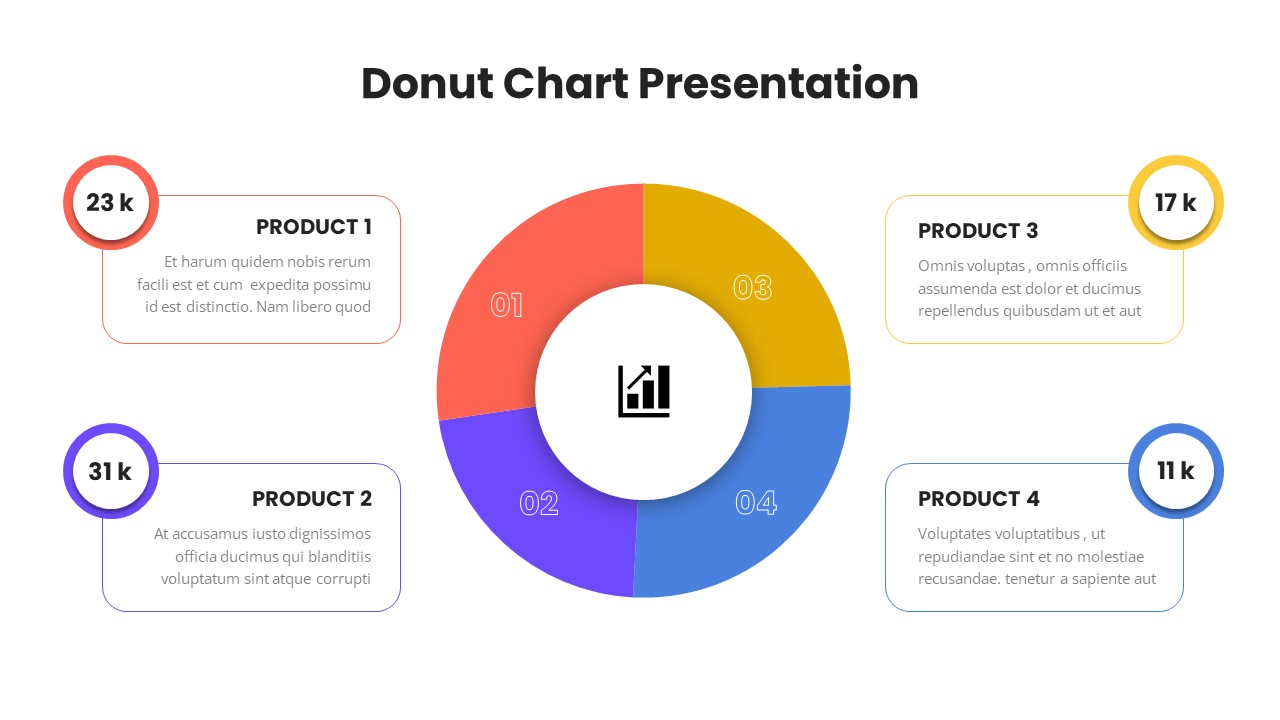
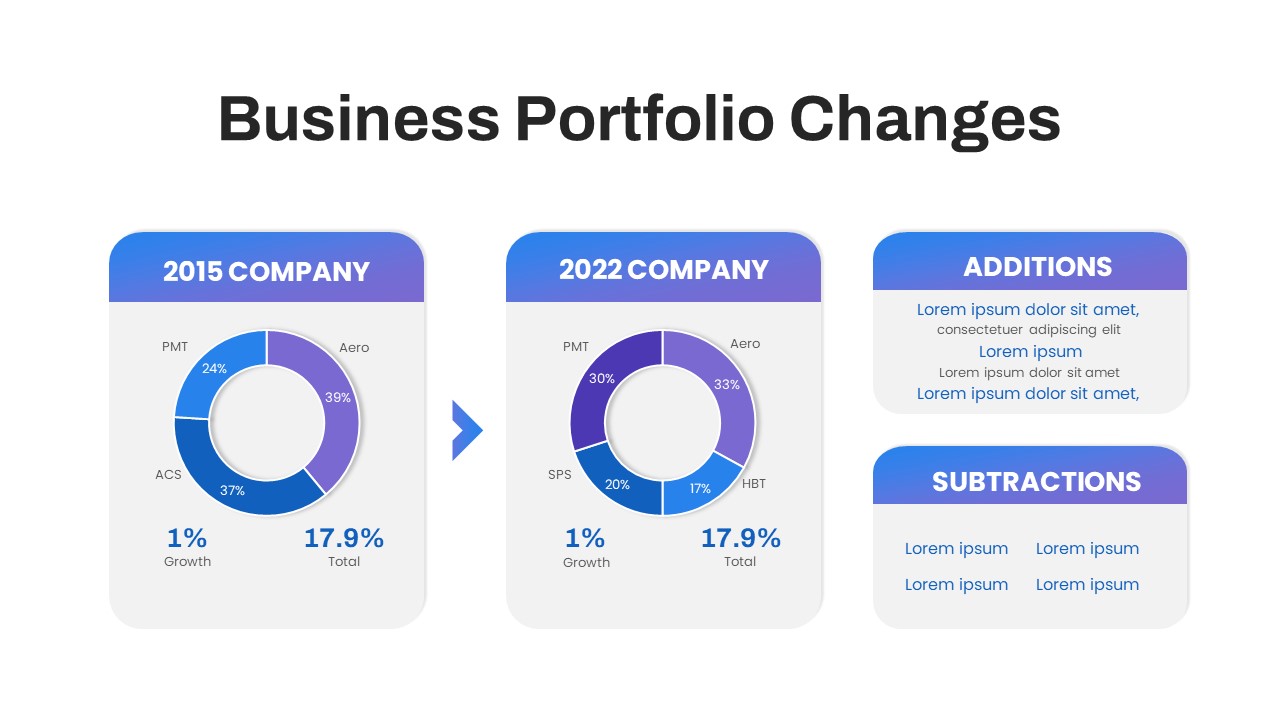
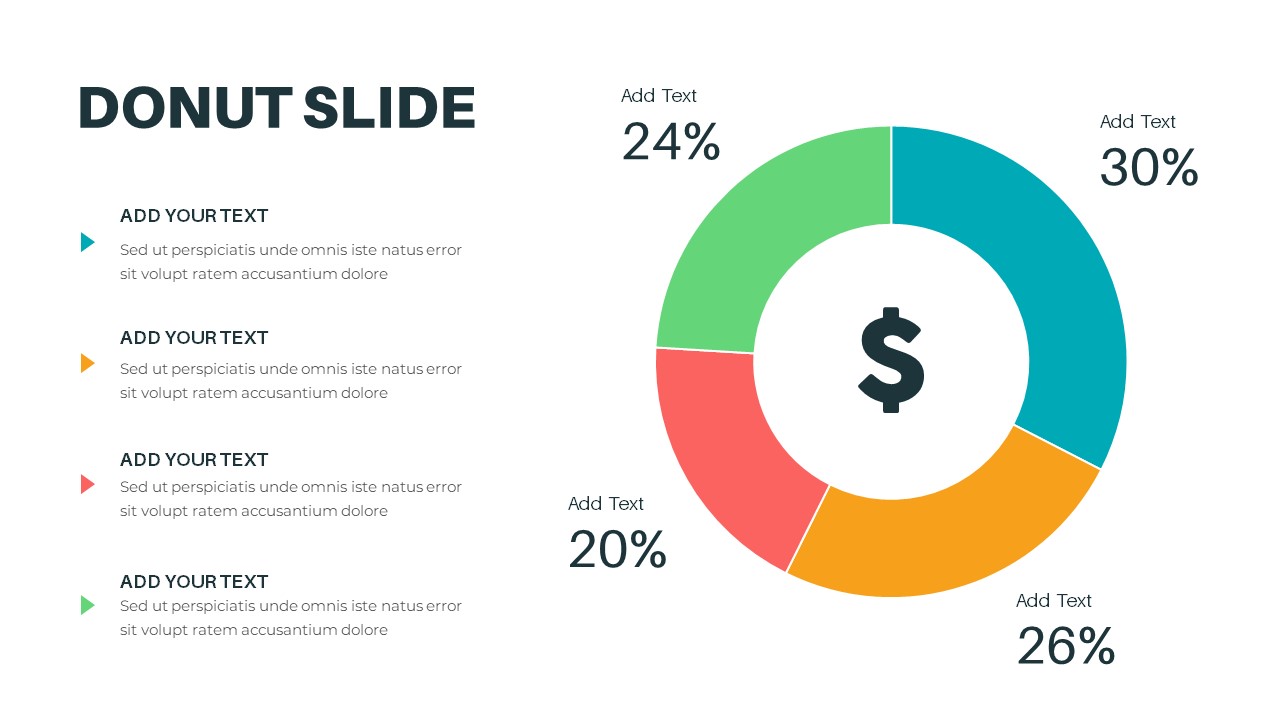
This “Donut Slide” offers a clean and engaging way to present percentage-based data or proportions using a circular donut chart. The slide includes four distinct segments, each with customizable text boxes and percentages, ideal for showing how different parts contribute to the whole. The chart features a central icon of a dollar sign, making it particularly useful for financial presentations, budgets, sales breakdowns, or market share analysis.
The colors—green, teal, orange, and red—allow for easy differentiation between each segment, helping your audience quickly grasp the relative size of each portion. This minimalist design, combined with a simple but effective chart, ensures your data is presented clearly and professionally.
The slide is fully editable, allowing you to modify text, adjust percentages, and even replace the central icon to better suit your specific content. Whether you’re discussing financial performance, product sales, or other data-driven topics, this donut chart provides an attractive and efficient way to communicate information in both PowerPoint and Google Slides.
Who is it for
This slide is perfect for financial analysts, business executives, marketers, and anyone in need of presenting quantitative data. It’s ideal for reporting, budget analysis, sales breakdowns, or any situation that requires the visualization of proportions or market share.
Other Uses
Besides finance-related topics, this slide can be adapted for use in project status reports, resource allocation, or any comparison involving multiple parts of a whole. It is also useful in marketing presentations for showing campaign performance or in operations to demonstrate resource distribution.
Login to download this file

Item ID
SB03232
Related Templates

Donut Chart template for PowerPoint & Google Slides
Pie/Donut
Donut Chart template for PowerPoint & Google Slides
Pie/Donut
Donut Chart Split Template for PowerPoint & Google Slides
Charts
Success Key Diagram with Donut Chart Template for PowerPoint & Google Slides
Pie/Donut

Eight Section Donut Chart Infographic Template for PowerPoint & Google Slides
Pie/Donut
30-60-90 Day Donut Chart Plan Infographic Template for PowerPoint & Google Slides
Timeline
Use of Funds Donut Chart Infographic Template for PowerPoint & Google Slides
Circular
Cost Reduction Strategy Donut Chart Template for PowerPoint & Google Slides
Pie/Donut
Donut Chart Data Breakdown template for PowerPoint & Google Slides
Pie/Donut
Donut Chart for PowerPoint & Google Slides
Pie/Donut
Donut Chart for PowerPoint & Google Slides
Pie/Donut
Donut Chart Presentation for PowerPoint & Google Slides
Pie/Donut
Business Portfolio Changes Donut Chart Template for PowerPoint & Google Slides
Pie/Donut
Technical Skills Donut Chart Overview Template for PowerPoint & Google Slides
HR
Marketing Budget Allocation Donut Chart Template for PowerPoint & Google Slides
Marketing
Three Segment Donut Chart KPI Infographic Template for PowerPoint & Google Slides
Pie/Donut

Comparison Donut Chart PowerPoint Template and Keynote
Pie/Donut
Donut Split Analysis template for PowerPoint & Google Slides
Pie/Donut
Budget Forecast Dashboard & Donut Charts Template for PowerPoint & Google Slides
Pie/Donut
Quad Chart Infographic Pack of 8 Slides Template for PowerPoint & Google Slides
Comparison Chart
Free Professional Gantt Chart Pack – 4 Slides Template for PowerPoint & Google Slides
Gantt Chart
Free

Creative data chart analytics template for PowerPoint & Google Slides
Charts
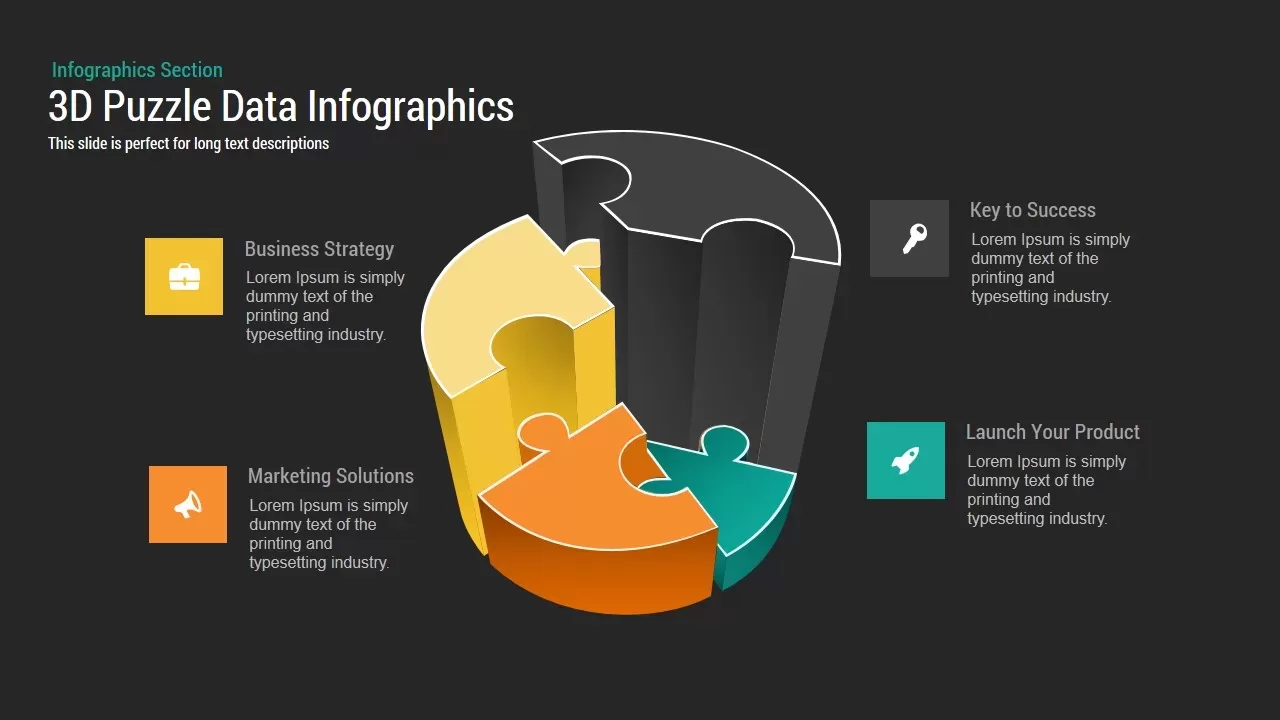
3D Puzzle Chart template for PowerPoint & Google Slides
Infographics
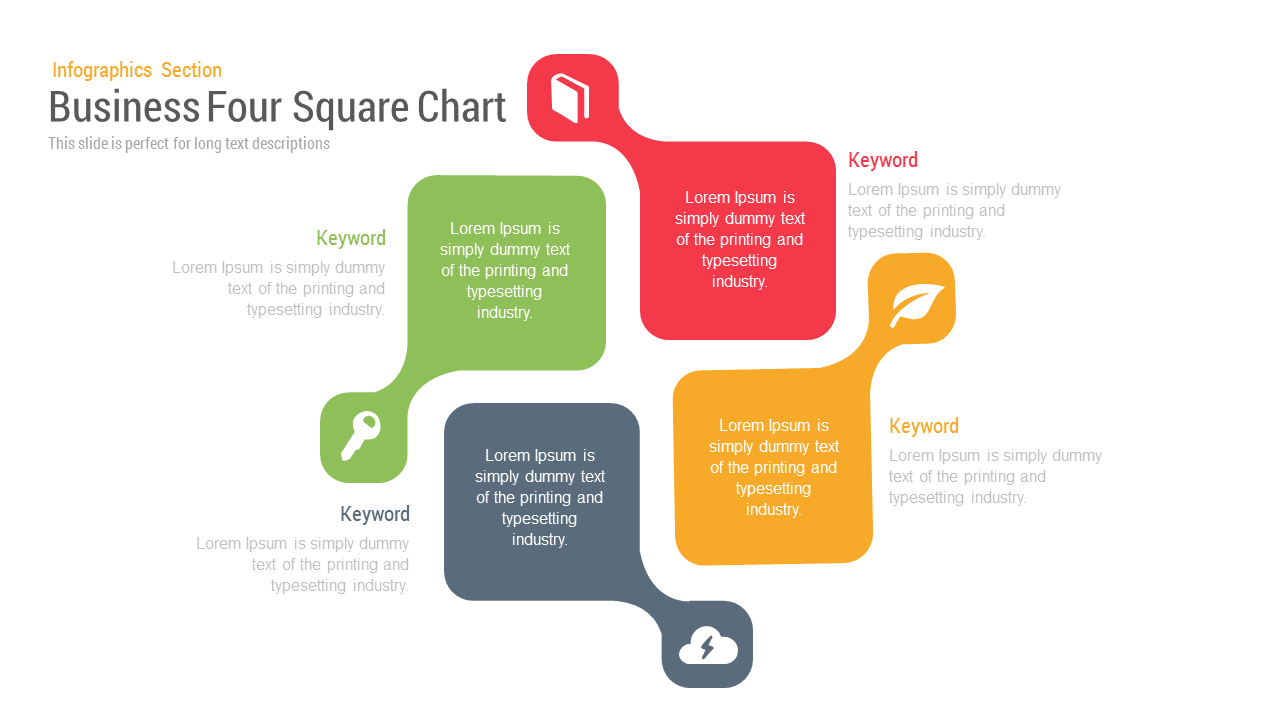
Business Four Square Chart template for PowerPoint & Google Slides
Business

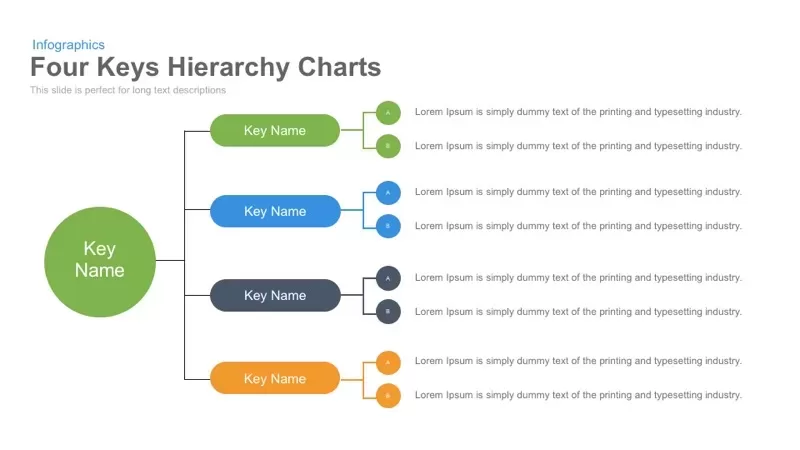
Four Keys Hierarchy Chart template for PowerPoint & Google Slides
Process
Profit Performance Trend Chart Template for PowerPoint & Google Slides
Finance
3D Bar Chart Data Infographics Template for PowerPoint & Google Slides
Bar/Column
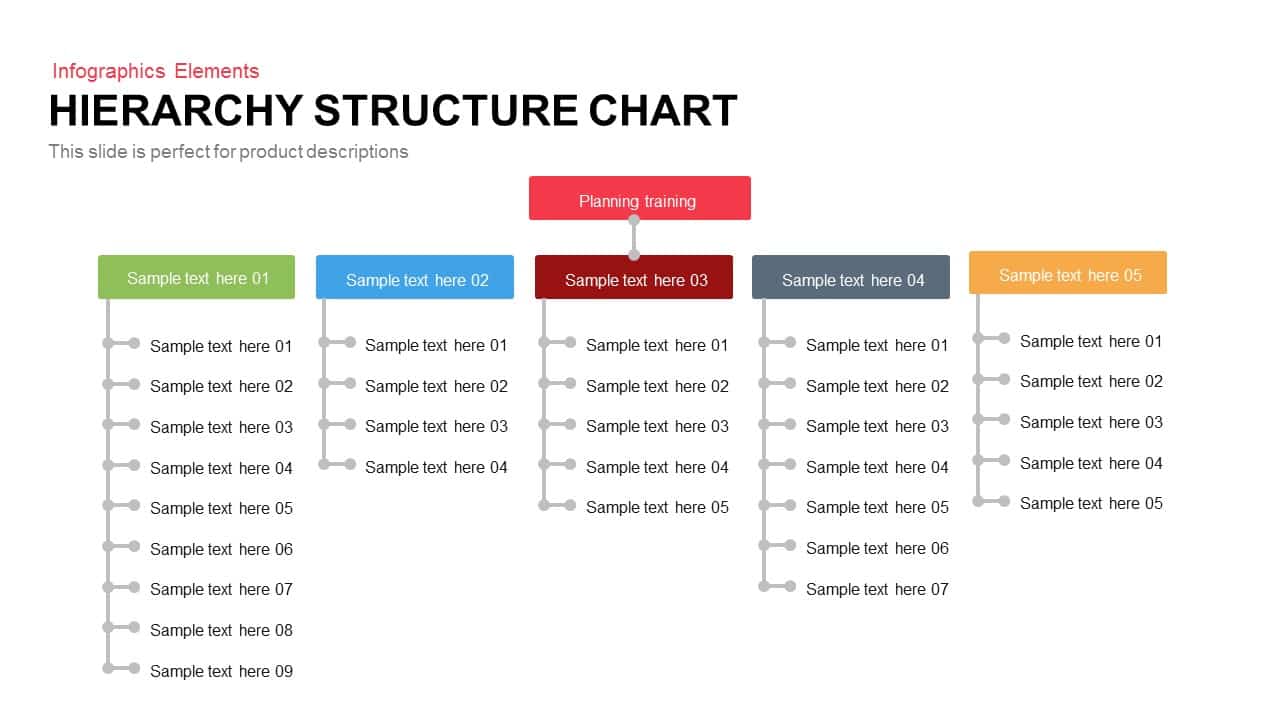
Five-Branch Hierarchy Structure Chart template for PowerPoint & Google Slides
Org Chart
Four Section Comparison Chart Diagram Template for PowerPoint & Google Slides
Infographics
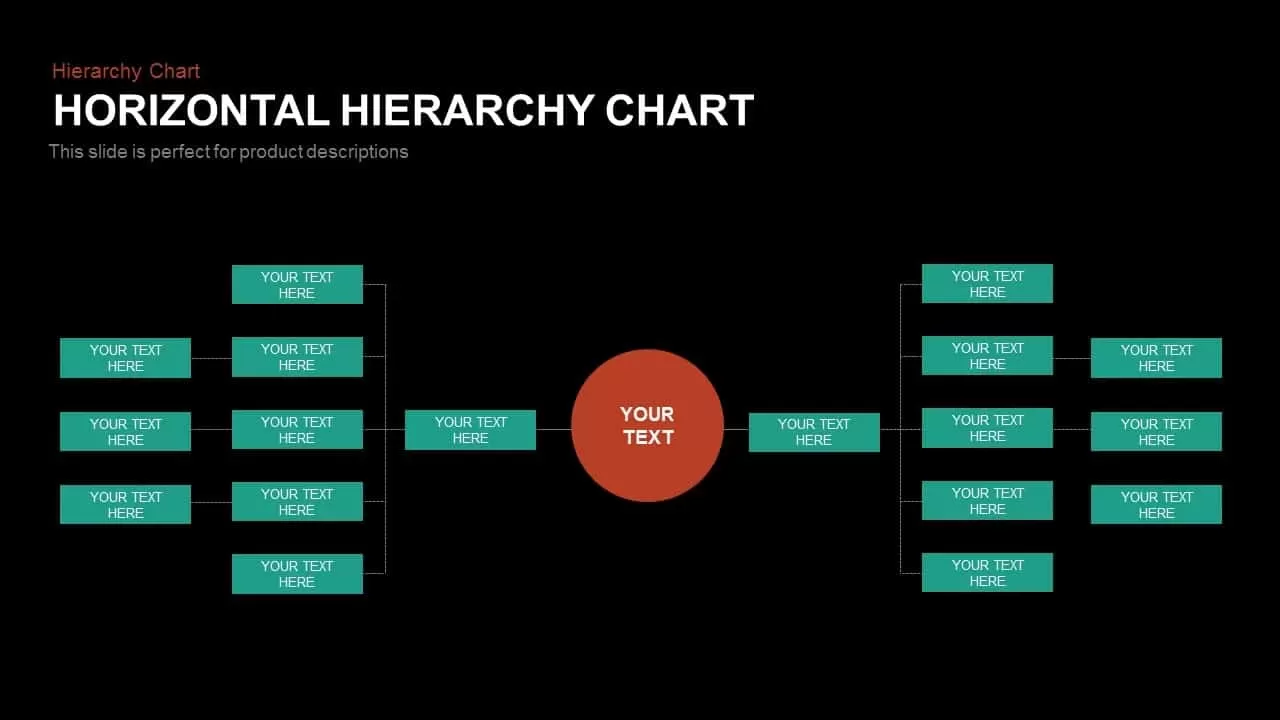
Horizontal Org Chart template for PowerPoint & Google Slides
Org Chart
3D Cone Chart Data Visualization template for PowerPoint & Google Slides
Bar/Column
Product Roadmap Gantt Chart Timeline template for PowerPoint & Google Slides
Gantt Chart
Organizational Structure Org Chart Template for PowerPoint & Google Slides
Org Chart
3D Line Chart for PowerPoint & Google Slides
Charts
Weekly Data Chart Slide for PowerPoint & Google Slides
Comparison Chart
Line Chart Analysis template for PowerPoint & Google Slides
Charts

Cone Data Chart for PowerPoint & Google Slides
Charts

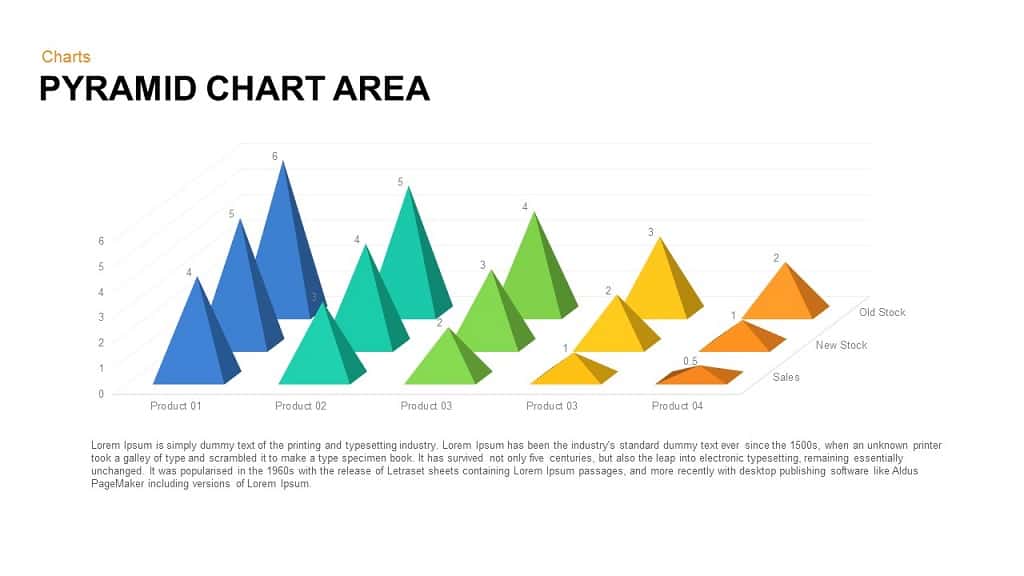
Pyramid Chart Area template for PowerPoint & Google Slides
Pyramid
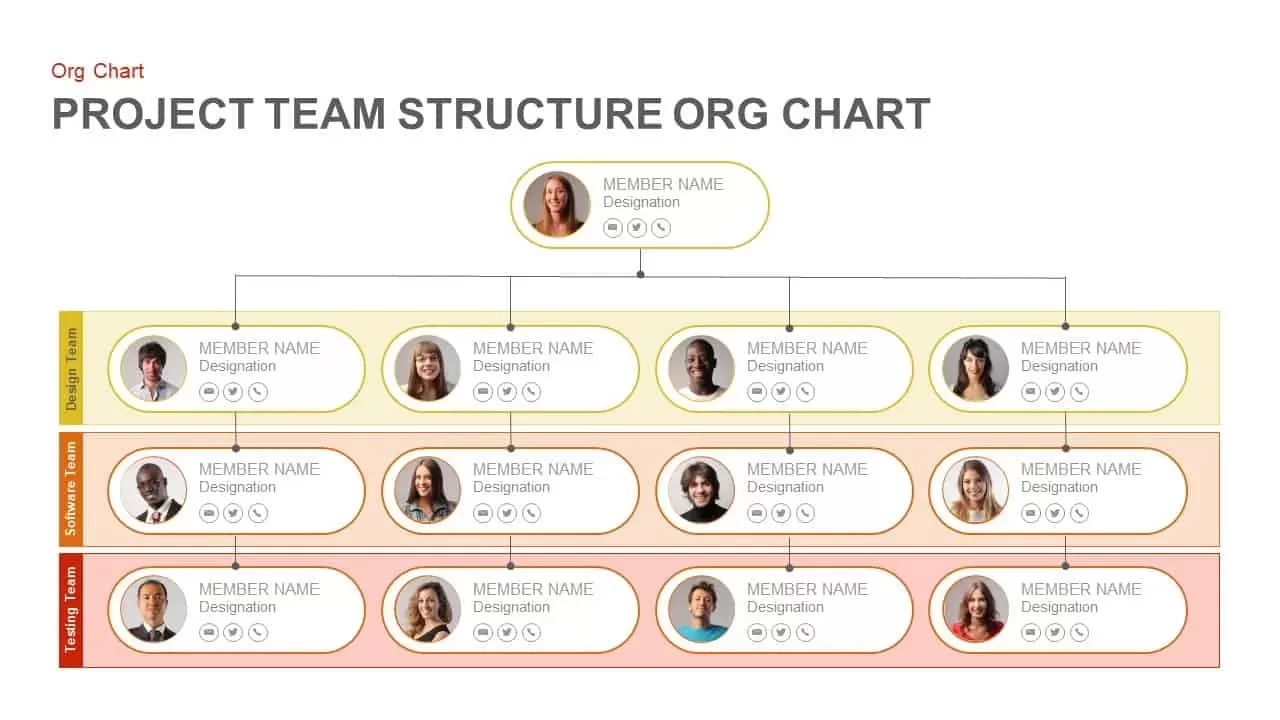
Project Team Structure Org Chart Template for PowerPoint & Google Slides
Org Chart
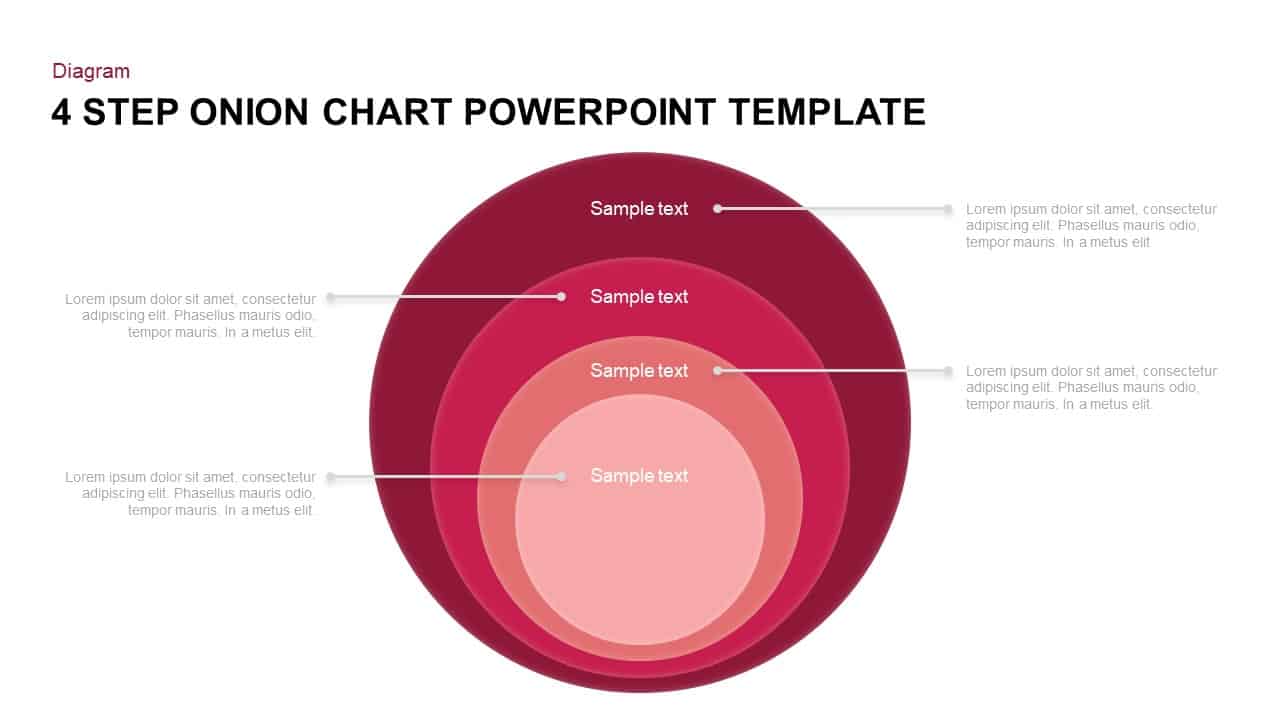
Four-Step Onion Chart Process Template for PowerPoint & Google Slides
Charts
RASCI Responsibility Matrix Chart Template for PowerPoint & Google Slides
Business
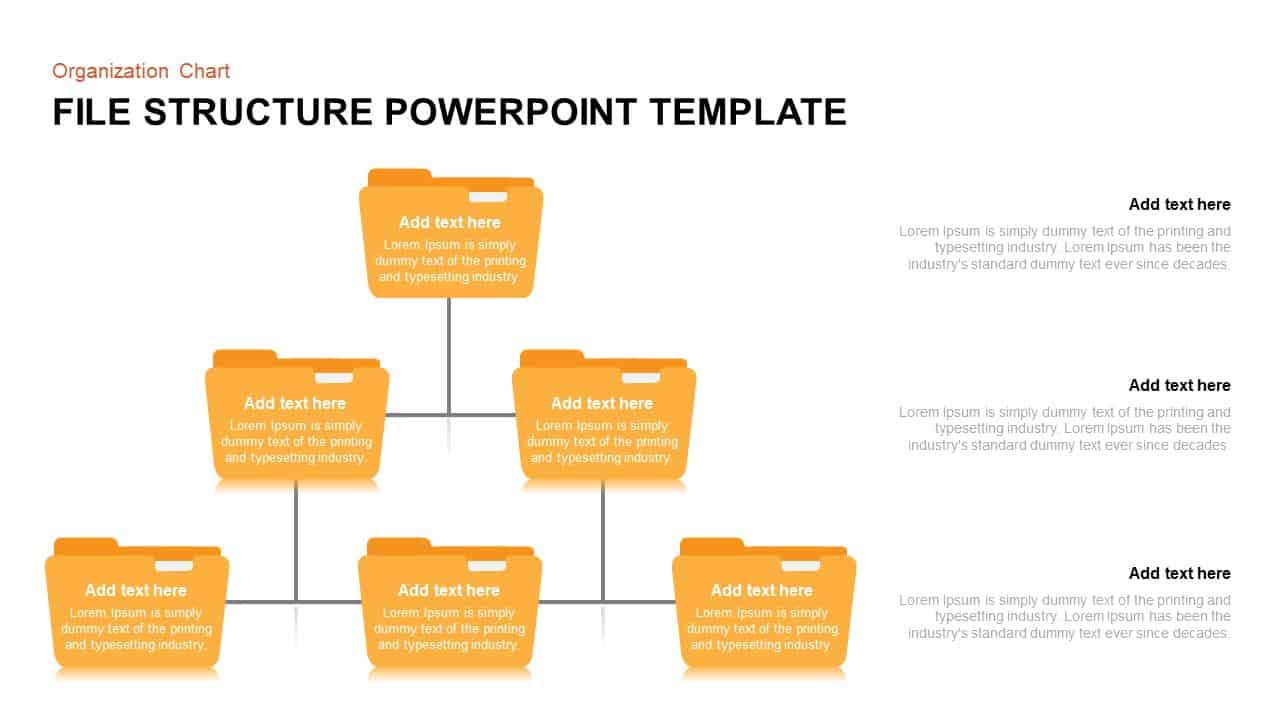
File Structure Organization Chart Template for PowerPoint & Google Slides
Org Chart
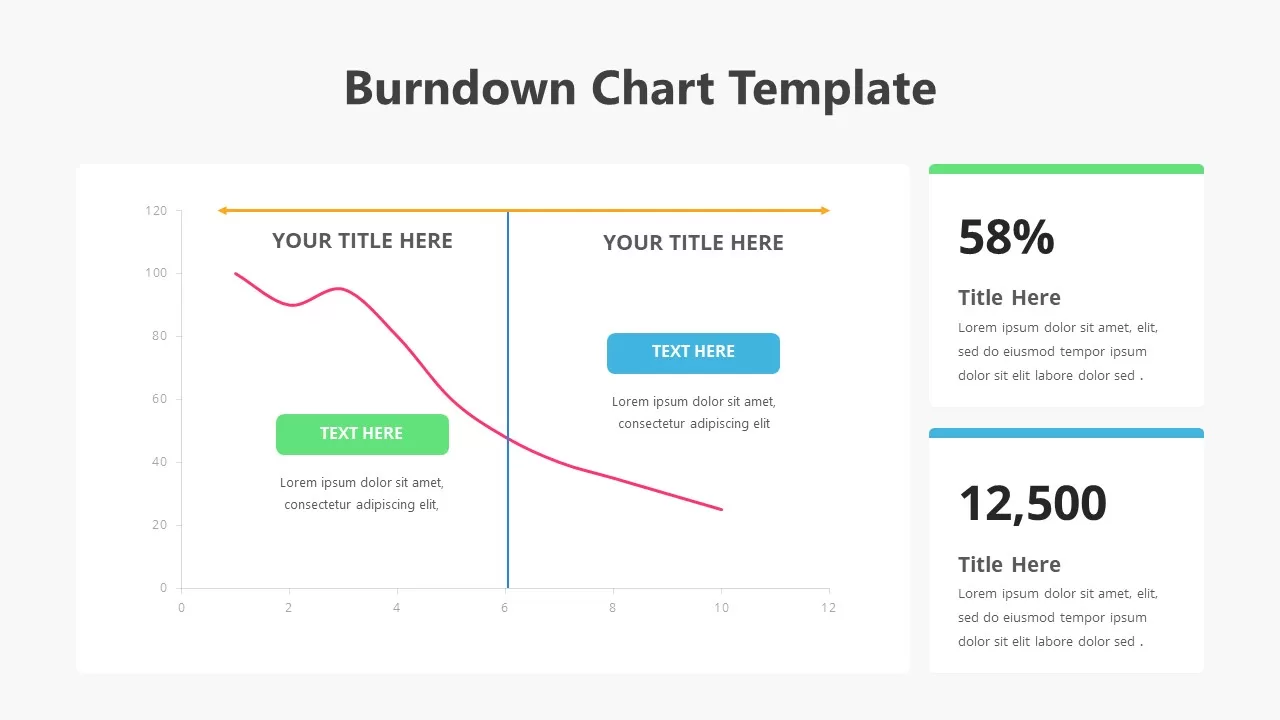
Burndown Chart Template for PowerPoint & Google Slides
Charts
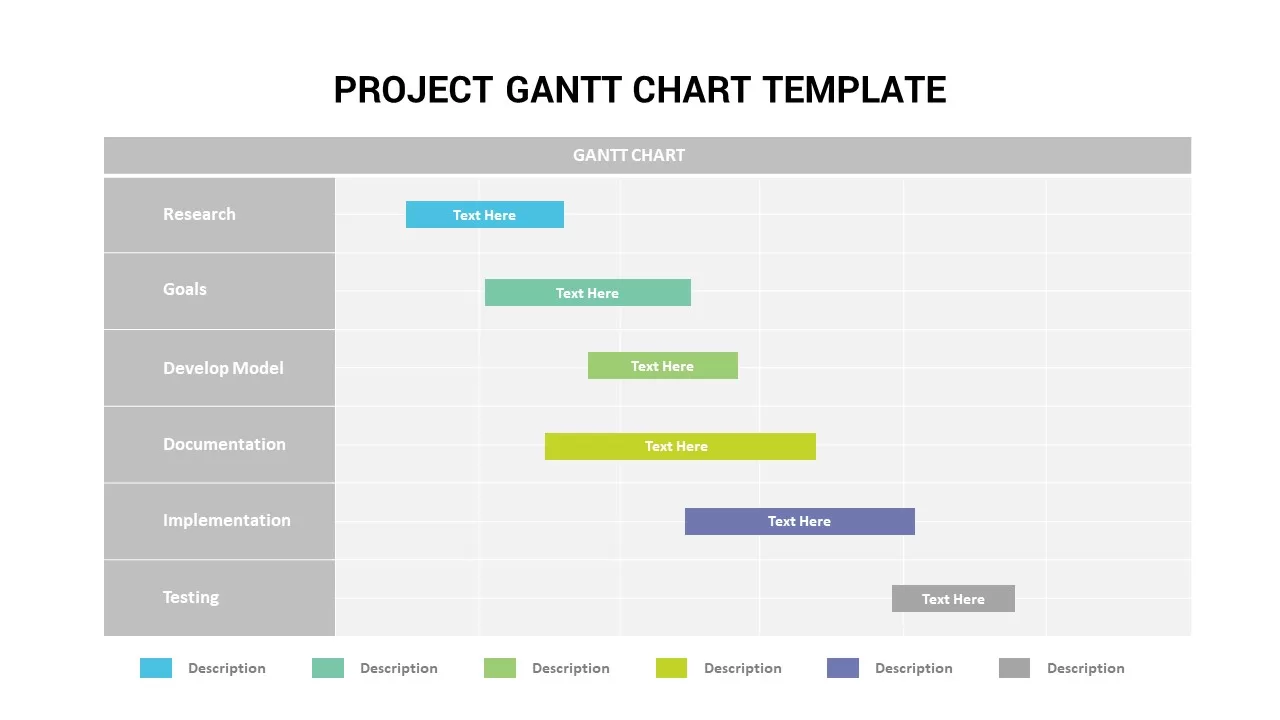
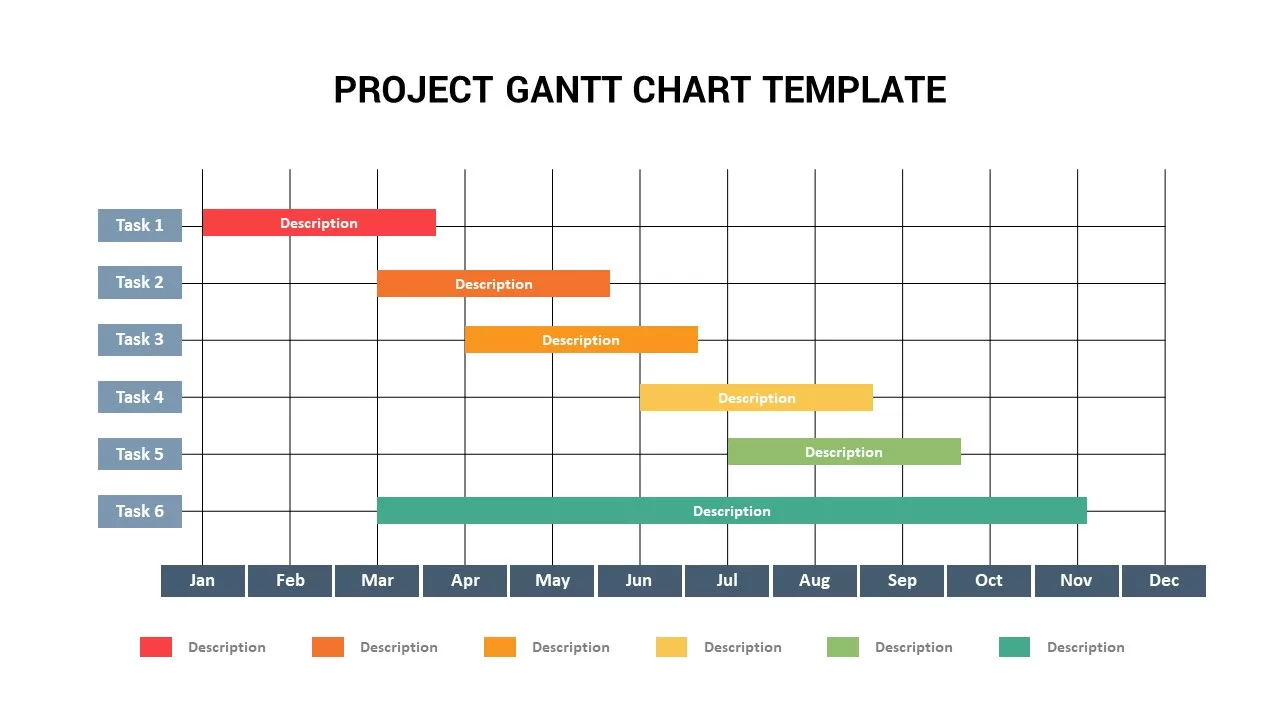
Project Gantt Chart template for PowerPoint & Google Slides
Gantt Chart
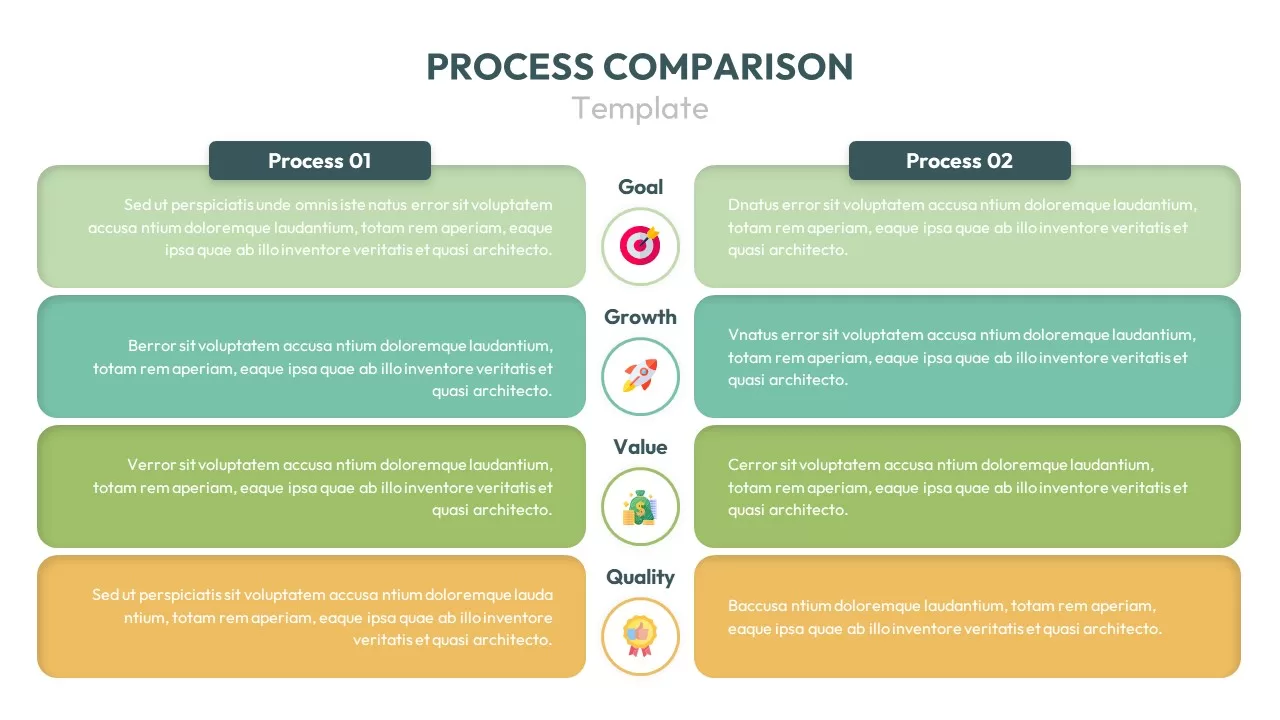
Process Comparison Chart for PowerPoint & Google Slides
Infographics
Pugh Matrix Decision Comparison Chart Template for PowerPoint & Google Slides
Comparison Chart
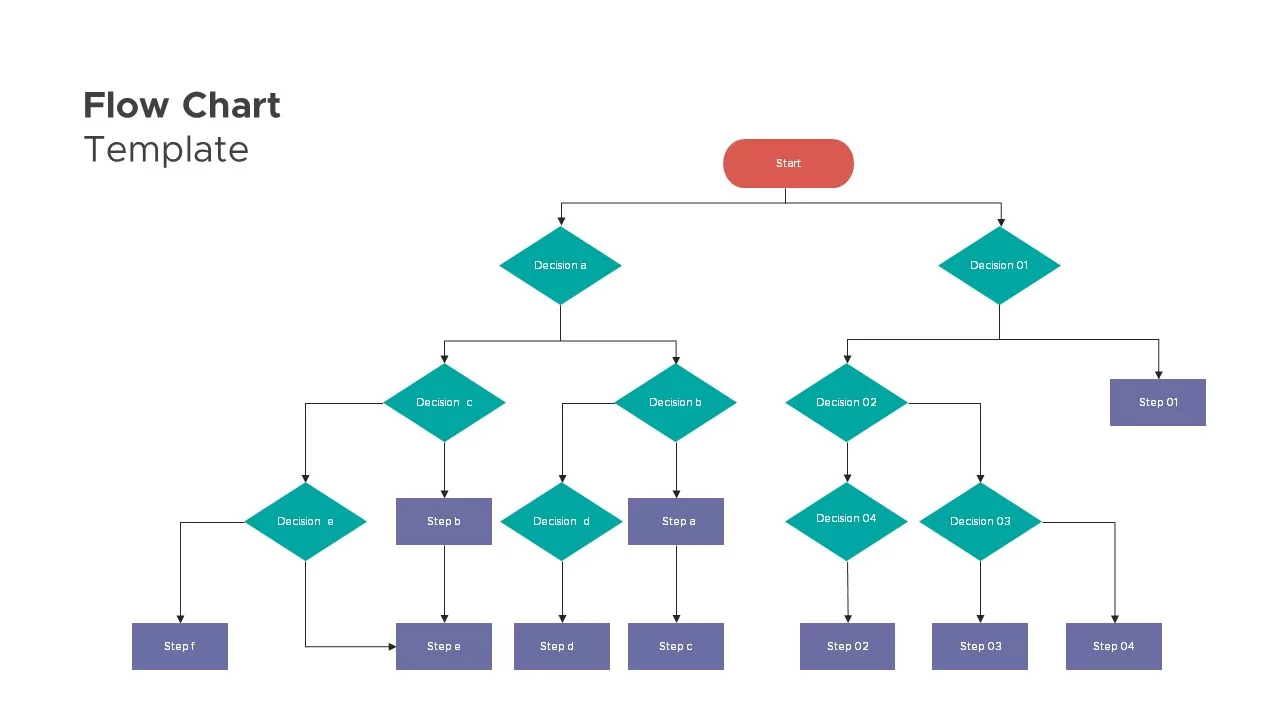
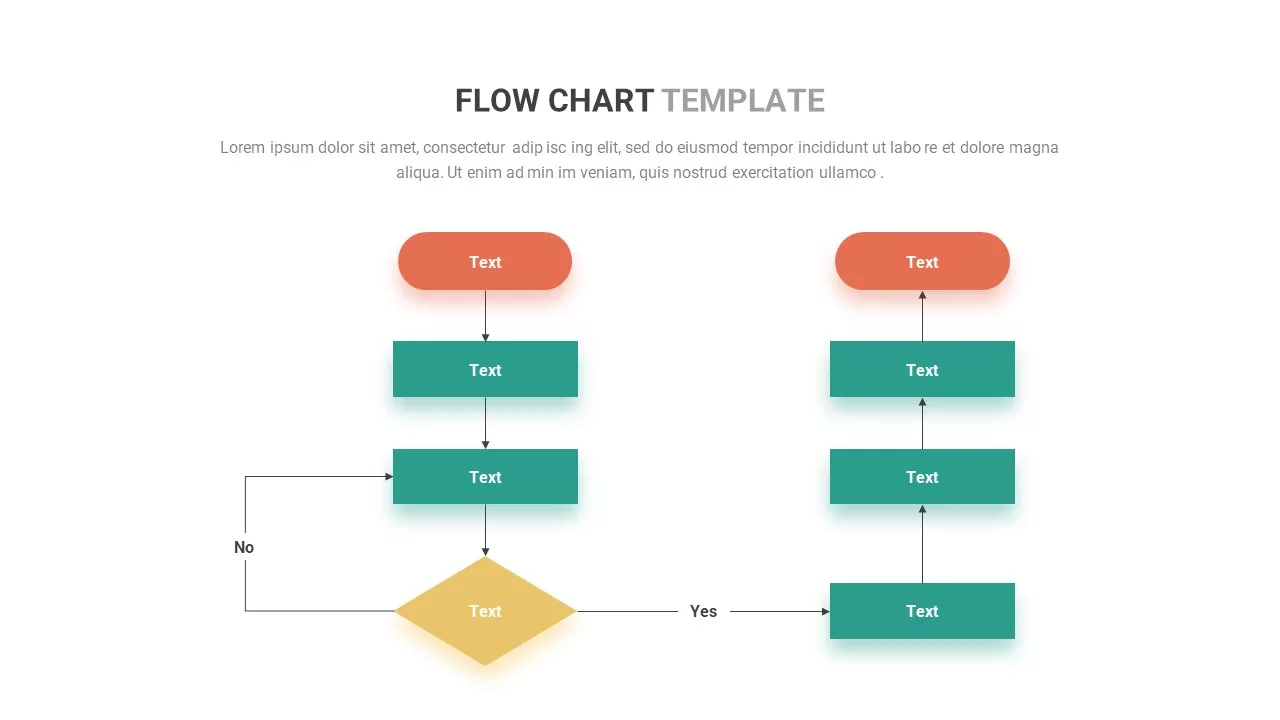
Flow Chart Diagram template for PowerPoint & Google Slides
Flow Charts
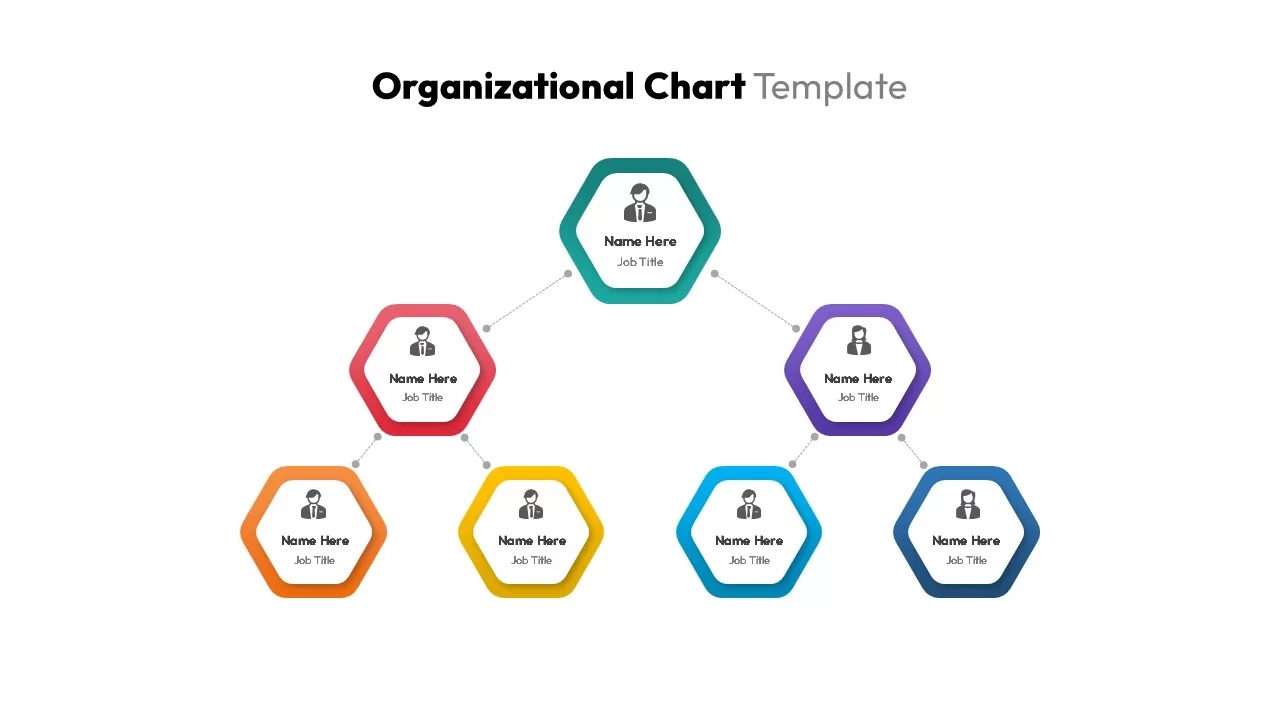
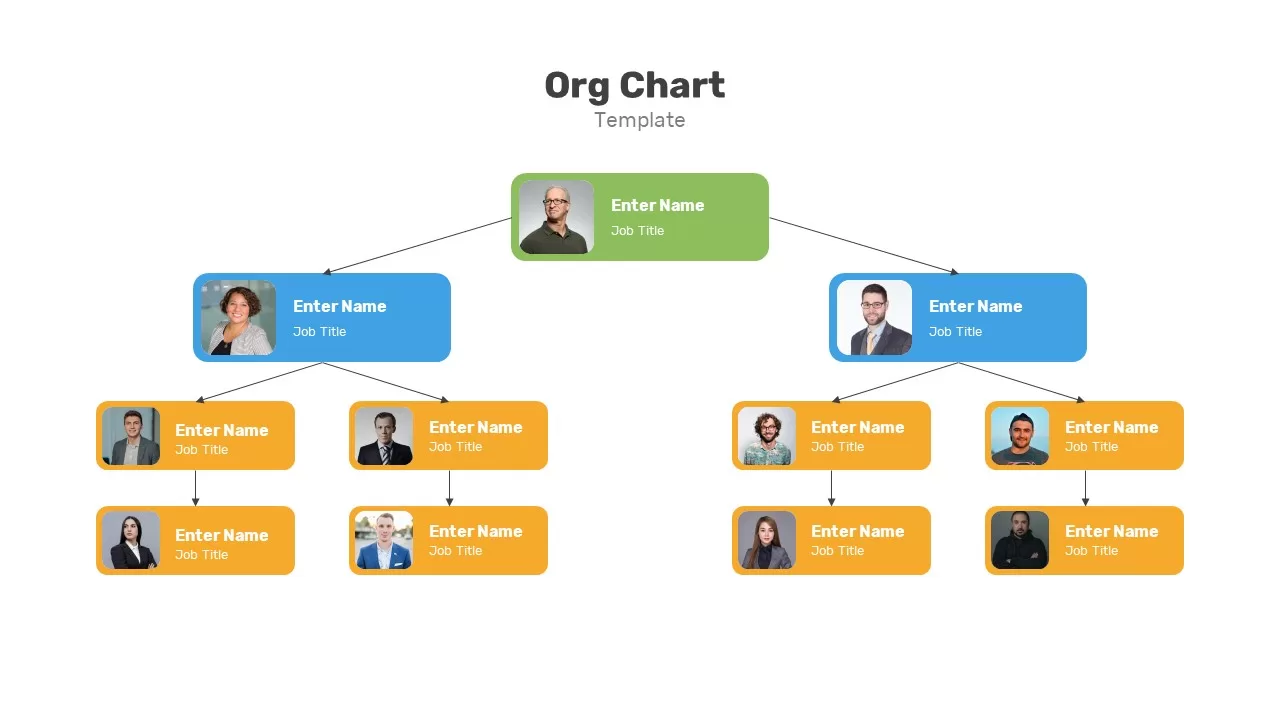
Organizational Chart Structure template for PowerPoint & Google Slides
Business Plan
Flow Chart Decision Tree Template for PowerPoint & Google Slides
Flow Charts
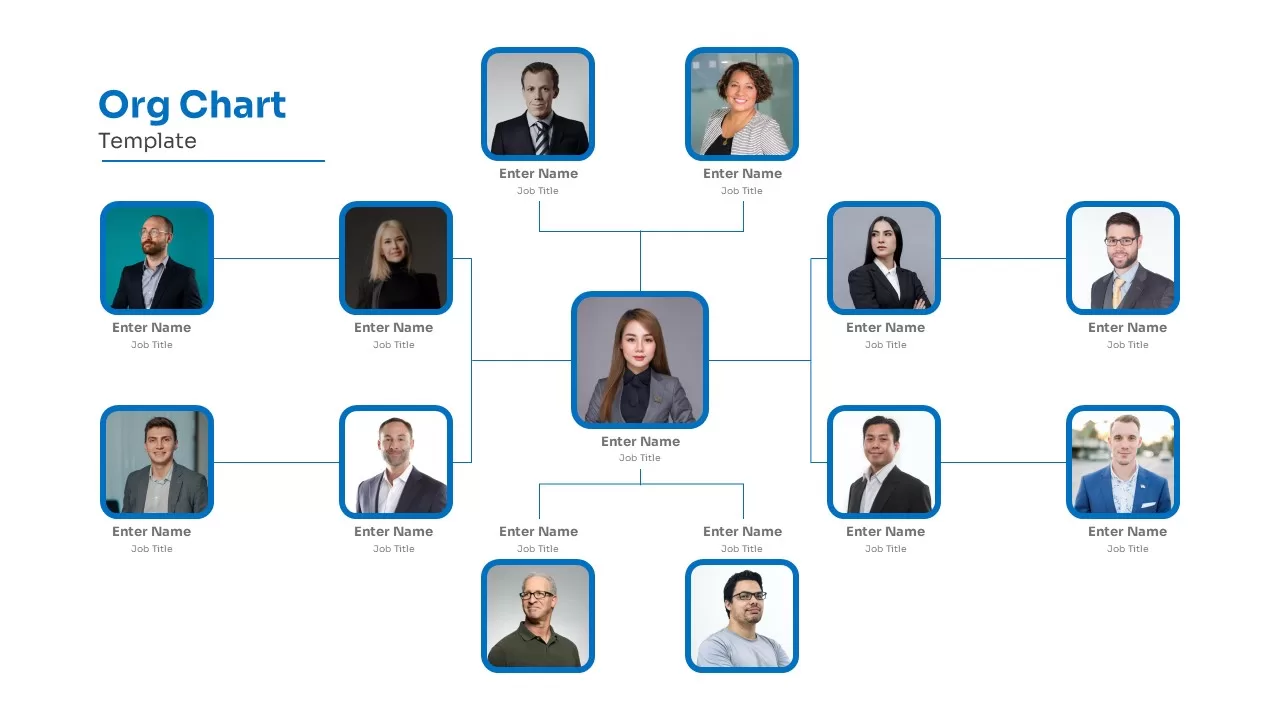
Organizational Chart Template for PowerPoint & Google Slides
Our Team
Flow Chart template for PowerPoint & Google Slides
Flow Charts
Organizational Chart template for PowerPoint & Google Slides
Org Chart
Annual Project Gantt Chart Timeline Template for PowerPoint & Google Slides
Gantt Chart
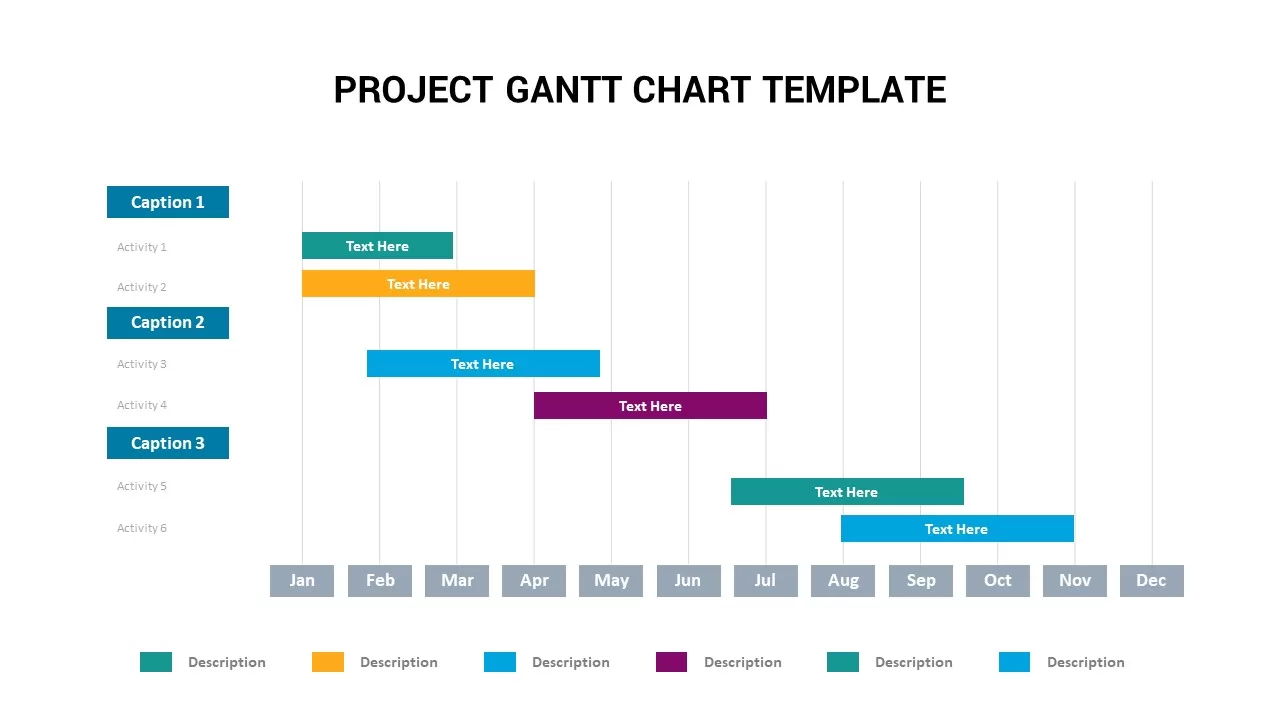
Project Gantt Chart Template for PowerPoint & Google Slides
Gantt Chart
Statistics Infographic & KPI Bar Chart Template for PowerPoint & Google Slides
Bar/Column
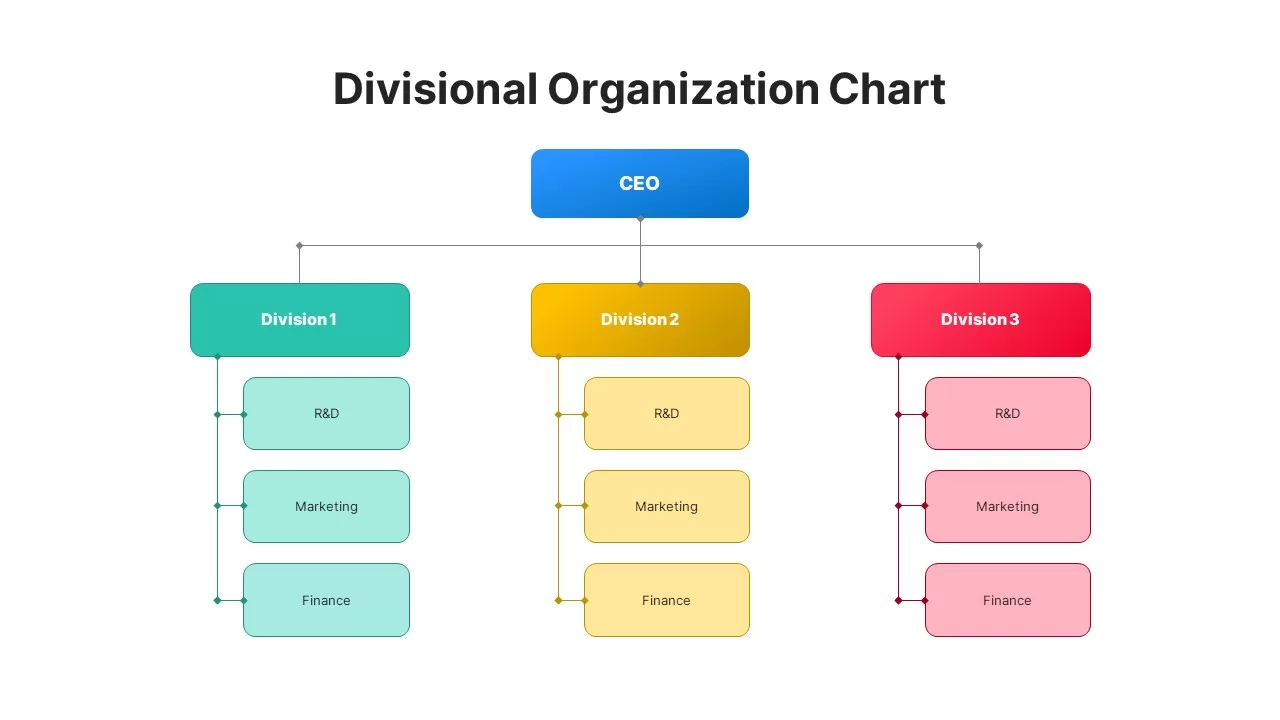
Divisional Organizational Chart Diagram Template for PowerPoint & Google Slides
Org Chart
Flat Organization Chart Diagram Template for PowerPoint & Google Slides
Org Chart
3D pie chart infographic template for PowerPoint & Google Slides
Pie/Donut
Stacked Bar Chart for PowerPoint & Google Slides
Bar/Column
MABA Attractiveness Matrix Chart Template for PowerPoint & Google Slides
Comparison Chart
Comprehensive Hiring Process Flow Chart Template for PowerPoint & Google Slides
Flow Charts
Overlapping Timeline Gantt Chart Diagram Template for PowerPoint & Google Slides
Timeline
Waffle Chart Data Visualization Template for PowerPoint & Google Slides
Comparison Chart
People Demographic Comparison Chart Template for PowerPoint & Google Slides
Comparison
Population Pyramid Chart Analysis Template for PowerPoint & Google Slides
Bar/Column
Free Editable Simple Column Chart Slide Template for PowerPoint & Google Slides
Bar/Column
Free
Minimal Multi-Year Column Chart Template for PowerPoint & Google Slides
Bar/Column
Waterfall Column Chart Analysis Template for PowerPoint & Google Slides
Bar/Column
Professional Clustered Column Chart Template for PowerPoint & Google Slides
Bar/Column
Colorful Four-Segment Wheel Chart Template for PowerPoint & Google Slides
Circular
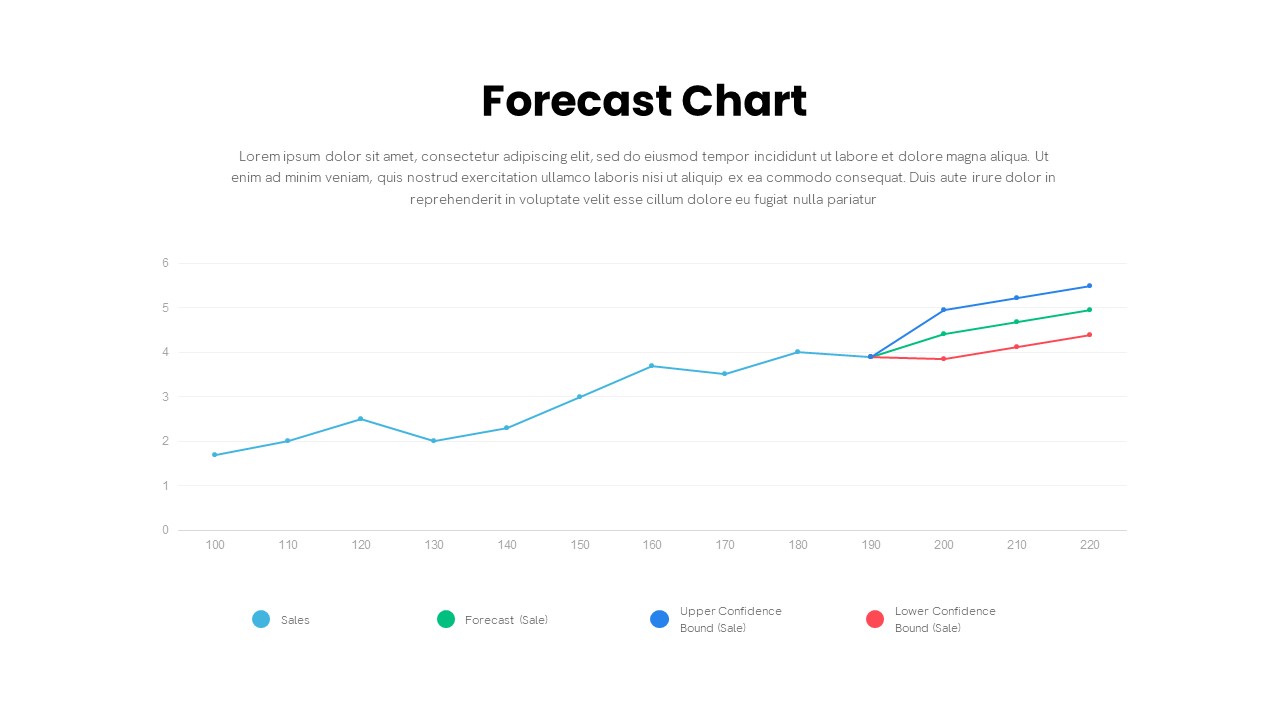
Forecast Chart with Confidence Bounds Template for PowerPoint & Google Slides
Comparison Chart
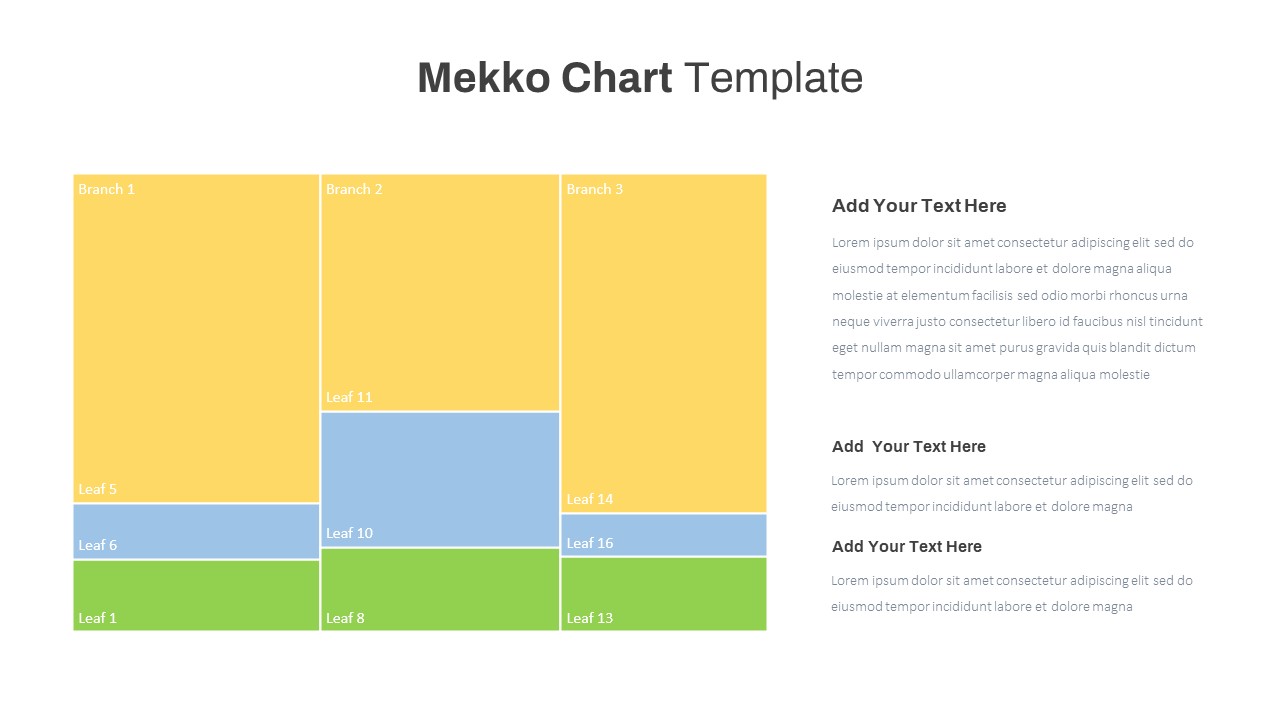
Mekko Chart with Segmented Branches & Leaves Template for PowerPoint & Google Slides
Bar/Column
Five-Phase Horizontal Timeline Chart Template for PowerPoint & Google Slides
Timeline
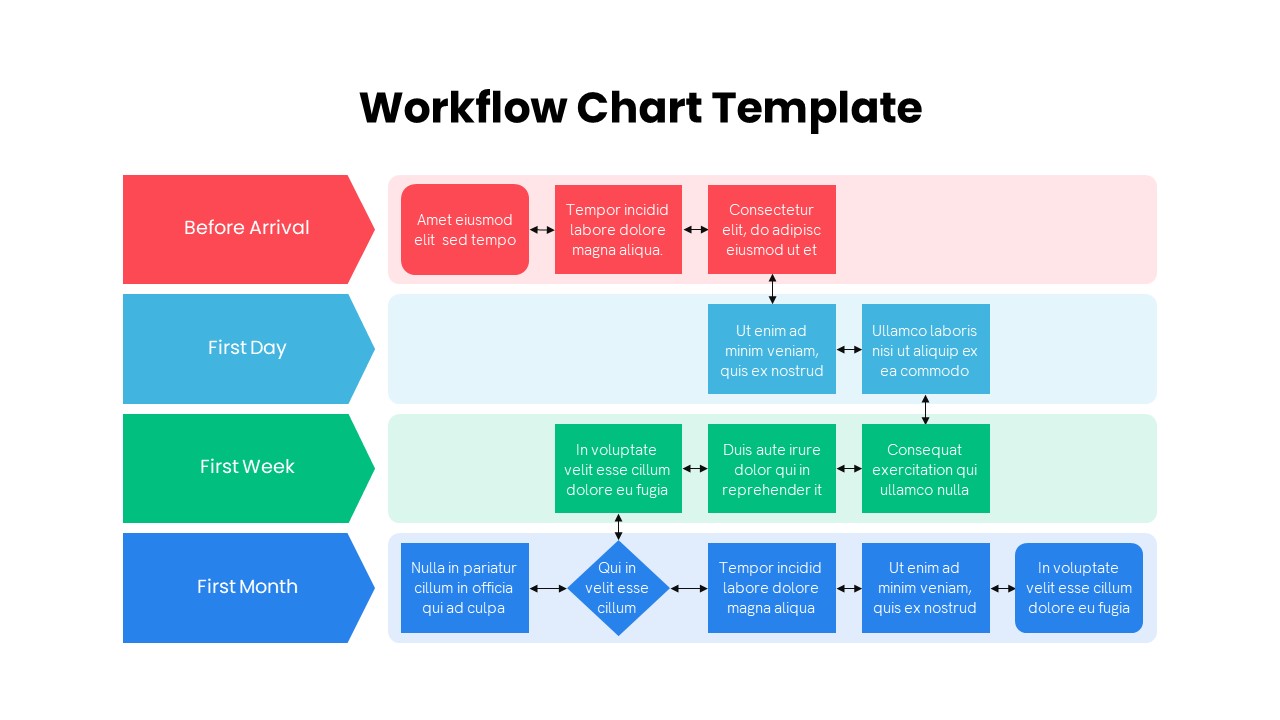
Colorful Multistage Workflow Chart Template for PowerPoint & Google Slides
Flow Charts
Mirror Bar Chart Comparison Template for PowerPoint & Google Slides
Bar/Column
Dynamic Three-Series Stacked Area Chart Template for PowerPoint & Google Slides
Comparison Chart
Free Learning Retention Pyramid Chart Template for PowerPoint & Google Slides
Pyramid
Free
Professional Milestone Timeline Chart Template for PowerPoint & Google Slides
Timeline
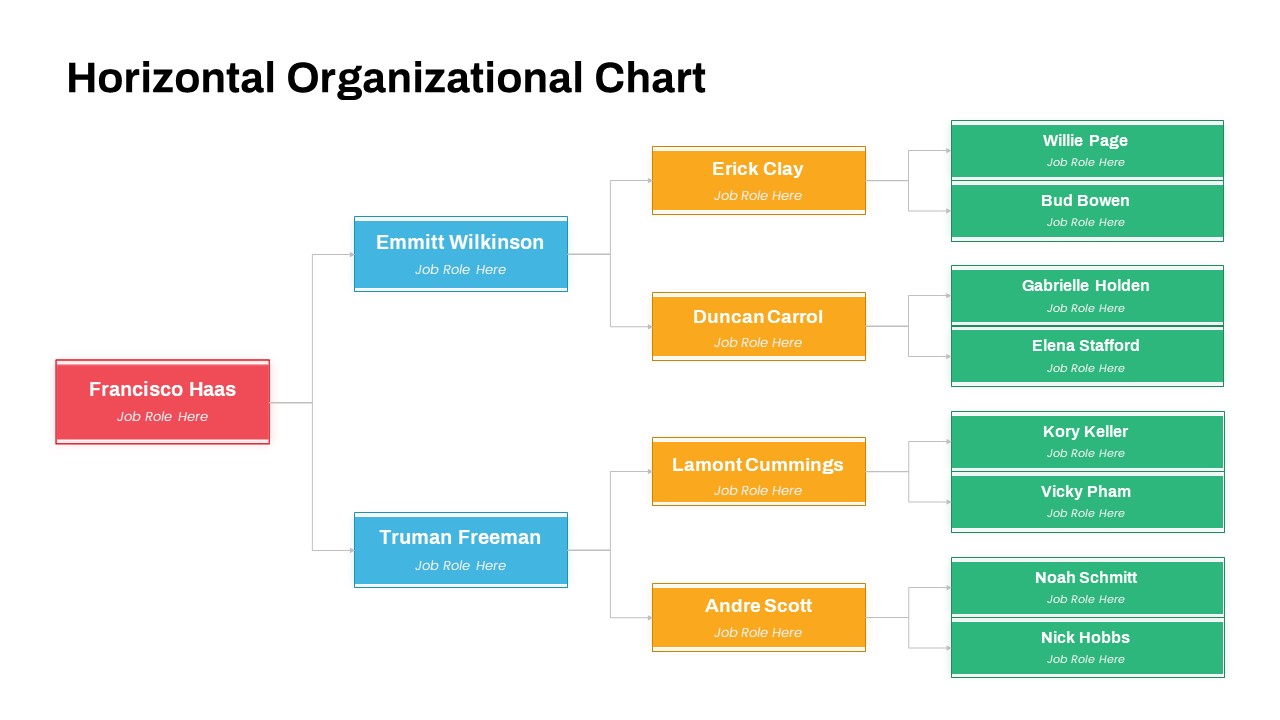
Horizontal Organizational Chart Template for PowerPoint & Google Slides
Org Chart
Modern Multi-Color Polar Chart Diagram Template for PowerPoint & Google Slides
Charts
Segmented Scatter Chart Data Visualization Template for PowerPoint & Google Slides
Business Strategy
Proportional Area Chart Analysis Template for PowerPoint & Google Slides
Comparison Chart
Skimming Pricing Strategy Line Chart Template for PowerPoint & Google Slides
Business Strategy
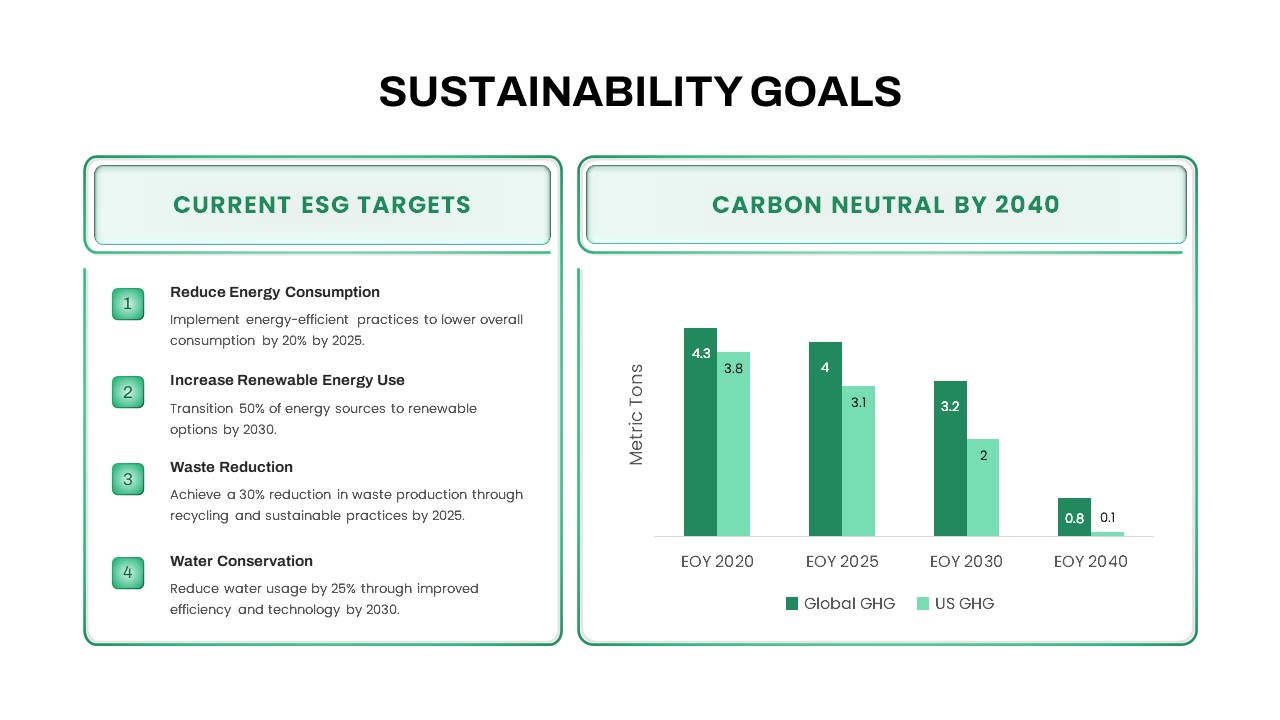
Sustainability Goals and Targets Chart Template for PowerPoint & Google Slides
Goals
ESG Initiatives Comparison Chart Template for PowerPoint & Google Slides
Business
Decision Matrix & Prioritization Chart Template for PowerPoint & Google Slides
Comparison Chart
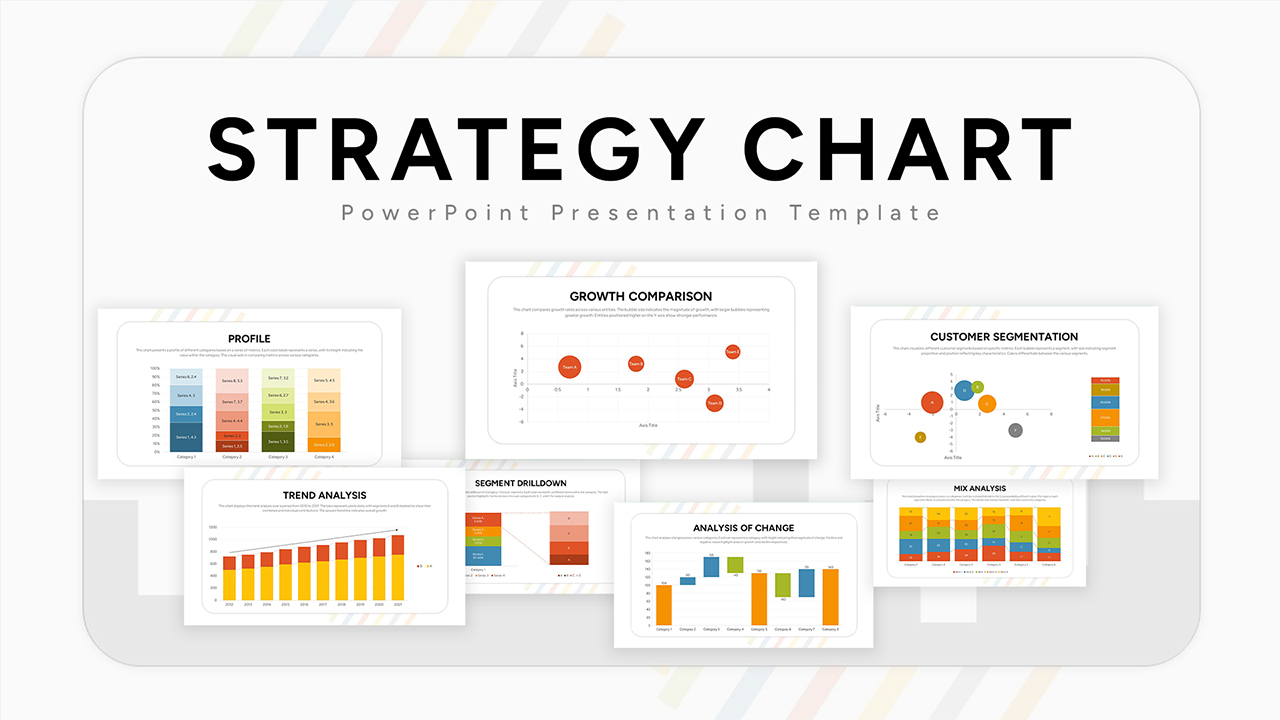
Ultimate Strategy Chart Presentation Template for PowerPoint & Google Slides
Charts
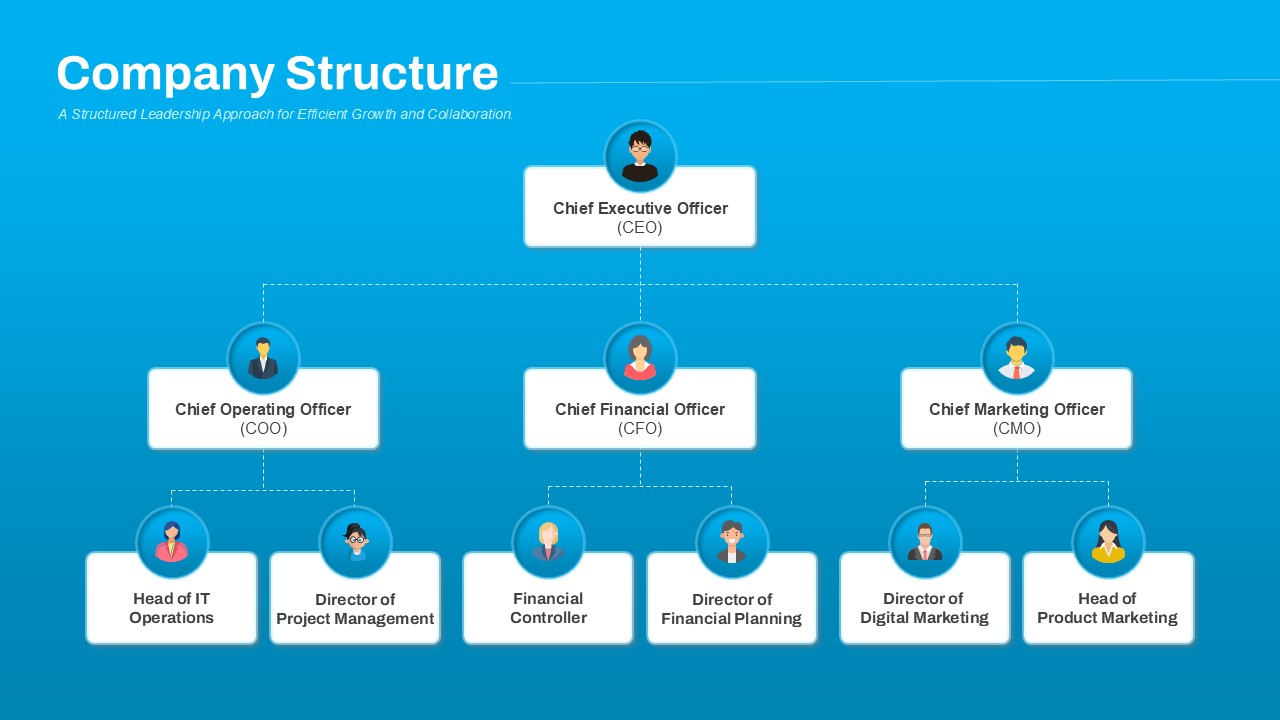
Company Structure Hierarchical Org Chart Template for PowerPoint & Google Slides
Org Chart
3D Pyramid Column Chart Infographic Template for PowerPoint & Google Slides
Bar/Column
Skills Gap Analysis Comparison Chart Template for PowerPoint & Google Slides
Gap
Color-Coded Gantt Chart template for PowerPoint & Google Slides
Business
Team Gantt Chart Overview template for PowerPoint & Google Slides
Project Status
Stacked Gantt Chart Timeline Slide Template for PowerPoint & Google Slides
Gantt Chart
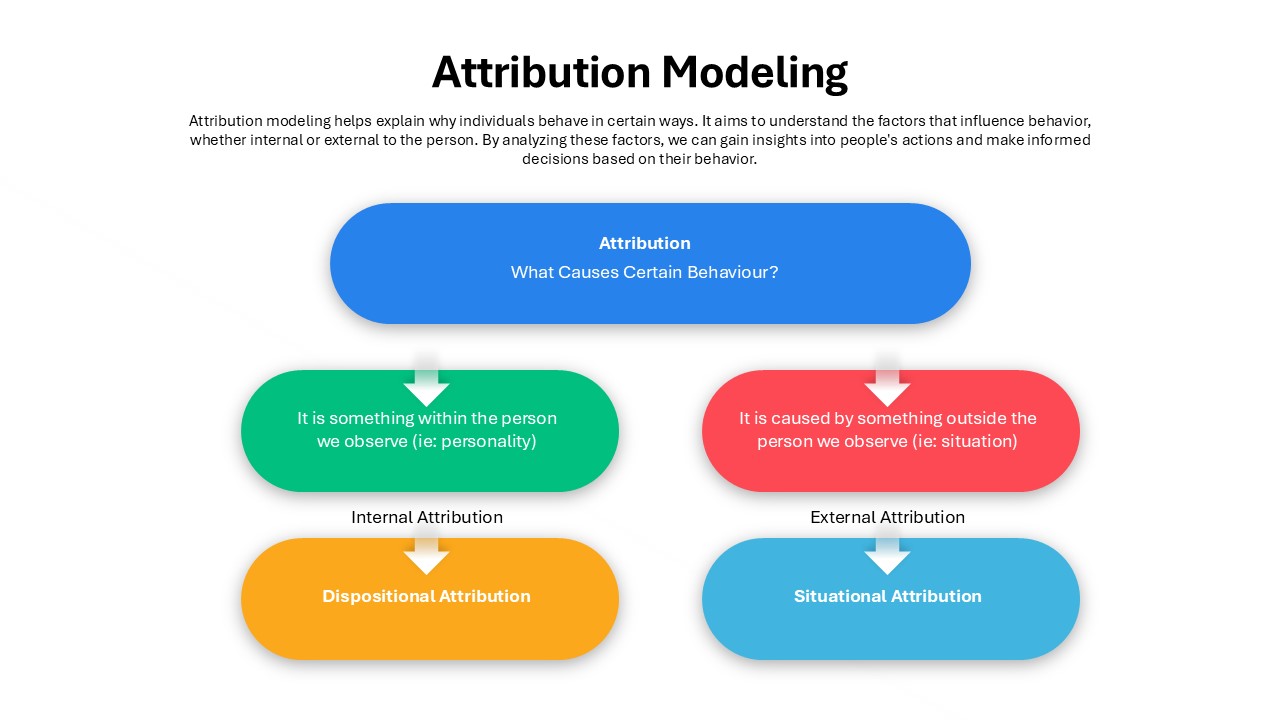
Attribution Modeling Flow Chart Template for PowerPoint & Google Slides
Flow Charts
Static Gantt Chart Overview template for PowerPoint & Google Slides
Project Status
Disaster Response Role Matrix RACI Chart Template for PowerPoint & Google Slides
Project Status
USA Map with Bar Chart Template for PowerPoint & Google Slides
World Maps
Yearly Gantt Chart with Presentation Template for PowerPoint & Google Slides
Gantt Chart
Quarterly Comparison Pie Chart Template for PowerPoint & Google Slides
Pie/Donut
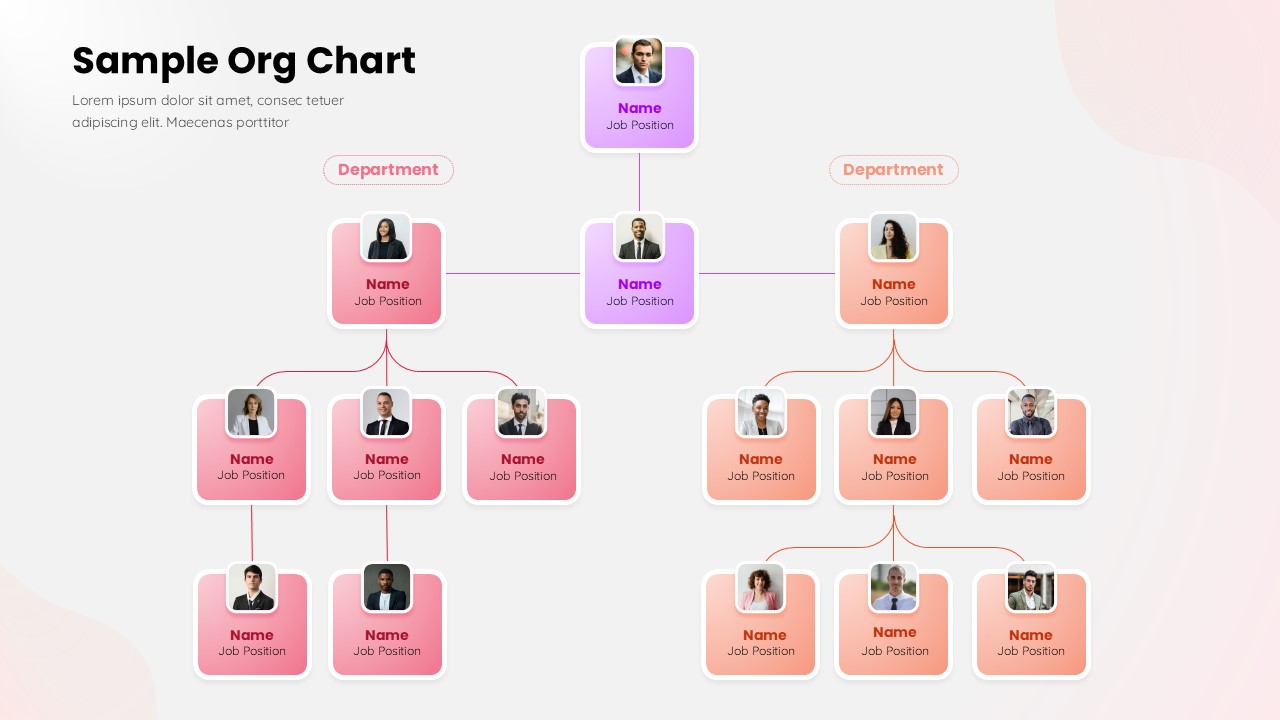
Sample Org Chart Template for PowerPoint & Google Slides
Org Chart