Description
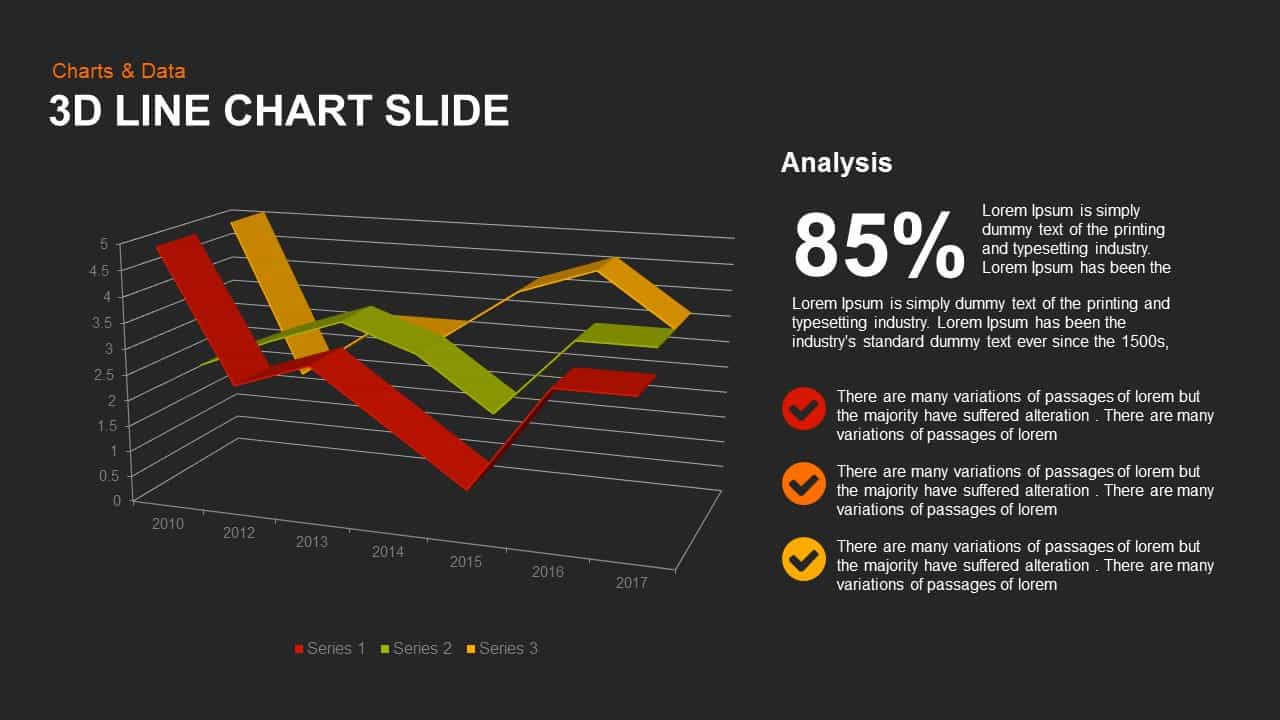
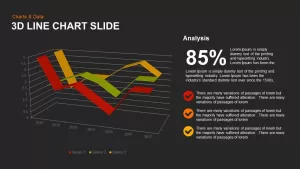
The 3D Line Chart slide offers a dynamic, visually engaging way to display trends over time. This chart uses three distinct colored lines (red, yellow, and green) to represent different data series, and its three-dimensional effect adds depth to the visual presentation. The chart is ideal for illustrating changes in values across multiple years, helping viewers quickly grasp key performance metrics, trends, or comparisons.
The accompanying analysis section provides space to interpret the data, highlighting key figures and insights like the 85% success rate shown in this example. The visual arrangement allows for both data-driven analysis and a brief commentary on trends, making it a versatile tool for presentations, reports, or business reviews.
Who is it for
This slide is perfect for data analysts, project managers, marketing teams, and business leaders who need to present performance metrics, growth trends, or comparative analysis across time periods. It is ideal for use in quarterly reviews, progress updates, and performance tracking.
Other Uses
Besides business presentations, this slide can also be repurposed for academic research, financial reports, or market research projects where visualizing data over time is crucial. Its clear design allows it to be customized for various industries and use cases, making it a versatile asset for any timeline-based analysis.
Login to download this file
No. of Slides
2Item ID
SB00725Rating
0.0
(0 reviews)
Related Templates

Line Chart Analysis template for PowerPoint & Google Slides
Charts

Application Revenue Line Chart KPI Template for PowerPoint & Google Slides
Revenue

Combination Bar and Line Chart Template for PowerPoint & Google Slides
Bar/Column

Editable Multi-Series Peak Line Chart Template for PowerPoint & Google Slides
Comparison Chart

Arrow Line Chart Template for PowerPoint & Google Slides
Comparison Chart

Data Over Time Line Chart template for PowerPoint & Google Slides
Charts

Growth Curve Line Chart Visualization Template for PowerPoint & Google Slides
Charts

Evolution Line Chart with Milestones Template for PowerPoint & Google Slides
Timeline

Multiple Line Chart Comparison Template for PowerPoint & Google Slides
Comparison Chart

Multi-Series Line Chart with Icons Template for PowerPoint & Google Slides
Comparison Chart

Interactive Jump Line Data Chart Template for PowerPoint & Google Slides
Comparison Chart

Skimming Pricing Strategy Line Chart Template for PowerPoint & Google Slides
Business Strategy

Dynamic Financial Analysis Line Chart Template for PowerPoint & Google Slides
Finance

Data-Driven Line Chart Diagram Template for PowerPoint
Comparison Chart

Line Graph Analysis template for PowerPoint & Google Slides
Charts

Multi-Series Curved Line Graph Analytics Template for PowerPoint & Google Slides
Comparison Chart

Curved Line Graph for PowerPoint & Google Slides
Timeline

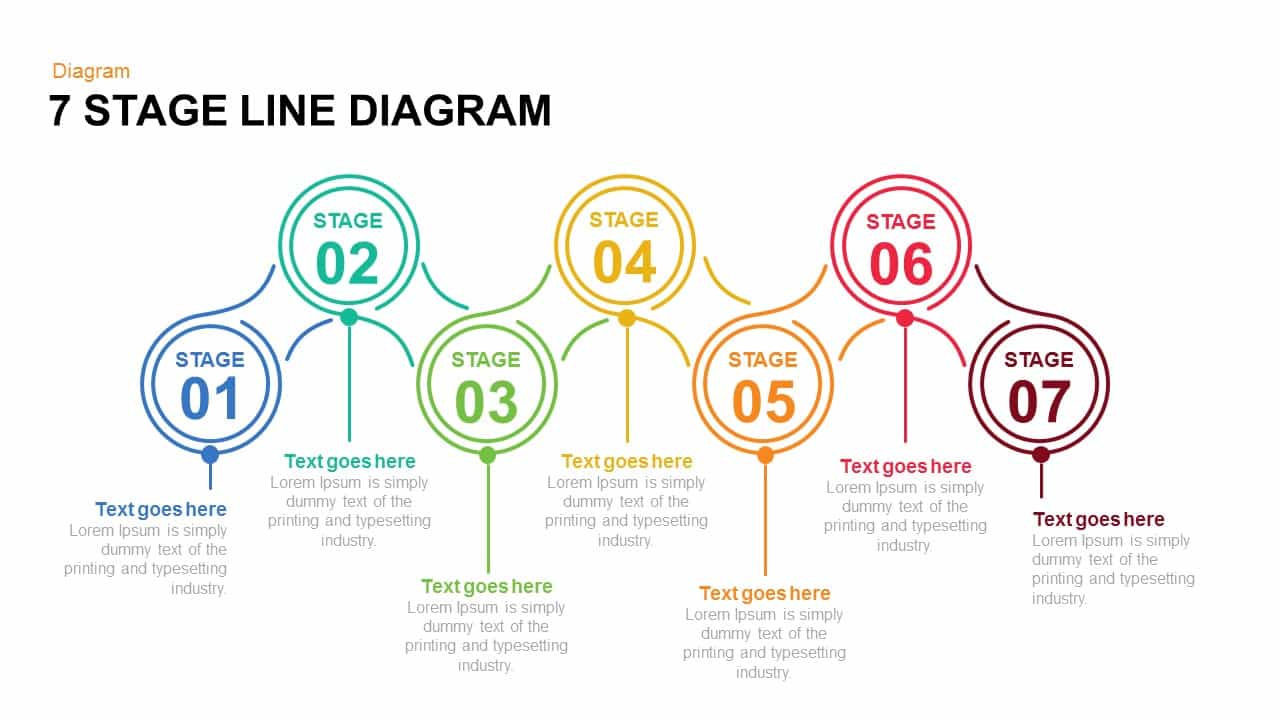
7 and 6 Stage Line Diagram Overview for PowerPoint & Google Slides
Infographics

Five and Six Step Line Linear Stage Diagram for PowerPoint & Google Slides
Infographics

Sales Growth Dashboard: KPI Gauge & Line Template for PowerPoint & Google Slides
Revenue

Creative Clothing Line Presentation Template for PowerPoint & Google Slides
Pitch Deck

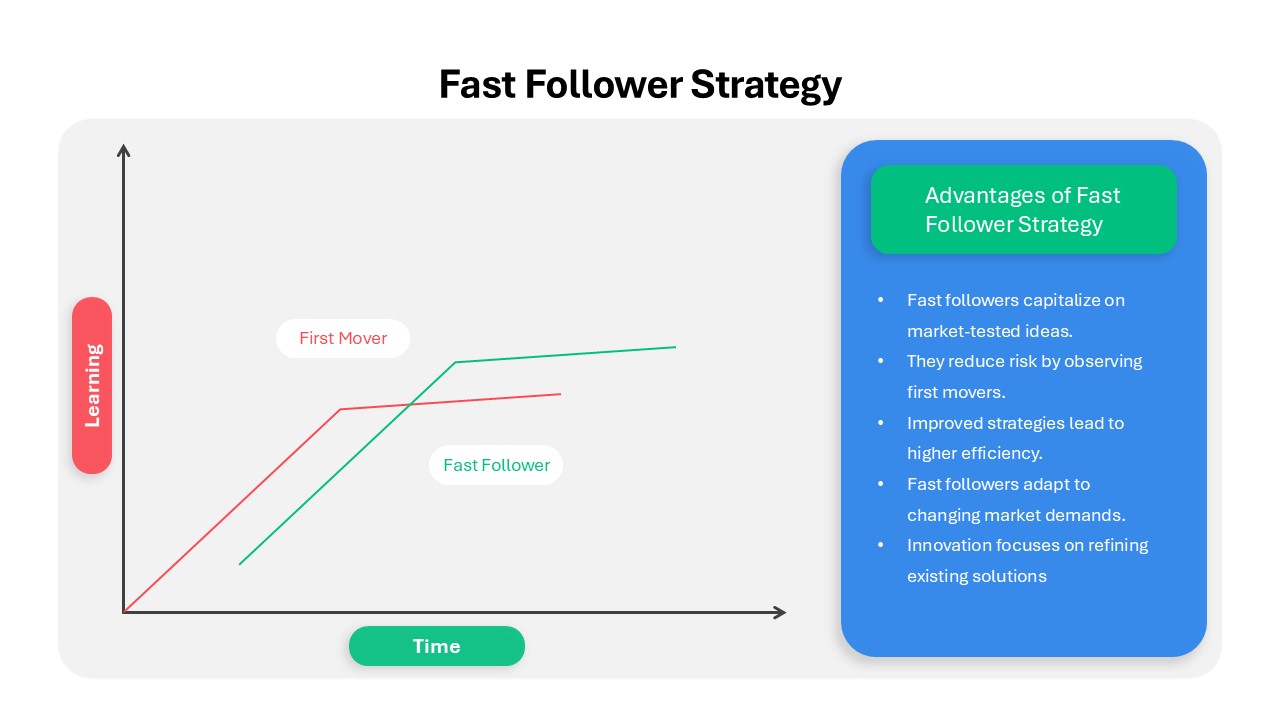
Fast Follower Strategy Line Graph Template for PowerPoint & Google Slides
Comparison Chart

3Ps Triple Bottom Line Venn Diagram Template for PowerPoint & Google Slides
Circular

4 People Racing to Finish Line Template for PowerPoint & Google Slides
Accomplishment

Quad Chart Infographic Pack of 8 Slides Template for PowerPoint & Google Slides
Comparison Chart

Free Professional Gantt Chart Pack – 4 Slides Template for PowerPoint & Google Slides
Gantt Chart
Free

Mobile Data Analysis Chart template for PowerPoint & Google Slides
Charts

Creative SWOT Chart template for PowerPoint & Google Slides
SWOT

Business Four Square Chart template for PowerPoint & Google Slides
Business

Donut Chart template for PowerPoint & Google Slides
Pie/Donut

Profit Performance Trend Chart Template for PowerPoint & Google Slides
Finance

3D Bar Chart Data Infographics Template for PowerPoint & Google Slides
Bar/Column

Comparison Bar Chart template for PowerPoint & Google Slides
Comparison Chart

Success Key Diagram with Donut Chart Template for PowerPoint & Google Slides
Pie/Donut

Pencil Bar Chart Data Analysis Template for PowerPoint & Google Slides
Bar/Column

Relationship Chart template for PowerPoint & Google Slides
Flow Charts

3D Cone Chart Data Visualization template for PowerPoint & Google Slides
Bar/Column

Organizational People Percentage Chart template for PowerPoint & Google Slides
Org Chart

Interactive Product Comparison Bar Chart Template for PowerPoint & Google Slides
Bar/Column

3D Column Chart with Data Table for PowerPoint & Google Slides
Bar/Column

Organisational Chart with Departments Template for PowerPoint & Google Slides
Org Chart

Modern Colorful Circular Org Chart Template for PowerPoint & Google Slides
Org Chart

Car Sales Market Share Pie Chart Template for PowerPoint & Google Slides
BCG

Organizational Structure Hierarchy Chart Template for PowerPoint & Google Slides
Org Chart

Employee Personality Distribution Chart Template for PowerPoint & Google Slides
Bar/Column

Modern Organizational Chart Hierarchy Template for PowerPoint & Google Slides
Org Chart

Dynamic Marketing Radar Chart Analytics Template for PowerPoint & Google Slides
Comparison

Circular Product Comparison Chart Template for PowerPoint & Google Slides
Comparison Chart

Business Growth Metaphor Chart Template for PowerPoint & Google Slides
Business

Flow Chart Diagram template for PowerPoint & Google Slides
Flow Charts

Flow Chart Decision Tree Template for PowerPoint & Google Slides
Flow Charts

Organizational Chart Template for PowerPoint & Google Slides
Our Team

Free Circular Multi-Step Flow Chart Diagram Template for PowerPoint & Google Slides
Flow Charts
Free

Animated Implementation Timeline Chart Template for PowerPoint & Google Slides
Timeline

Project Gantt Chart Template for PowerPoint & Google Slides
Gantt Chart

Modern Divisional Organization Chart Template for PowerPoint & Google Slides
Org Chart

Divisional Organization Chart Template for PowerPoint & Google Slides
Org Chart

3D pie chart infographic template for PowerPoint & Google Slides
Pie/Donut

Donut Chart for PowerPoint & Google Slides
Pie/Donut

Overlapping Timeline Gantt Chart Diagram Template for PowerPoint & Google Slides
Timeline

Waterfall Column Chart Analysis Template for PowerPoint & Google Slides
Bar/Column

Professional Clustered Column Chart Template for PowerPoint & Google Slides
Bar/Column

Simple Scatter Chart Analysis Template for PowerPoint & Google Slides
Comparison Chart

Simple Area Chart Data Trends Analysis Template for PowerPoint & Google Slides
Comparison Chart

Professional 100% Stacked Column Chart Template for PowerPoint & Google Slides
Bar/Column

Grouped Column Chart Comparison Template for PowerPoint & Google Slides
Bar/Column

Rectangle Area Chart with Gradient Fill Template for PowerPoint & Google Slides
Comparison Chart

Excel-Driven Gradient Timeline Chart Template for PowerPoint & Google Slides

Multi-Series Vertical Dot Chart Template for PowerPoint & Google Slides
Comparison Chart

Five-Phase Horizontal Timeline Chart Template for PowerPoint & Google Slides
Timeline

Free Learning Retention Pyramid Chart Template for PowerPoint & Google Slides
Pyramid
Free

Professional Milestone Timeline Chart Template for PowerPoint & Google Slides
Timeline

Upside-Down Organizational Chart Diagram Template for PowerPoint & Google Slides
Org Chart

Wastewater Treatment Process Flow Chart Template for PowerPoint & Google Slides
Flow Charts

Team-Based Organizational Chart Template for PowerPoint & Google Slides
Org Chart

Inverted Organization Chart Diagram Template for PowerPoint & Google Slides
Org Chart

Dynamic Sunburst Chart Visualization Template for PowerPoint & Google Slides
Charts

Multi-Level Wheel Chart Diagram template for PowerPoint & Google Slides
Pie/Donut

Multi-Level Colorful Pyramid Chart Template for PowerPoint & Google Slides
Pyramid

Free Versatile Product Comparison Chart Template for PowerPoint & Google Slides
Charts
Free

Color-Coded Startup Org Chart Slide for PowerPoint & Google Slides
Org Chart

Progress Chart Slide for PowerPoint & Google Slides
Charts

Sustainability Goals and Targets Chart Template for PowerPoint & Google Slides
Goals

Annual Growth Trend Analysis Chart template for PowerPoint & Google Slides
Business Report

Quarterly Sales Review Bar Chart Template for PowerPoint & Google Slides
Bar/Column

Horizontal Bar Chart Slide with Icons Template for PowerPoint & Google Slides
Bar/Column

Project Tracker Timeline Gantt Chart Template for PowerPoint & Google Slides
Project Status

Competitor Comparison Chart Design Template for PowerPoint & Google Slides
Comparison

Event Planning Gantt Chart template for PowerPoint & Google Slides
Business

Feasibility Matrix Comparison Chart Template for PowerPoint & Google Slides
Comparison Chart

Team Gantt Chart Overview template for PowerPoint & Google Slides
Project Status

Stacked Gantt Chart Timeline Slide Template for PowerPoint & Google Slides
Gantt Chart

Marketing Budget Allocation Donut Chart Template for PowerPoint & Google Slides
Marketing

Project Timeline Gantt Chart Template for PowerPoint & Google Slides
Gantt Chart

Colorful Annual Gantt Chart Project Planner Template for PowerPoint & Google Slides
Gantt Chart

Colorful Annual Gantt Chart Timeline Template for PowerPoint & Google Slides
Gantt Chart

Three Segment Donut Chart KPI Infographic Template for PowerPoint & Google Slides
Pie/Donut

Learning Curve Performance Growth Chart Template for PowerPoint & Google Slides
Employee Performance

Sales Organizational Chart Hierarchy Template for PowerPoint & Google Slides
Org Chart

Butterfly Chart Template for PowerPoint & Google Slides Presentations
Comparison Chart


