Donut Chart Template for PowerPoint & Google Slides


Doughnut Chart Template
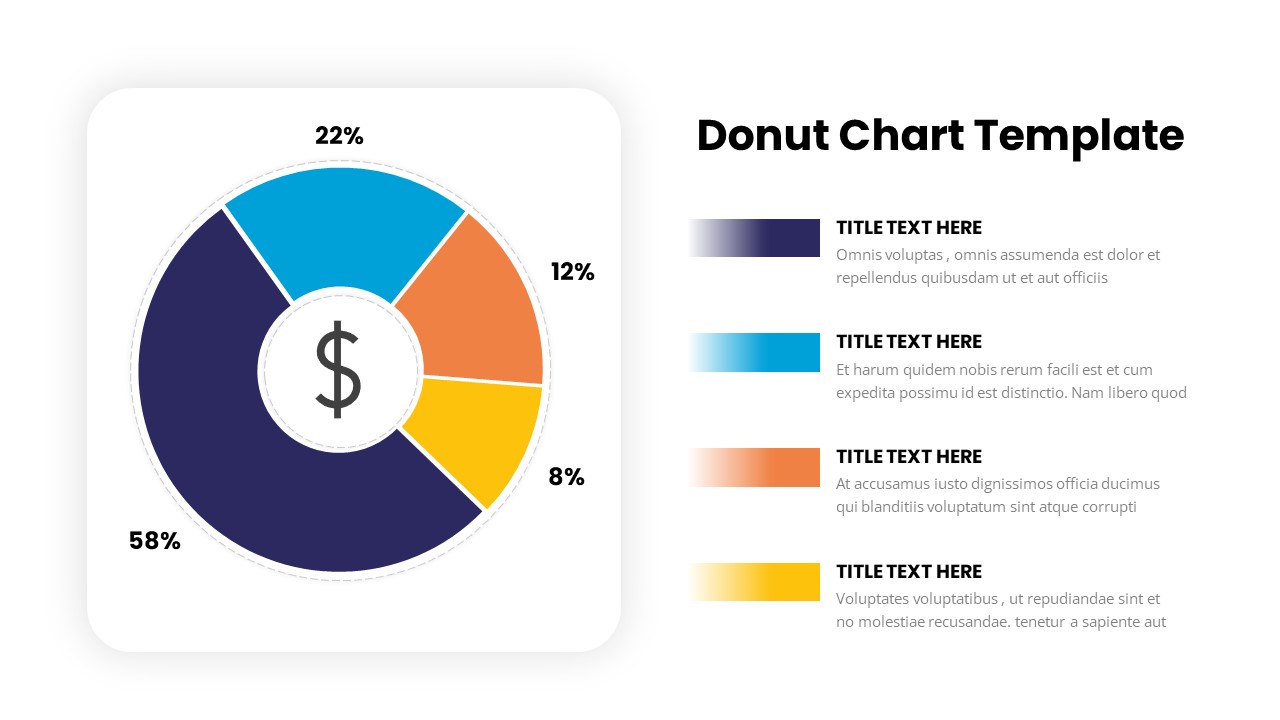
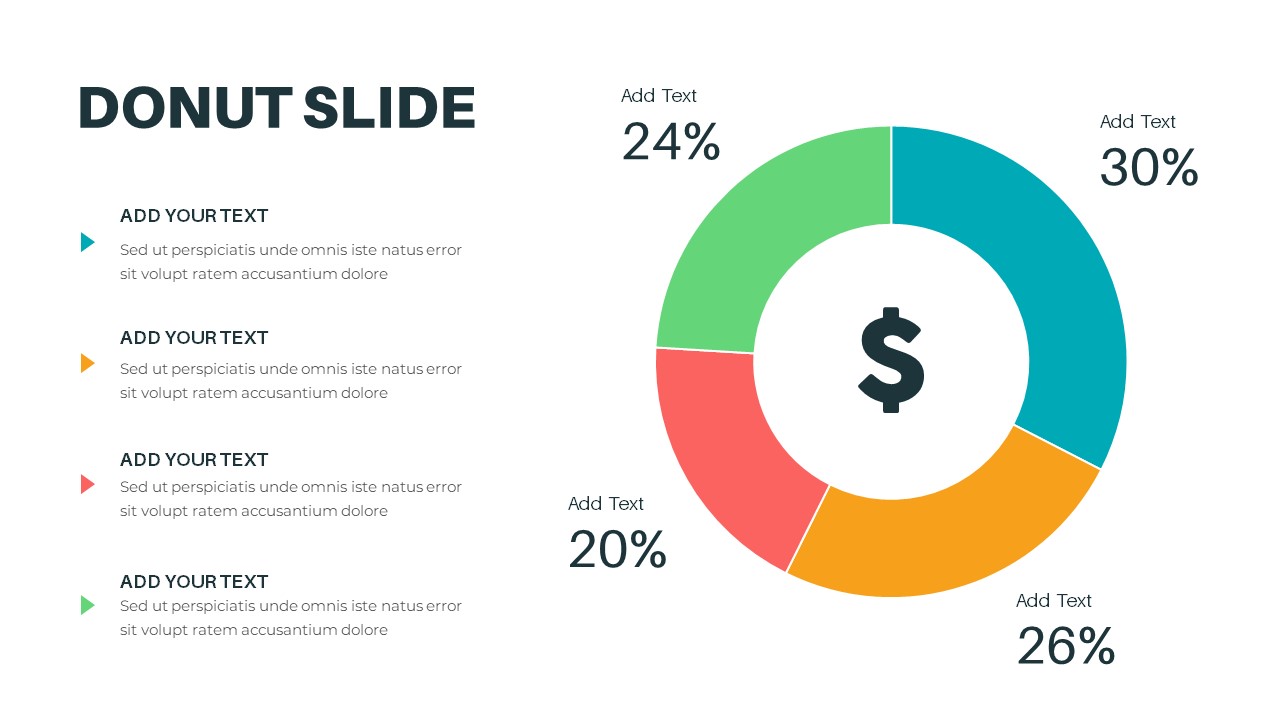
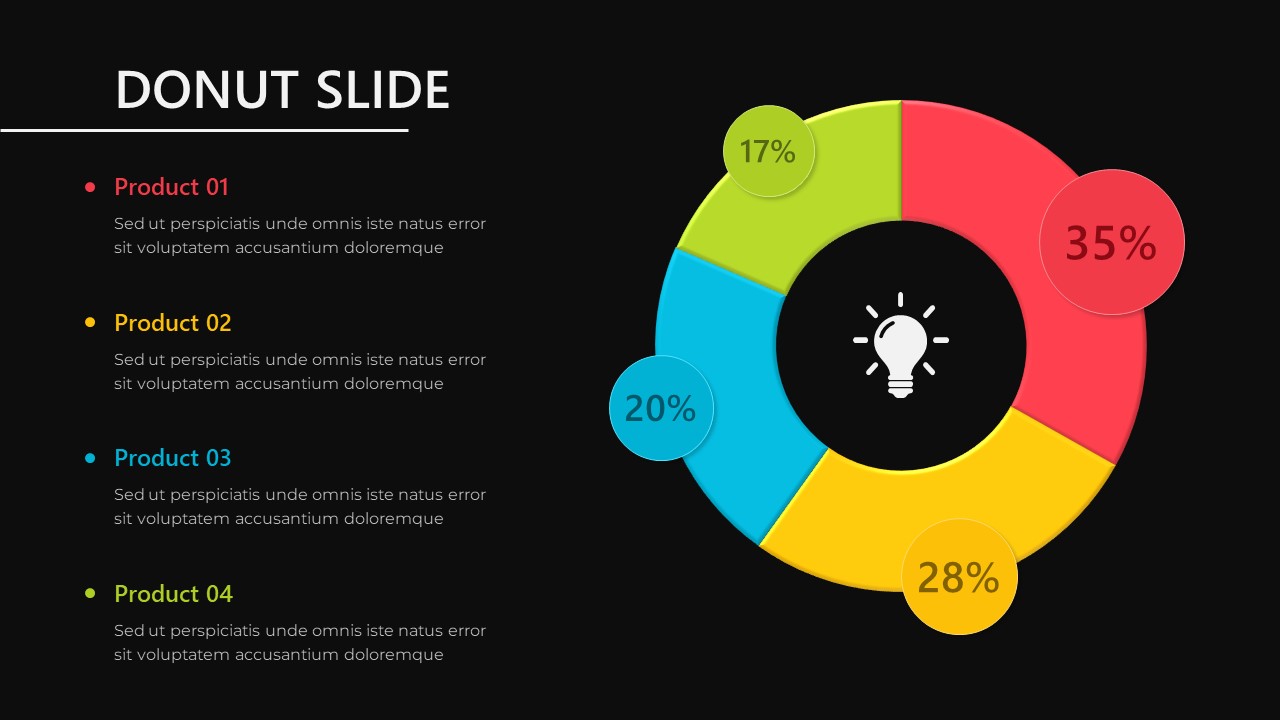
A clean Donut Chart Template offers a visually appealing way to display and compare data across multiple categories or products. The chart features a vibrant four-segment circular layout (red, yellow, green, and blue) tracking explicit percentages (17%, 20%, 28%, and 35%) with a central lightbulb icon to highlight your primary operational insights. Ideal for marketing, sales, and performance reporting, this PowerPoint donut chart conveys complex numerical data in a straightforward, digestible format. The layout provides ample space beneath the graphic for descriptive notes, ensuring this Google Slides donut chart remains fully customizable to suit your specific presentation needs.
Target audience for this Donut Chart PowerPoint
- Business Analysts: Present complex comparative data and analyze operational progress across distinct business units.
- Product Managers: Report on seasonal sales performance and deliver high-impact product breakdown reviews.
- Marketers: Display marketing campaign shares, channel acquisition performance, and consumer demographic divisions.
- Project Managers: Track multi-stage task distributions, team resource allocations, and operational workflow statuses.
- Corporate Presenters: Communicate critical numerical statistics clearly without cluttering high-stakes executive pitch decks.
Key Applications for this Doughnut Chart PowerPoint Template
- Market Share & Budgets: Visualize exact company market percentages and department budget allocations easily.
- Survey Results: Display client satisfaction ratings, user feedback metrics, and consumer poll data using color-coded segments.
- Product Breakdowns: Compare performance metrics and volume shares among multiple competing lines or items.
- Progress Tracking: Monitor ongoing project milestones, task execution distribution, and structural timeline completion rates.
- Strategic Insights: Highlight key operational takeaways and main brainstorming solutions using the central lightbulb icon framework.
Login to download this file

Item ID
SB03234
Related Templates

Donut Performance Chart template for PowerPoint & Google Slides
Pie/Donut
Donut Chart Split Template for PowerPoint & Google Slides
Charts
Success Key Diagram with Donut Chart Template for PowerPoint & Google Slides
Pie/Donut

Eight Section Donut Chart Infographic Template for PowerPoint & Google Slides
Pie/Donut
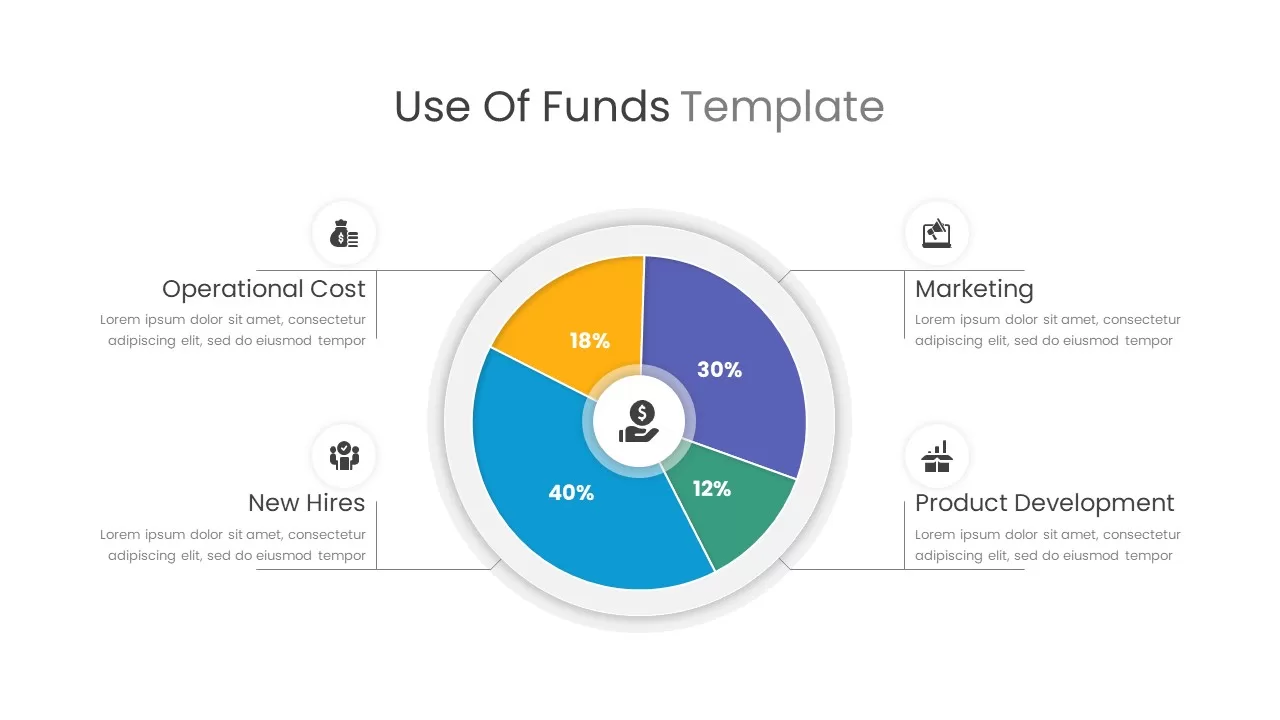
Use of Funds Donut Chart Infographic Template for PowerPoint & Google Slides
Circular
Cost Reduction Strategy Donut Chart Template for PowerPoint & Google Slides
Pie/Donut
Donut Chart Data Breakdown template for PowerPoint & Google Slides
Pie/Donut
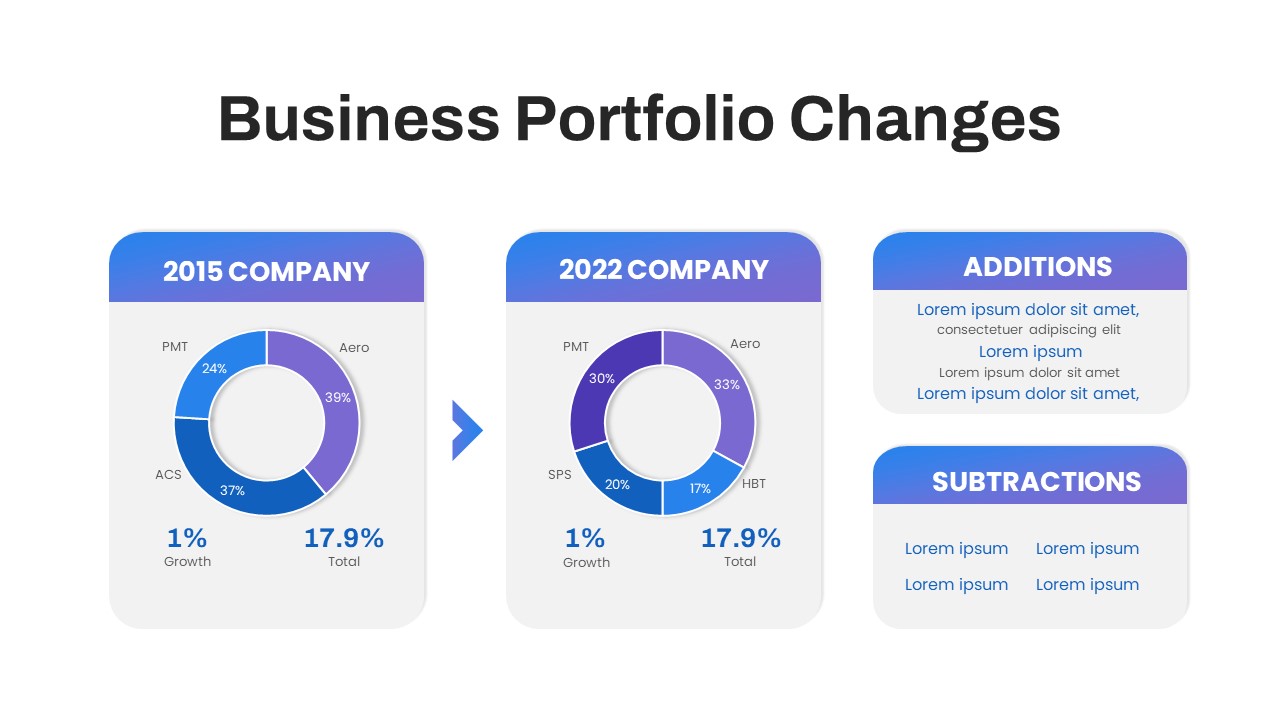
Business Portfolio Changes Donut Chart Template for PowerPoint & Google Slides
Pie/Donut
Technical Skills Donut Chart Overview Template for PowerPoint & Google Slides
HR
Marketing Budget Allocation Donut Chart Template for PowerPoint & Google Slides
Marketing
Three Segment Donut Chart KPI Infographic Template for PowerPoint & Google Slides
Pie/Donut

Comparison Donut Chart PowerPoint Template and Keynote
Pie/Donut
Donut Chart PowerPoint Template
Pie/Donut
Multi level Donut Chart Template
Pie/Donut
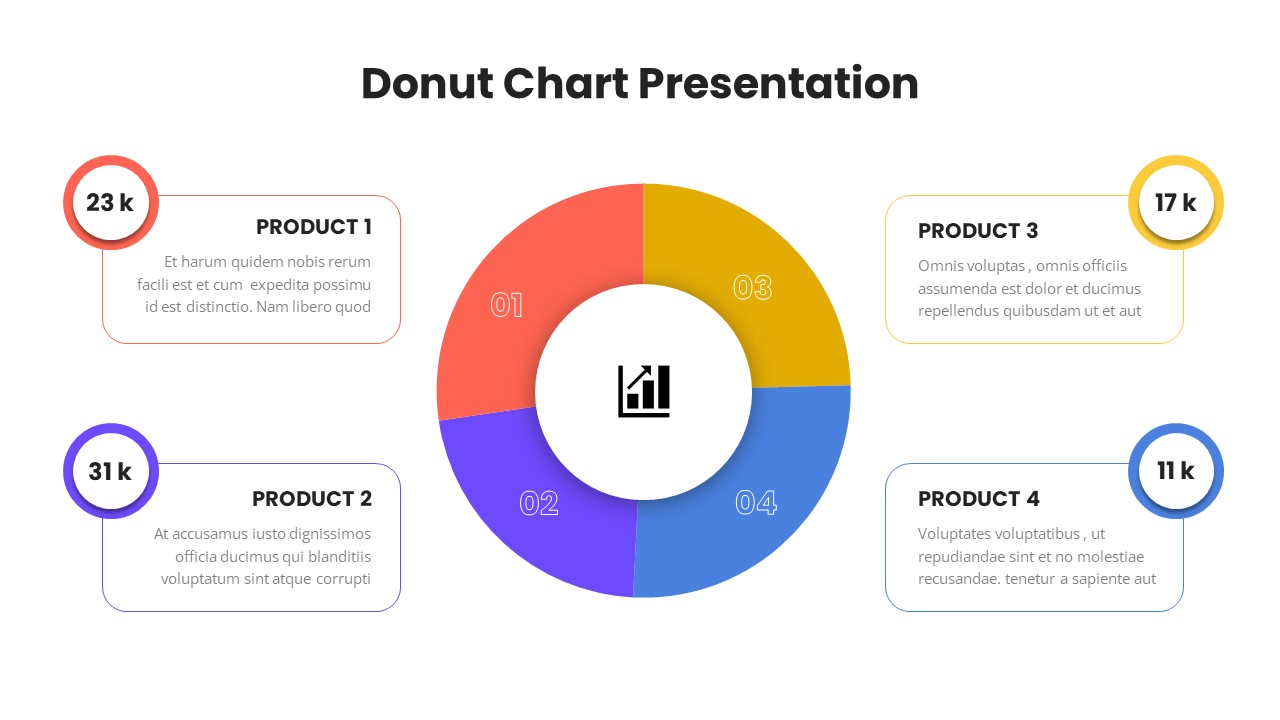
Donut Chart Presentation Template
Pie/Donut
Donut Split Analysis template for PowerPoint & Google Slides
Pie/Donut
Budget Forecast Dashboard & Donut Charts Template for PowerPoint & Google Slides
Pie/Donut
Donut Diagram PowerPoint Template
Pie/Donut
Quad Chart Infographic Pack of 8 Slides Template for PowerPoint & Google Slides
Comparison Chart
Free Professional Gantt Chart Pack – 4 Slides Template for PowerPoint & Google Slides
Gantt Chart
Free