Statistics PowerPoint Templates & Keynotes
Present your data using our massive collection of statistics powerpoint templates. All charts are designed to present your numbers with accuracy and clarity. The statistics powerpoint templates are extremely easy to edit as the templates are made with 100% editable vectors. Change graphs and charts to illustrate your data. All templates work with powerpoint templates, keynotes, and google slides. Download the templates and make your presentations stand out!
Filter
Filter
-

Economic Impact PowerPoint Template
Business PowerPoint Templates
-

Sales Presentation Animated PowerPoint Template
PowerPoint Templates
-
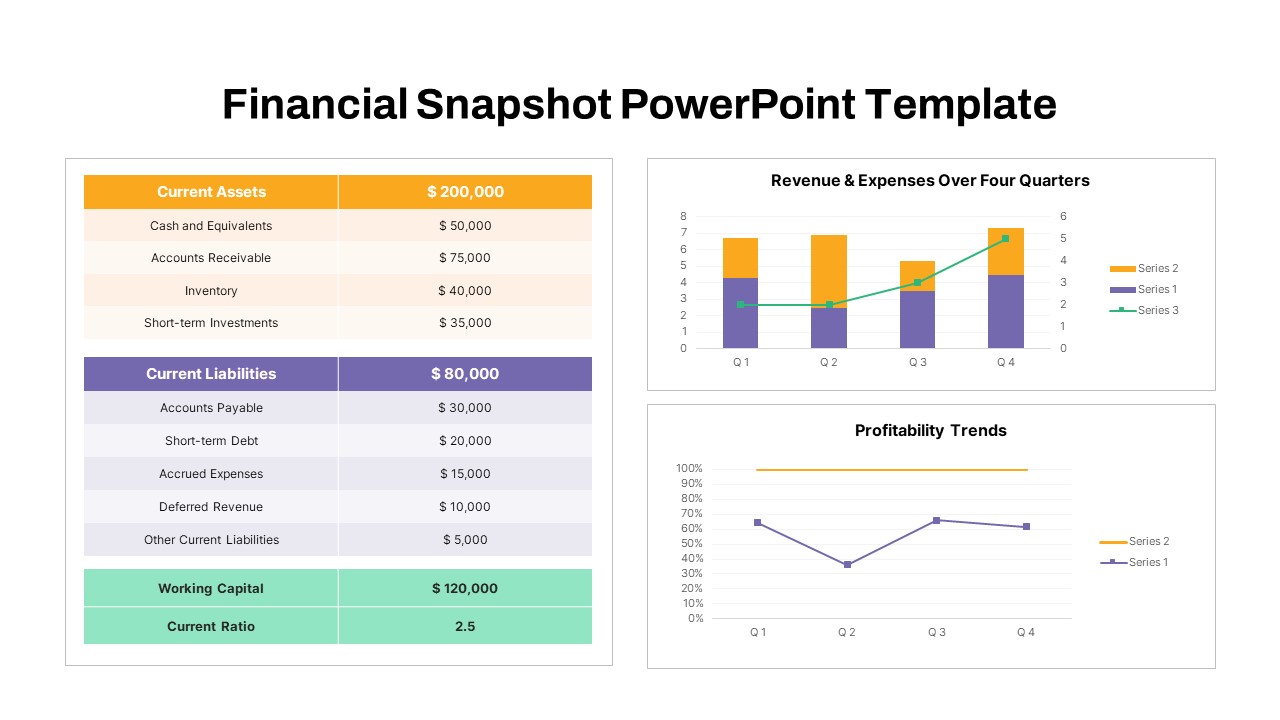
Financial Snapshot PowerPoint Template
PowerPoint Templates
-

Free Tiktok PowerPoint Template
Free PowerPoint Templates
Free
-

Free Statistics PowerPoint Template
Free PowerPoint Templates
Free
-

Sun Burst Chart PowerPoint Template
Circular Diagrams
-

Free Charts and Graphs PowerPoint Template
PowerPoint Templates
Free
-

Timeline Bar Chart PowerPoint
Column and Bar chart
-

Rectangle Area Chart Template
PowerPoint Charts
-

QC Tools PowerPoint Template
Infographic
-

Grouped Column Chart PowerPoint Template
Column and Bar chart
-

Data Over Time Line Chart PowerPoint Template
PowerPoint Charts
-

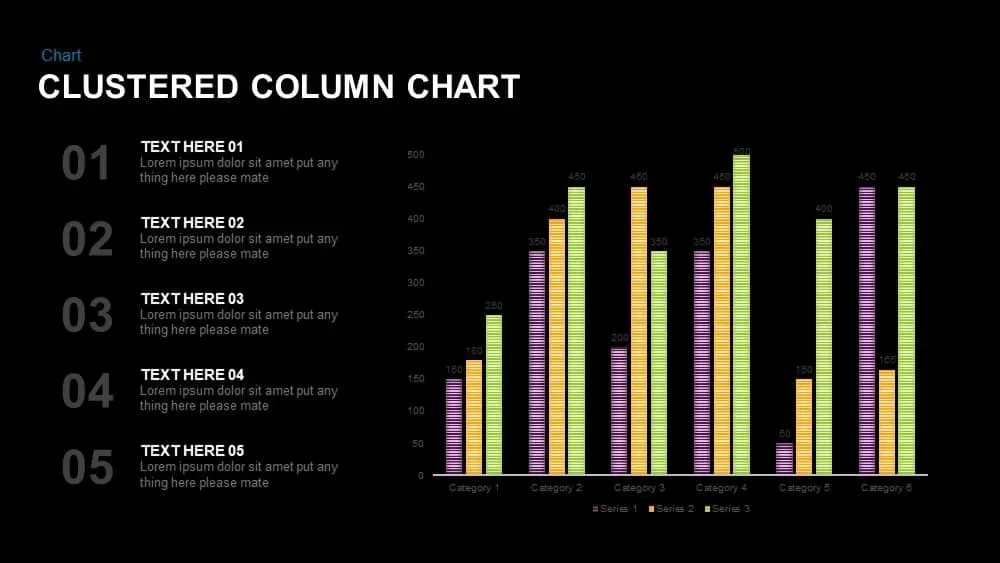
Clustered Column Chart PowerPoint Template
PowerPoint Charts
-

Clustered Bar Chart PowerPoint Template
Column and Bar chart
-

Multiple Column Chart PowerPoint Template
Column and Bar chart
-

Simple Bar Chart PowerPoint Template
Column and Bar chart
-

Animated Stacked Bar Chart PowerPoint Template
Column and Bar chart
-

Waffle Chart PowerPoint Template
PowerPoint Templates
-

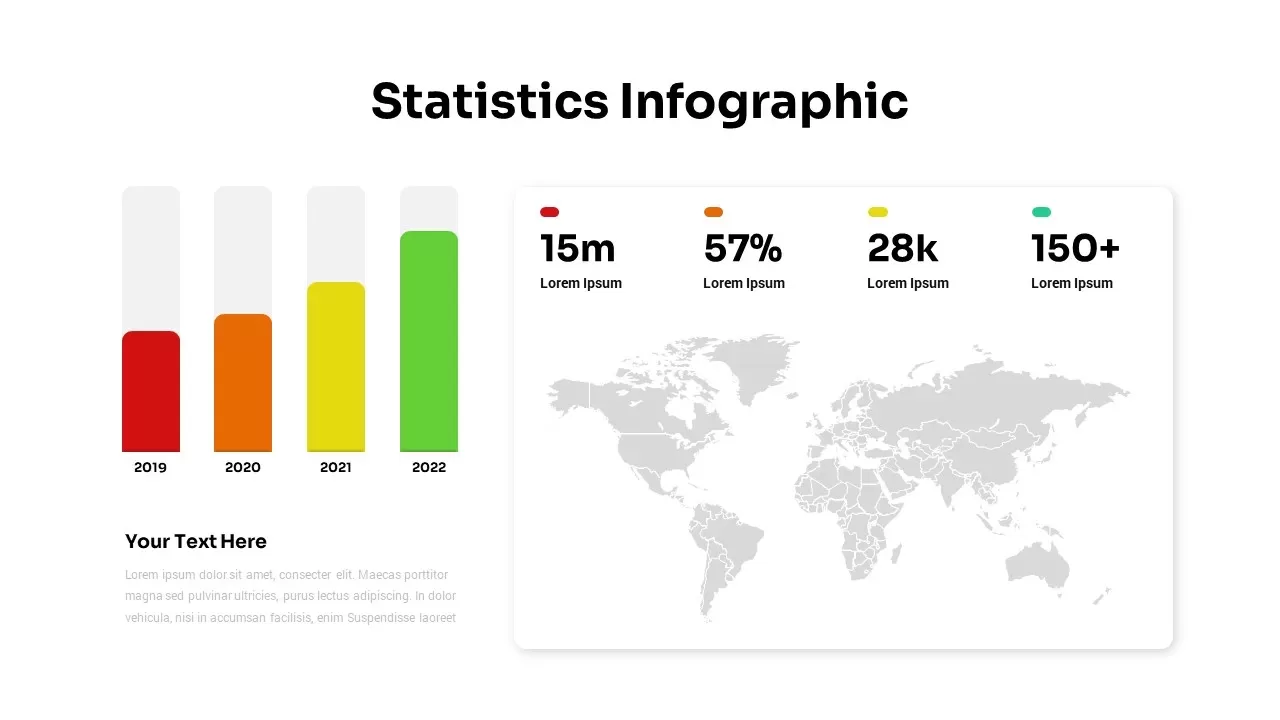
Statistics Infographic PowerPoint Template
Maps
-

Statistics Infographic Presentation Template
Infographic
-

Statistics Infographic Template
Infographic
-

Statistic Infographic
Infographic
-

Statistics PowerPoint Template
Infographic
-

Statistics Infographic
Infographic
-

Statistics Presentation Template
Infographic
-

Percentage Infographic
Column and Bar chart
-

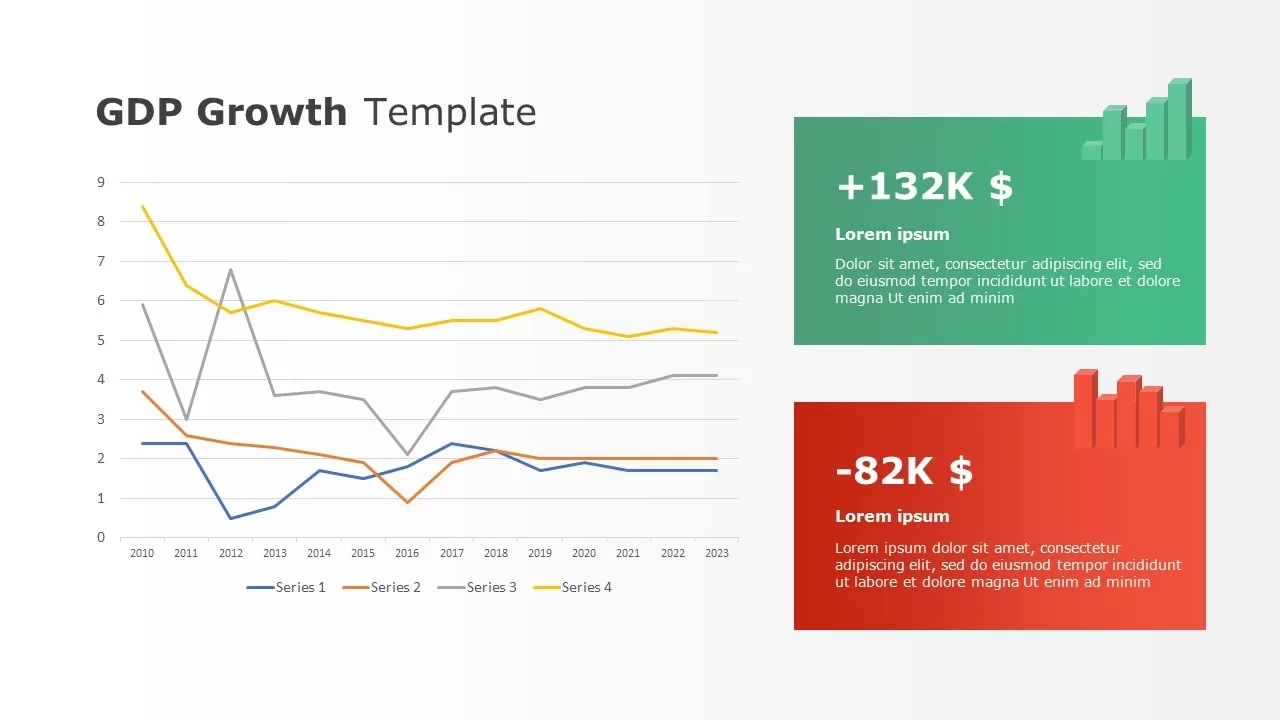
GDP Growth Template
Curves and Lines
-

Upward Arrow Powerpoint
Diagrams
-

Generations Comparison PowerPoint Template
Business Models
-

3D Spheres Fill Levels Diagrams PowerPoint Template Designs
3D Shapes
-

INSPIRE – Multipurpose Creative Deck Template
Business PowerPoint Templates
-

Cylinder Bar Chart PowerPoint Template and Keynote Slide
Column and Bar chart
-

Free Project Dashboard PowerPoint Template & Keynote Slide
Business PowerPoint Templates
Free
-

Clustered Column Chart PowerPoint and Keynote Slide
PowerPoint Charts
-

Radial Bar Chart PowerPoint Templates and Keynote Slides
PowerPoint Charts


