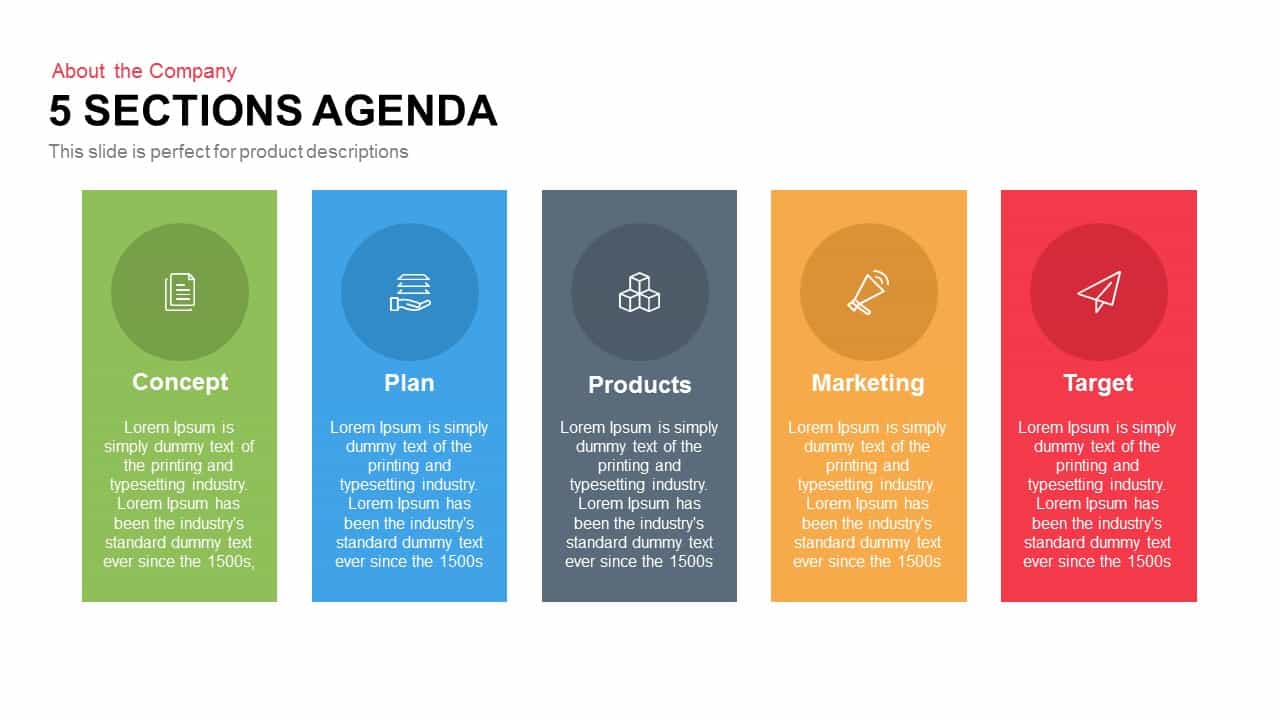
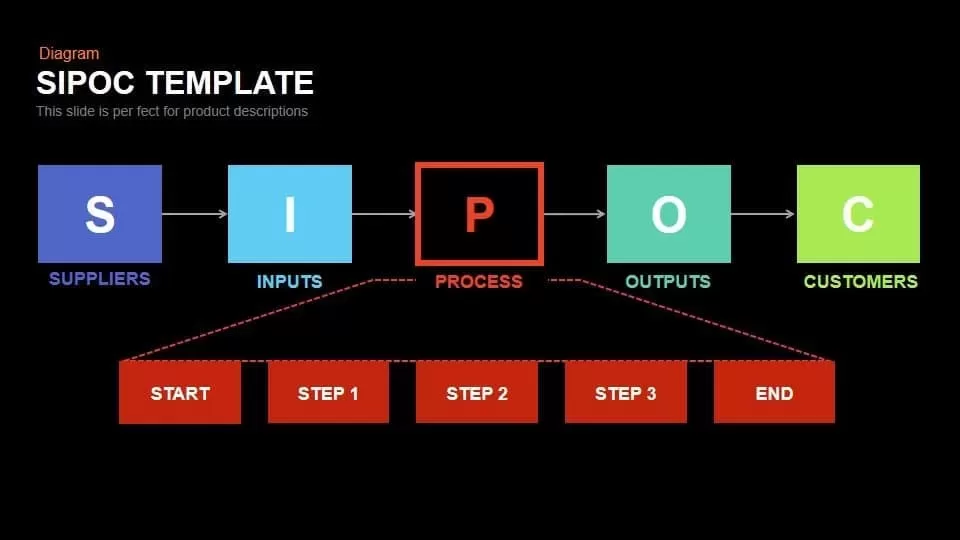
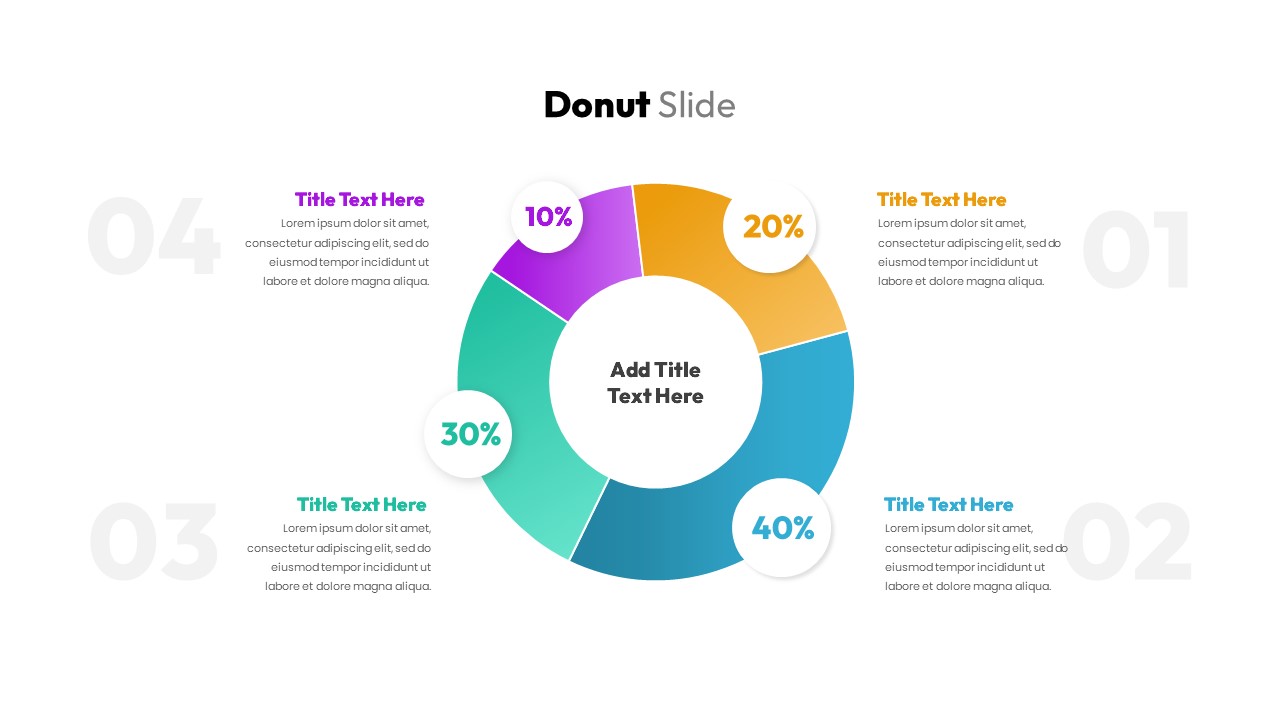
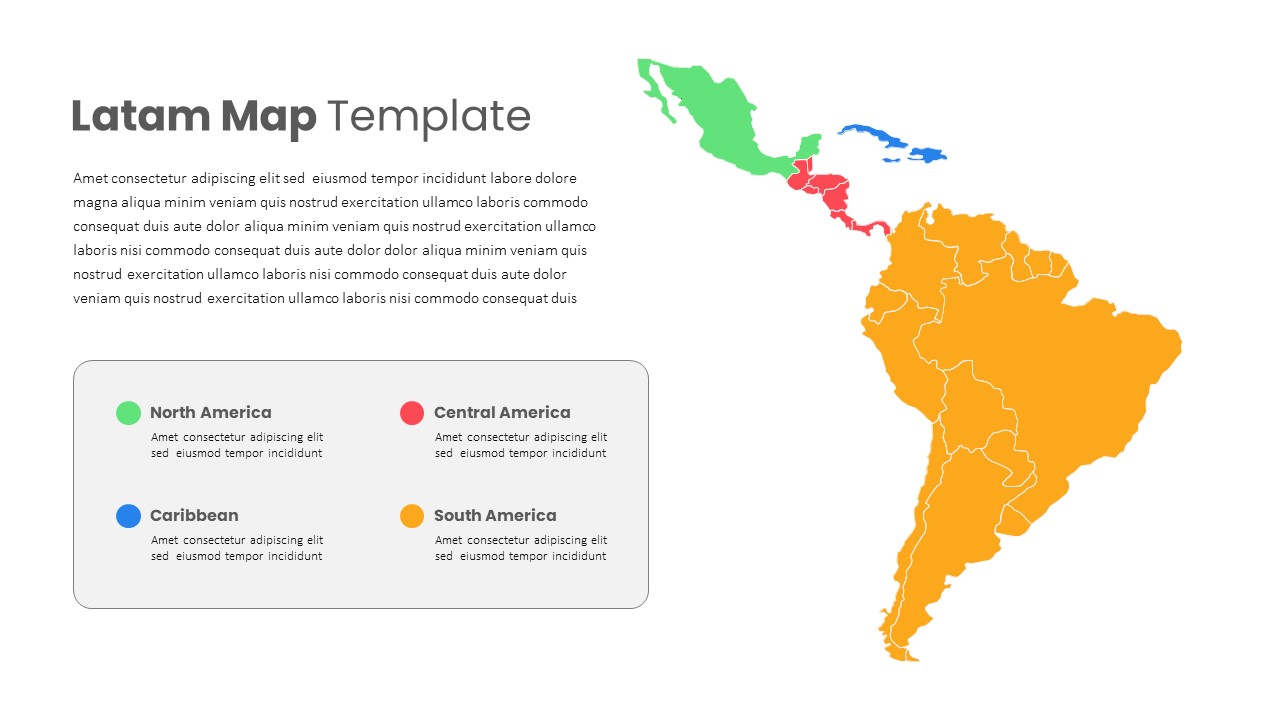
Multi-Sector Revenue Breakdown Cards Template for PowerPoint & Google Slides
Description
This four-column infographic slide illustrates multi-sector revenue performance with clarity and impact. Each sector—Consumer Goods, Technology, Manufacturing, and Healthcare—is represented by a high-resolution photograph above a color-coded card that displays the sector name and revenue figure. The green, blue, gold, and red outlines reinforce visual differentiation, while subtle drop shadows add depth against the clean white background. Text placeholders are preconfigured for headings and body copy, enabling rapid customization of titles, figures, and bullet points.
Built on master slides with fully editable vector shapes, this template supports global style updates in one click. Users can adjust theme colors, swap images via drag-and-drop, or modify card curvature to align with brand guidelines. Custom animation presets guide sequential builds: cards fade in, photos slide, and text appears in sync with your narrative. The slide maintains perfect alignment and spacing across widescreen and standard aspect ratios, ensuring consistent rendering in PowerPoint and Google Slides.
An included alternate layout replaces photographs with iconography and bullet lists for teams that prefer text-driven breakdowns. Comprehensive usage notes walk first-time presenters through color palette swaps, shape edits, and animation timings, minimizing set-up time. Whether you’re delivering an executive review, investor briefing, or internal dashboard update, this revenue breakdown slide balances data density with polished design, simplifying complex financial comparisons into an easily digestible format.
Who is it for
Finance leaders, business analysts, and corporate strategists will benefit from this slide when presenting quarterly results, budget forecasts, or cross-division performance reviews. Consultants and board members can also leverage its clear layout to support data-driven decision-making.
Other Uses
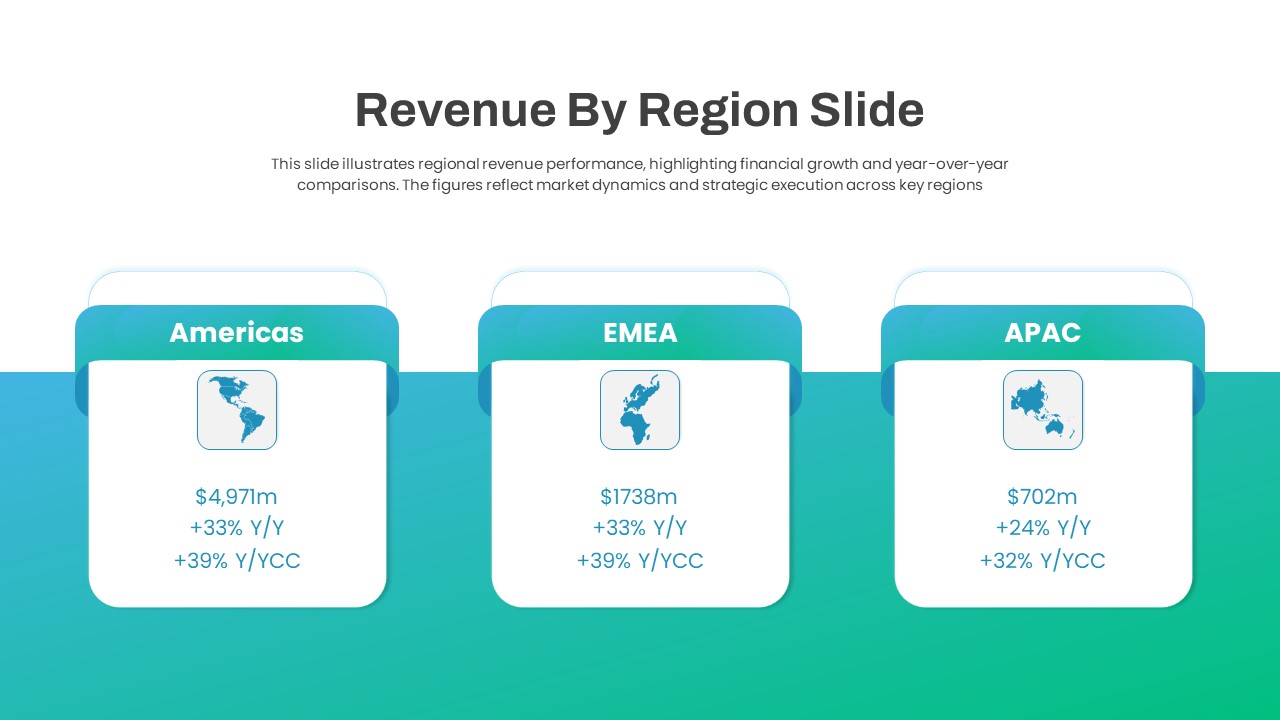
Beyond revenue reporting, repurpose this layout to compare market share, product line performance, regional sales, or key performance indicators. Simply relabel cards and adjust figures to suit any multi-category analysis.
Login to download this file


