Capital Structure Dynamic Split Chart Template for PowerPoint & Google Slides


Description
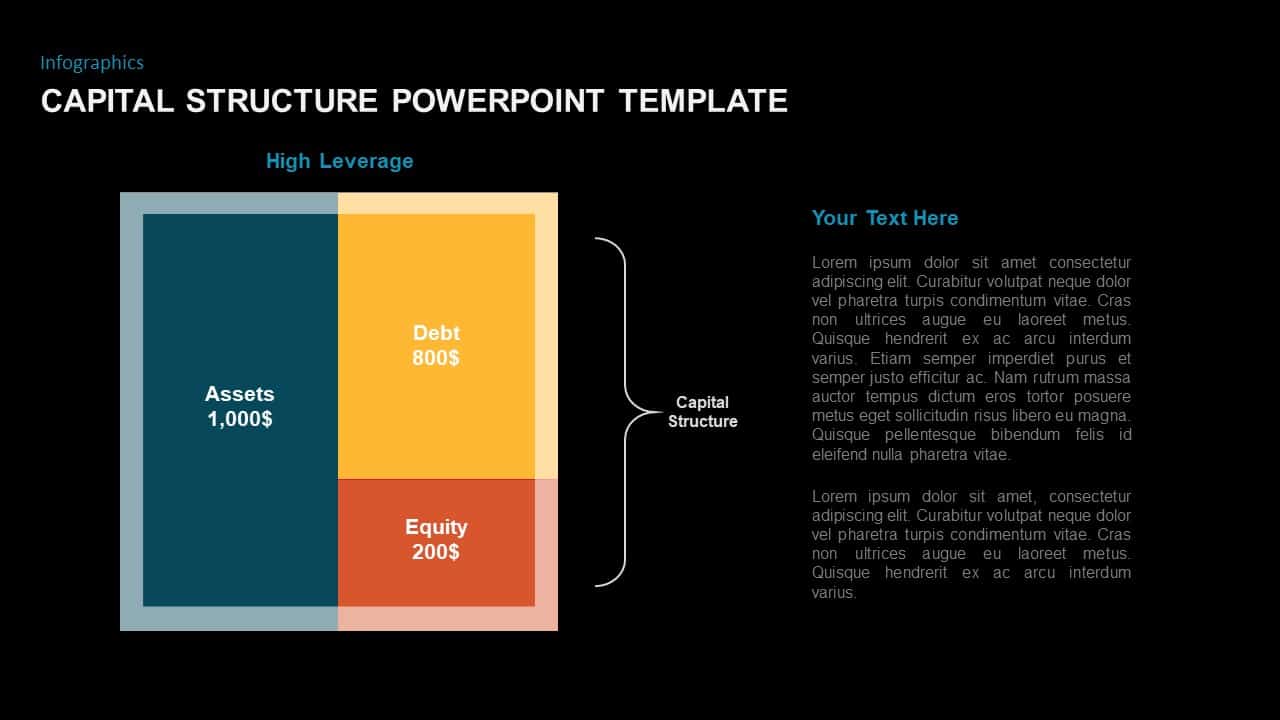
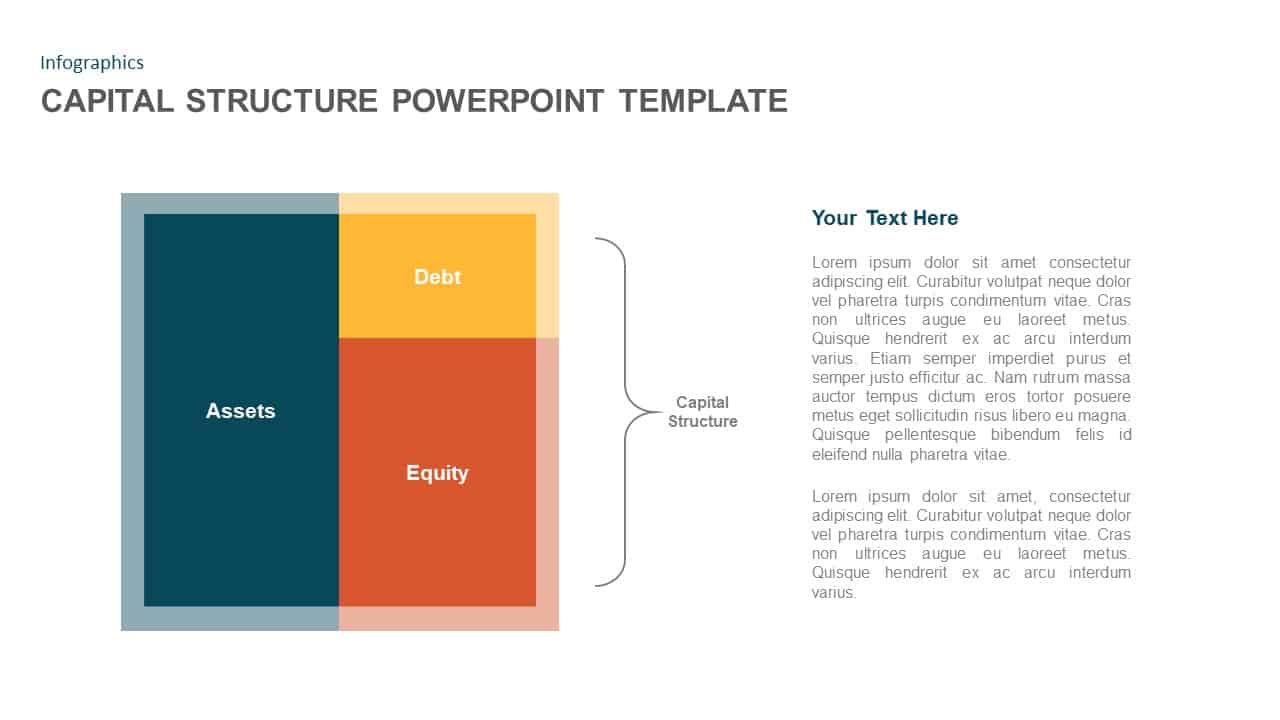
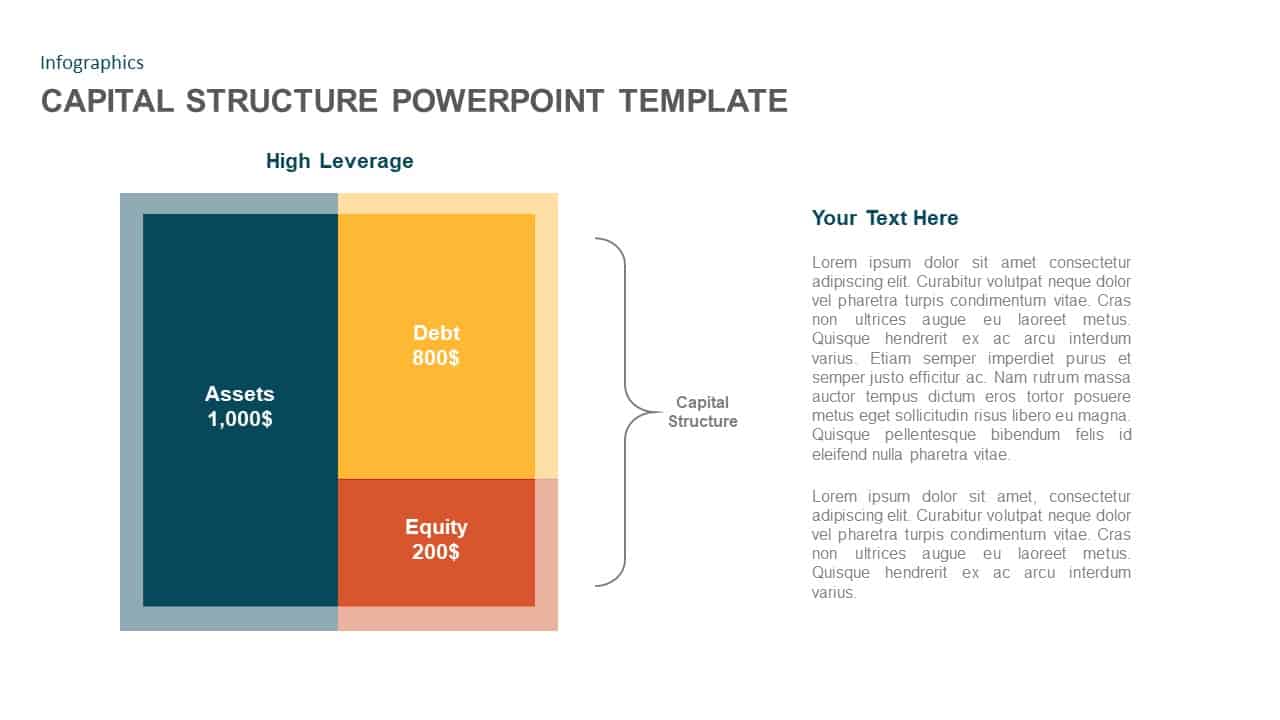
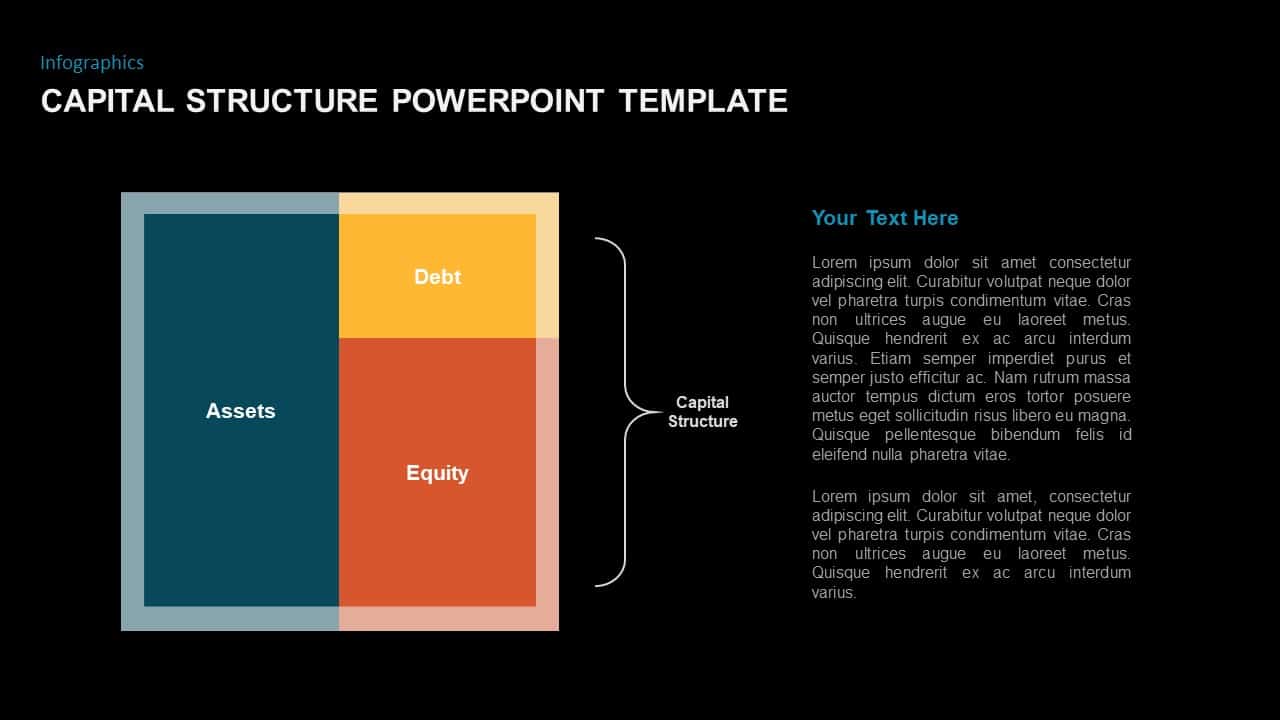
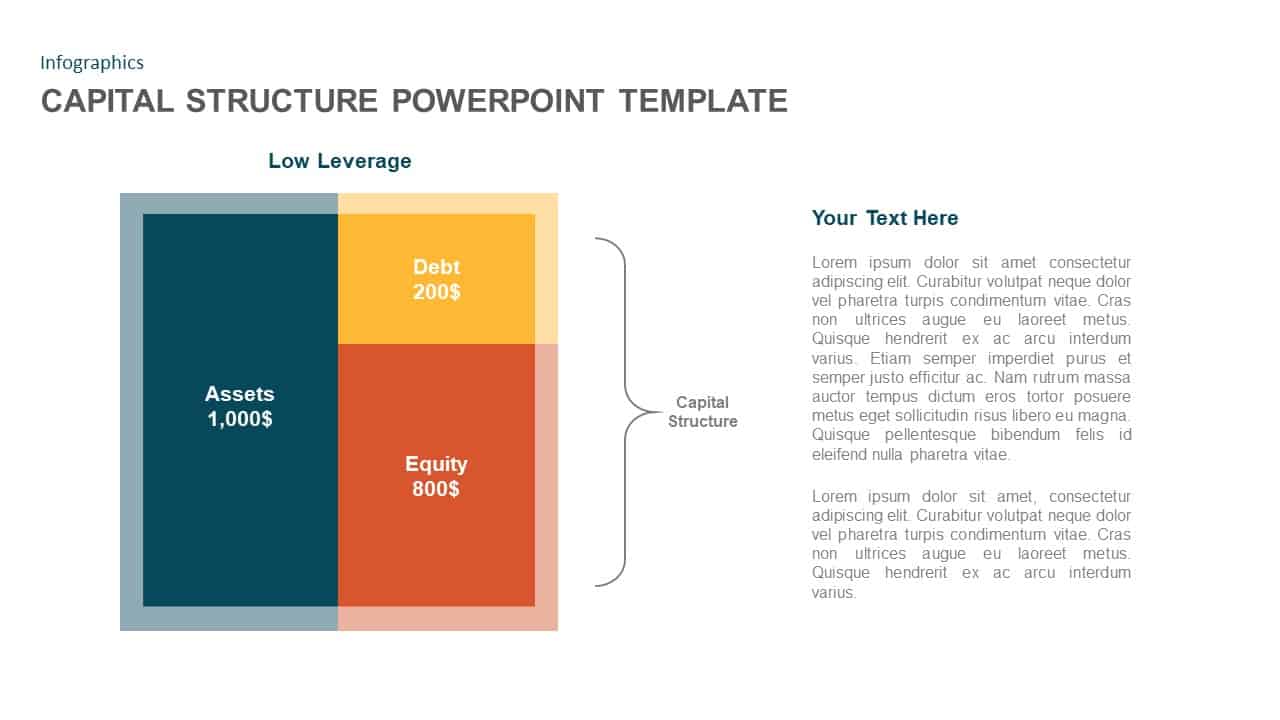
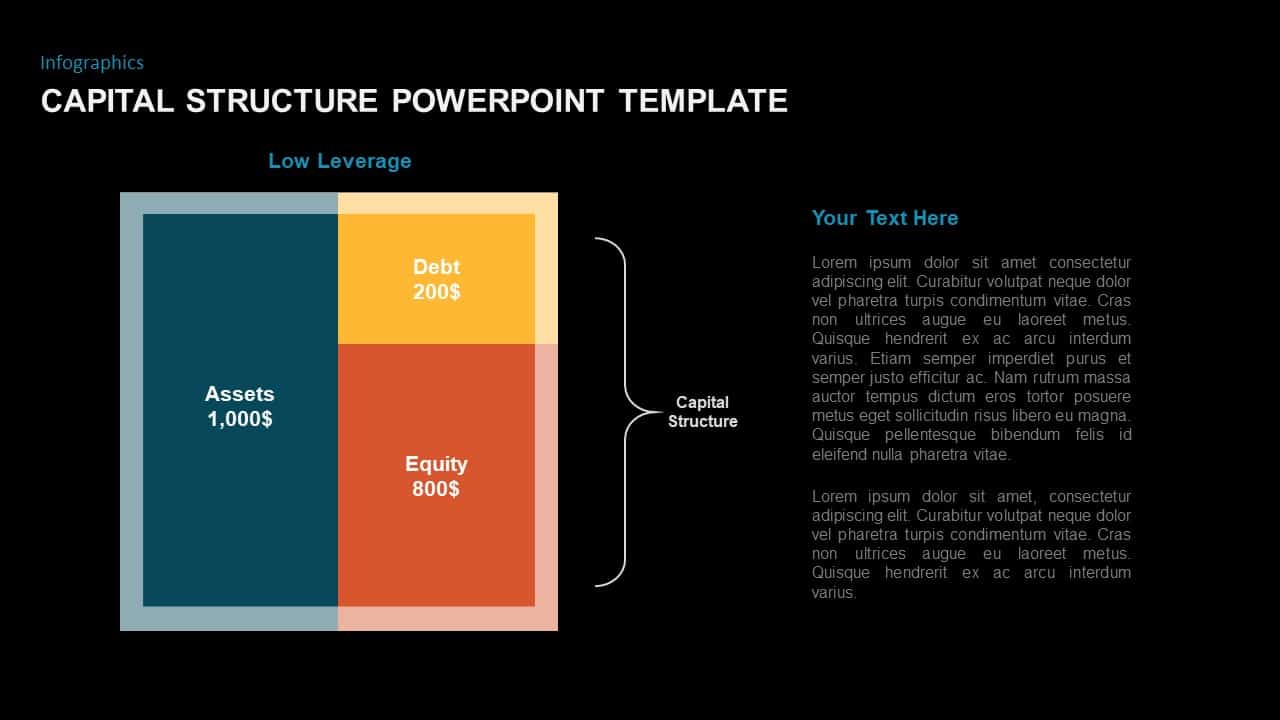
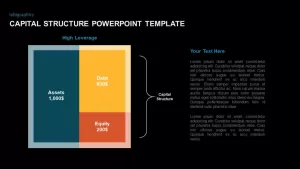
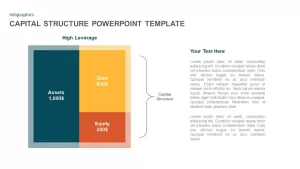
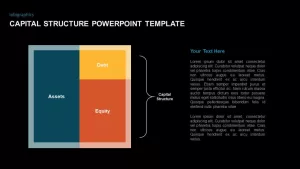
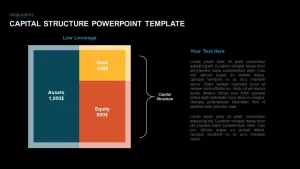
Leverage this striking Capital Structure Split Chart to present financial leverage at a glance. The slide showcases a 2×2 layout with Assets occupying the full left side and Debt and Equity sharing the right side. Each section uses bold gradients—cyan for Assets, gold for Debt, and orange for Equity—paired with subtle shadows on a dark backdrop. A clearly labeled bracket and heading “Capital Structure” ties the components together, emphasizing their combined impact on corporate finance.
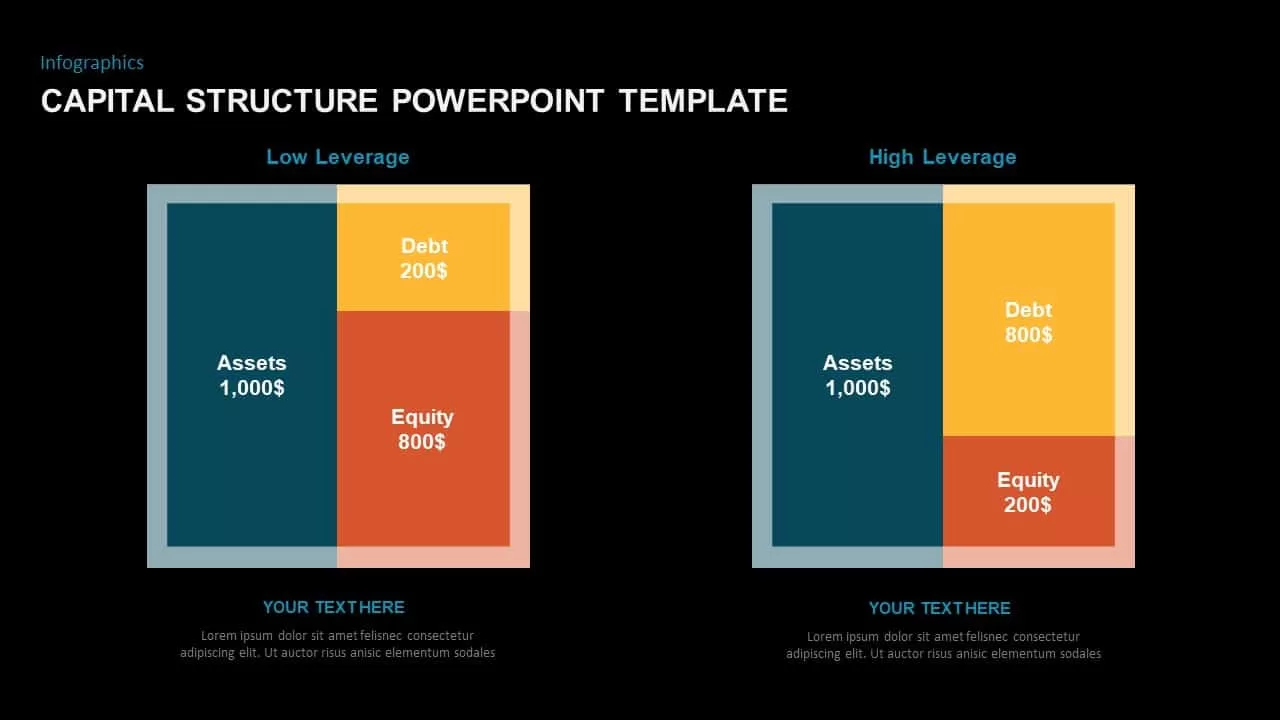
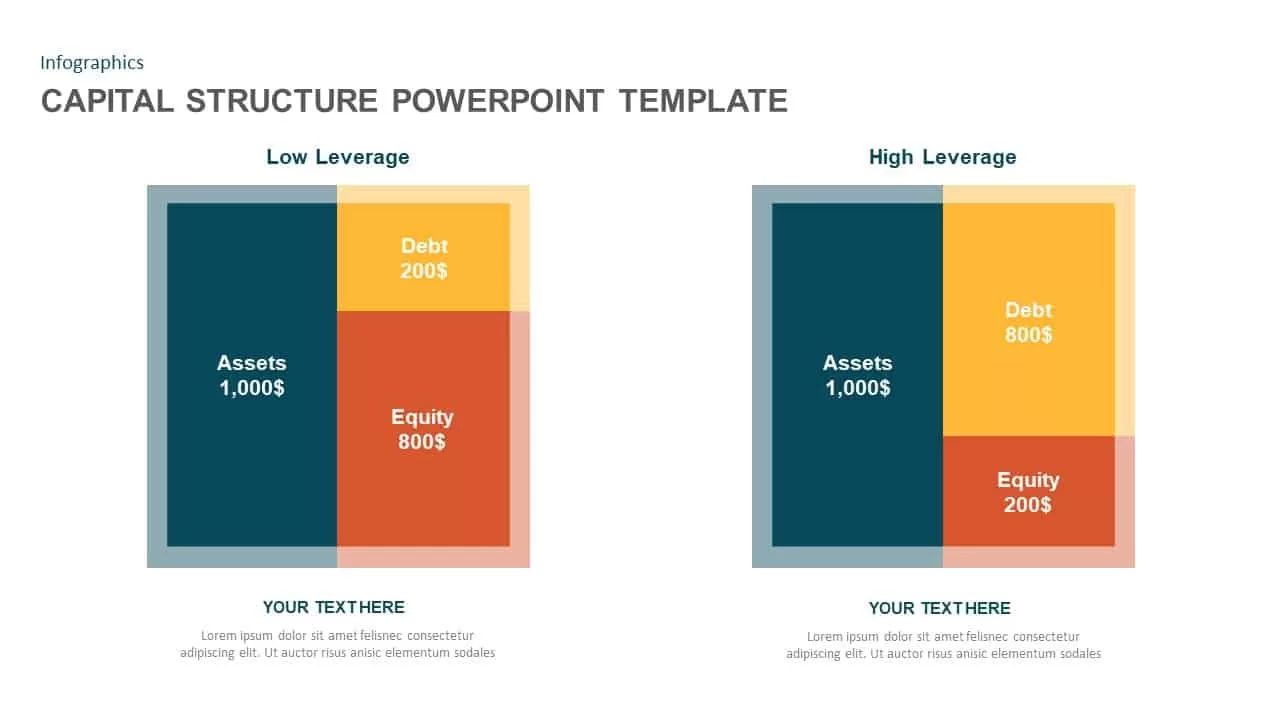
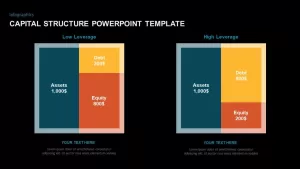
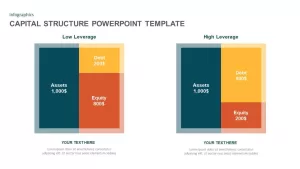
Designed for seamless editing, the chart leverages master slides and smart guides to simplify customization. Adjust block proportions, update numerical values, or swap color schemes in seconds without reconstructing shapes. Placeholder text and title fields ensure consistent branding, while built-in animations allow you to reveal each element progressively for dynamic storytelling. Whether you need to highlight a low-leverage case with a larger Equity block or a high-leverage scenario with expanded Debt, these slides adapt instantly to your narrative.
Ideal for boardroom presentations, investor pitches, or internal finance reviews, this asset accelerates strategic discussions by visualizing the interplay between assets, debt, and equity. Duplicate slides to compare multiple scenarios side by side or export individual charts as infographics within reports and white papers. Modify axis labels and bracket callouts to reflect alternative metrics such as liabilities versus net worth, budget allocations, or resource distributions. The minimalist layout and high-contrast palette ensure clarity across projectors and mobile devices.
Use this slide beyond capital structure analysis for asset allocation breakdowns, funding round comparisons, budget vs. actual reviews, or portfolio risk assessments—any context where a clear, split-area chart drives informed decision-making.
Who is it for
Corporate finance professionals, CFOs, financial analysts, investment managers, and stakeholders seeking a clear visual framework to compare asset and funding-mix scenarios.
Other Uses
Repurpose for asset allocation breakdowns, funding round analyses, budget vs. actual comparisons, portfolio risk assessments, or resource distribution charts across any business function.
Login to download this file

Item ID
SB01639
Related Templates

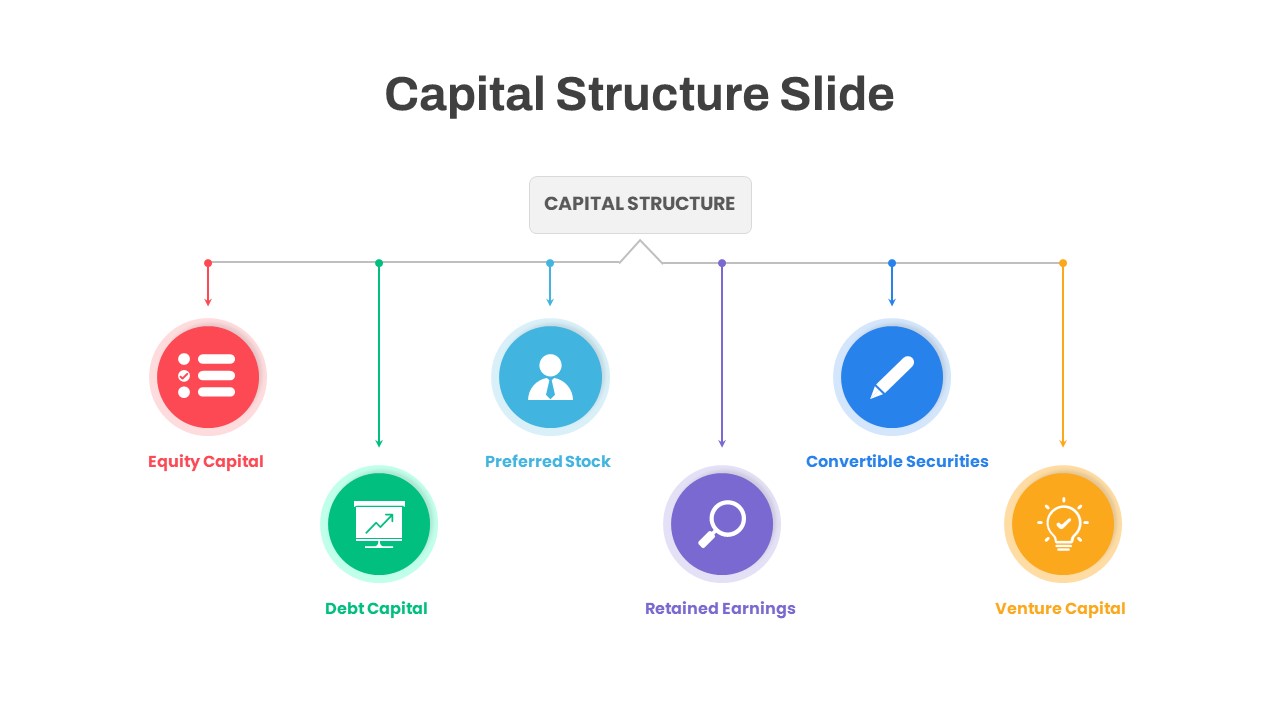
Capital Structure Hub & Spoke Diagram Template for PowerPoint & Google Slides
Process
Donut Chart Split Template for PowerPoint & Google Slides
Charts
Vertical Split Flow Chart Diagram Template for PowerPoint & Google Slides
Flow Charts
Creative Dynamic Gantt Chart Timeline Template for PowerPoint & Google Slides
Timeline

Dynamic Marketing Radar Chart Analytics Template for PowerPoint & Google Slides
Comparison
Dynamic Benchmarking Comparison Chart Template for PowerPoint & Google Slides
Comparison Chart
Dynamic Three-Series Stacked Area Chart Template for PowerPoint & Google Slides
Comparison Chart
Dynamic Sunburst Chart Visualization Template for PowerPoint & Google Slides
Charts
Dynamic Bar-of-Pie Chart Comparison Template for PowerPoint & Google Slides
Pie/Donut
Dynamic Financial Analysis Line Chart Template for PowerPoint & Google Slides
Finance
Donut Split Analysis template for PowerPoint & Google Slides
Pie/Donut
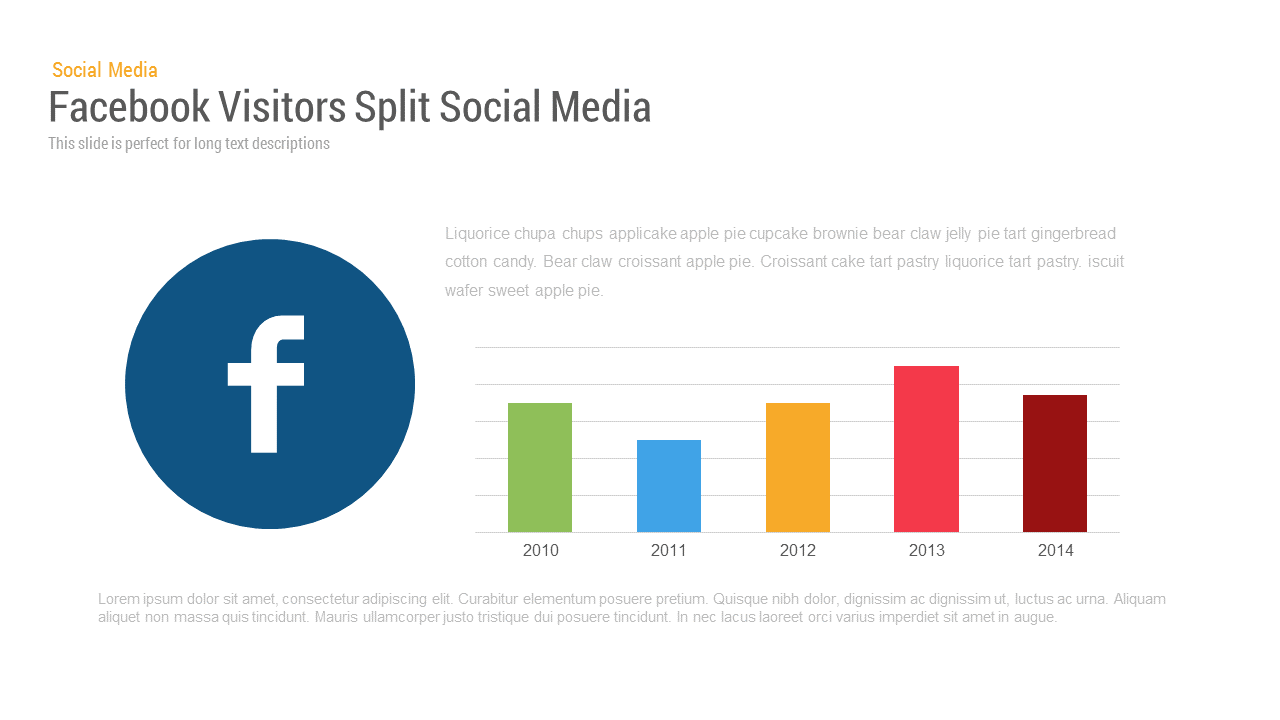
Facebook User Split template for PowerPoint & Google Slides
Bar/Column
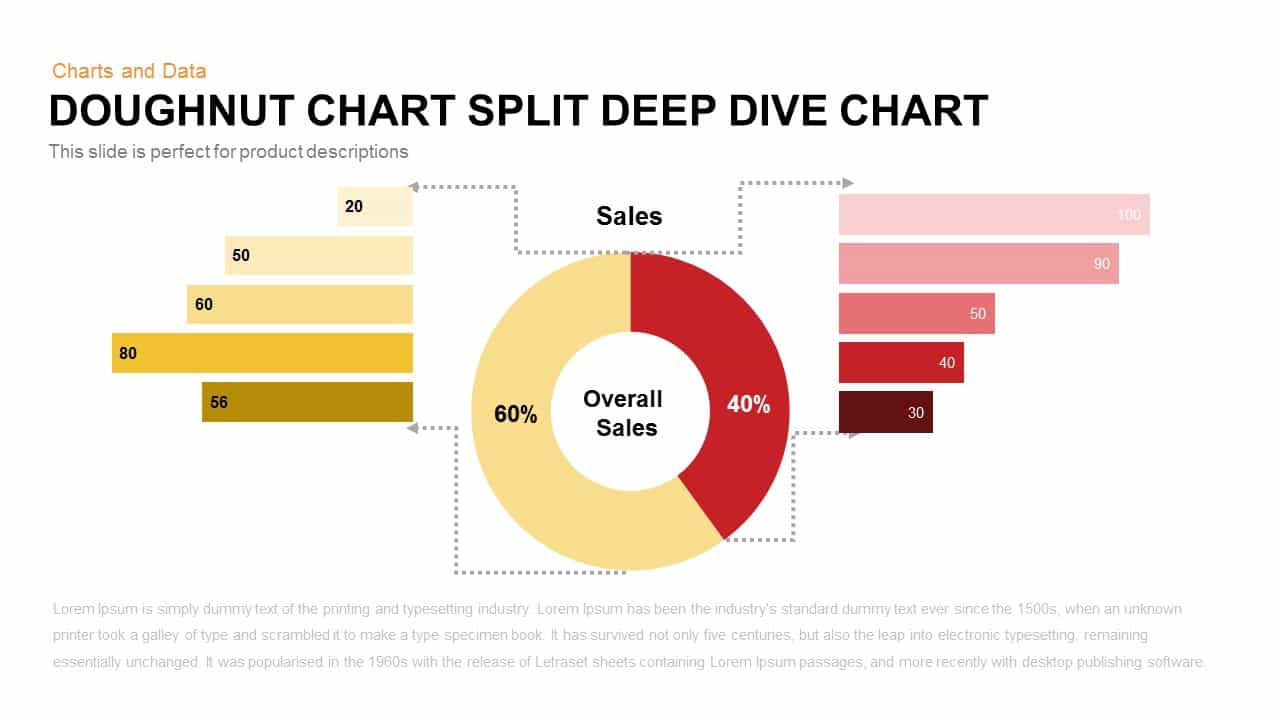
Split Doughnut Deep Dive Sales Analysis Template for PowerPoint & Google Slides
Pie/Donut
Multi-Segment Circle Split Diagram template for PowerPoint & Google Slides
Circular

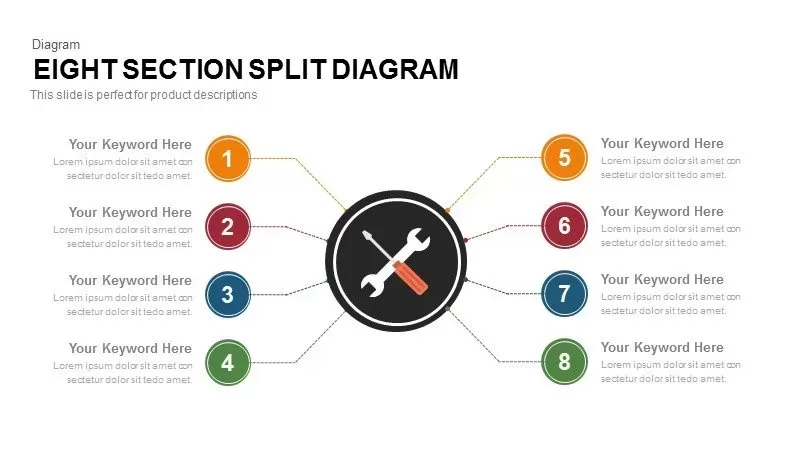
8-Section Split Diagram with Hub Icon template for PowerPoint & Google Slides
Circular
About Us Split Photo Template for PowerPoint & Google Slides
Marketing
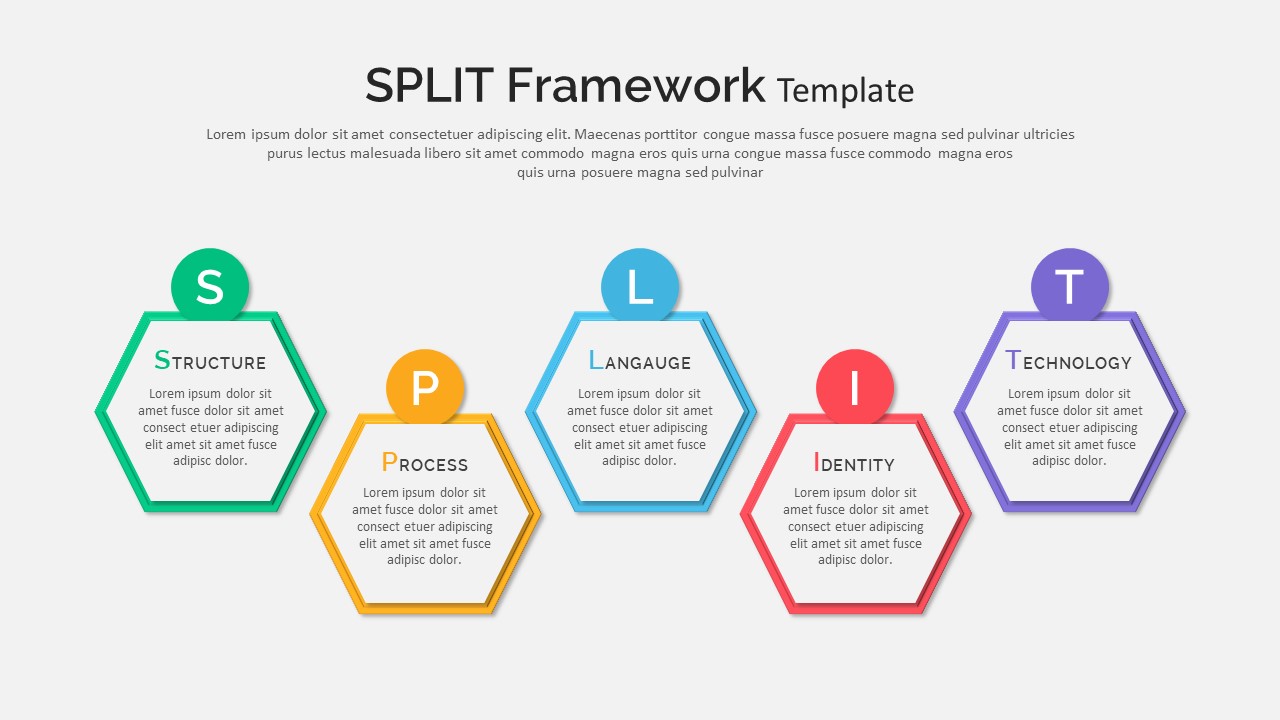
Split Framework Hexagon Diagram Slide Template for PowerPoint & Google Slides
Process
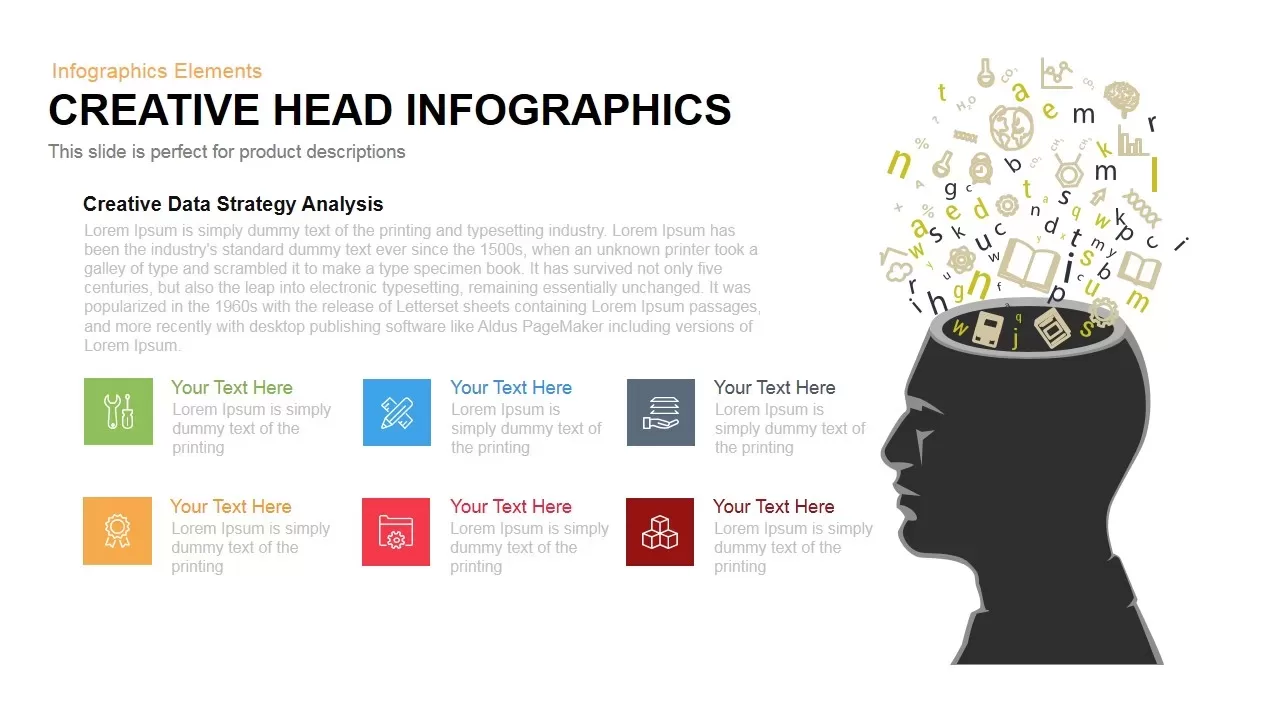
Dynamic Creative Head Infographics Template for PowerPoint & Google Slides
Circular
Dynamic Shield Process Flow Diagram template for PowerPoint & Google Slides
Process
Dynamic Circle Timeline Infographics template for PowerPoint & Google Slides
Timeline
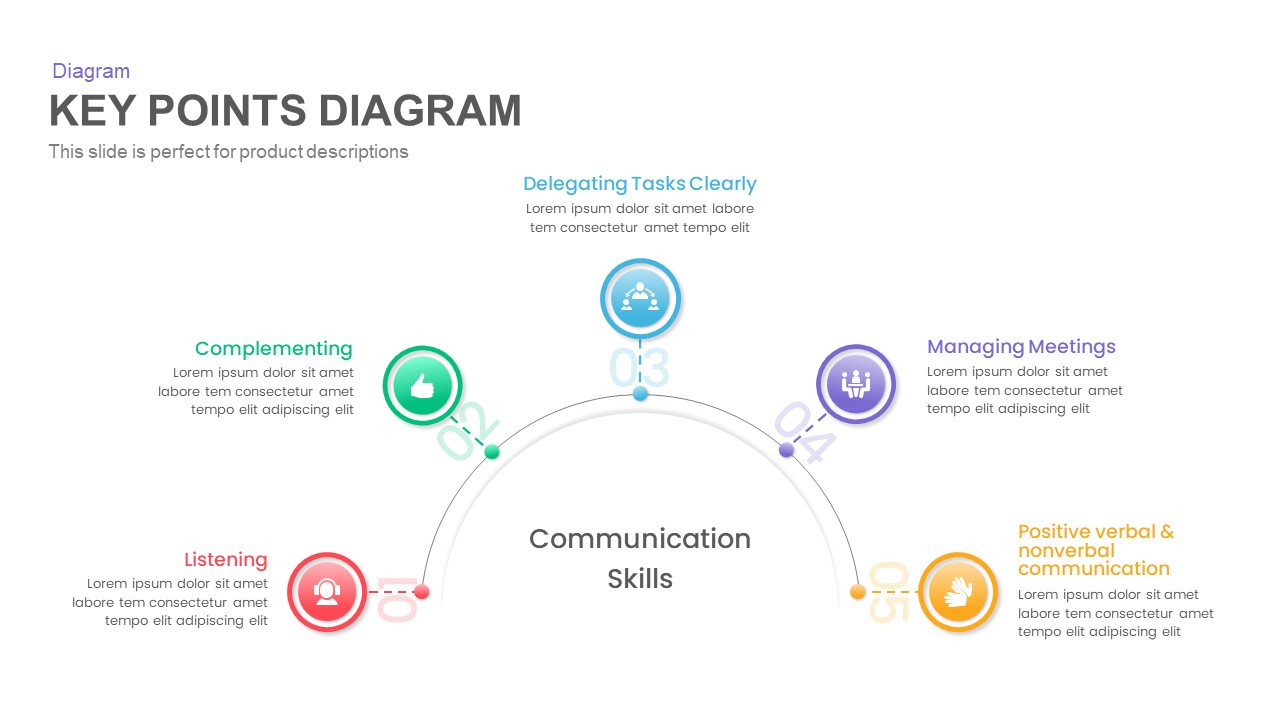
Key Points Diagram Presentation Template
Process

Wow Your Audience PowerPoint Template and Keynote Slide
Bar/Column
Dynamic Arrow Process Template for PowerPoint & Google Slides
Process

Dynamic 4 Gear Process Diagram Template for PowerPoint & Google Slides
Process
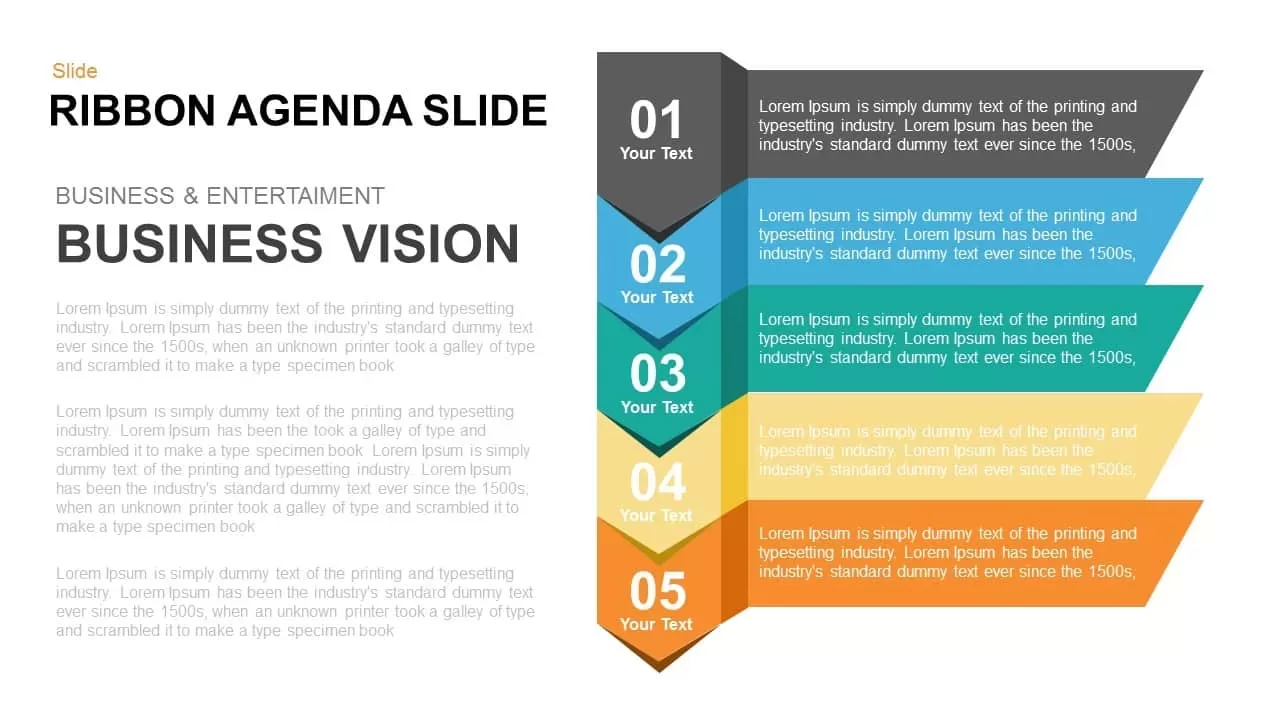
Dynamic Five-Step Ribbon Agenda Layout Template for PowerPoint & Google Slides
Agenda
Comparison Table for PowerPoint Template
Comparison
Winding Road Process PowerPoint Template
Process
Dynamic Winding Roadmap Infographic Template for PowerPoint & Google Slides
Roadmap
Dynamic AI Applications Infographic Template for PowerPoint & Google Slides
AI
Dynamic Growth Arrow Step Infographic Template for PowerPoint & Google Slides
Process
Dynamic Online Education Illustration Template for PowerPoint & Google Slides
Business Proposal
Gear Diagram PowerPoint Presentation Template
Process
Modern & Dynamic 6-Step Agenda Sequence Template for PowerPoint & Google Slides
Agenda
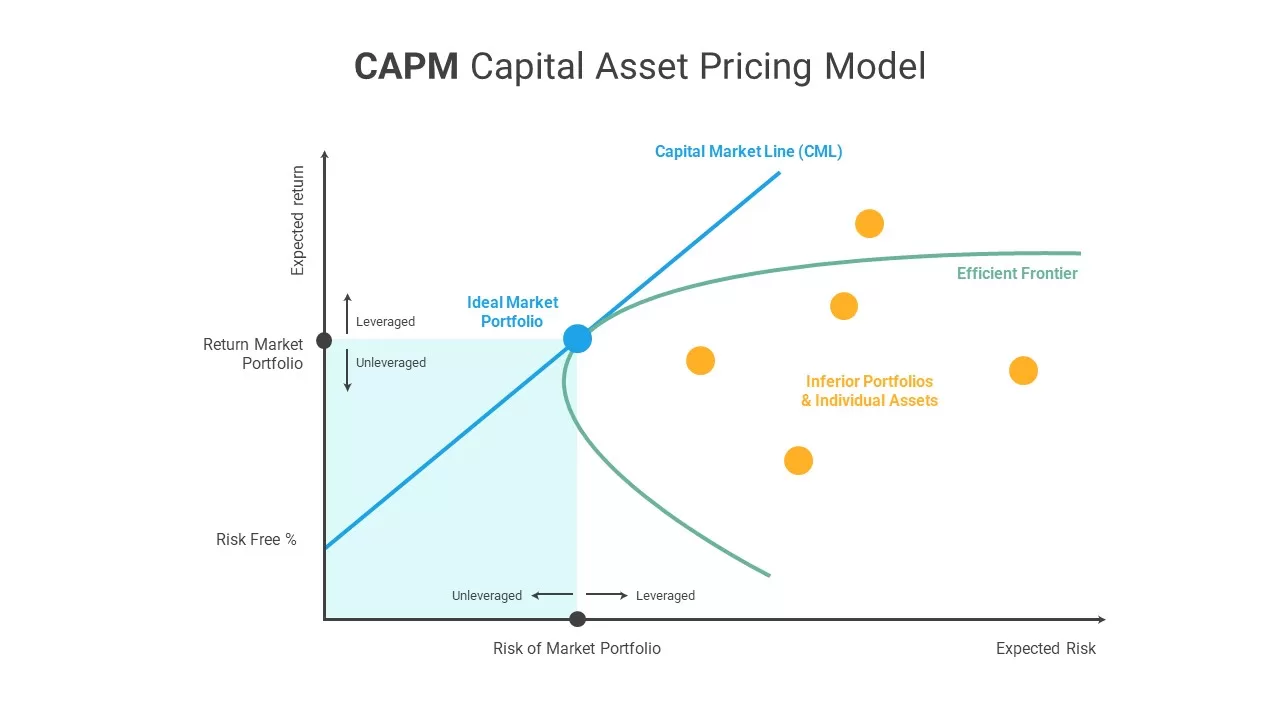
CAPM Capital Asset Pricing Model template for PowerPoint & Google Slides
Finance
Dynamic Curved Arrow Process Roadmap Template for PowerPoint & Google Slides
Process
Dynamic Conveyor Belt Process Flow Template for PowerPoint & Google Slides
Process
Dynamic Statistics & Progress Charts Template for PowerPoint & Google Slides
Pie/Donut
Dynamic Hub-and-Spoke Infographic Diagram Template for PowerPoint & Google Slides
Circular
Dynamic Circular Hub-and-Spoke Infographic Template for PowerPoint & Google Slides
Circular
Dynamic 3D Rubik’s Cube Diagram Pack Template for PowerPoint & Google Slides
Infographics
Dynamic Four-Step Gear Process Template for PowerPoint & Google Slides
Process
Basketball PowerPoint Template
Advertising
Dynamic Hurdle Race Presentation Template for PowerPoint & Google Slides
Advertising
Dynamic Sprint Race Cover Slide Template for PowerPoint & Google Slides
Graphics
Dynamic Soccer Stadium Presentation Template for PowerPoint & Google Slides
Graphics
Dynamic Cycling Presentation Template for PowerPoint & Google Slides
Graphics
Dynamic Boxing Training Cover Slide Template for PowerPoint & Google Slides
Graphics
Dynamic Relay Race Presentation Slide Template for PowerPoint & Google Slides
Graphics
Dynamic Chevron Timeline Infographic Template for PowerPoint & Google Slides
Timeline
Animated Question Mark PowerPoint Template
Graphics
Dynamic Abstract Corporate Theme Template for PowerPoint & Google Slides
Decks
Dynamic Investment & Finance Growth Template for PowerPoint & Google Slides
Finance
Dynamic Fundraising Thermometer Slide Template for PowerPoint & Google Slides
Revenue

Sports PowerPoint Theme
Decks
Capital Deployment Percentage Breakdown Template for PowerPoint & Google Slides
Pitch Deck
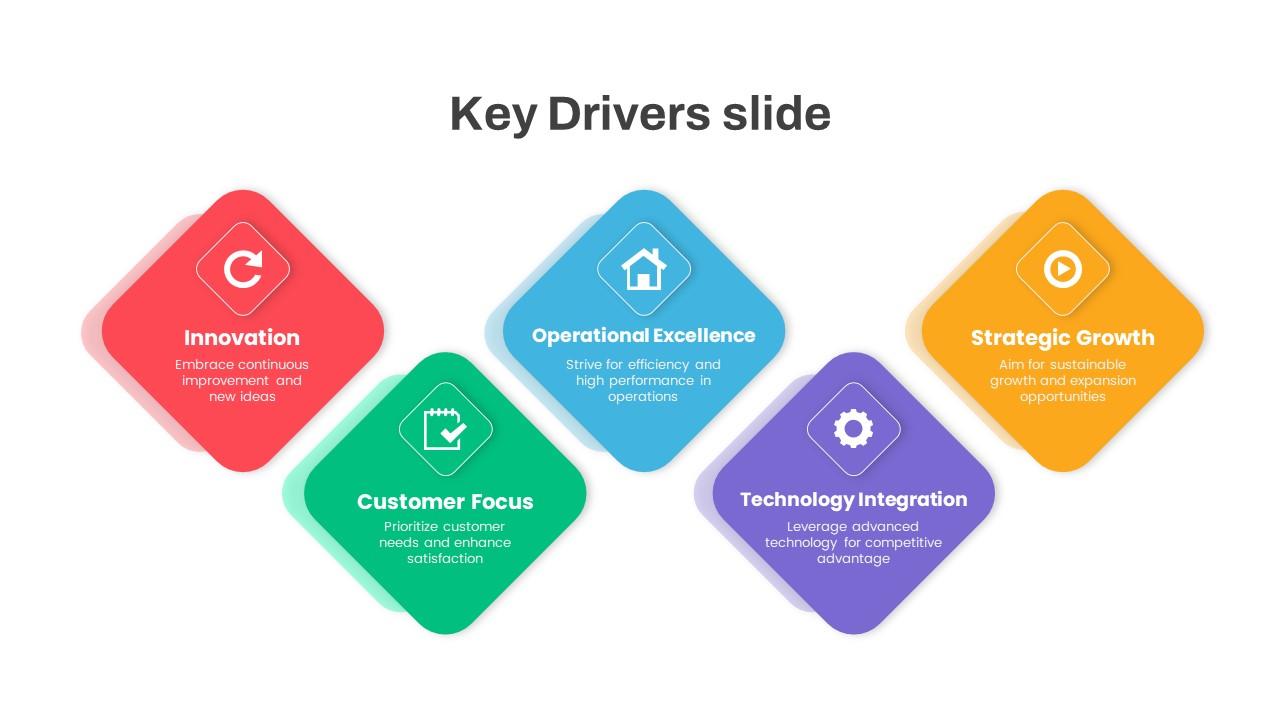
Key Drivers PowerPoint Template
Process
Capital Investments Process Flow Diagram Template for PowerPoint & Google Slides
Process
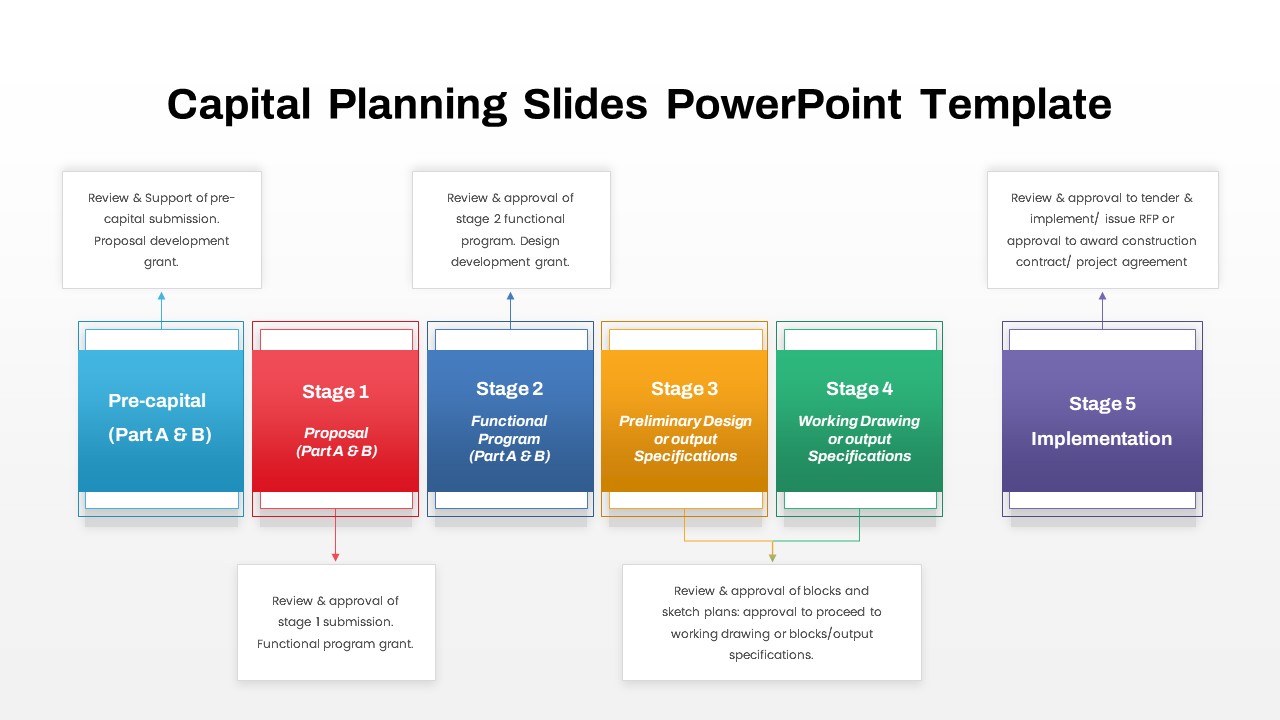
Capital Planning Five-Stage Process template for PowerPoint & Google Slides
Process
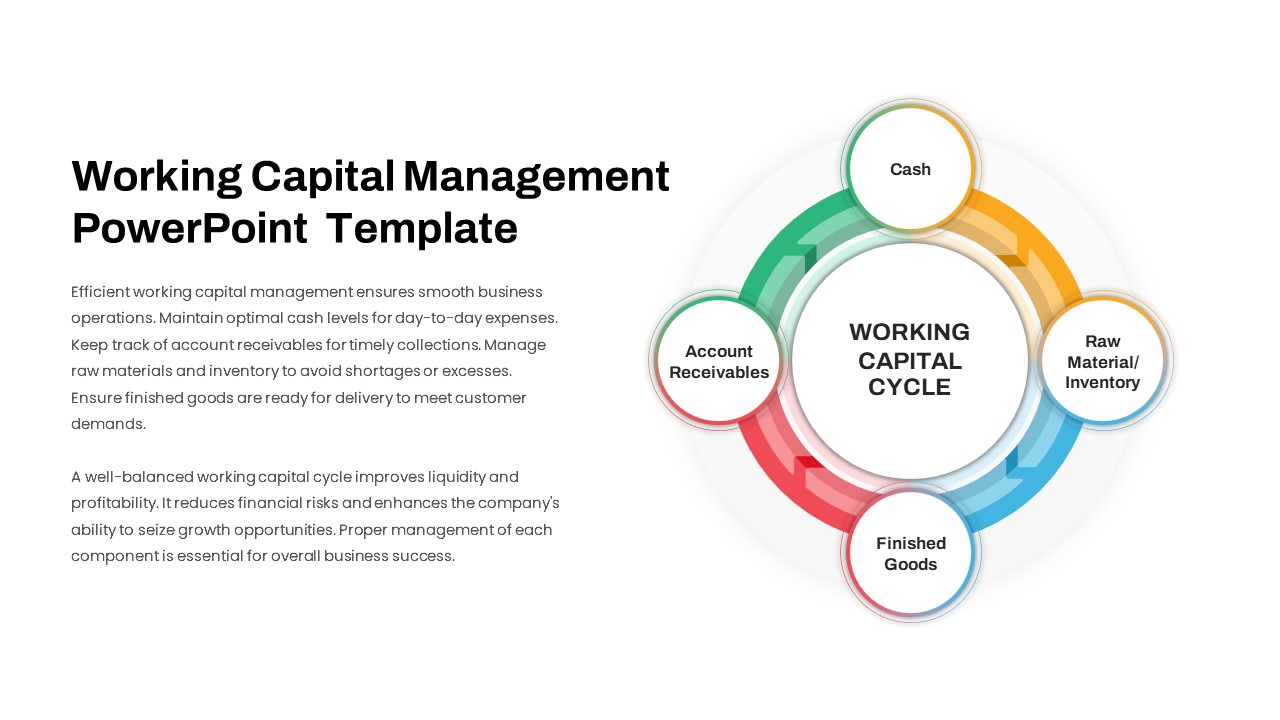
Working Capital Cycle Diagram Template for PowerPoint & Google Slides
Circular
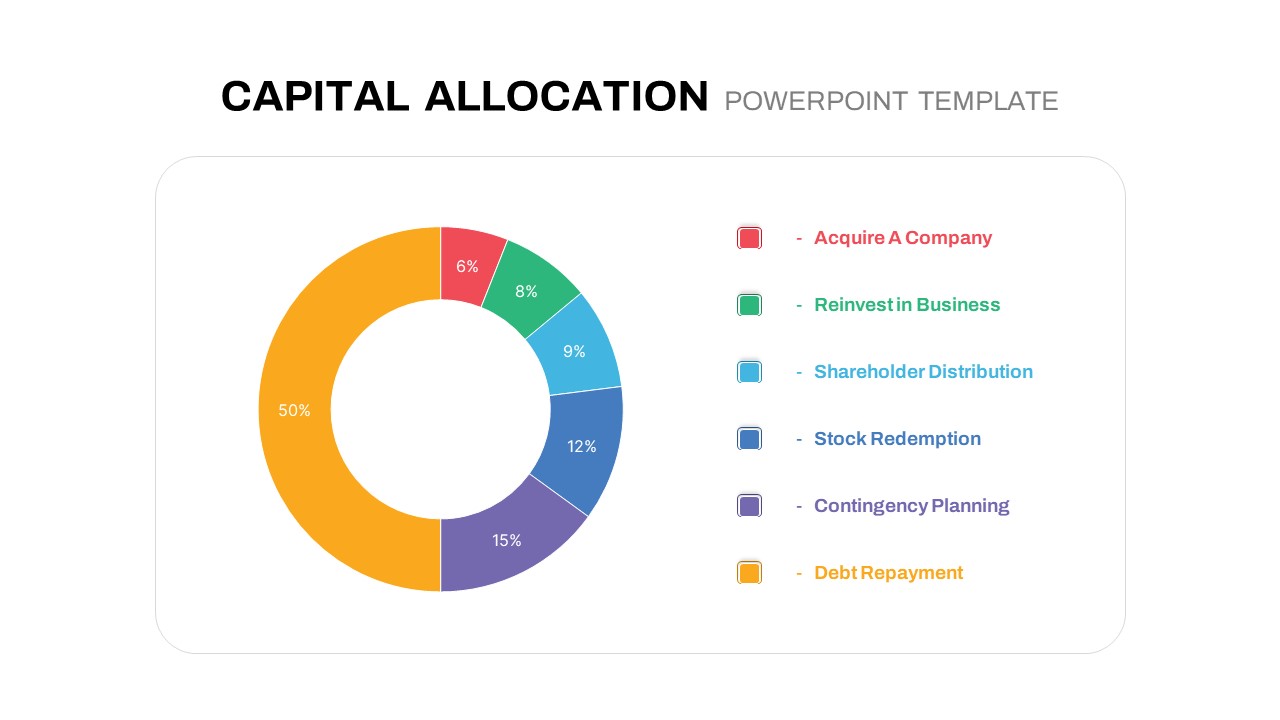
Circular Capital Allocation Diagram Template for PowerPoint & Google Slides
Business Models
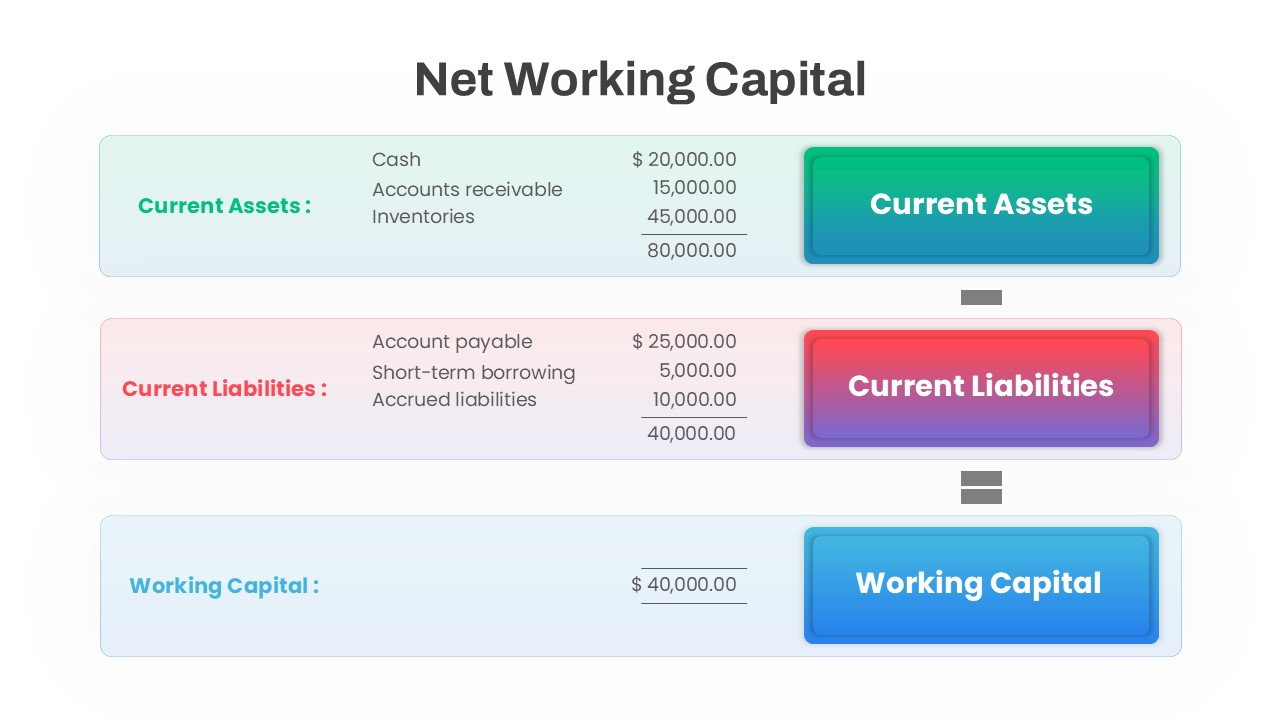
Net Working Capital Calculation Template for PowerPoint & Google Slides
Finance

Free Dynamic Global Warming Presentation Template for PowerPoint & Google Slides
Pitch Deck
Free
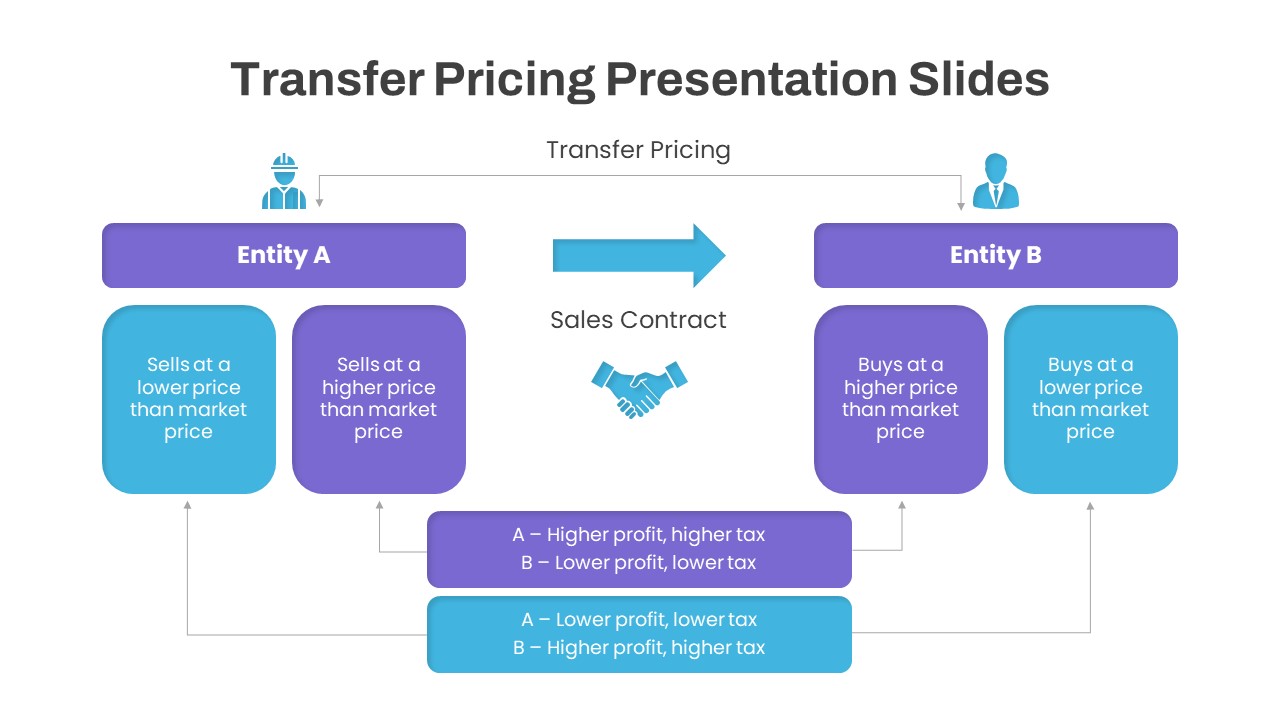
Dynamic Transfer Pricing Flow Diagram Template for PowerPoint & Google Slides
Finance
Dynamic Carousel Icon Hub Diagram Template for PowerPoint & Google Slides
Circular
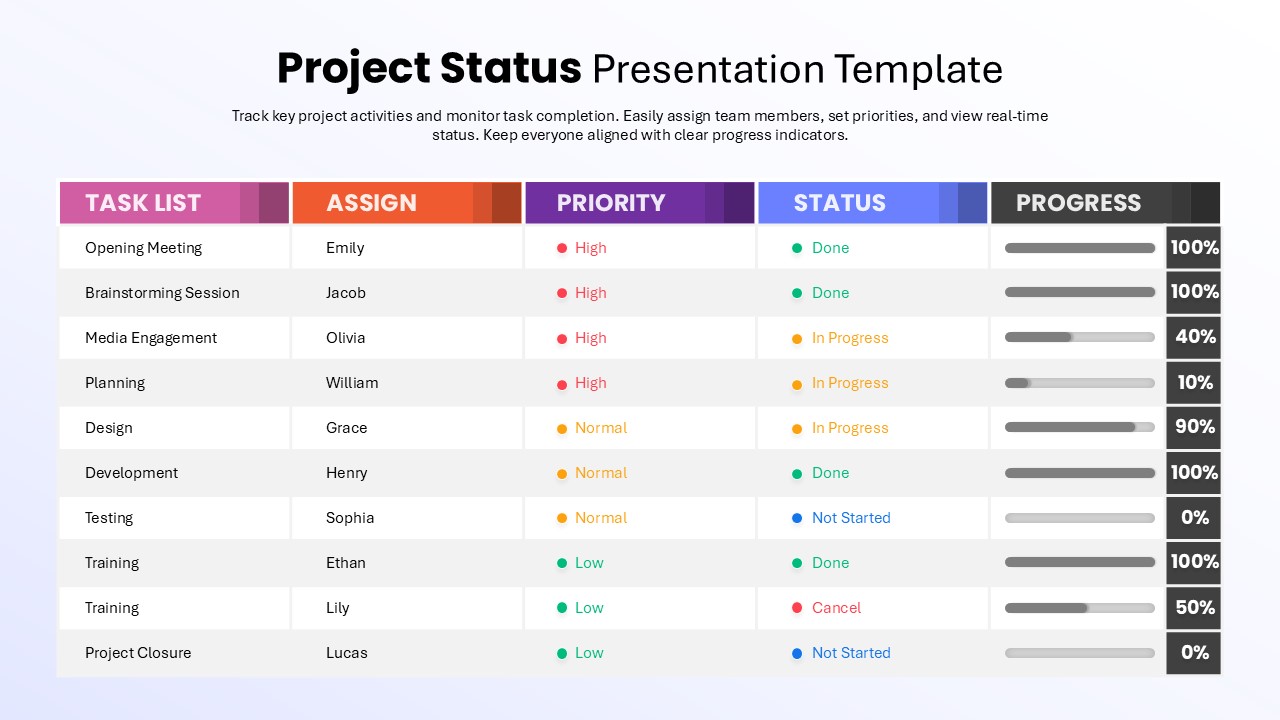
Dynamic Project Status Tracking Table Template for PowerPoint & Google Slides
Project Status
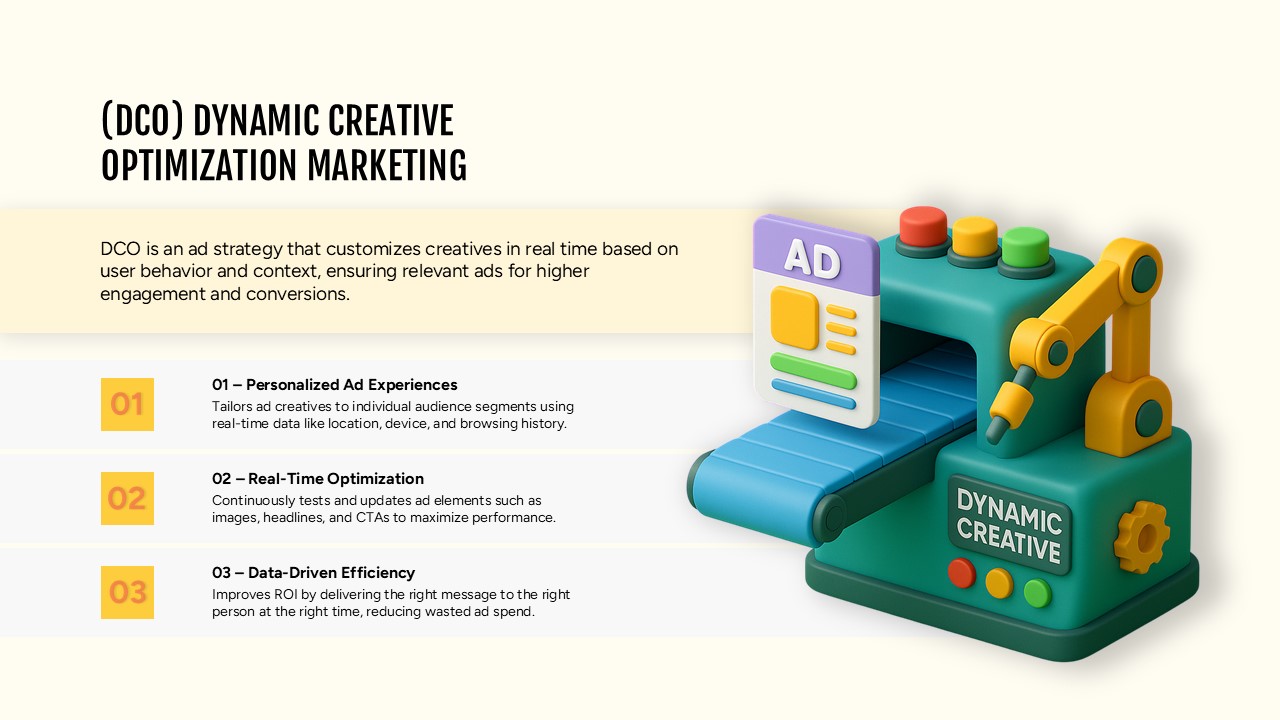
Dynamic Creative Optimization Marketing Template for PowerPoint & Google Slides
Digital Marketing
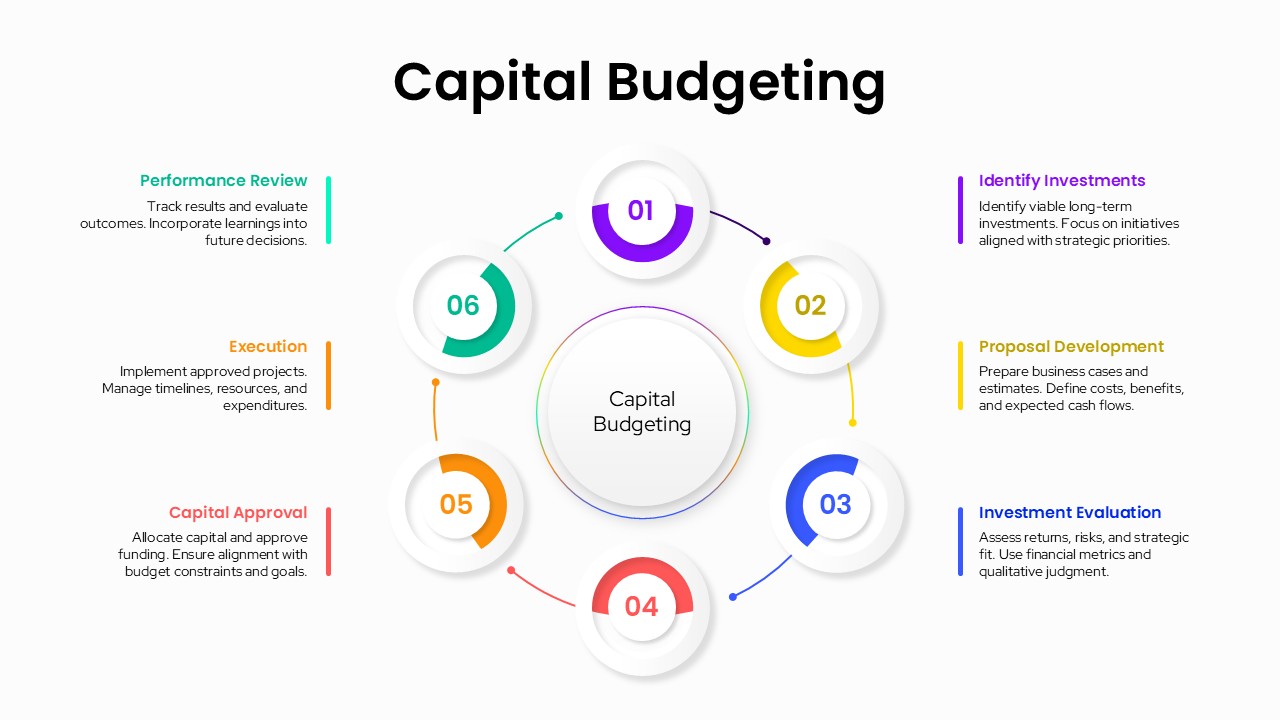
Capital Budgeting Template for PowerPoint & Google Slides
Finance
Dynamic Tennis Sports Theme Slide for PowerPoint & Google Slides
Graphics
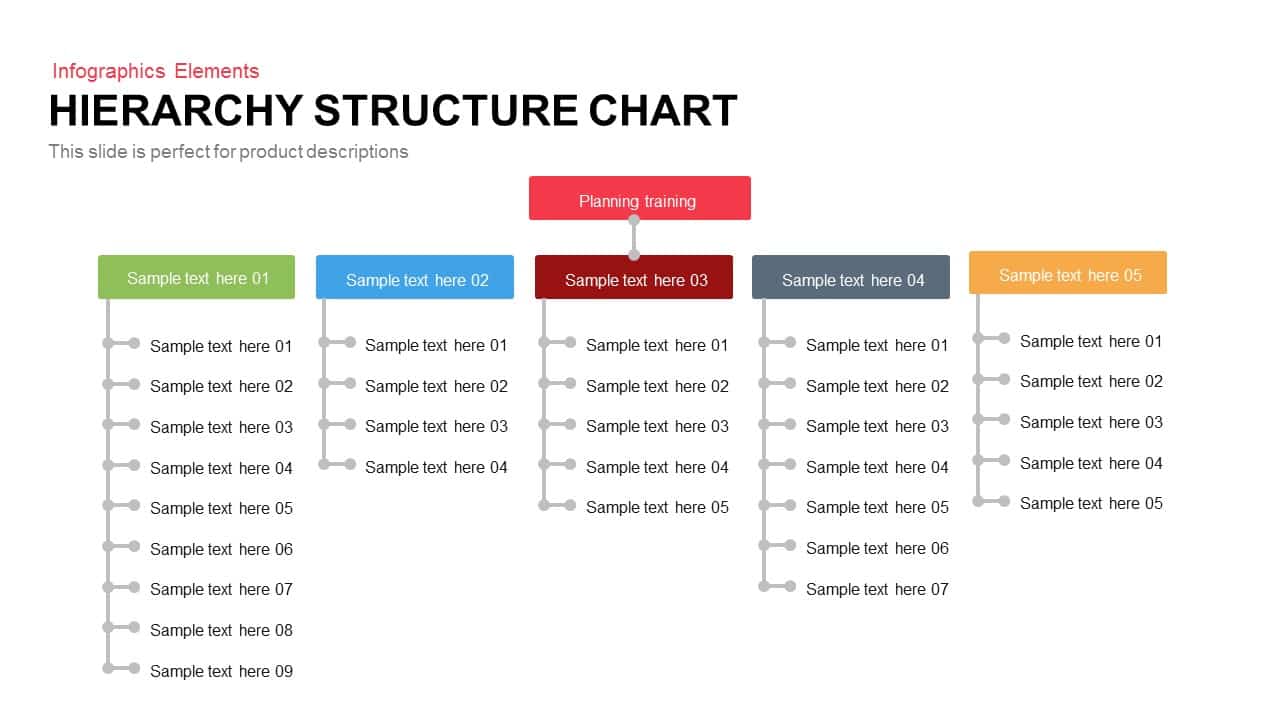
Five-Branch Hierarchy Structure Chart template for PowerPoint & Google Slides
Org Chart
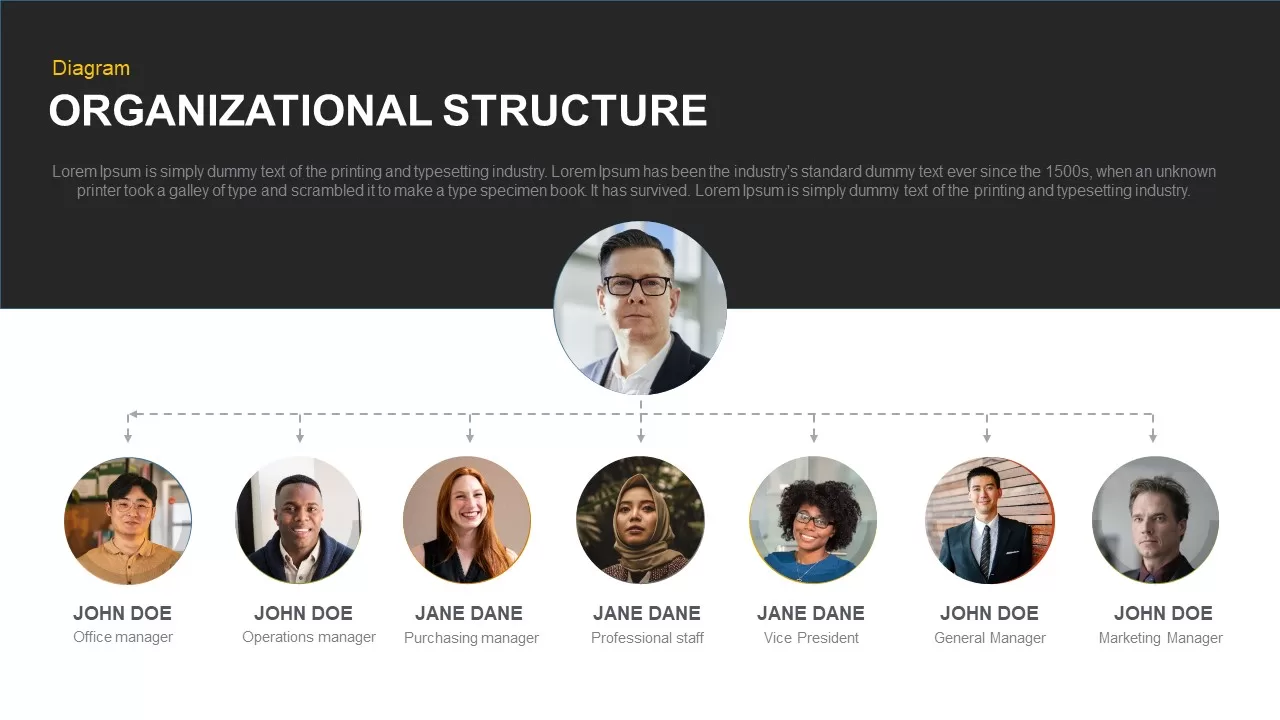
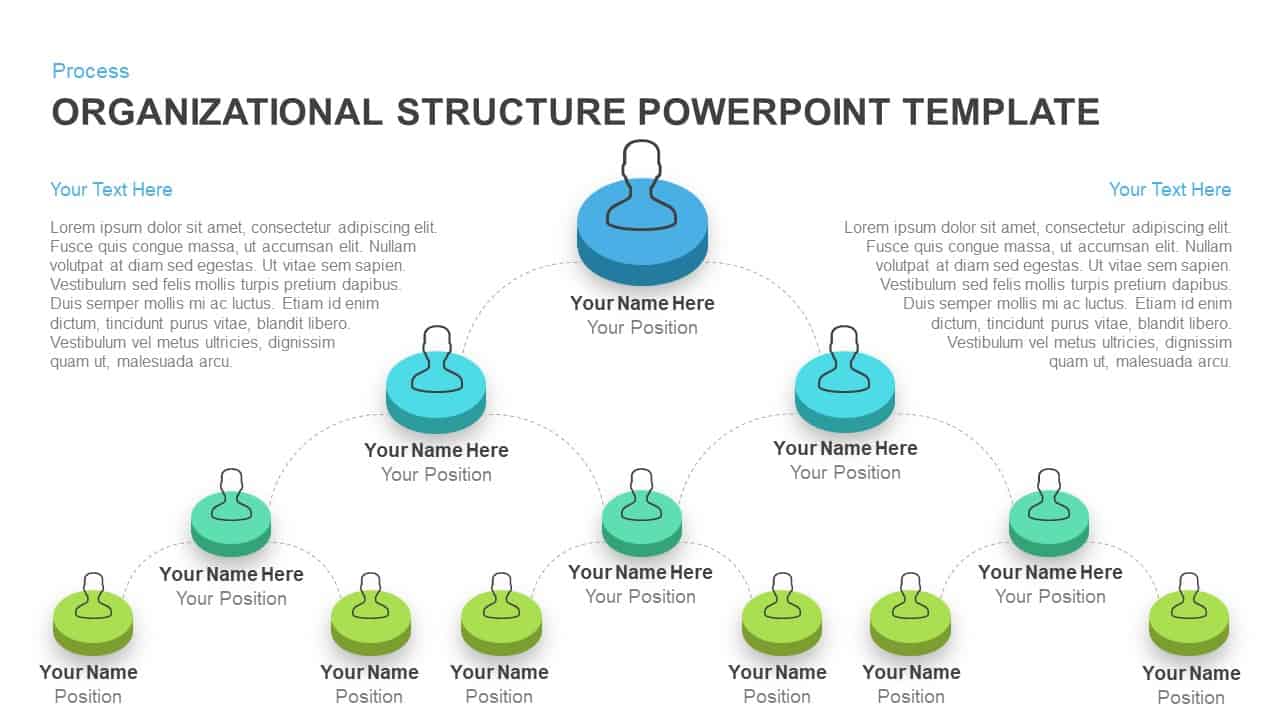
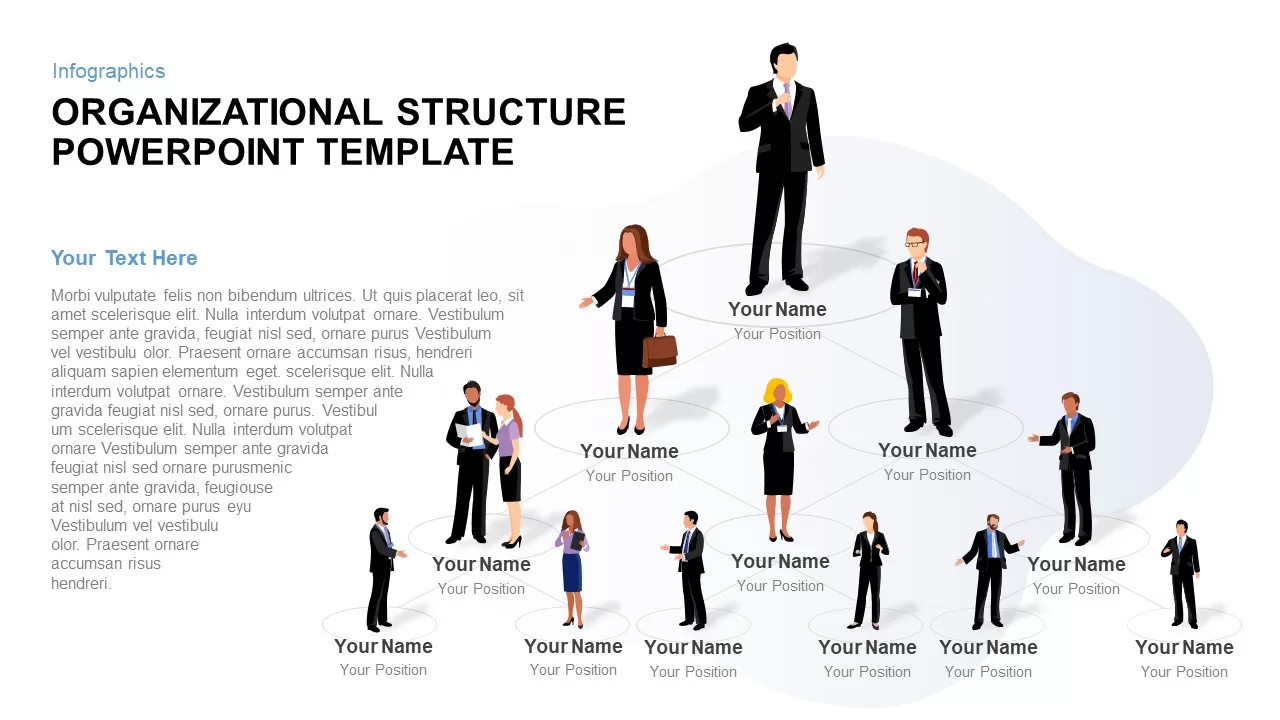
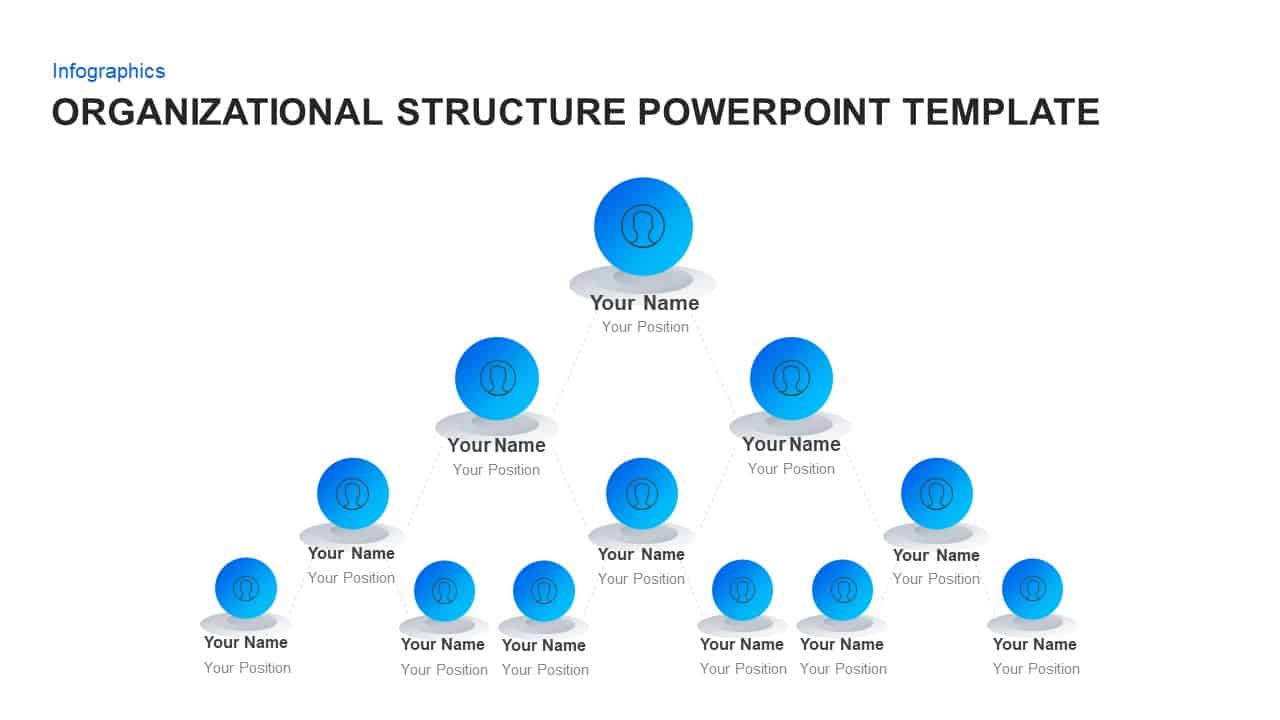
Organizational Structure Org Chart Template for PowerPoint & Google Slides
Org Chart
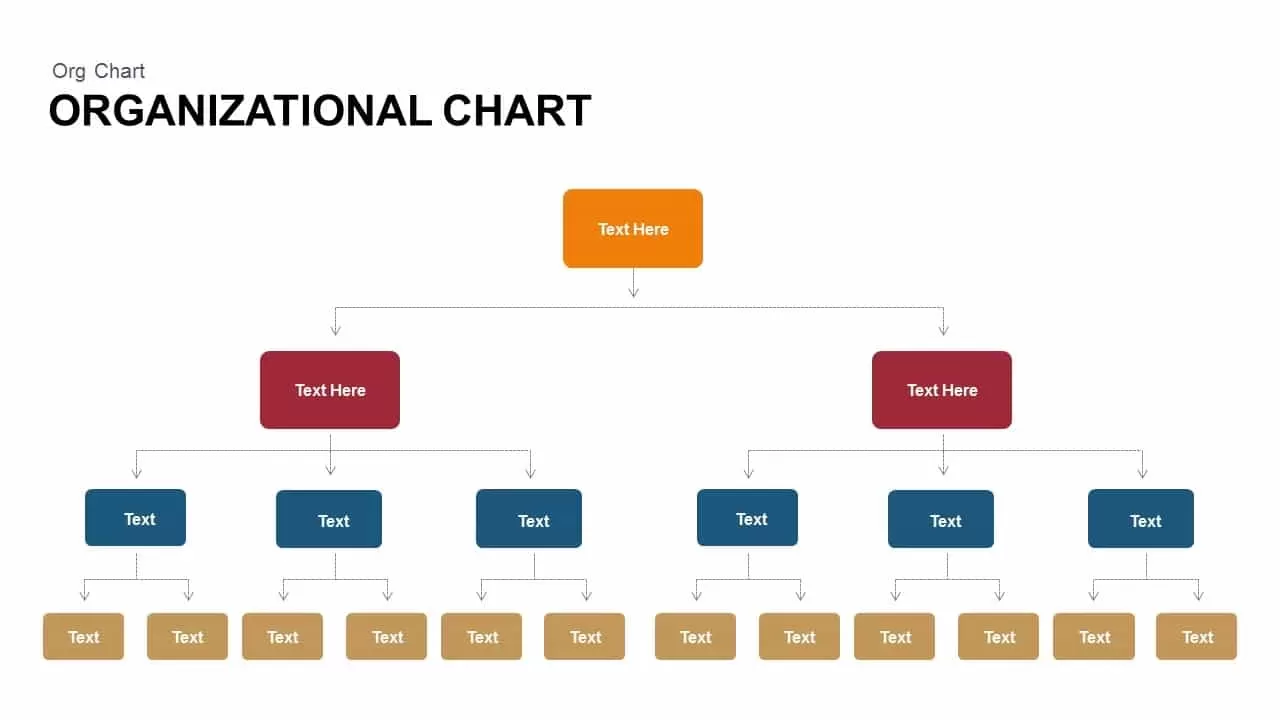
Organizational Chart PowerPoint Template
Org Chart
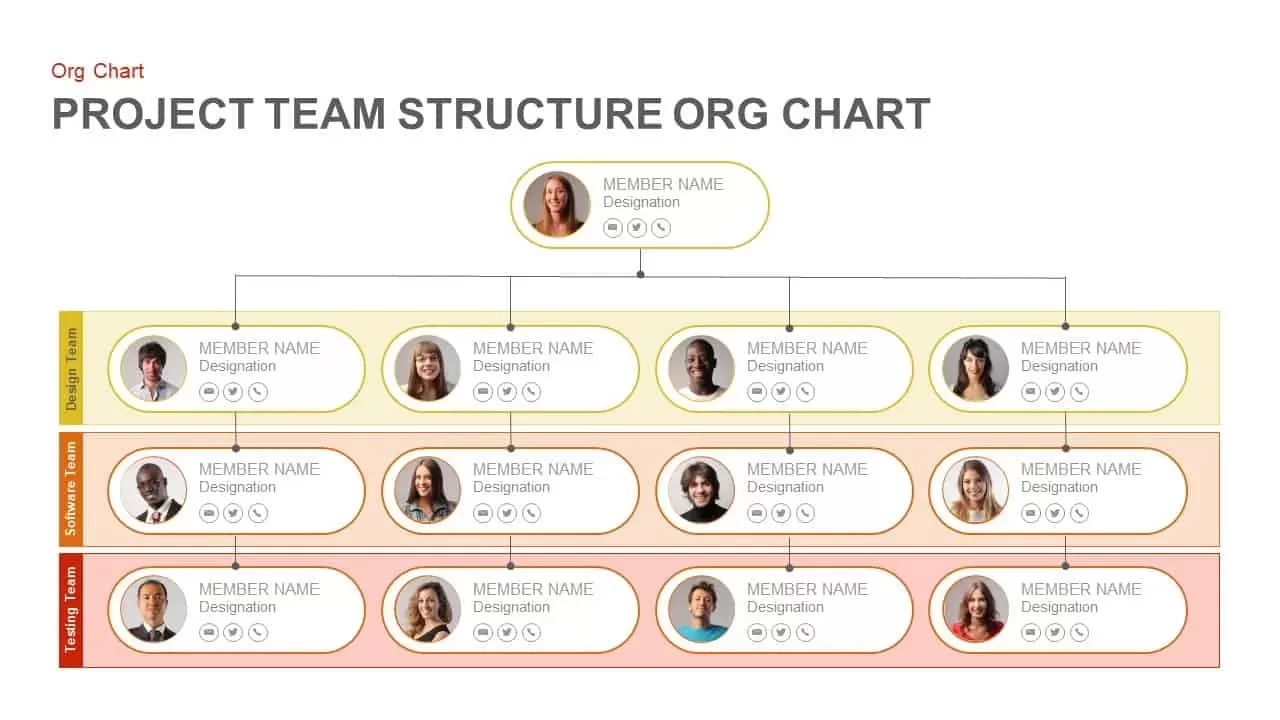
Project Team Structure Org Chart PowerPoint Template
Org Chart
Isometric Organizational Structure Chart Template for PowerPoint & Google Slides
Org Chart
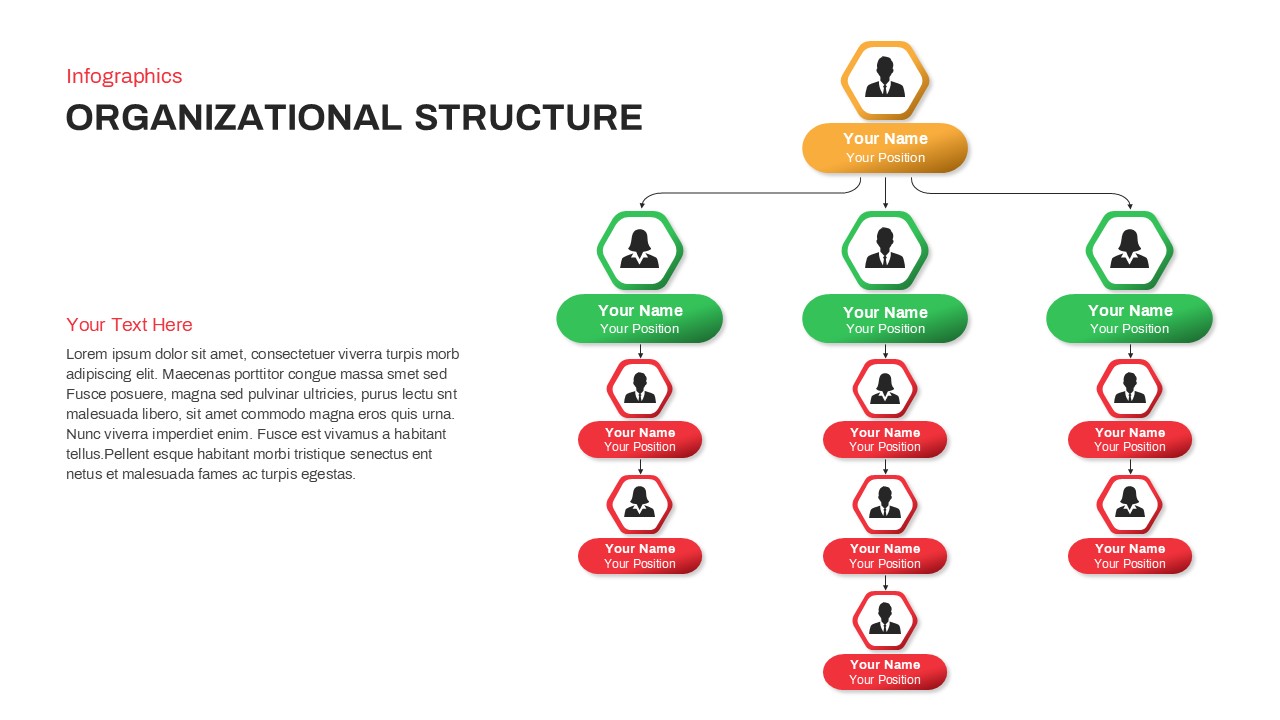
Organizational Structure Hierarchy Chart Template for PowerPoint & Google Slides
Org Chart
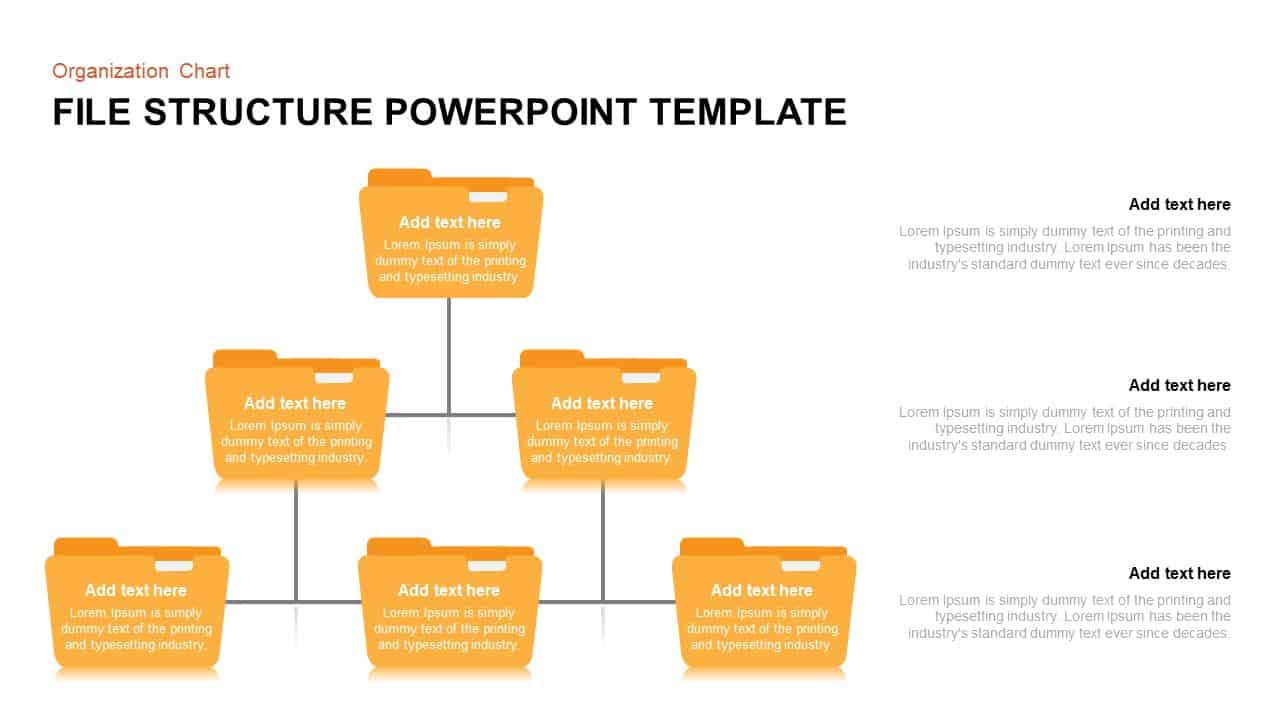
Folder Structure Template for PowerPoint
Org Chart
Org Chart Infographics
Org Chart
Organizational Chart Structure template for PowerPoint & Google Slides
Business Plan
Functional Organization Chart Structure Template for PowerPoint & Google Slides
Org Chart
Company Structure Hierarchical Org Chart Template for PowerPoint & Google Slides
Org Chart
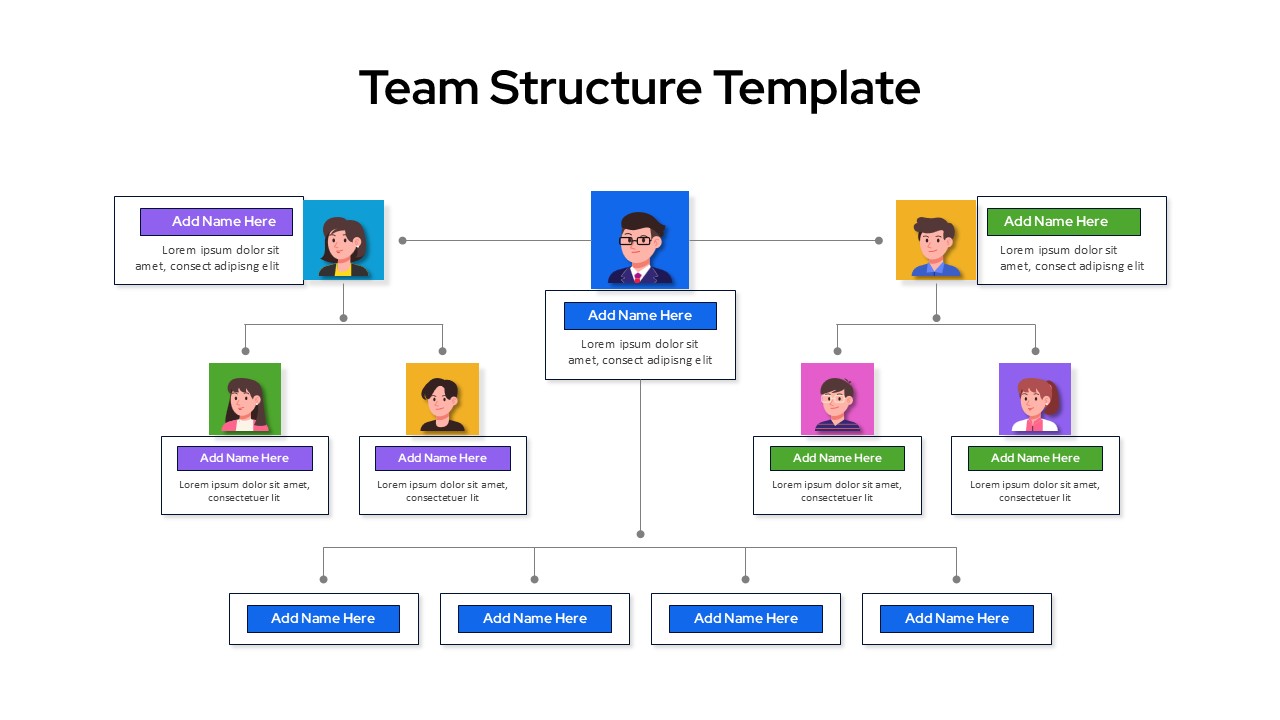
Team Structure Organizational Chart Presentation Template
Org Chart
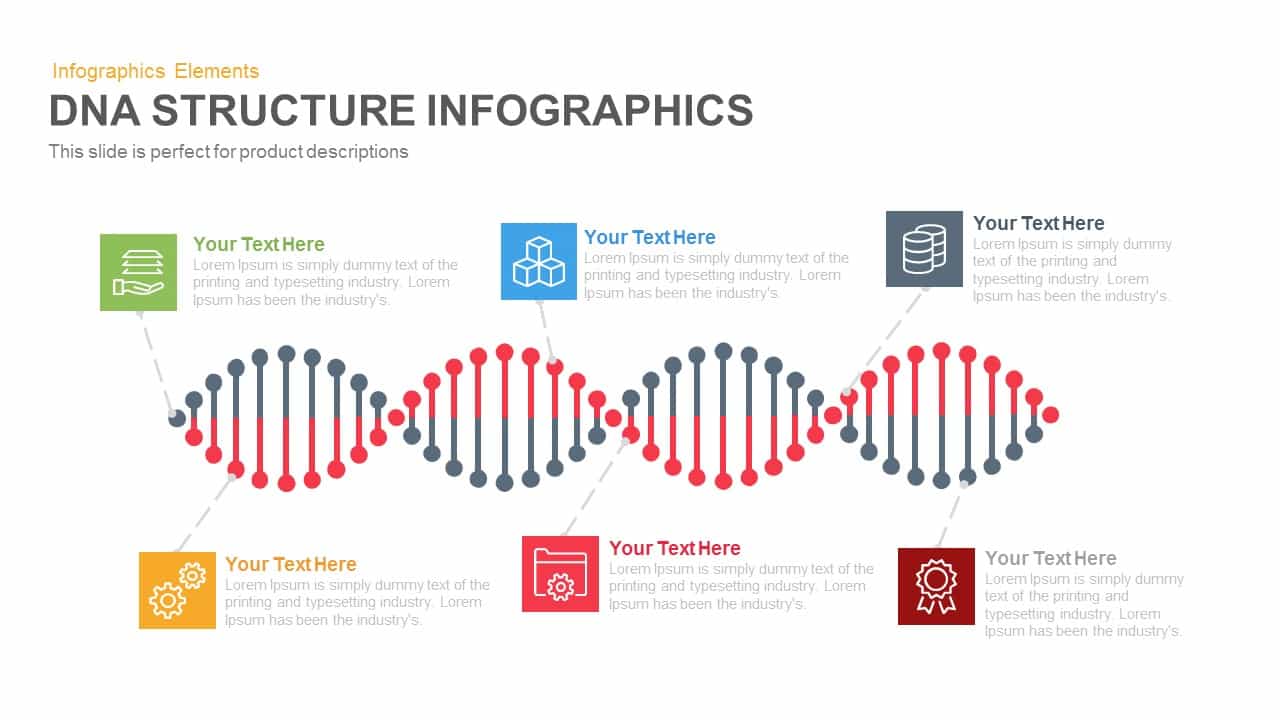
DNA Structure template for PowerPoint & Google Slides
Infographics
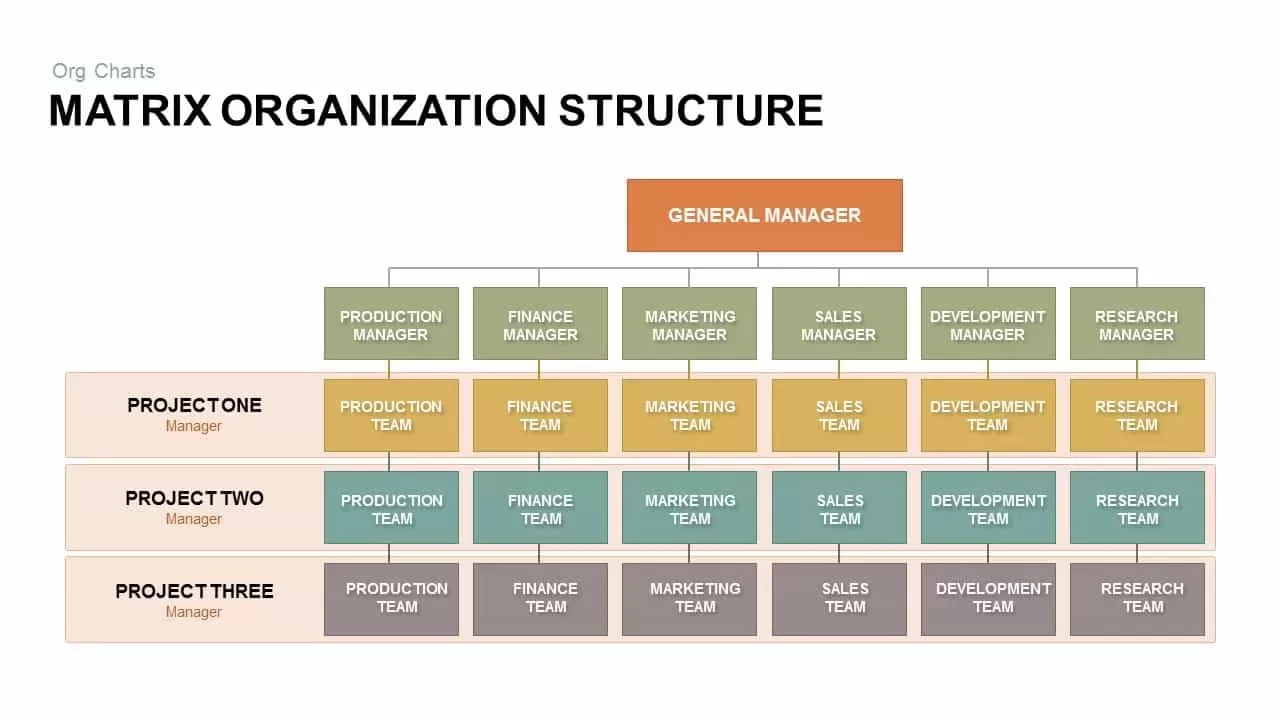
Matrix Organization Structure Template
Org Chart
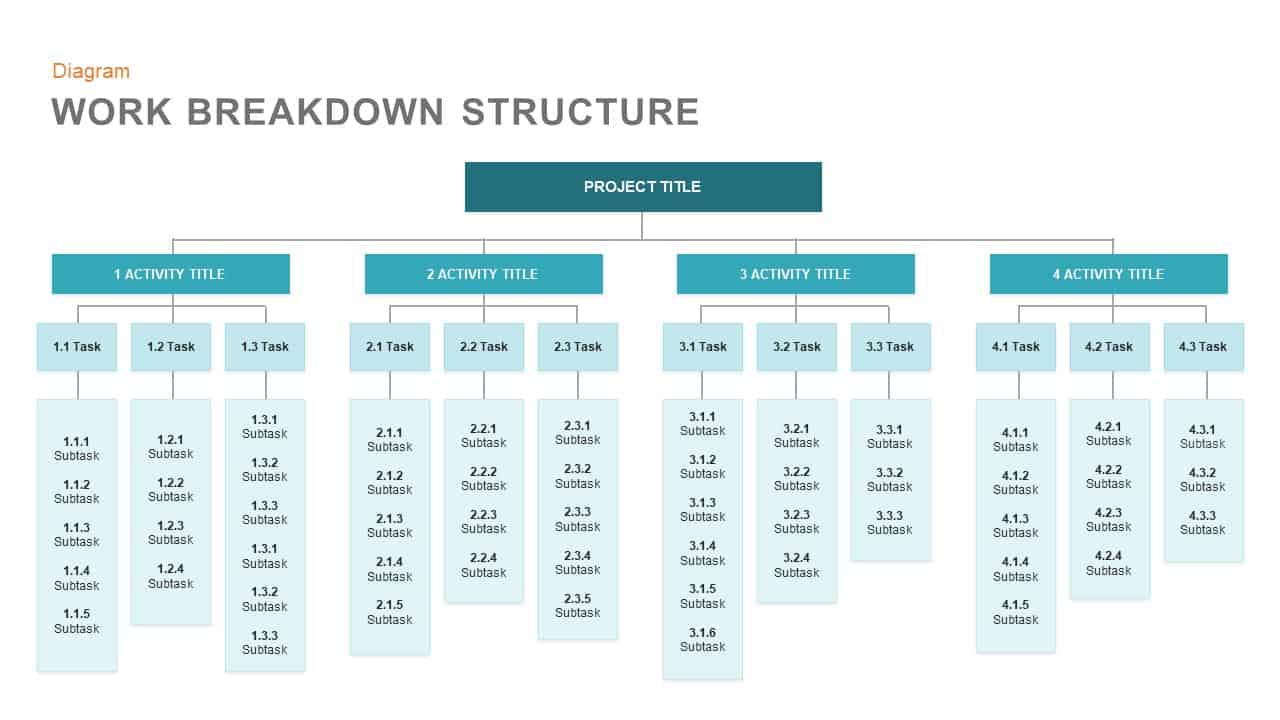
Work Breakdown Structure Template for PowerPoint and Slides
Diagrams
Hierarchical Organizational Structure Template for PowerPoint & Google Slides
Org Chart
Organizational Structure Diagram Template for PowerPoint & Google Slides
Org Chart
4 Types of Business Structure PowerPoint Template
Business Strategy
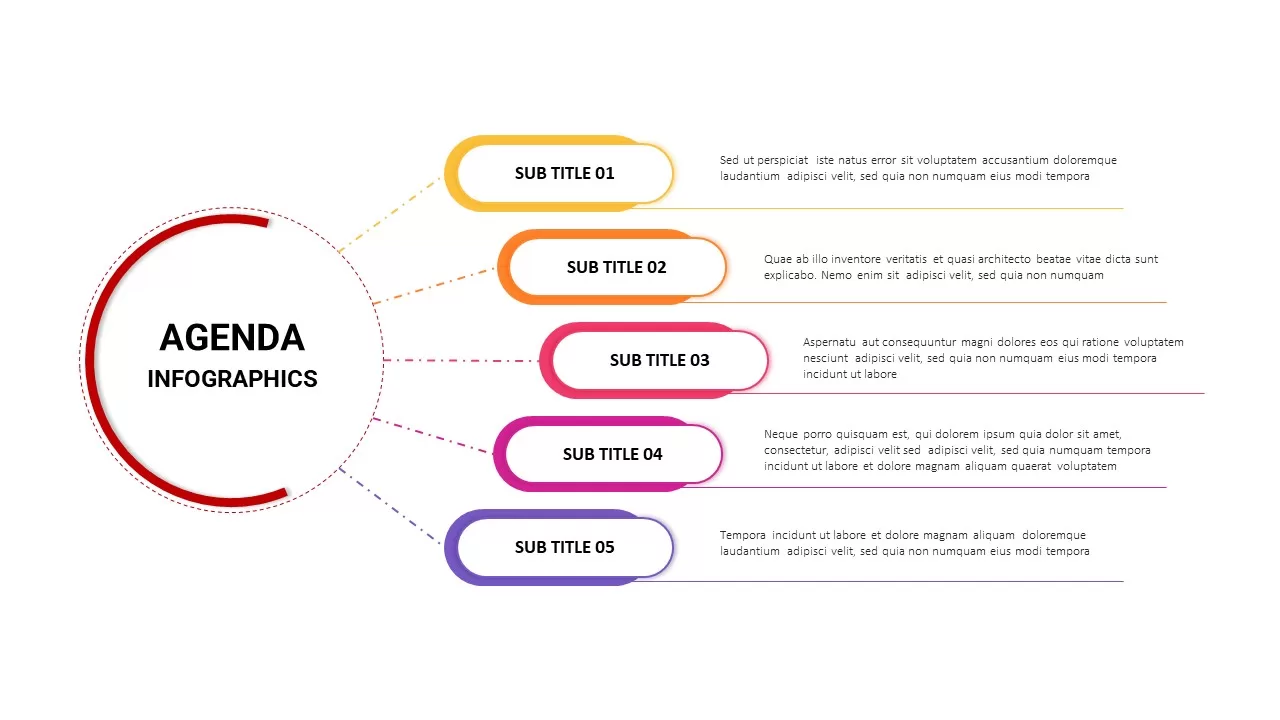
Agenda Infographics Structure template for PowerPoint & Google Slides
Business Plan
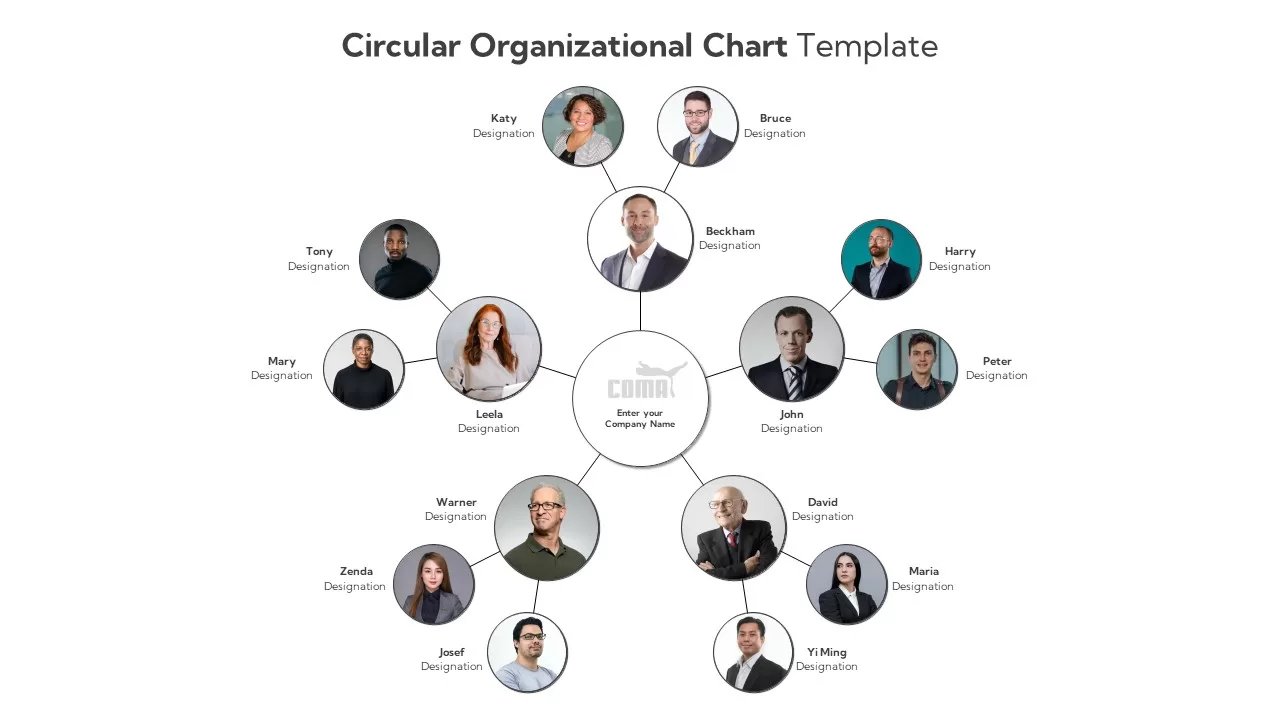
Circular Organizational Chart Template
Org Chart
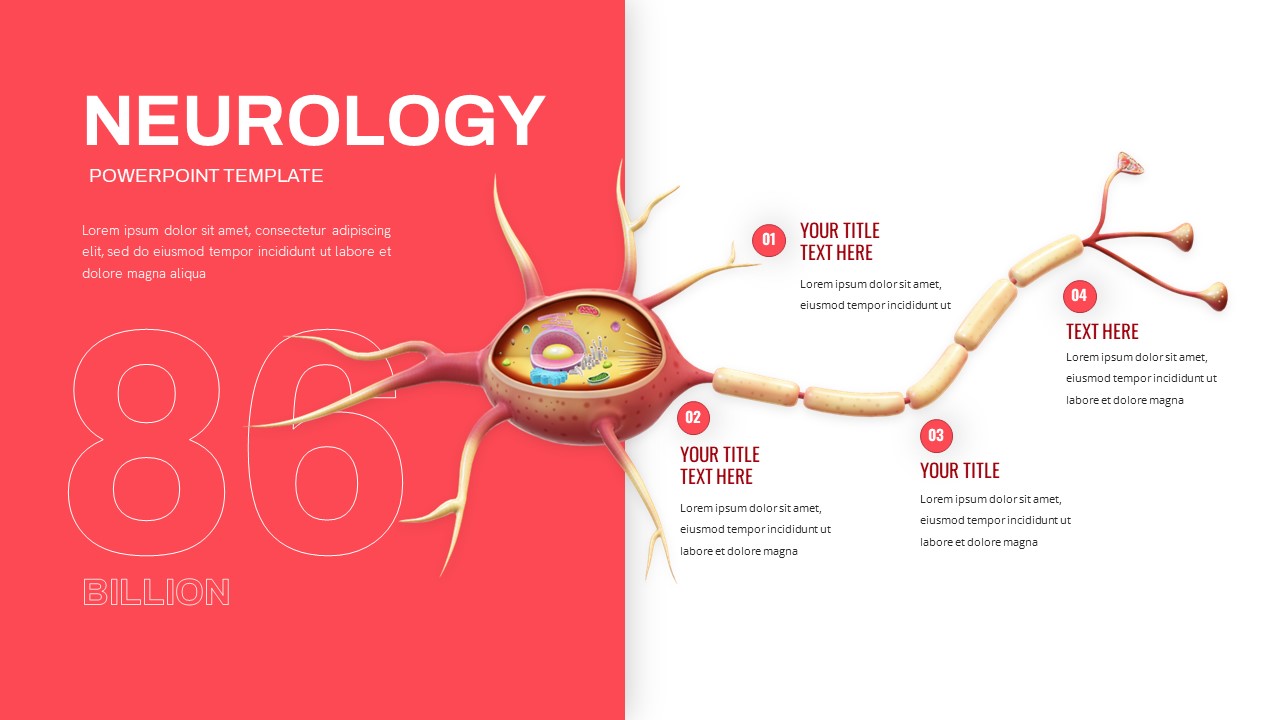
Neurology Neuron Structure Process Flow Template for PowerPoint & Google Slides
Health
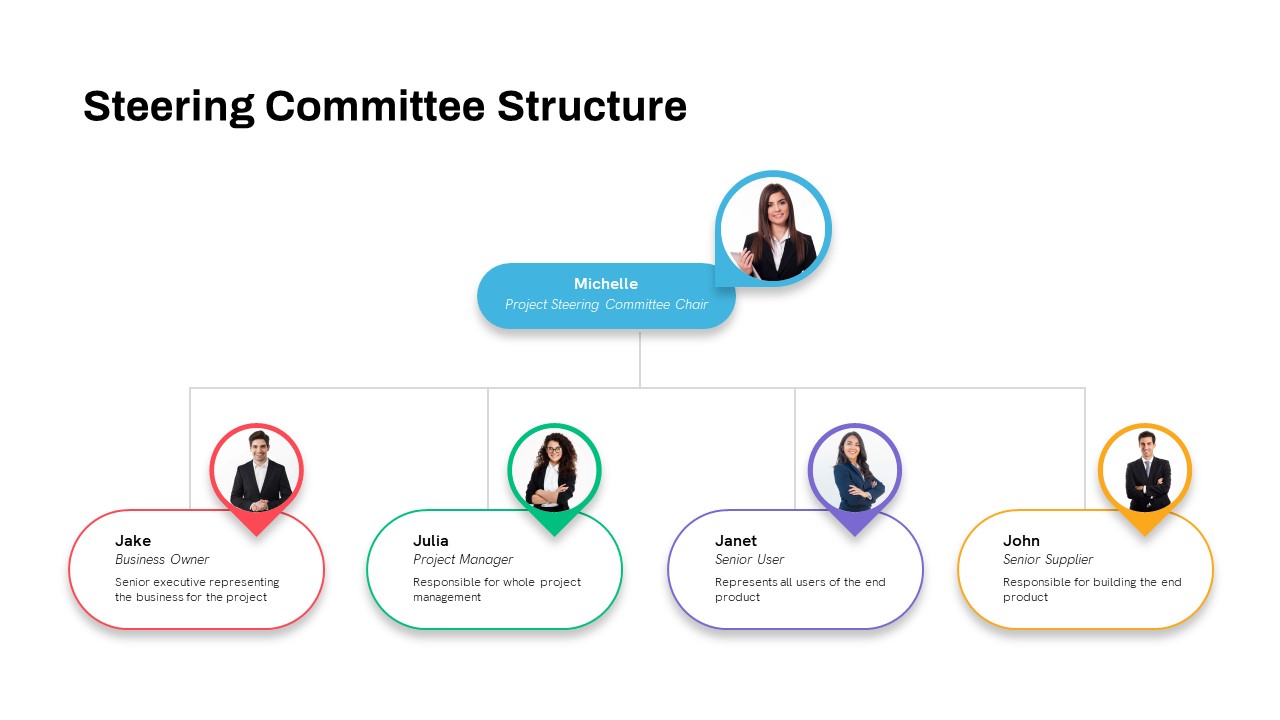
Steering Committee PowerPoint Template
Decks
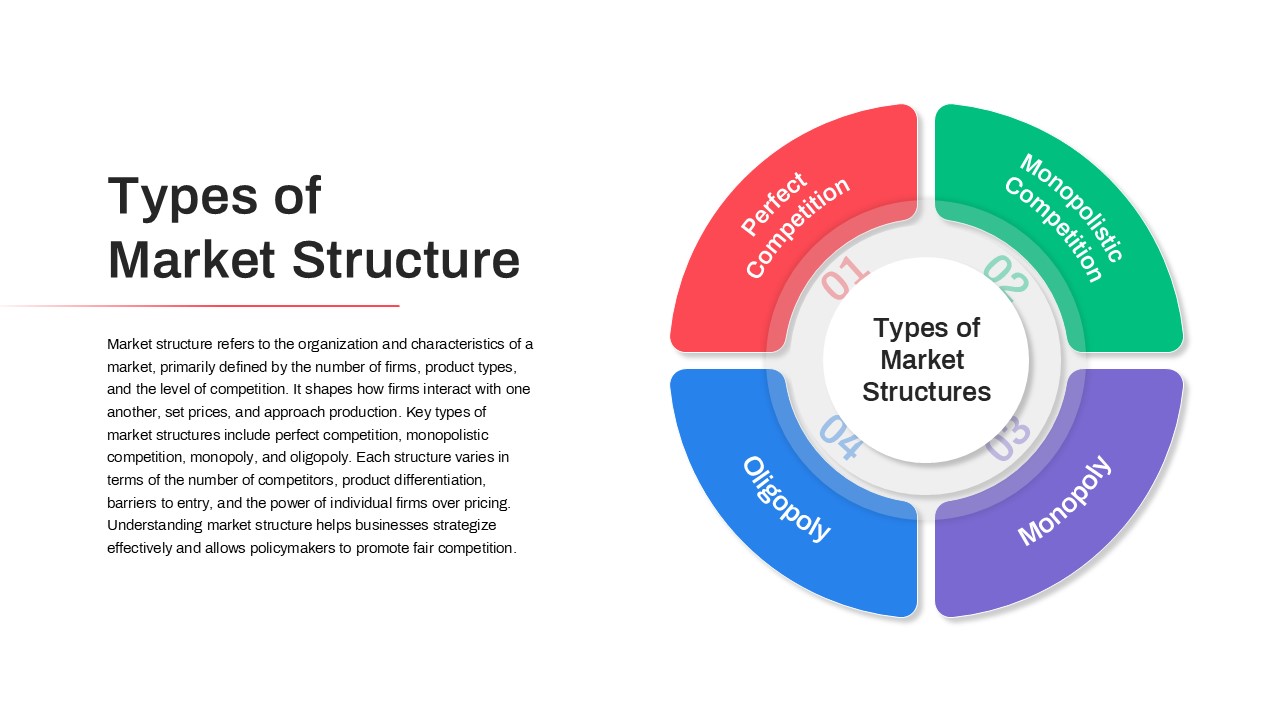
Market Structure PowerPoint Template
Comparison
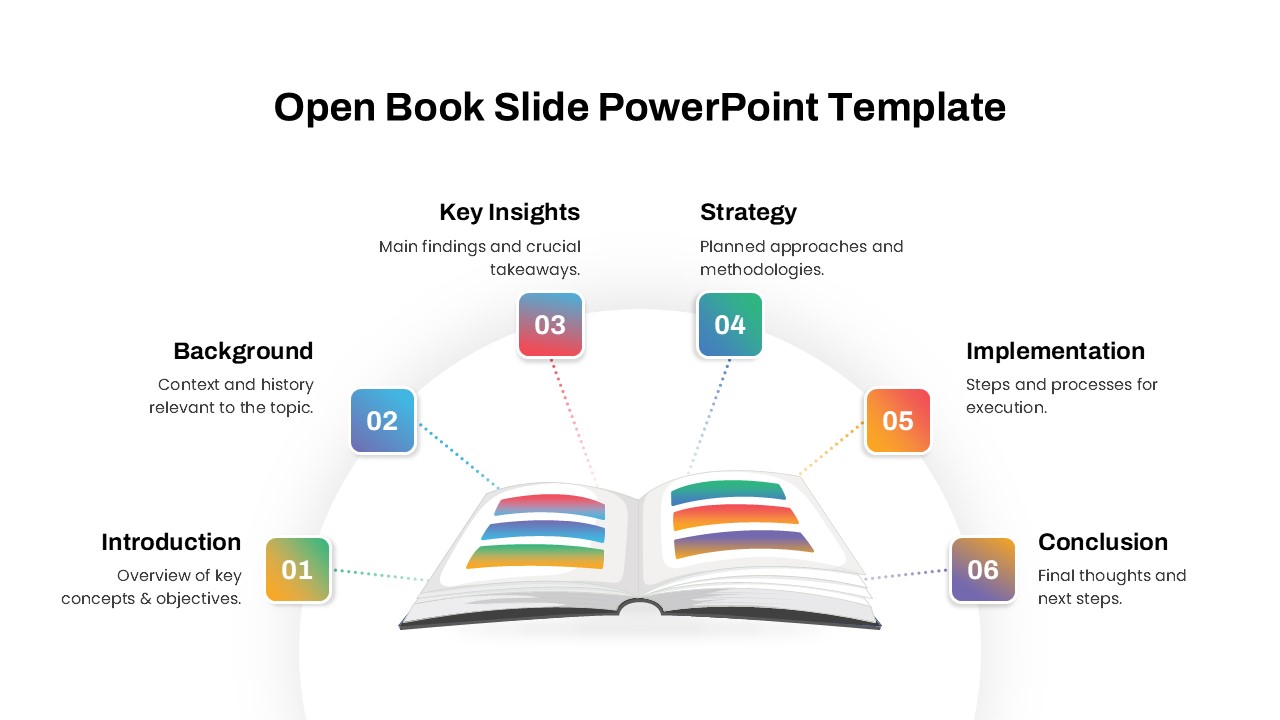
Open Book Chapter Agenda and Structure Template for PowerPoint & Google Slides
Infographics
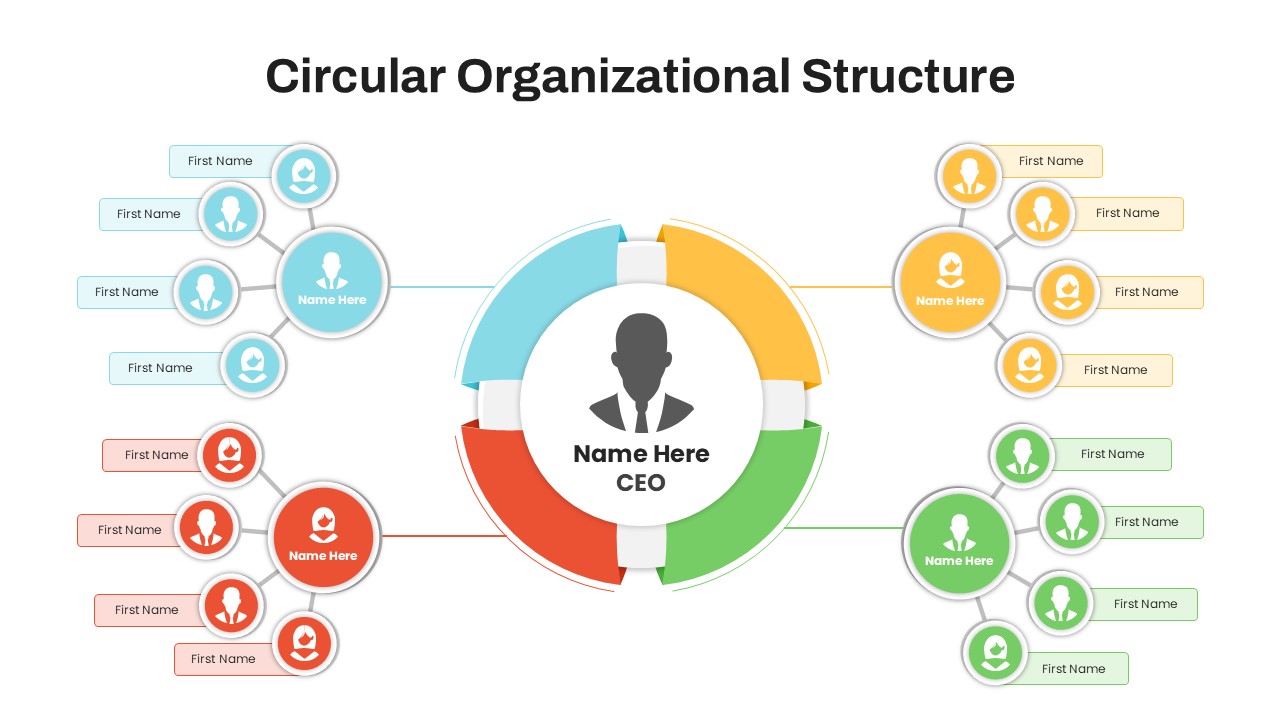
Circular Organizational Structure Template for PowerPoint & Google Slides
Org Chart
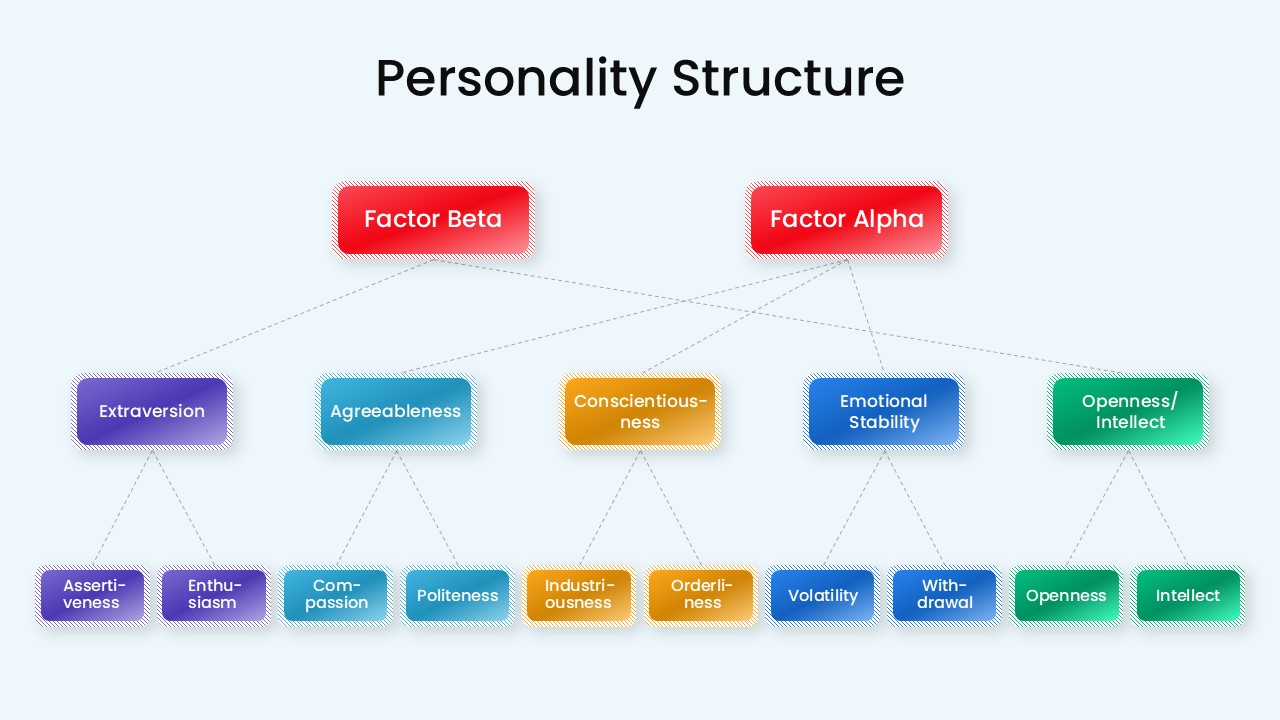
Personality Structure Hierarchy Diagram Template for PowerPoint & Google Slides
Org Chart
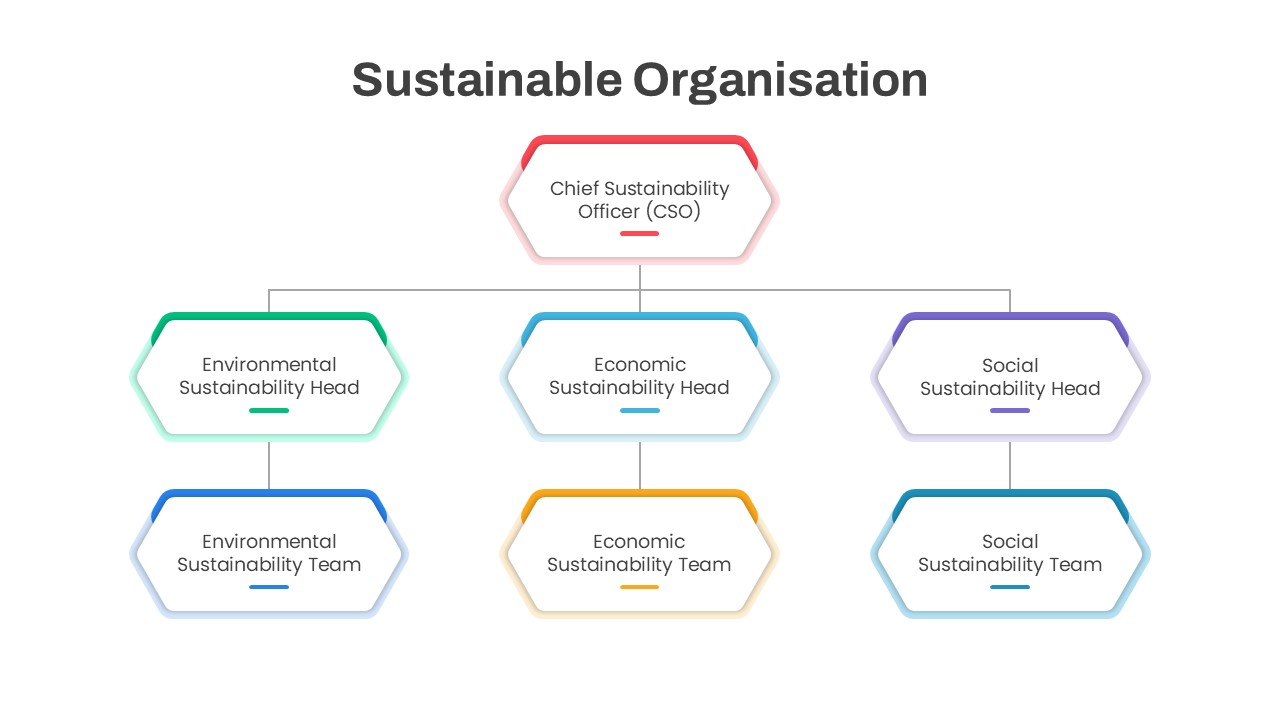
Sustainable Organisation Structure template for PowerPoint & Google Slides
Business
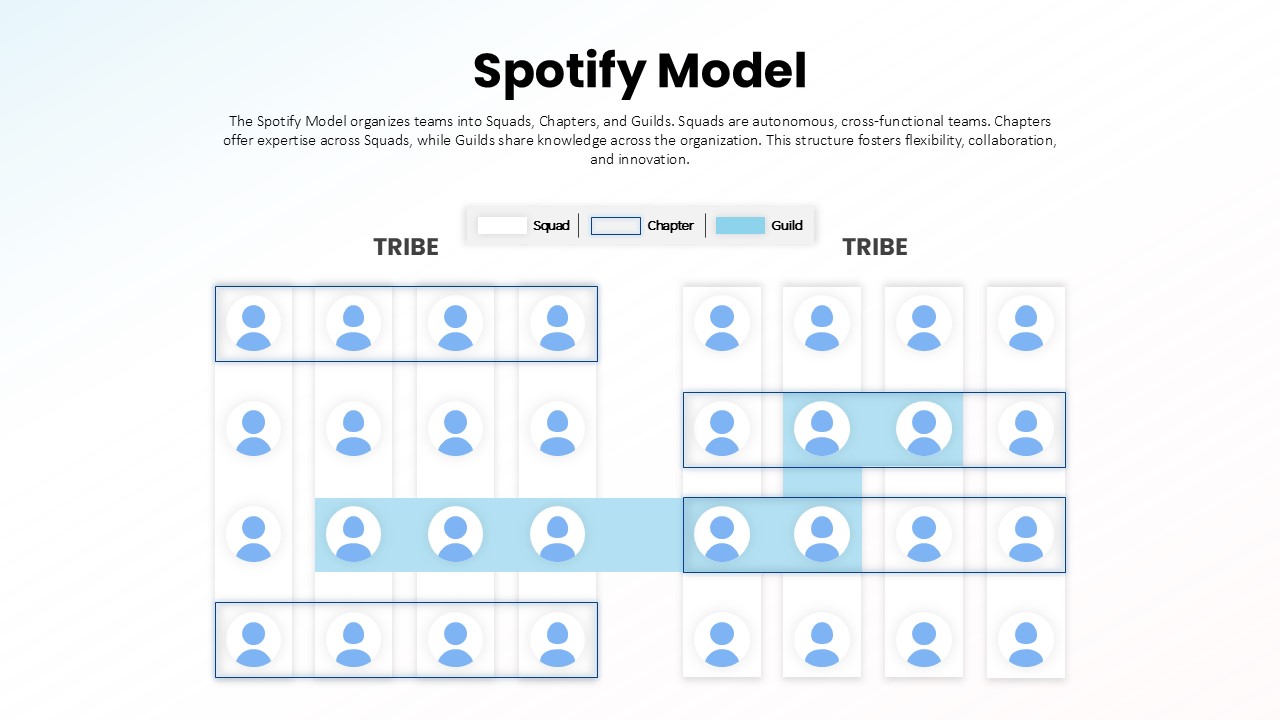
Spotify Model Organizational Structure template for PowerPoint & Google Slides
Business Strategy
DNA Structure Infographic Template for PowerPoint & Google Slides
Health
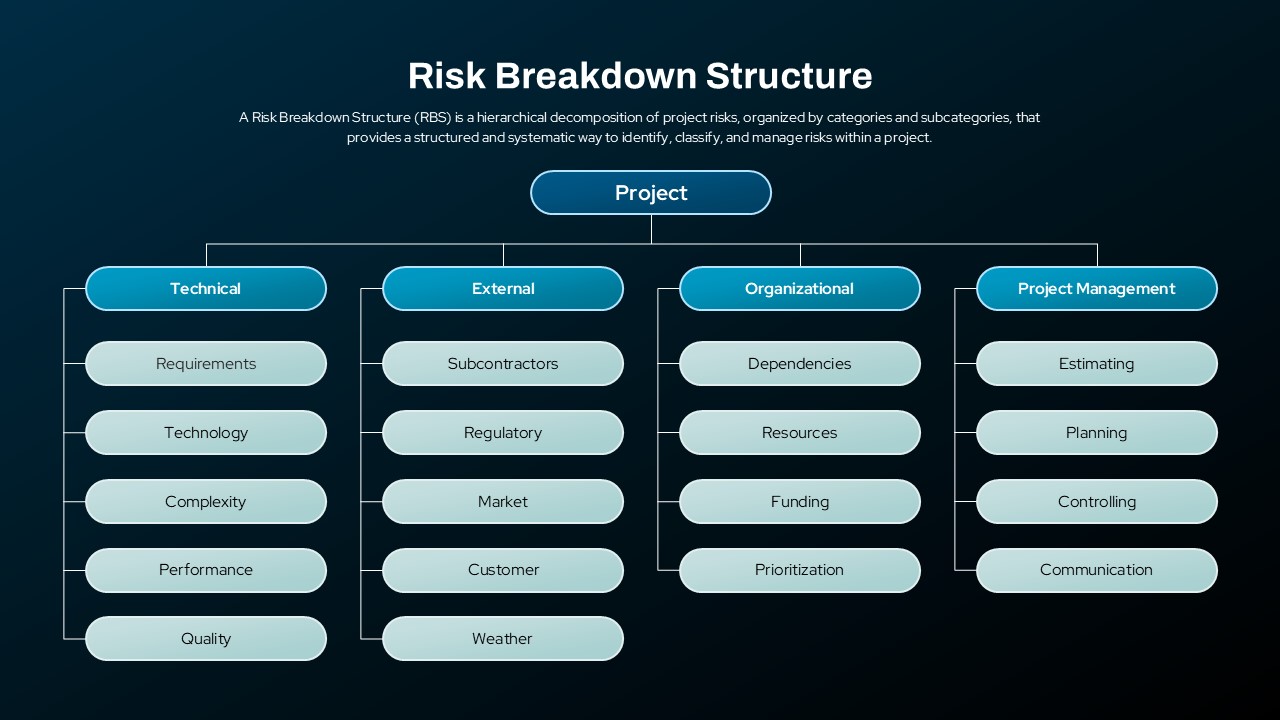
Risk Breakdown Structure Diagram Template for PowerPoint & Google Slides
Org Chart
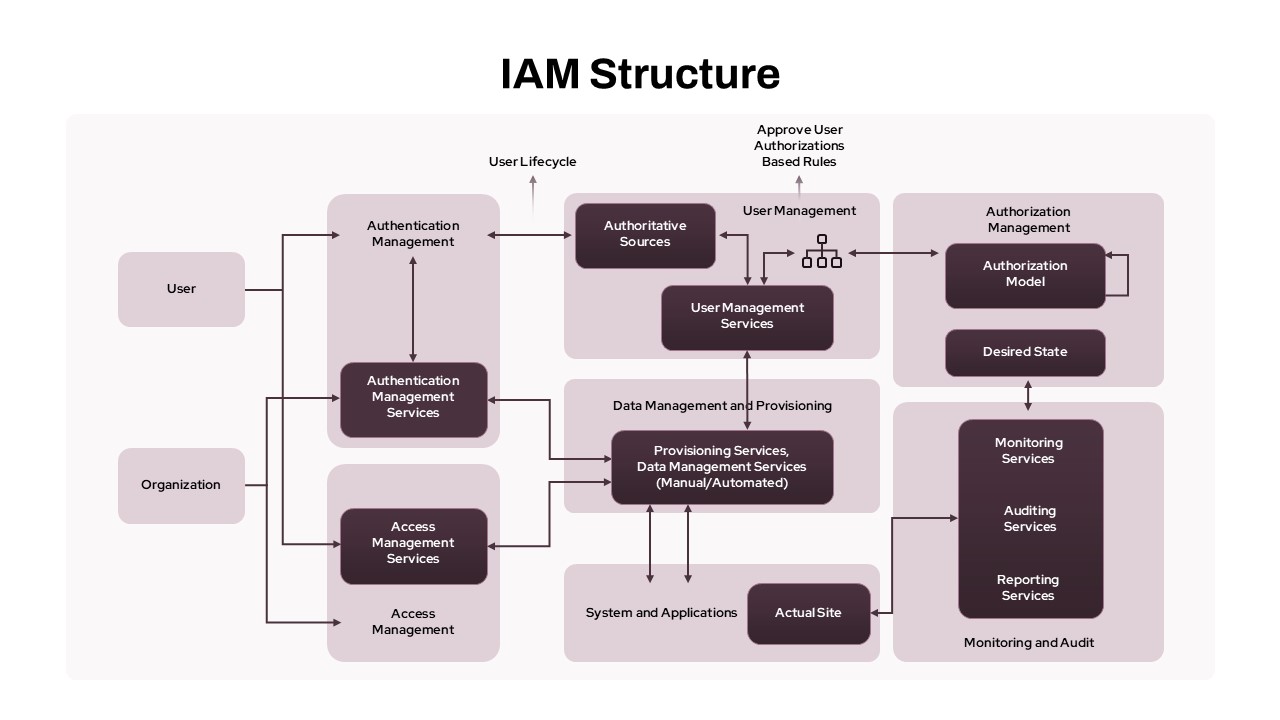
IAM Access Management Structure Diagram Template for PowerPoint & Google Slides
Flow Charts
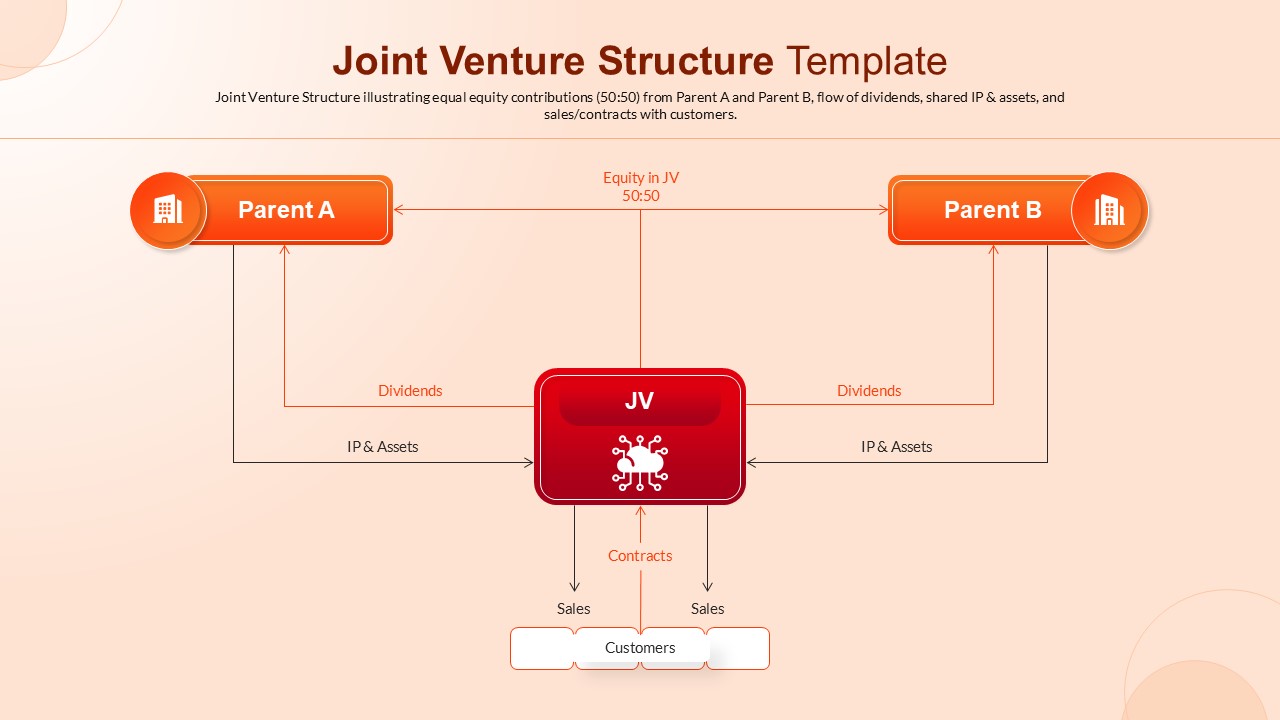
Joint Venture Structure Diagram Template for PowerPoint & Google Slides
Flow Charts