


PowerPoint Charts and Graphs for your Presentation
![]() Filter
Filter
Filter
-

Weekly Update PowerPoint Template
PowerPoint Charts
-
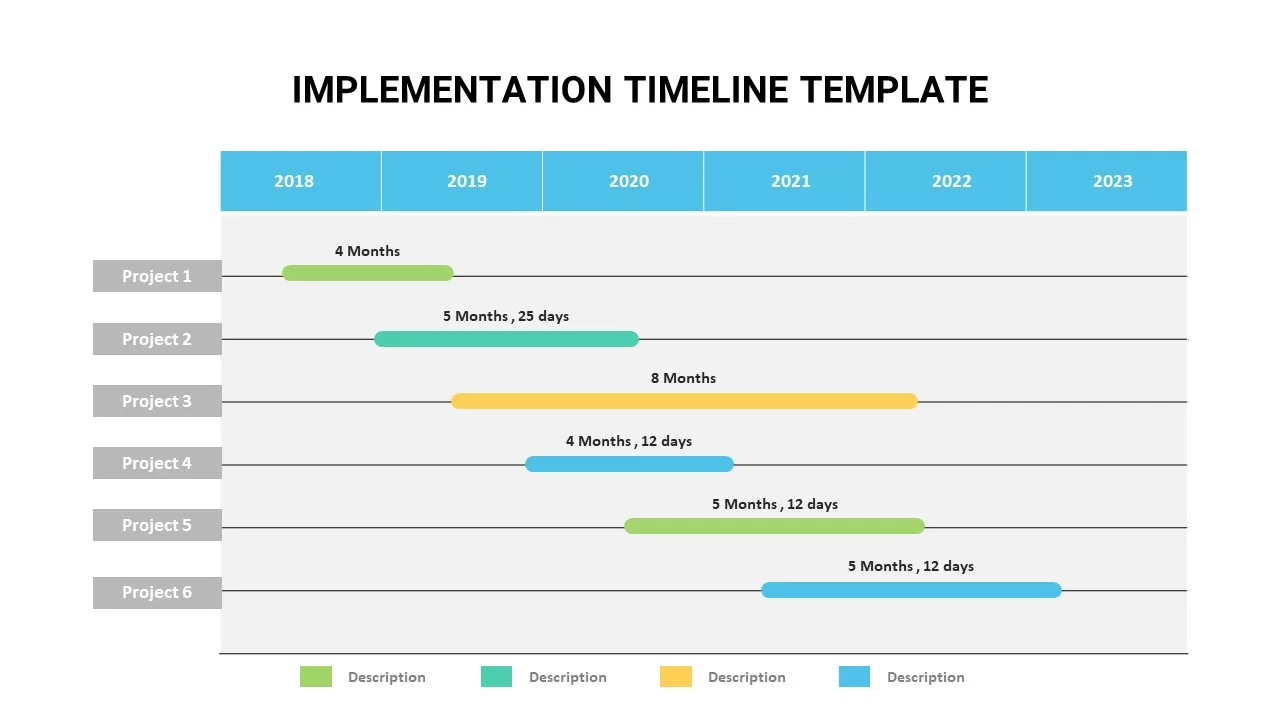
Animated Implementation Timeline Template
Timeline PowerPoint Template
-
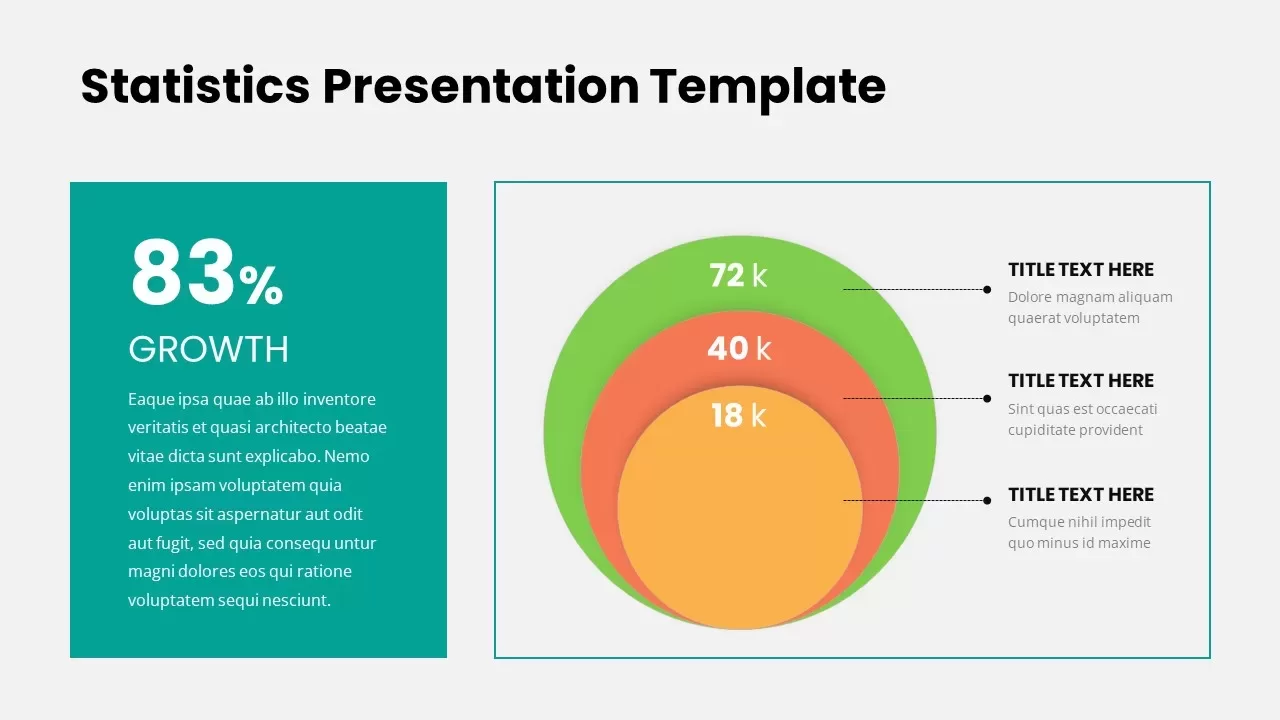
Statistics Presentation Template
Infographic
-

KPI Dashboard Infographic
Infographic
-

KPI Dashboard Infographics
Infographic
-
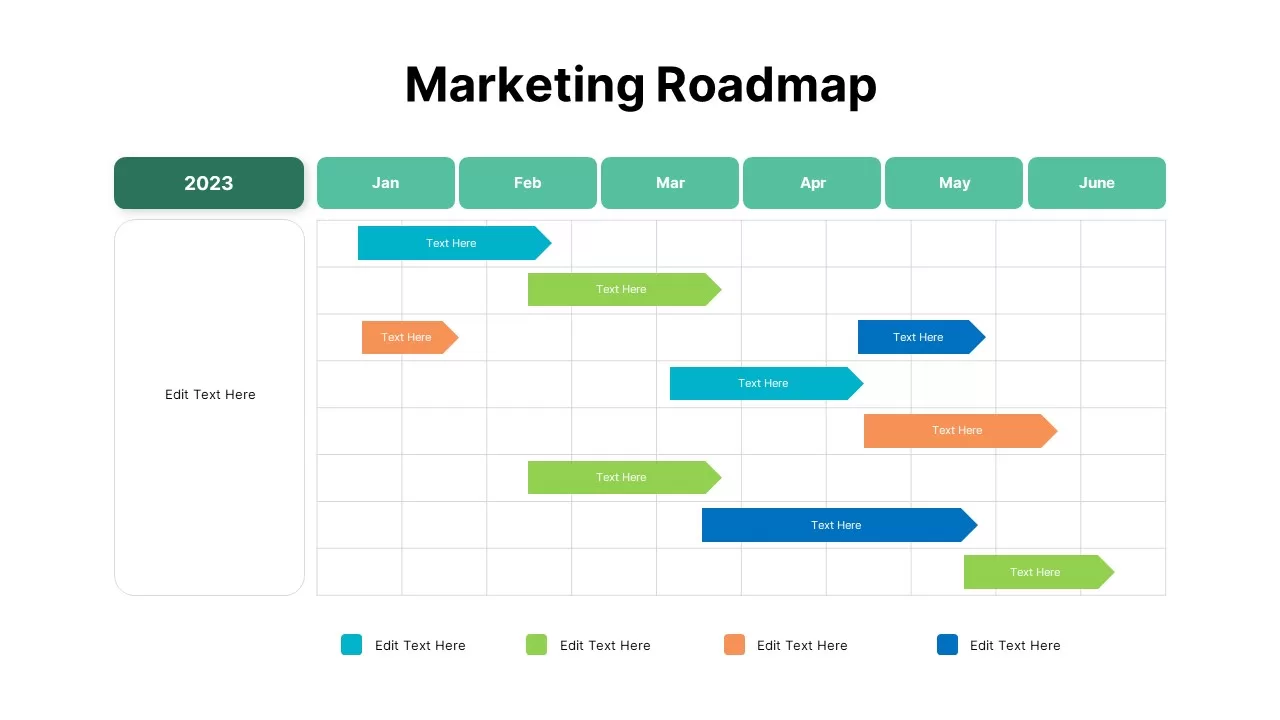
Marketing Roadmap Presentation Template
PowerPoint Charts
-
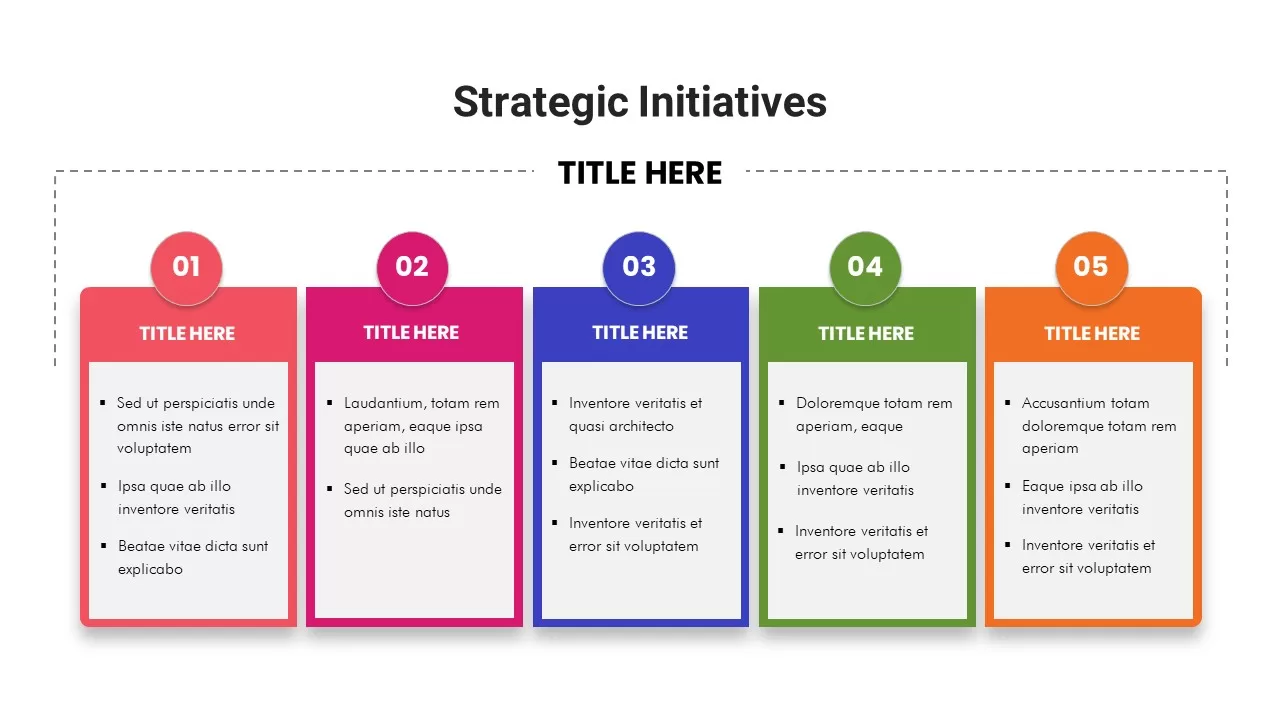
Strategic Initiatives
Infographic
-
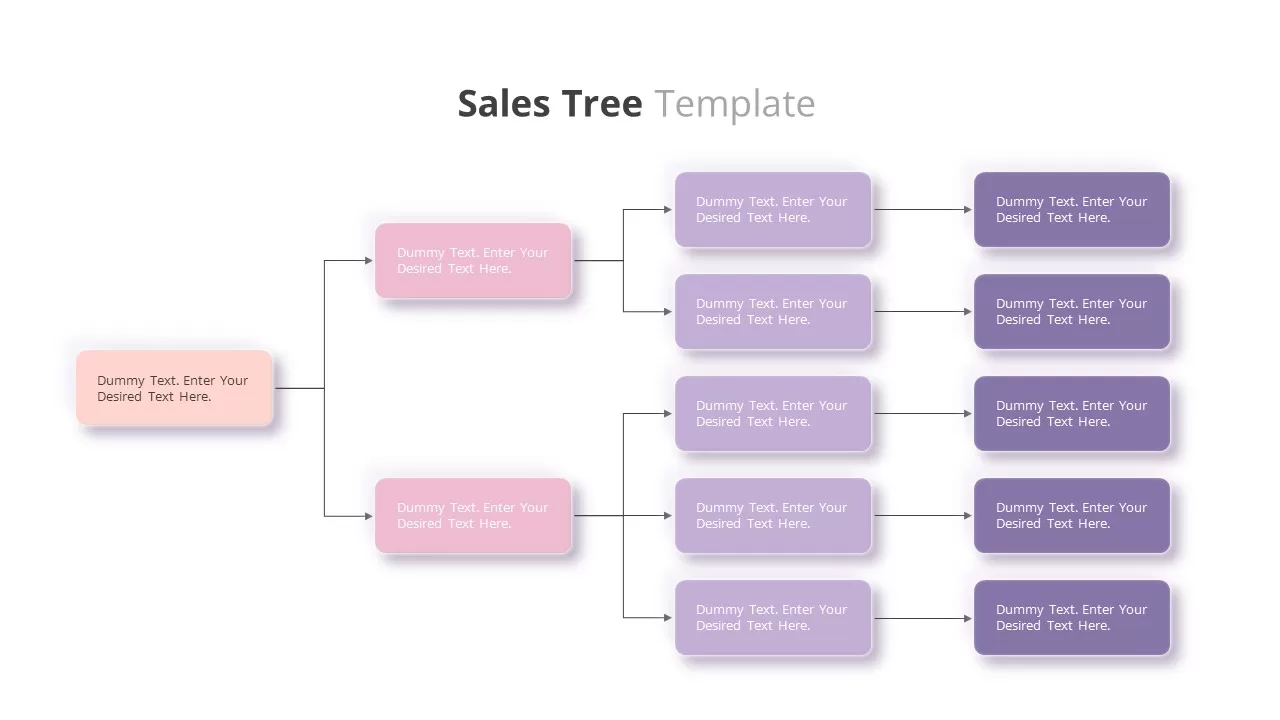
Sales Tree Template
Tree Diagrams
-
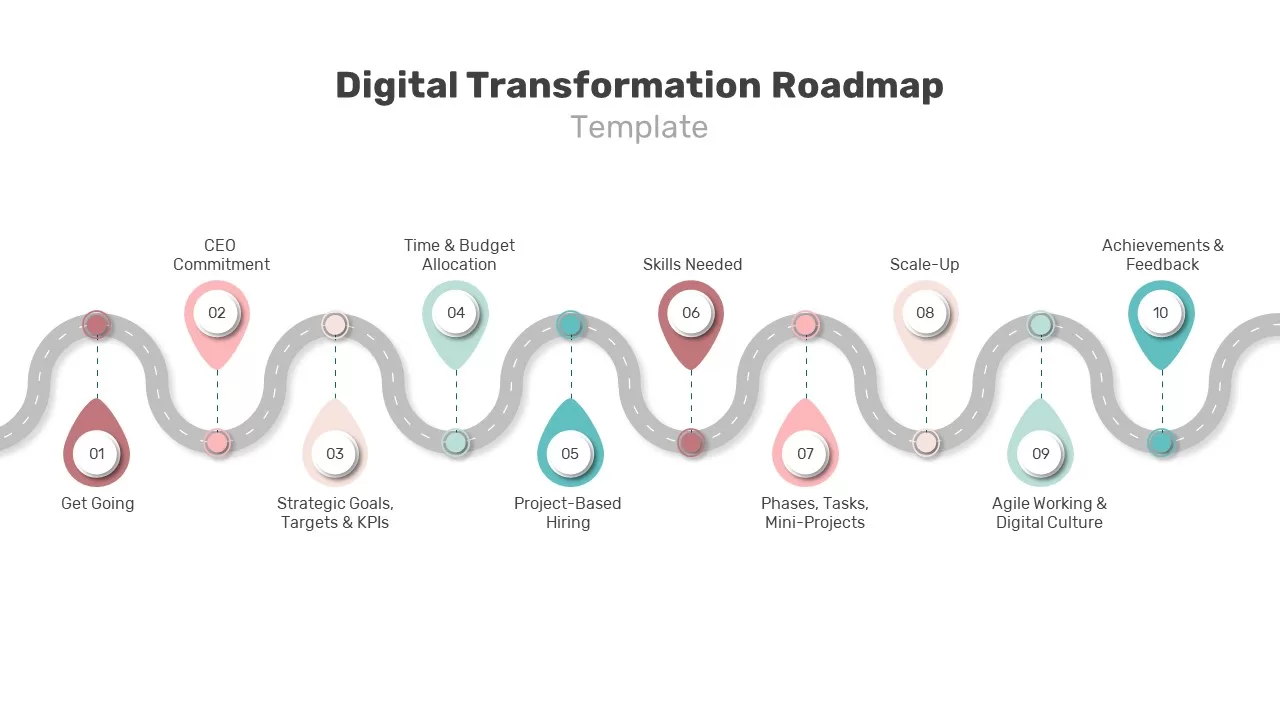
Digital Transformation Roadmap PPT
PowerPoint Charts
-
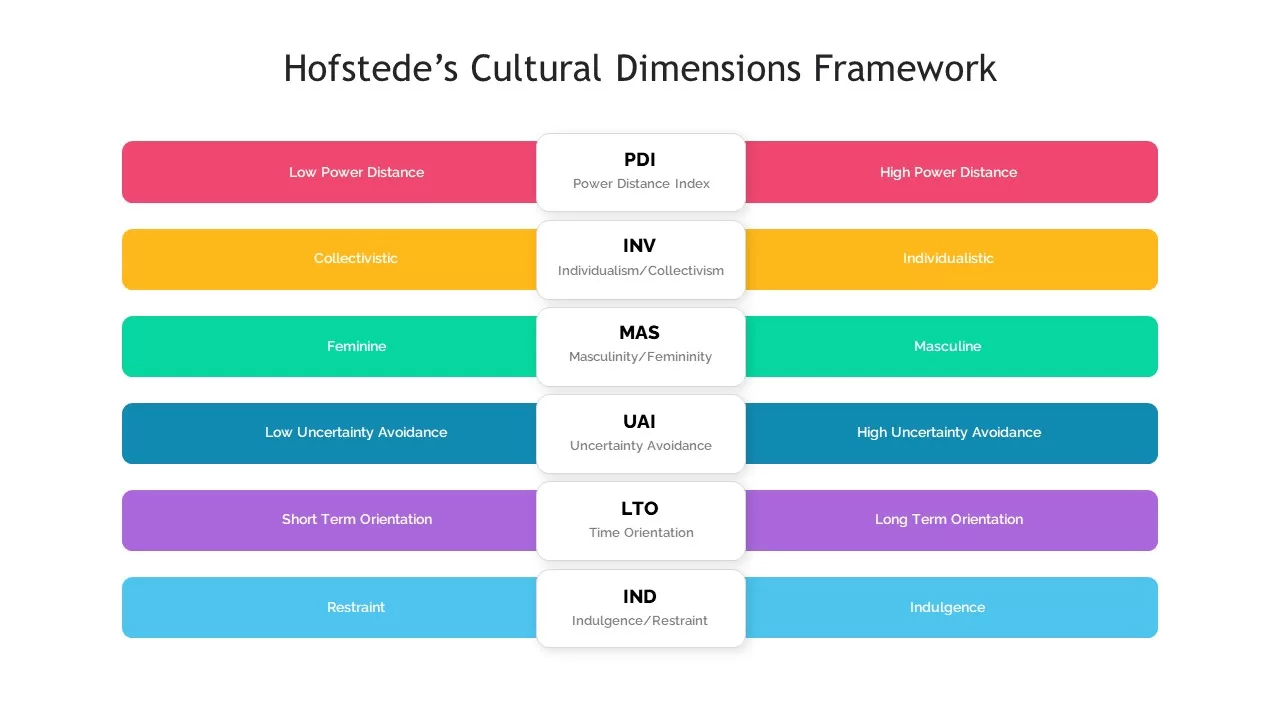
Hofstede’s Cultural Dimensions Framework
Diagrams
-

Before and After Slides
PowerPoint Charts
-
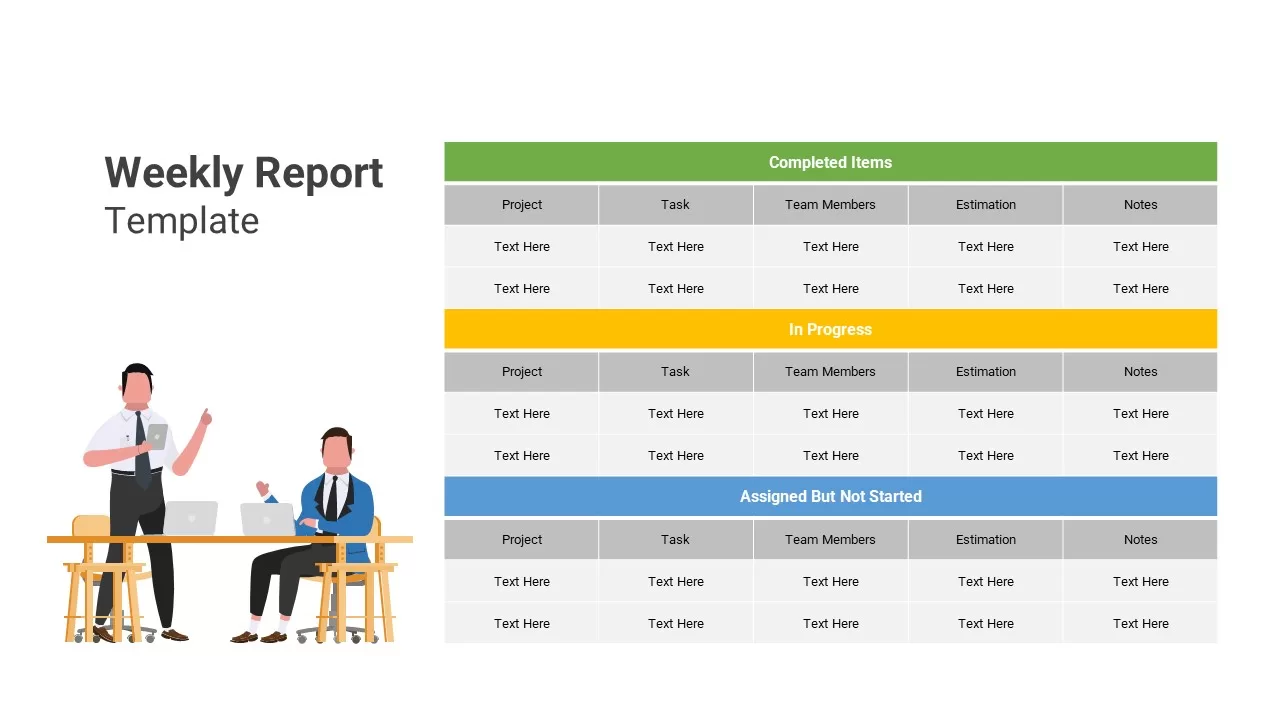
Weekly Report Template
PowerPoint Charts
-
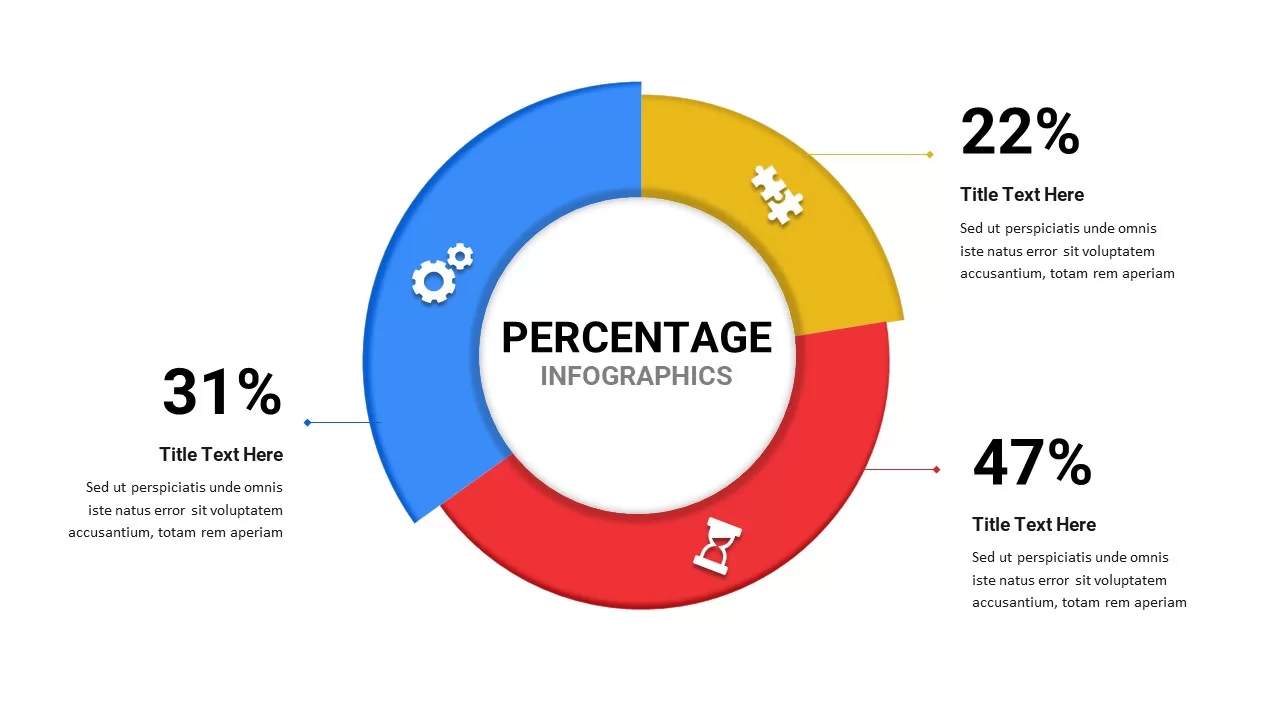
Percentage Infographics Free
Infographic
Free
-
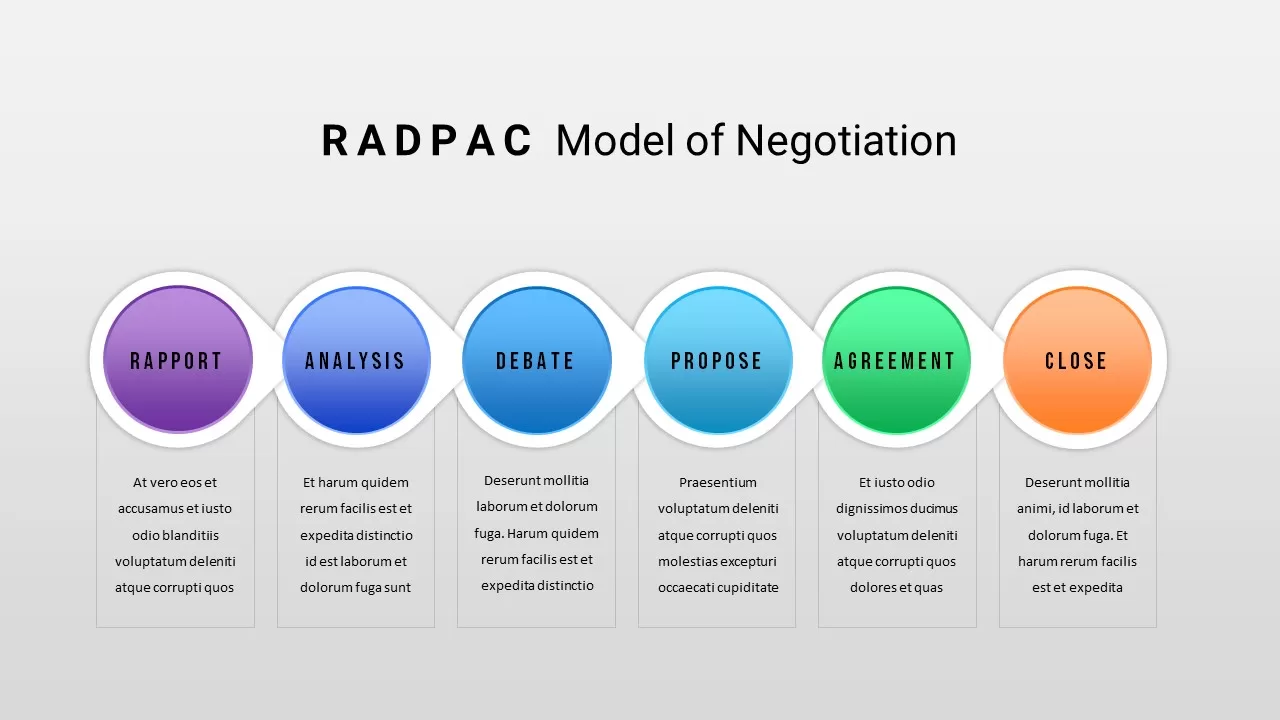
RADPAC Model of Negotiation
PowerPoint Charts
-
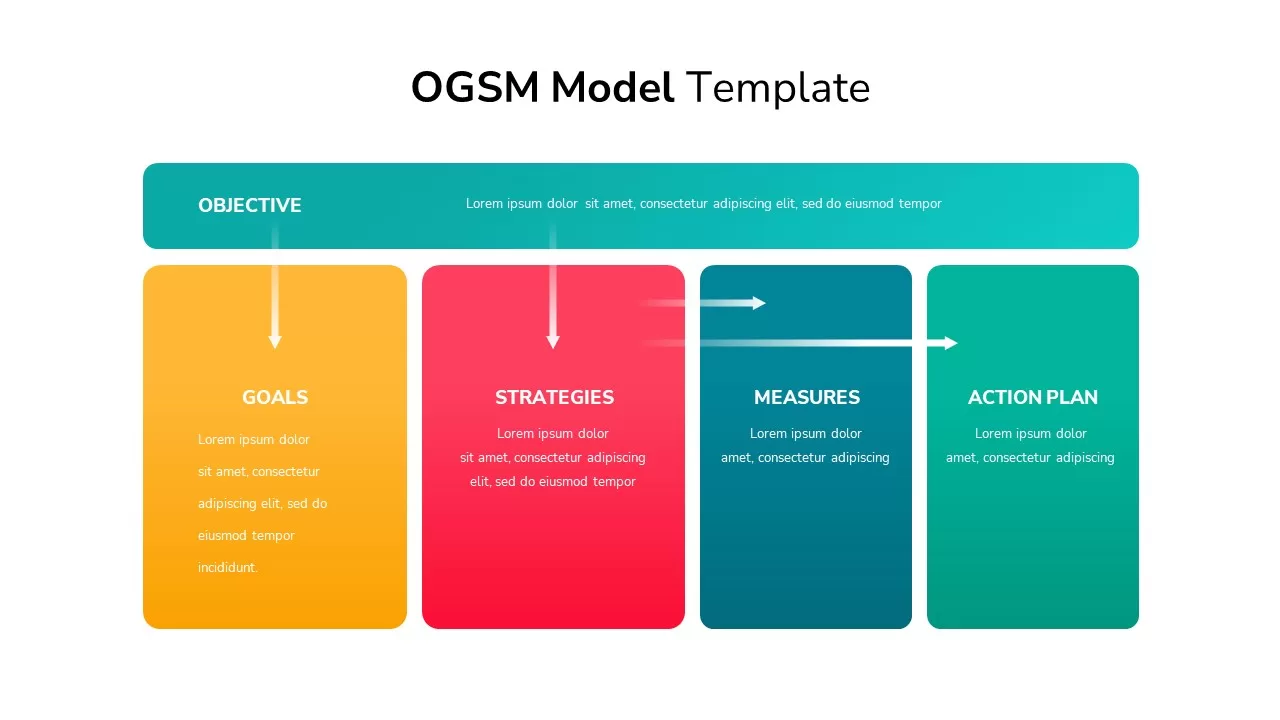
OGSM Model Template
Arrow Diagrams
-

Business Case Study PowerPoint Template
professional
-
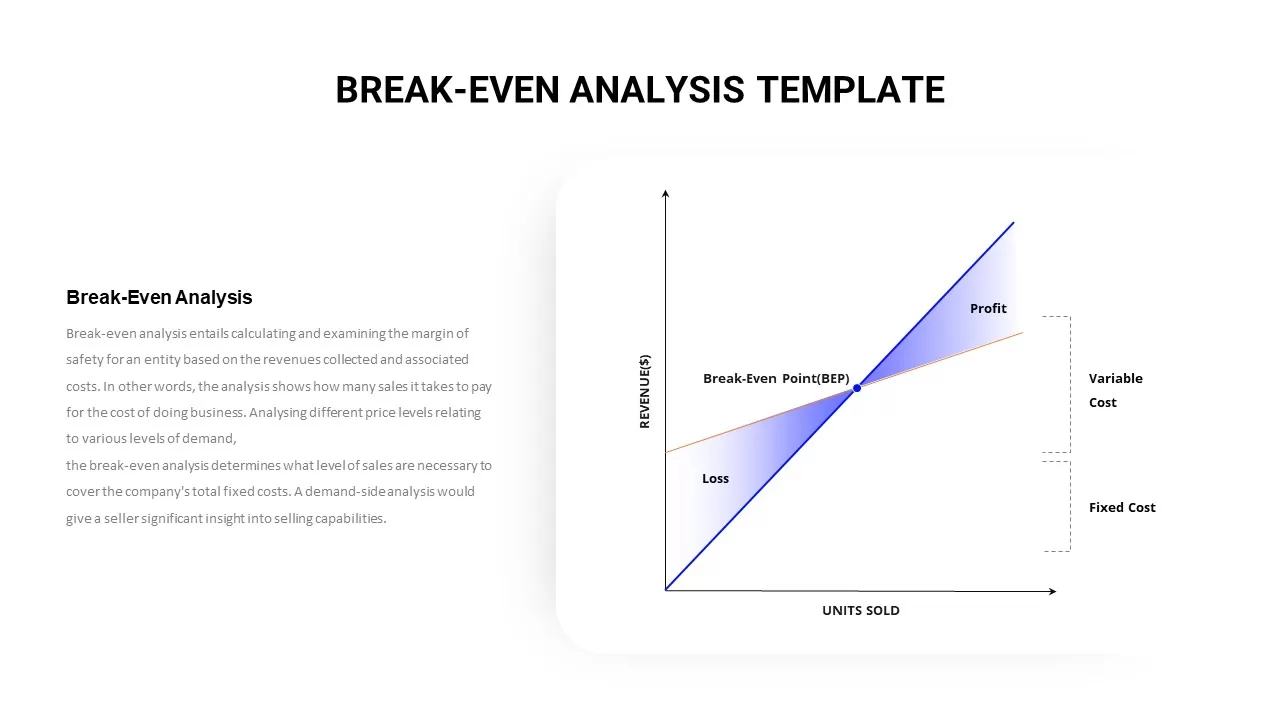
Break-Even Analysis Template
PowerPoint Charts
-
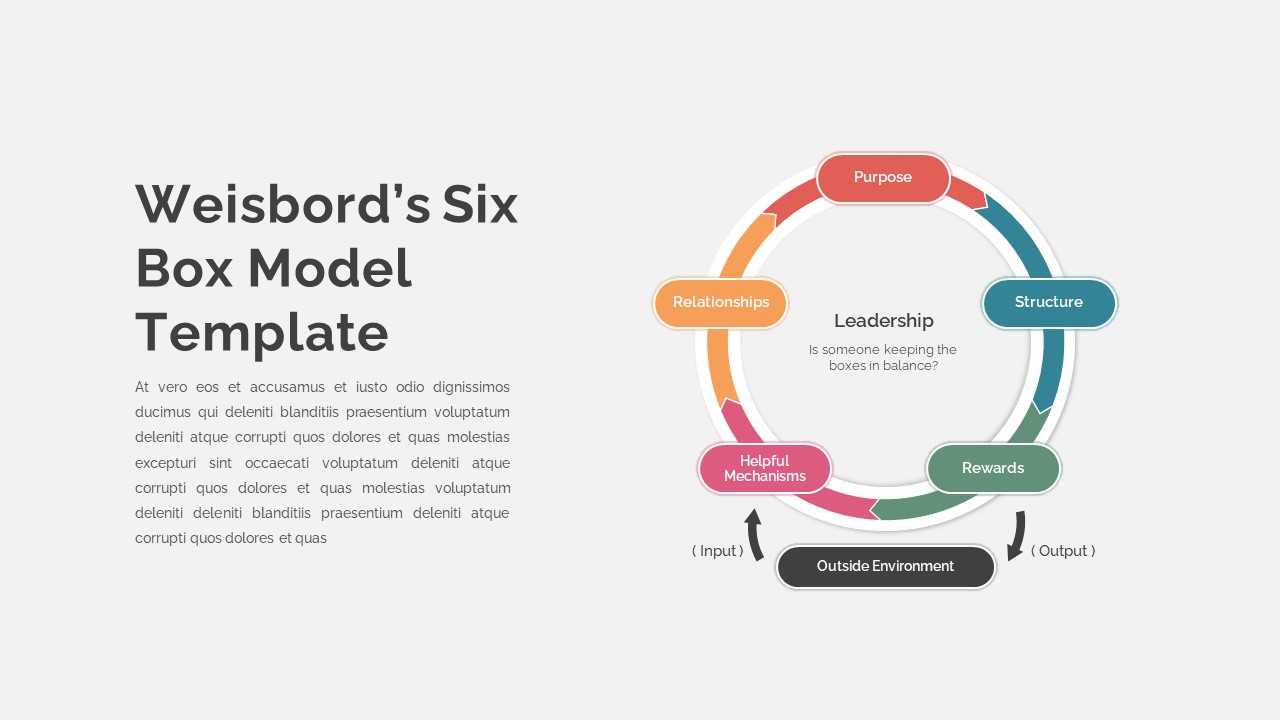
Six Box Model PowerPoint Template
Circular Diagrams
-
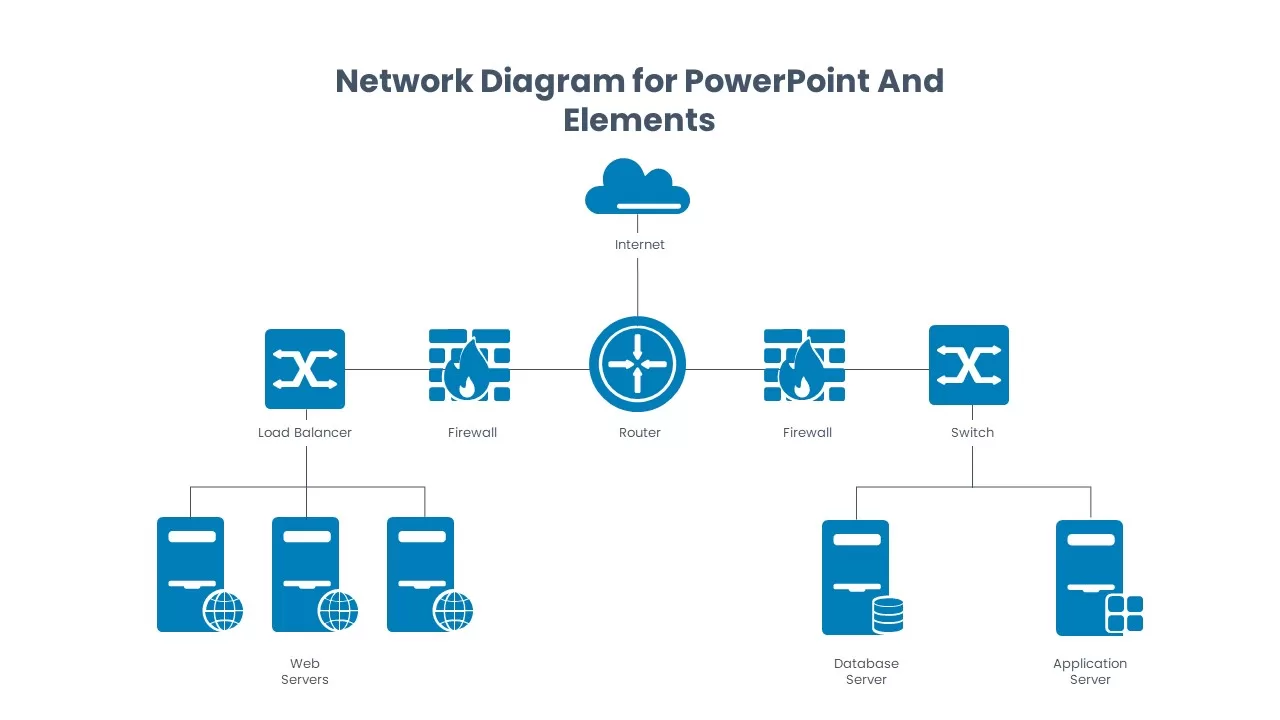
Network Diagram Template and Elements
Infographic
-
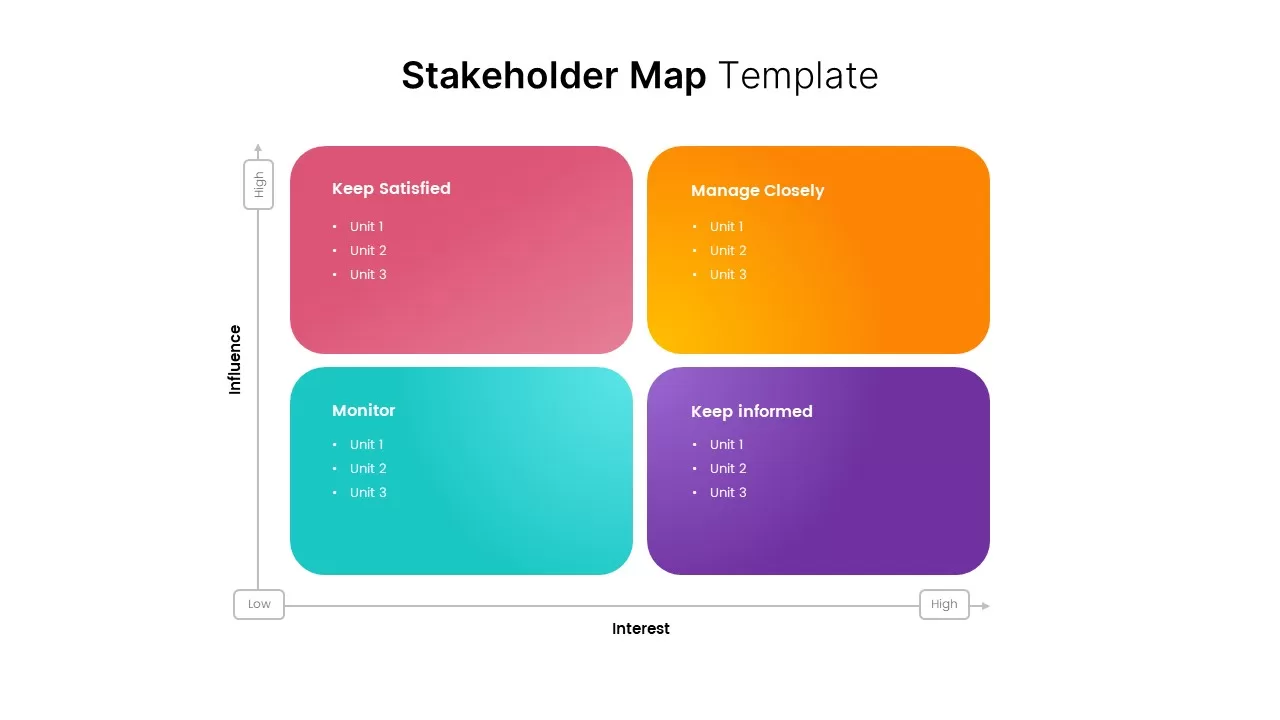
Stakeholder Mapping Template
Diagrams
-
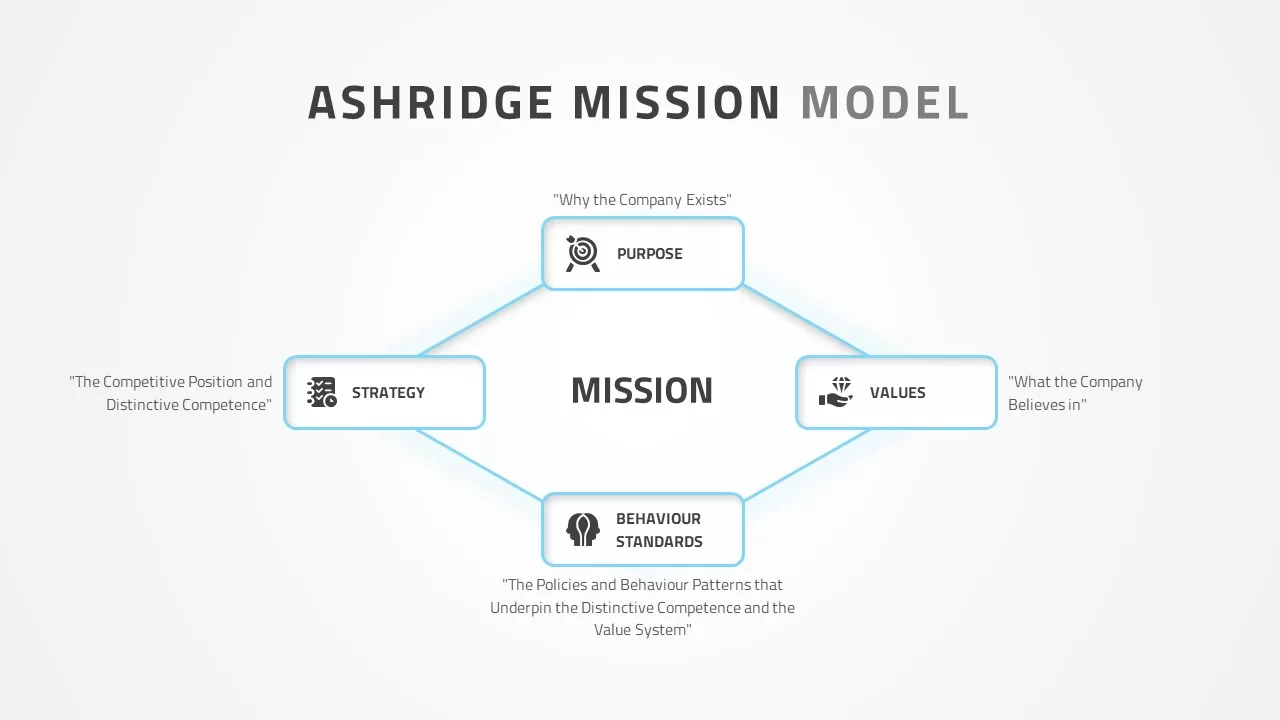
Ashridge Model
PowerPoint Charts
-
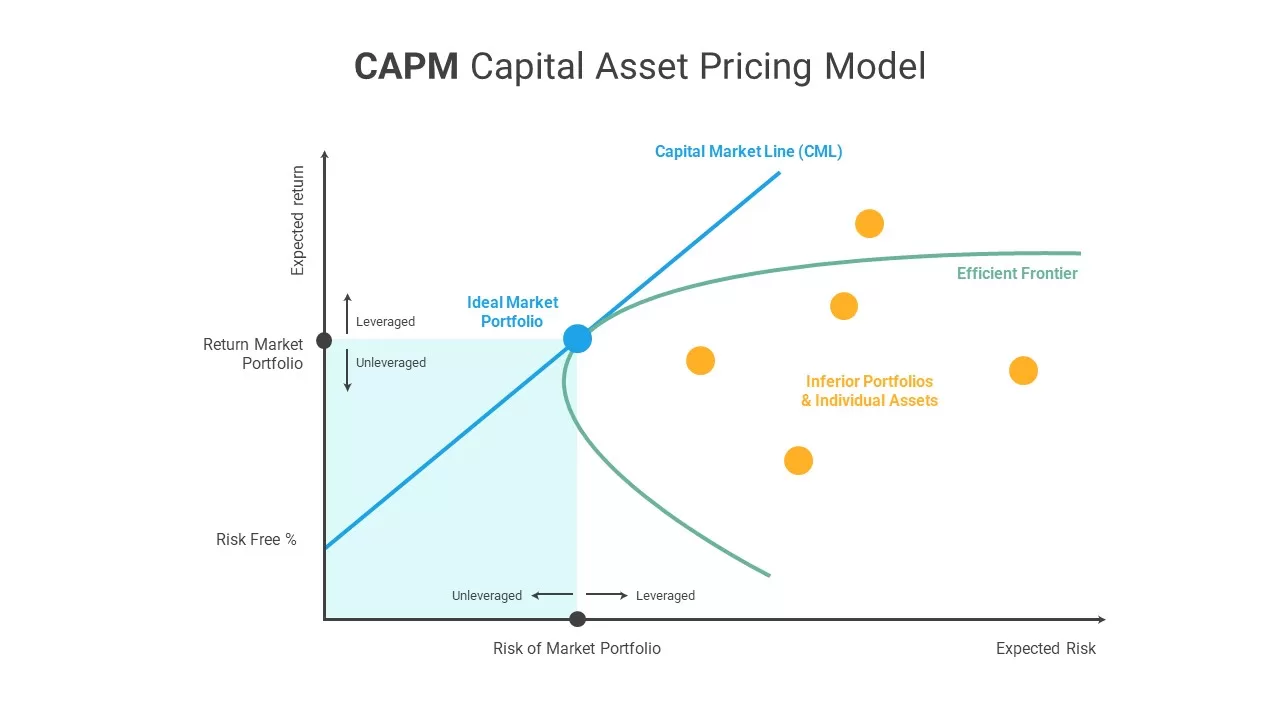
CAPM Model Template
Curves and Lines
-
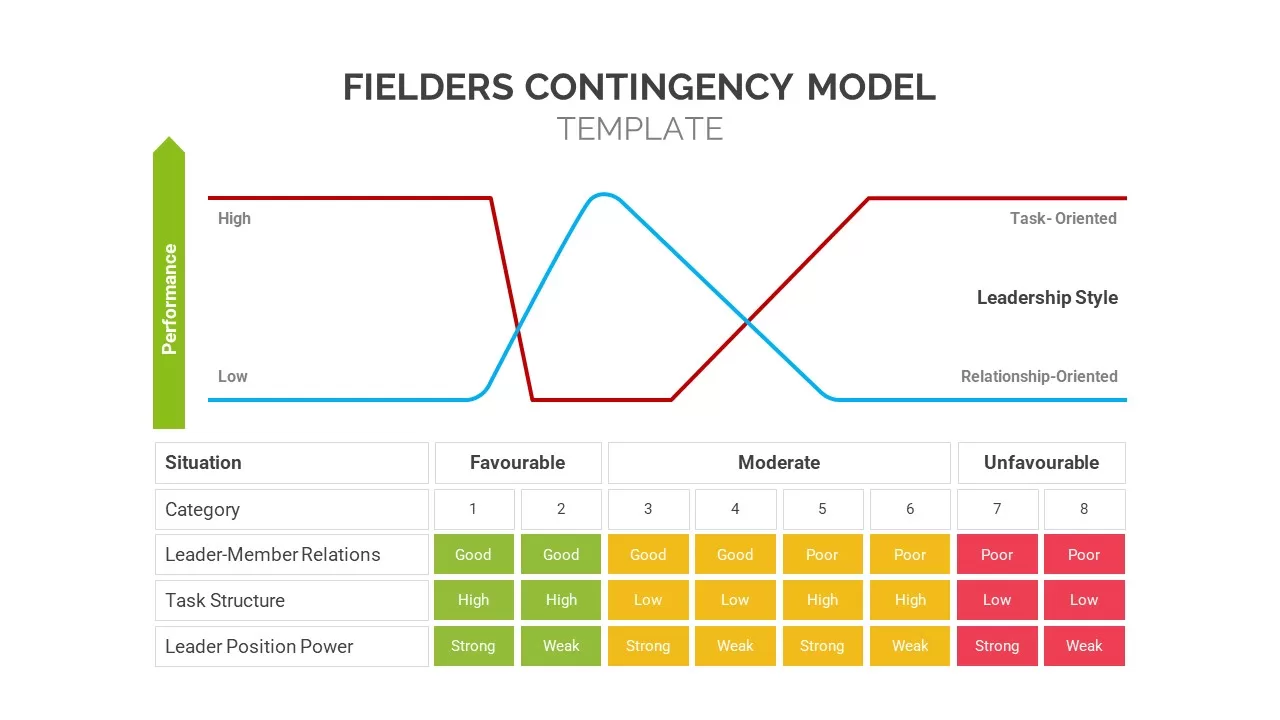
Fielders Contingency Model Template
PowerPoint Charts
-

Root Cause Analysis PowerPoint Template
Arrow Diagrams
-
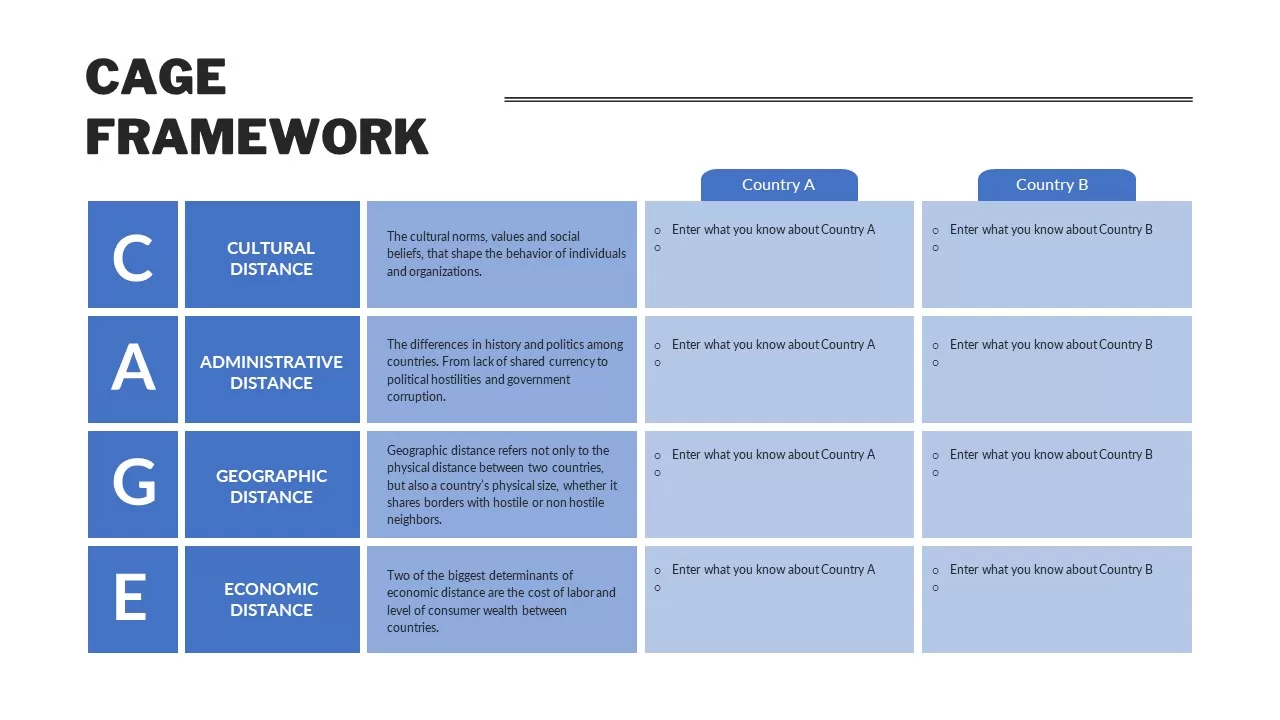
Cage Framework
PowerPoint Charts
-
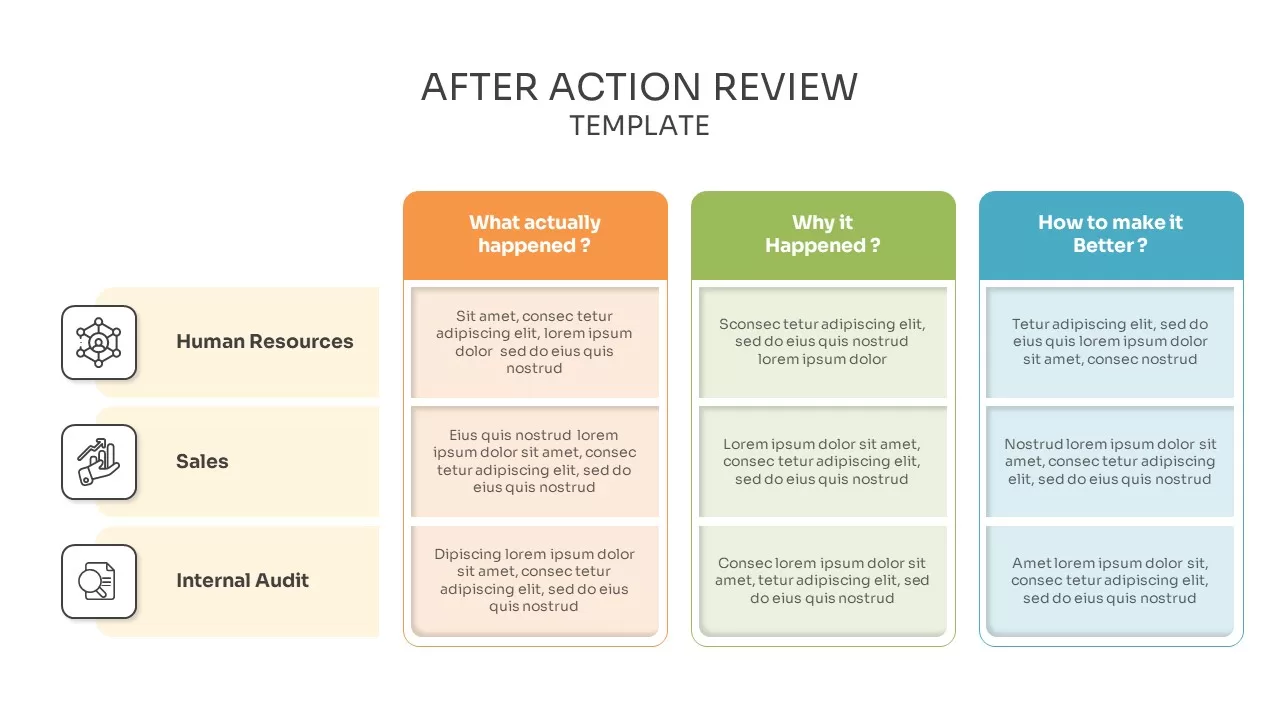
After Action Review Report Template
PowerPoint Charts
-
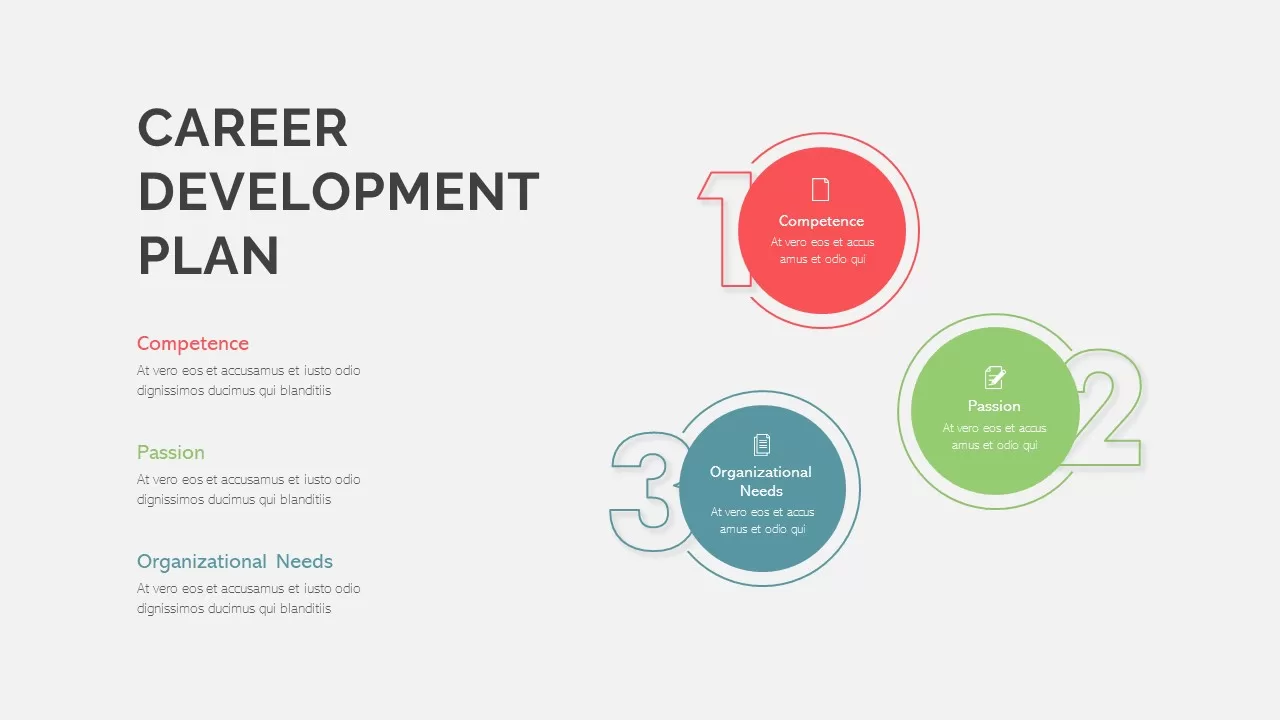
Career Development Plan Template
Circular Diagrams
-

KPI Slide for PowerPoint
Infographic
-

Risk and impact Analysis Template for Powerpoint
Infographic
-

Thesis Defense PowerPoint Template
professional
-

Recruitment Report Template
PowerPoint Charts
-

DIKW Model PowerPoint Template
PowerPoint Charts
-
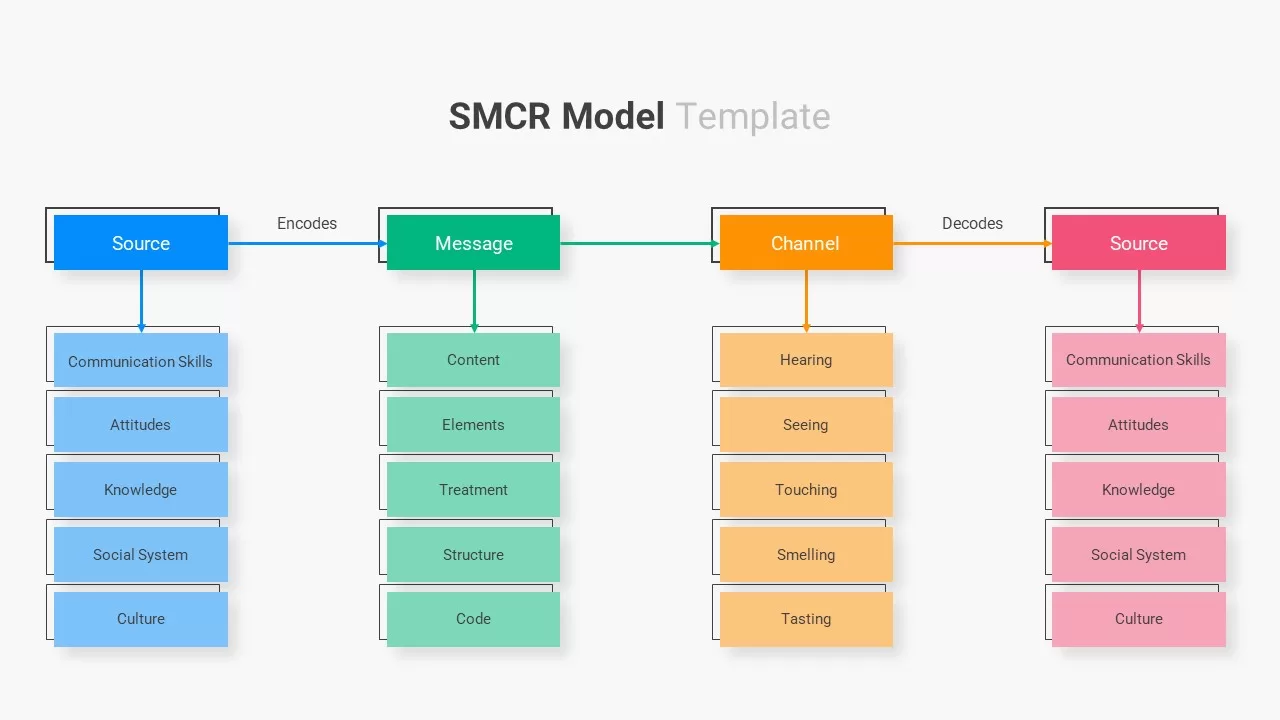
SMCR Model Template
PowerPoint Charts
-
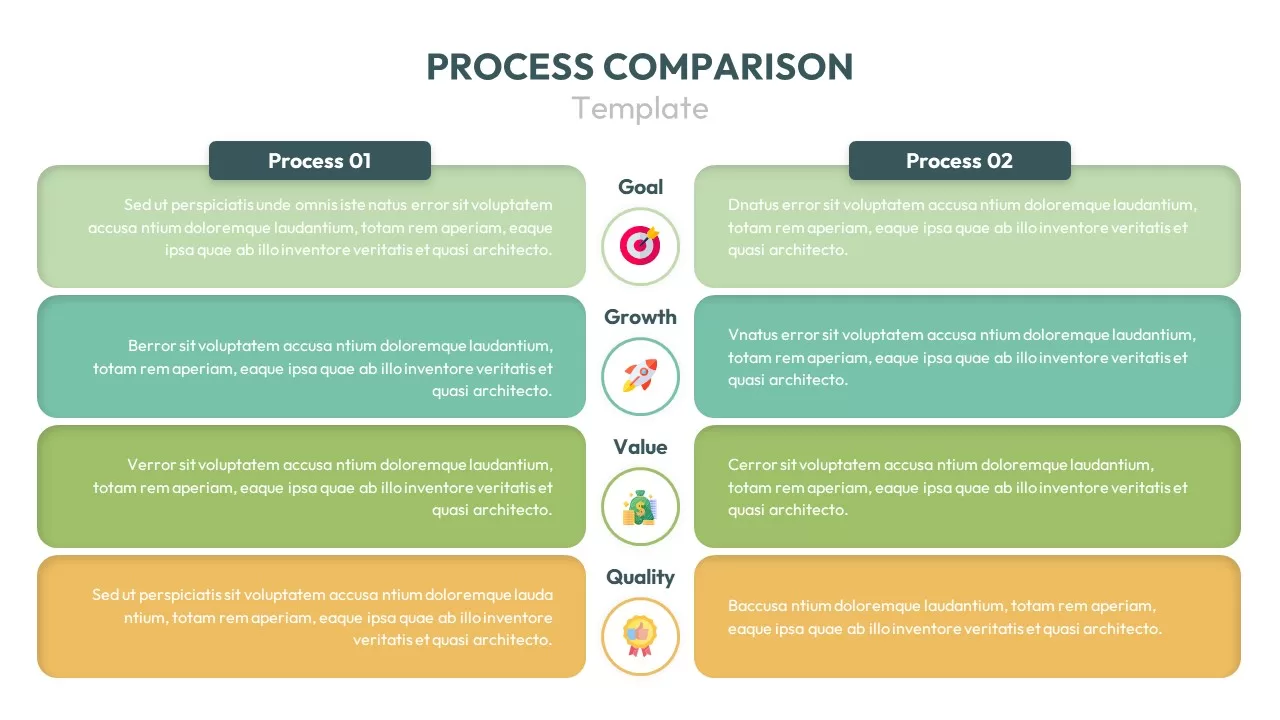
Process Comparison Chart
PowerPoint Charts
-
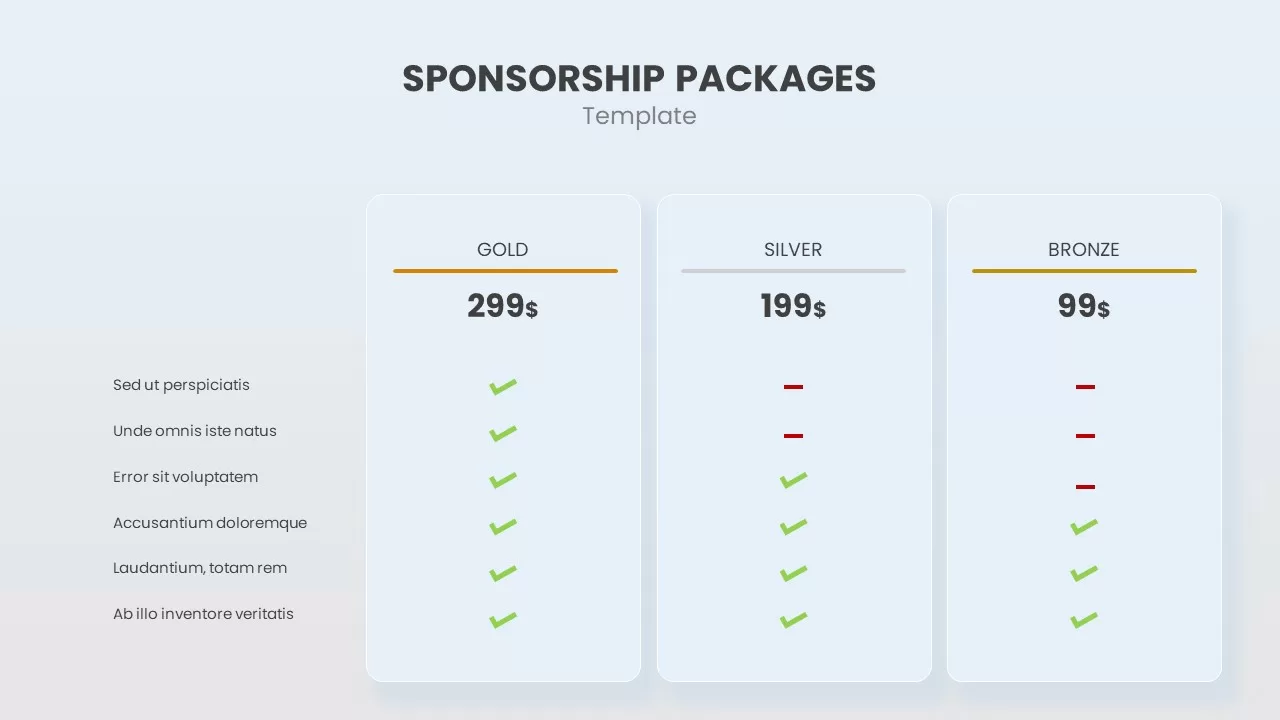
Sponsorship Tier Template
PowerPoint Charts