Red Brain Mind Map Diagram Template for PowerPoint & Google Slides
Description
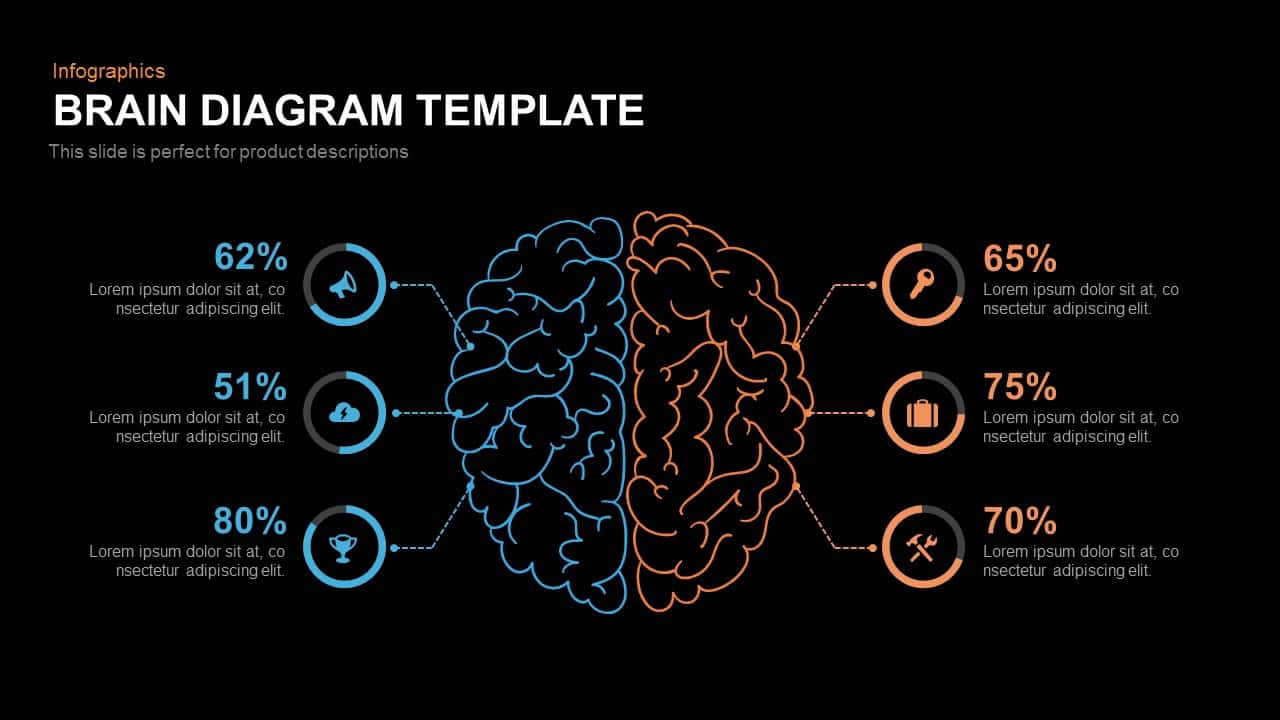
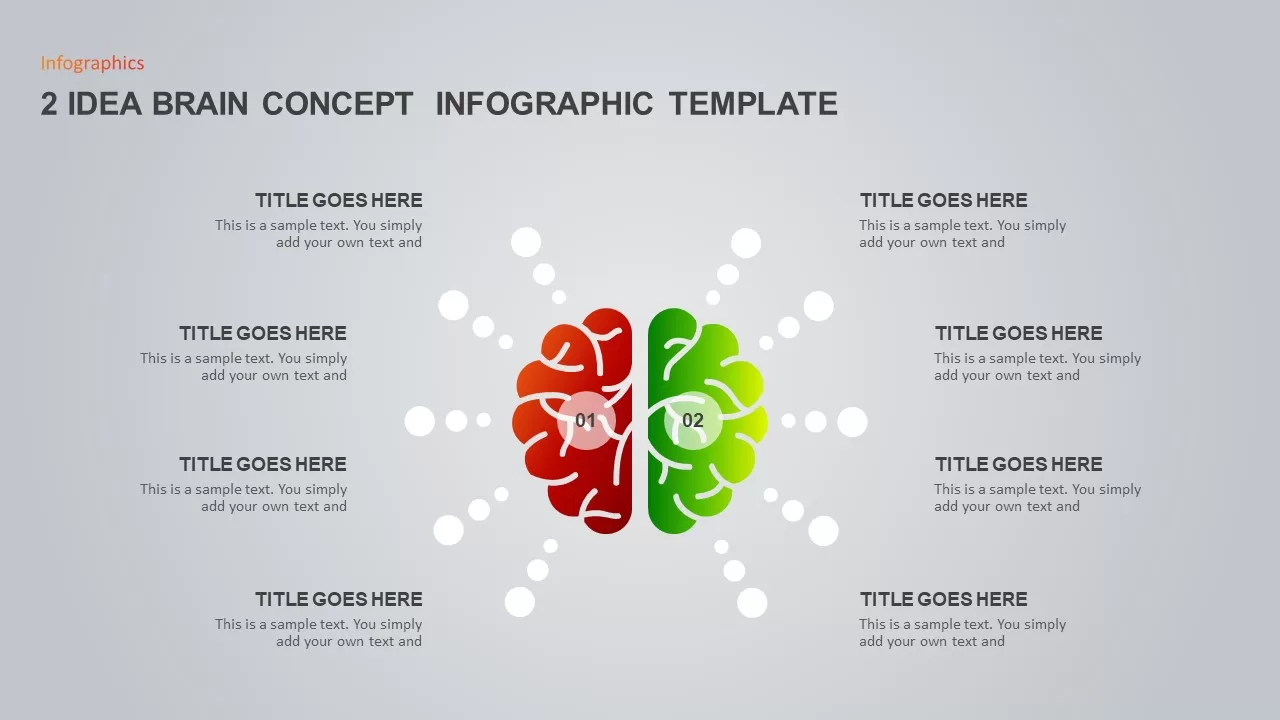
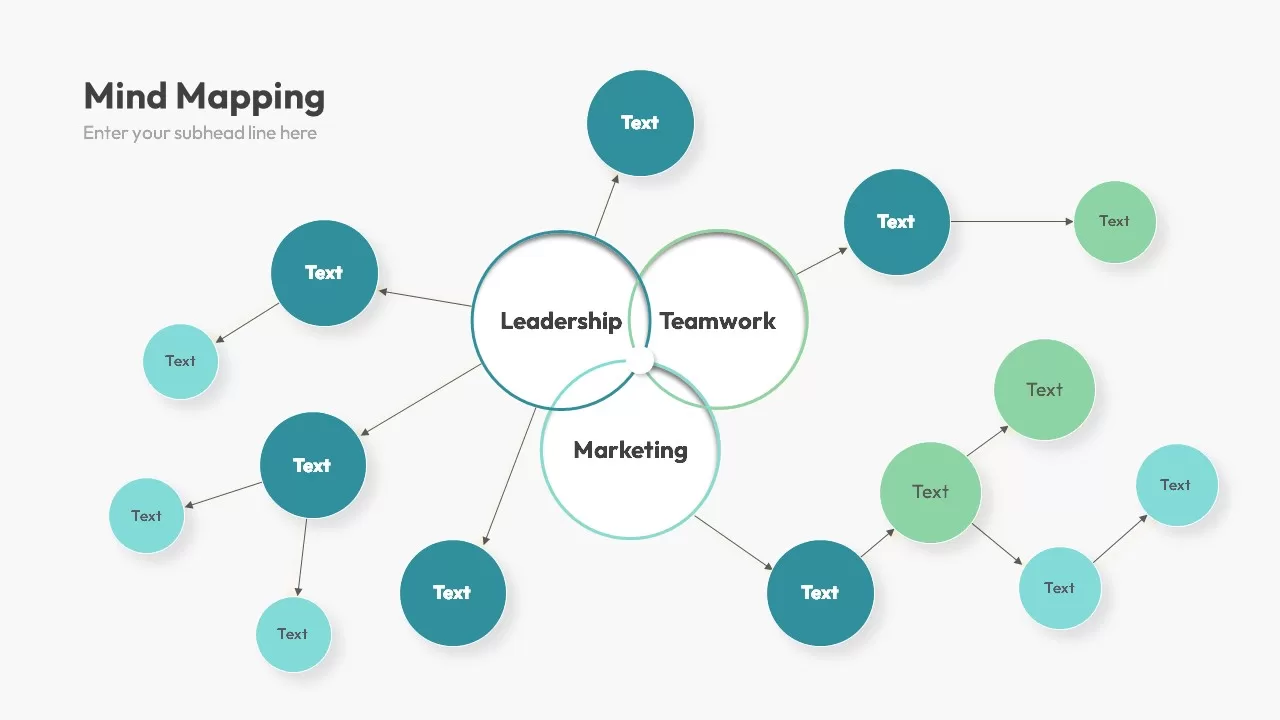
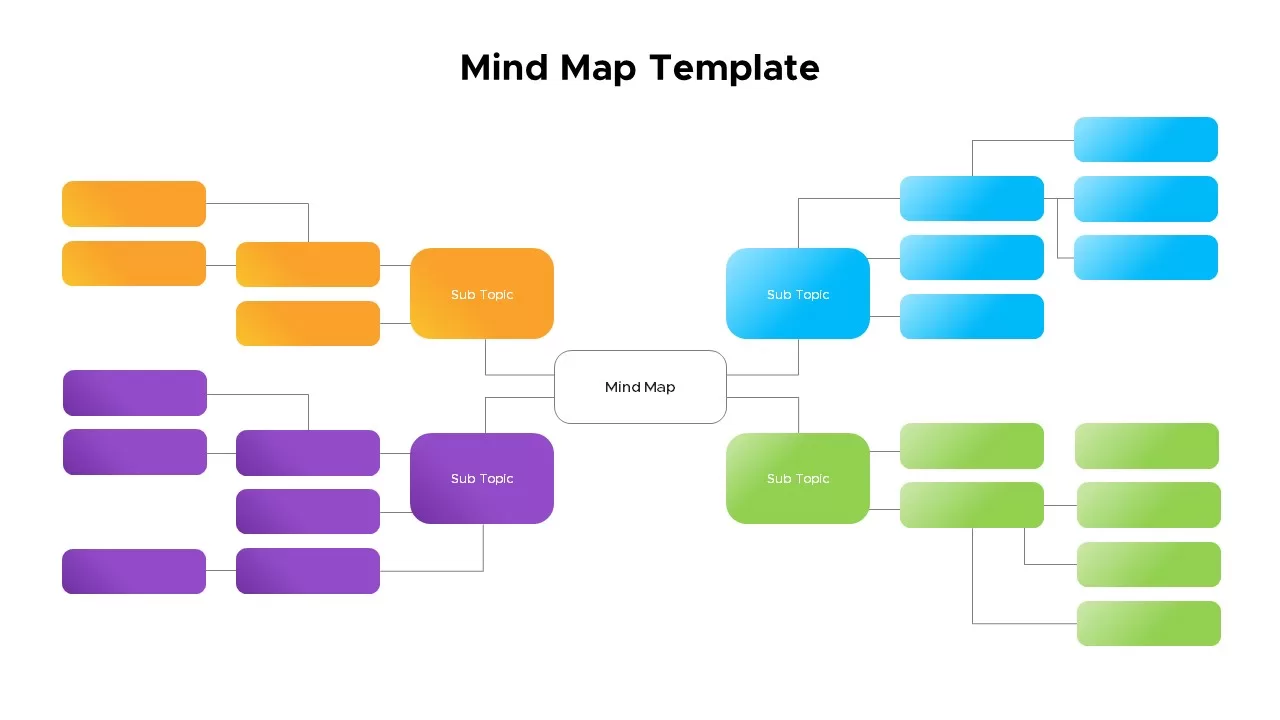
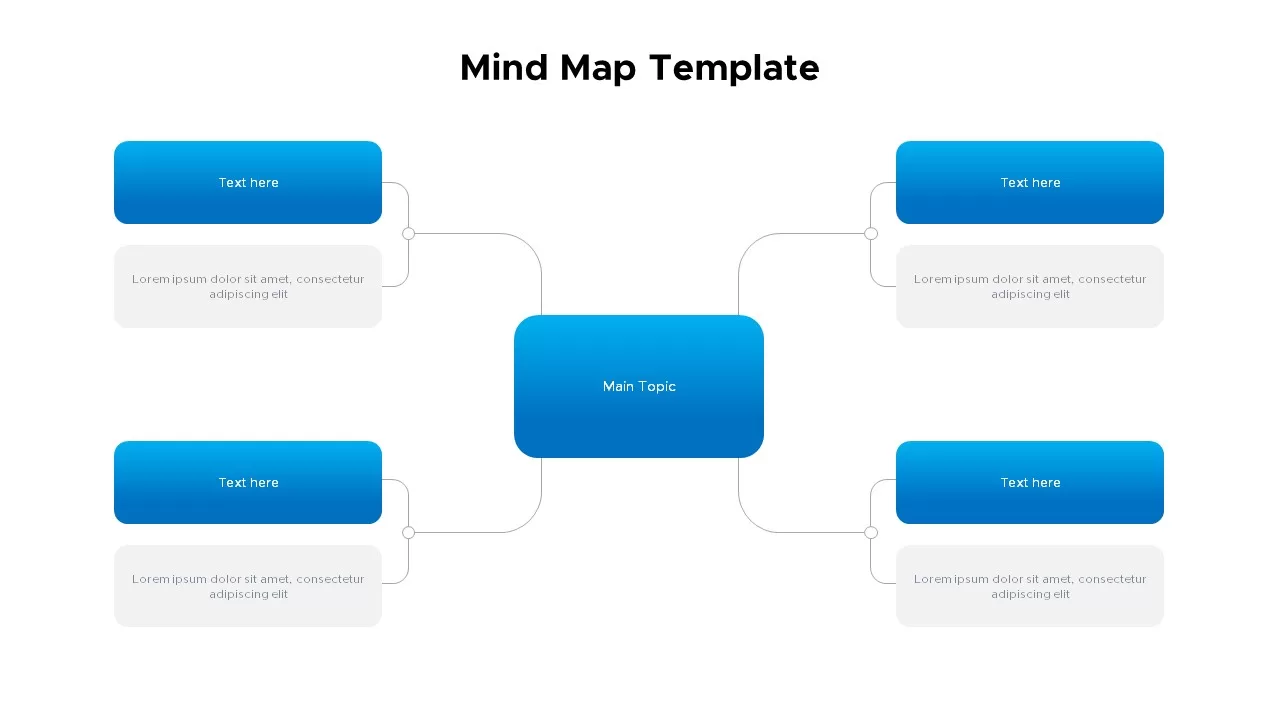
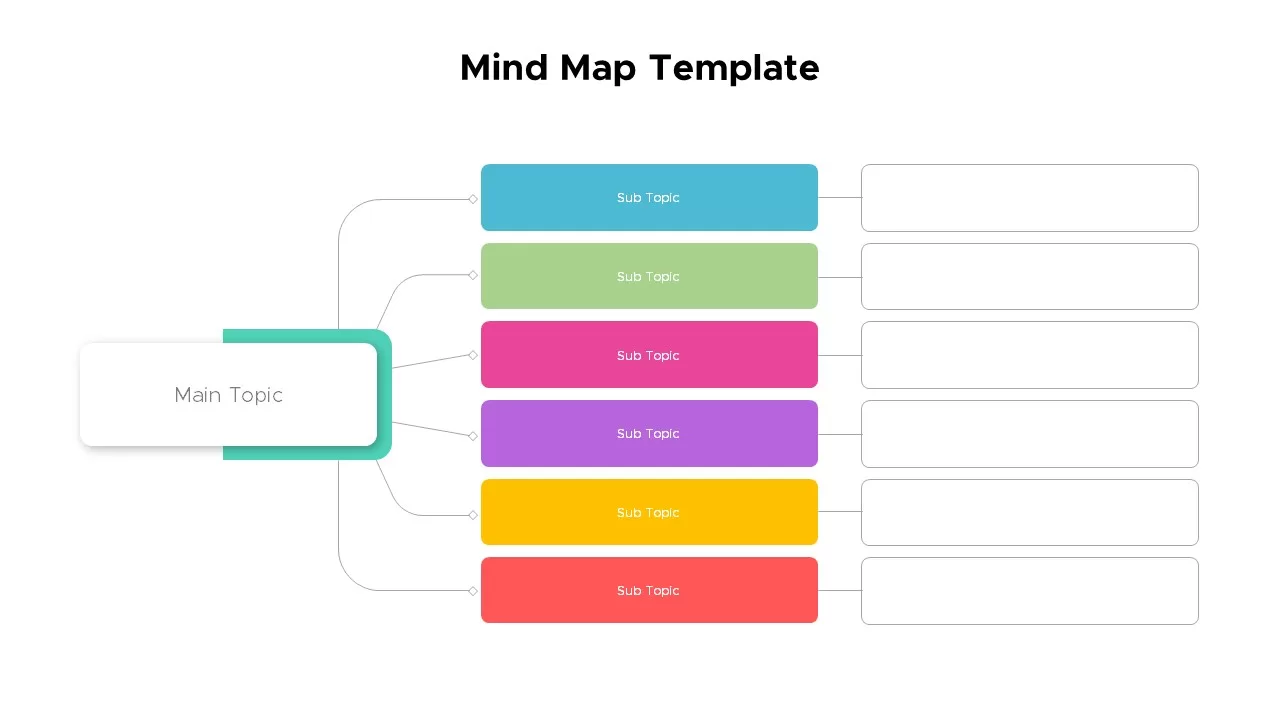
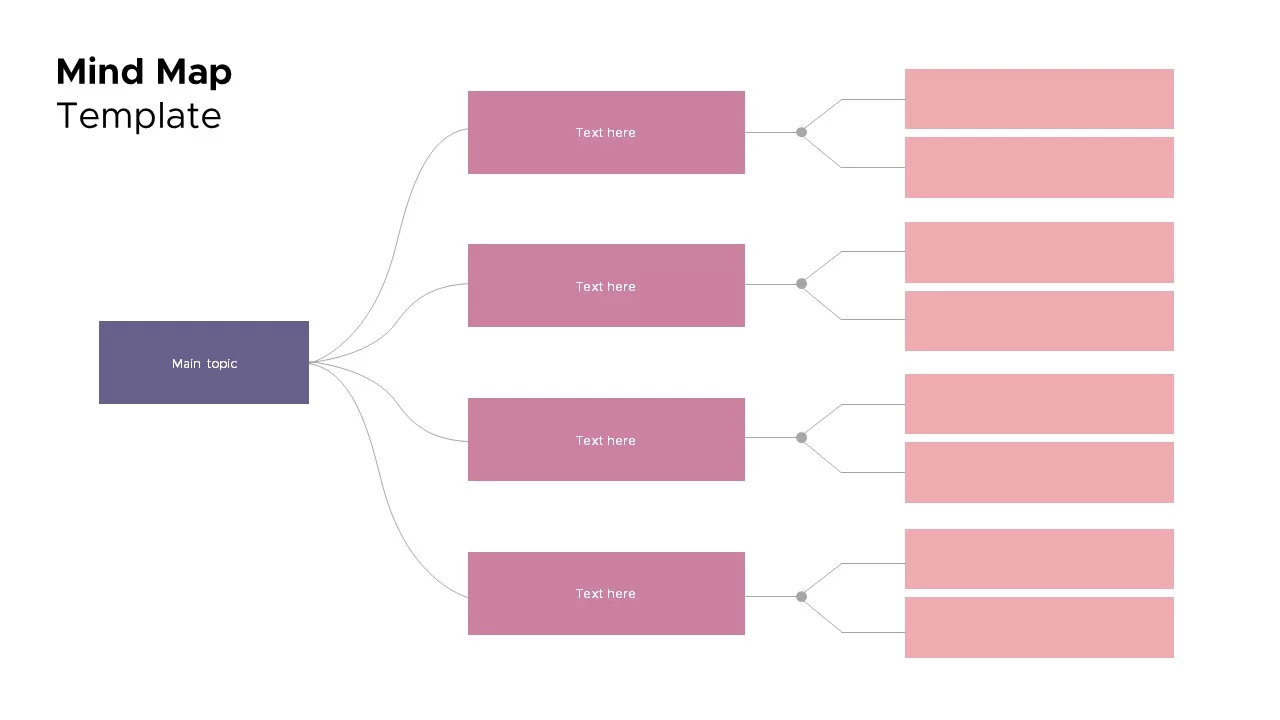
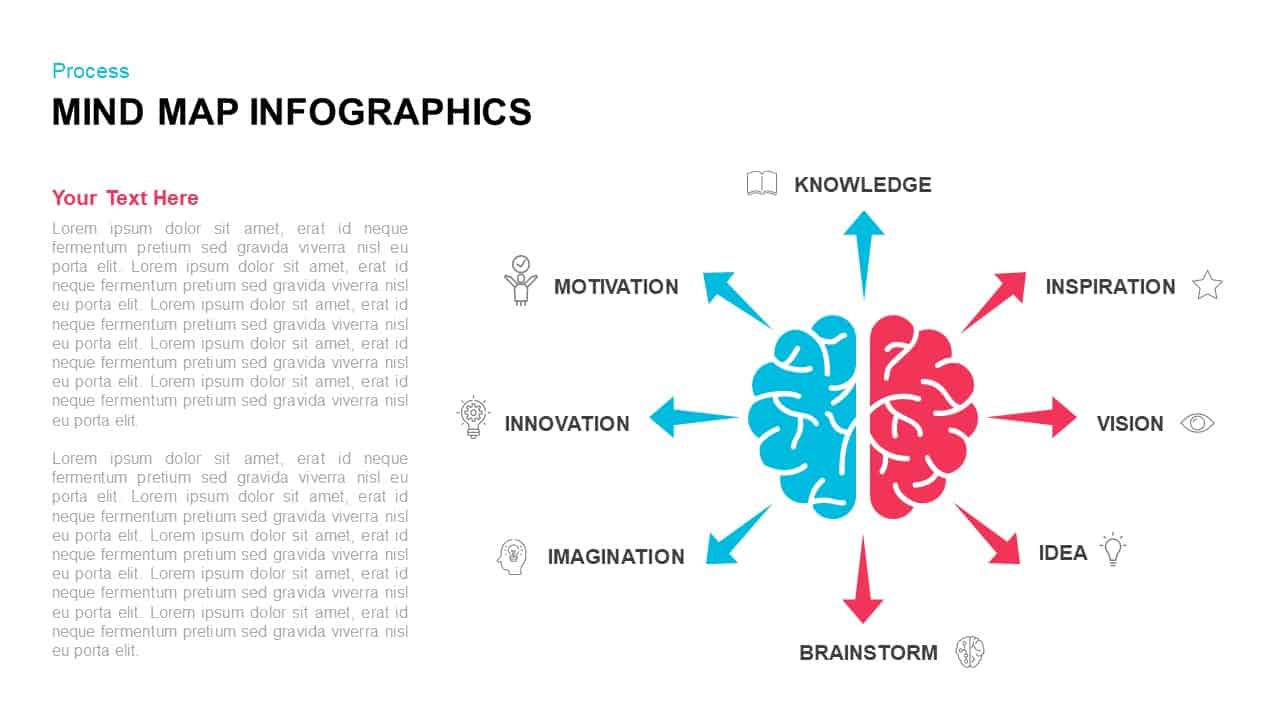
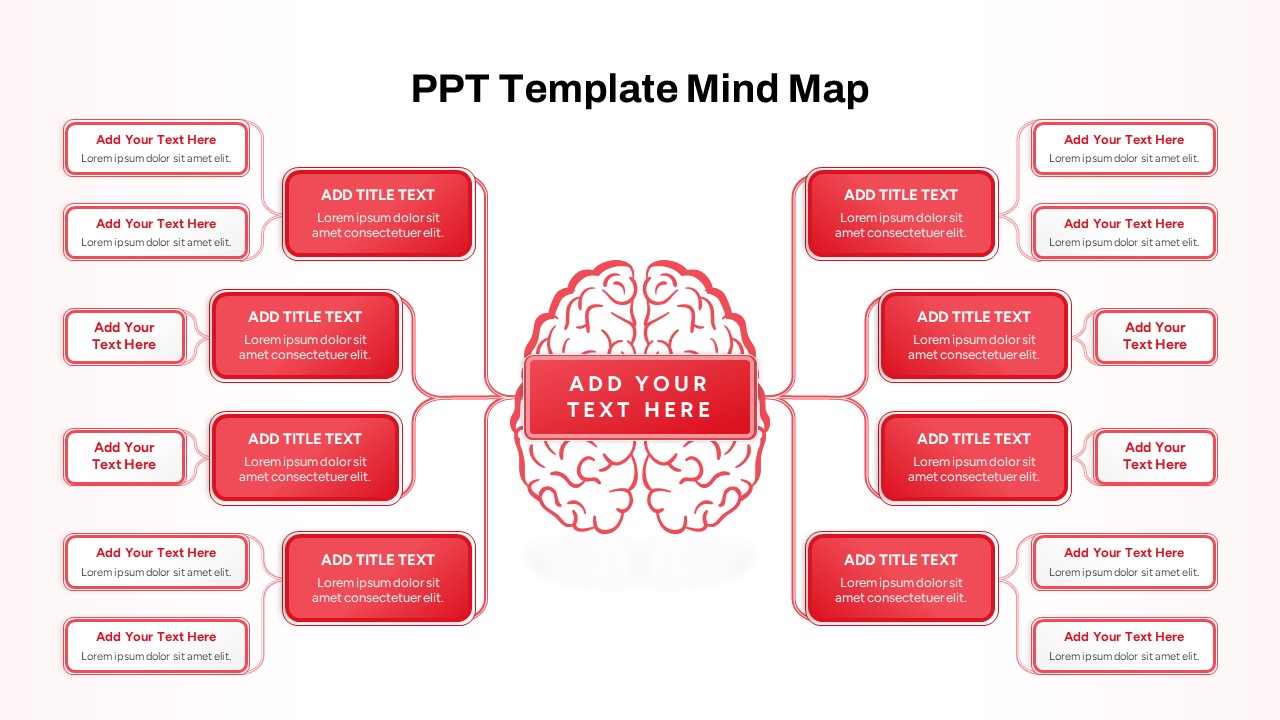
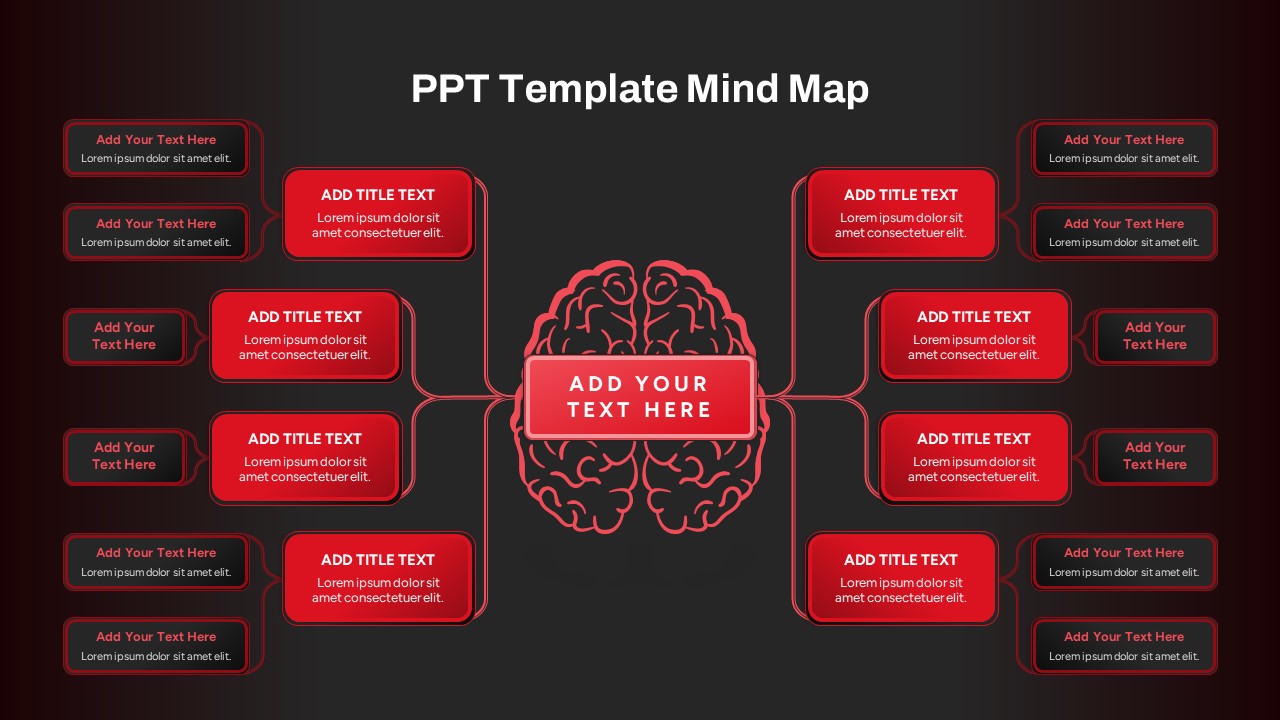
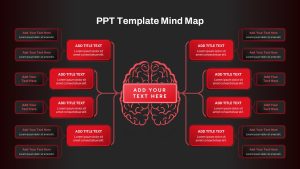
Equip your presentations with a visually striking mind map diagram to organize ideas, brainstorm strategies, and communicate complex concepts with clarity. Centered on a detailed red brain illustration, this slide features a central text placeholder that anchors your core topic. From the hub, two symmetrical branches extend to the left and right, each connecting to four rectangular nodes that support sub-topics, bullet lists, or key takeaways. Each node is designed as an editable vector shape with bold red fill, rounded corners, and a subtle drop shadow, ensuring crisp visuals whether projected on large screens or shared as digital handouts. All text boxes and connector lines are mastered on the slide master, allowing you to move, resize, or recolor elements effortlessly via PowerPoint or Google Slides.
With built-in placeholder text styles, you can apply your brand fonts with one click, while the layered structure lets you reorder branches or add new nodes on demand. The minimal white background and consistent color palette maintain focus on your content, and the intuitive grouping of shapes simplifies slide editing. Whether you’re mapping corporate strategies, outlining research themes, or plotting product roadmaps, this slide helps you break down large topics into digestible segments. Full support for vector icons means you can swap in custom glyphs to visually enrich each node, and the master layout safeguards your formatting against accidental changes. Optimized for both desktop and cloud-based presentations, this mind map template ensures seamless collaboration and keeps your message organized from idea inception through stakeholder review.
Who is it for
Project managers, creative directors, and facilitators can leverage this mind map template to structure brainstorming sessions, strategic workshops, or curriculum outlines. Business analysts, consultants, and educators will also benefit from its clear visual hierarchy when organizing research findings, user personas, or stakeholder requirements.
Other Uses
Beyond brainstorming and strategy mapping, repurpose this slide for SWOT analyses, content planning, or process flows. Adapt node labels to illustrate decision trees, workflow steps, or risk assessments. Increase or decrease the number of branches to fit small-group ideation or large-scale program overviews, maintaining visual consistency throughout your deck.
Login to download this file

Item ID
SB04224
Related Templates

Brain Diagram template for PowerPoint & Google Slides
Mind Maps
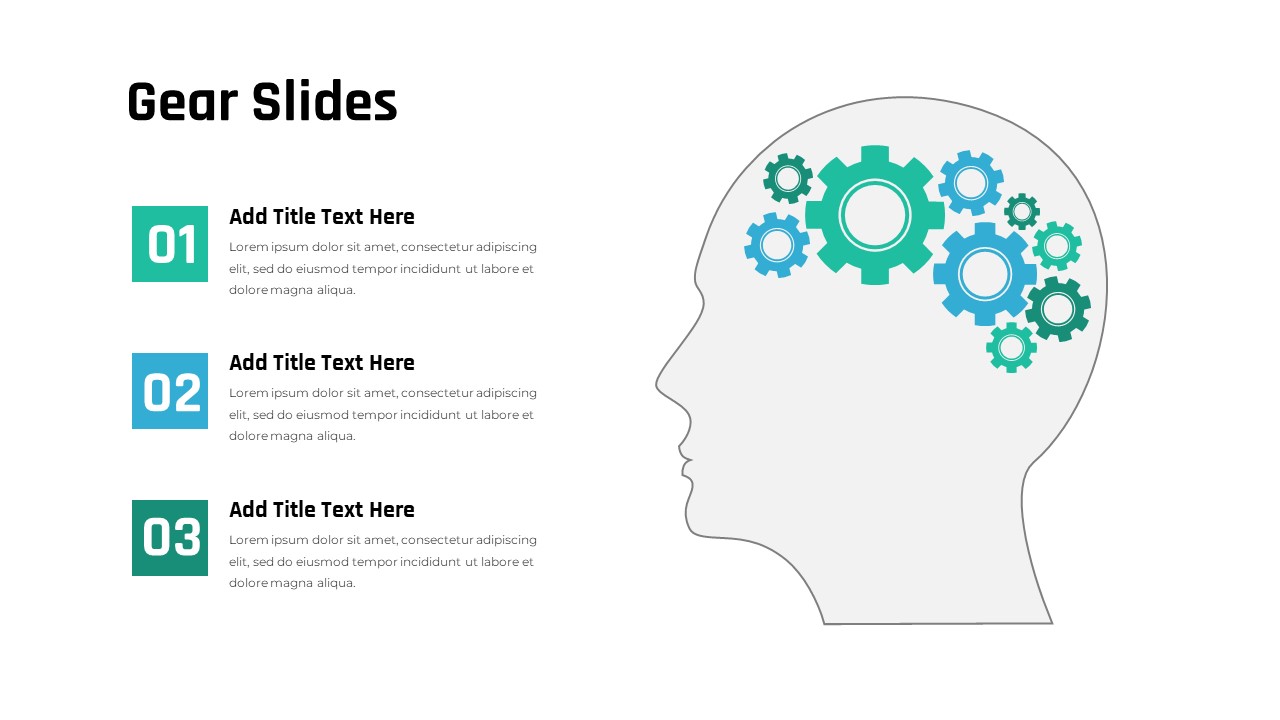
Three-Step Gears Brain Diagram Template for PowerPoint & Google Slides
Process
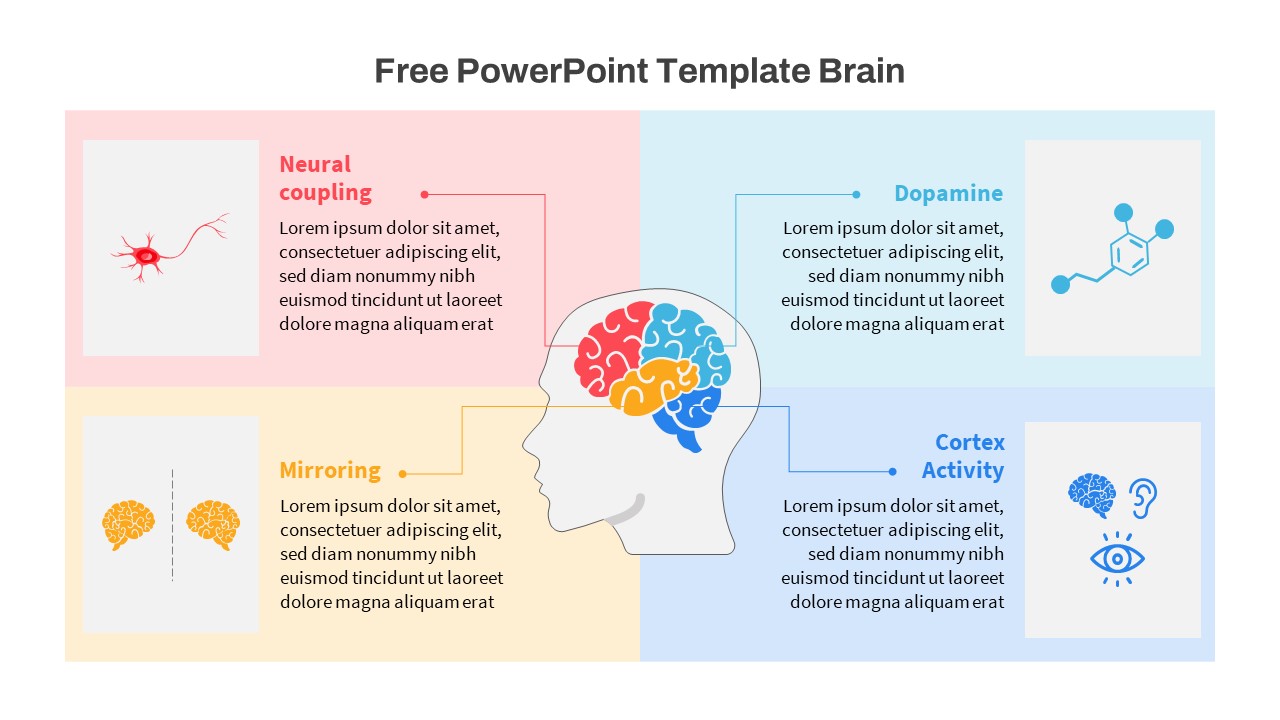
Free Brain Function Diagram Infographic Template for PowerPoint & Google Slides
Process
Free
Brain Gear Hub-and-Spoke Infographics template for PowerPoint & Google Slides
Org Chart

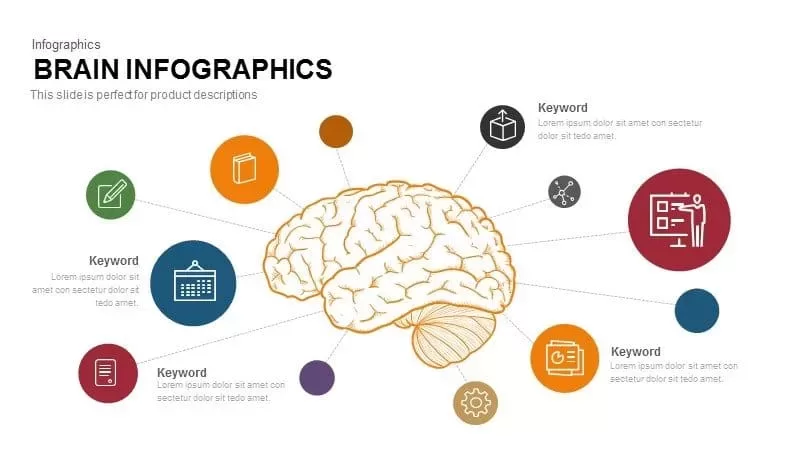
Brain Hub-and-Spoke Infographic template for PowerPoint & Google Slides
Org Chart
Idea Brain Concept Infographic Template for PowerPoint & Google Slides
Business Proposal
Neural Network Brain Infographic Template for PowerPoint & Google Slides
Process
Diamond Mind Map Diagram Four Branches Template for PowerPoint & Google Slides
Mind Maps
Risk Management Mind Map Radial Diagram template for PowerPoint & Google Slides
Mind Maps
Colorful Creative Mind Map Diagram template for PowerPoint & Google Slides
Mind Maps

Eight-Node Mind Map Infographic Diagram Template for PowerPoint & Google Slides
Mind Maps
Mind Map Diagram Template for PowerPoint & Google Slides
Mind Maps
Structured Mind Map Infographic Diagram Template for PowerPoint & Google Slides
Mind Maps
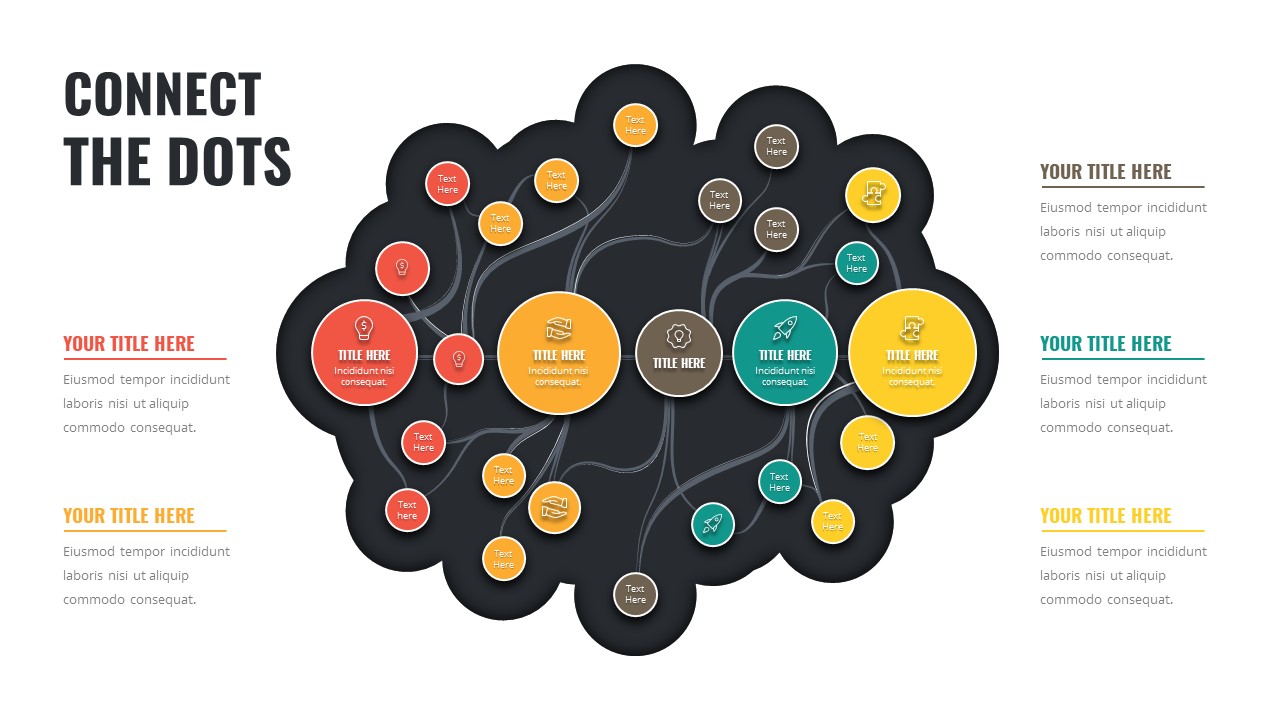
Connect the Dots Mind Map Diagram Template for PowerPoint & Google Slides
Mind Maps
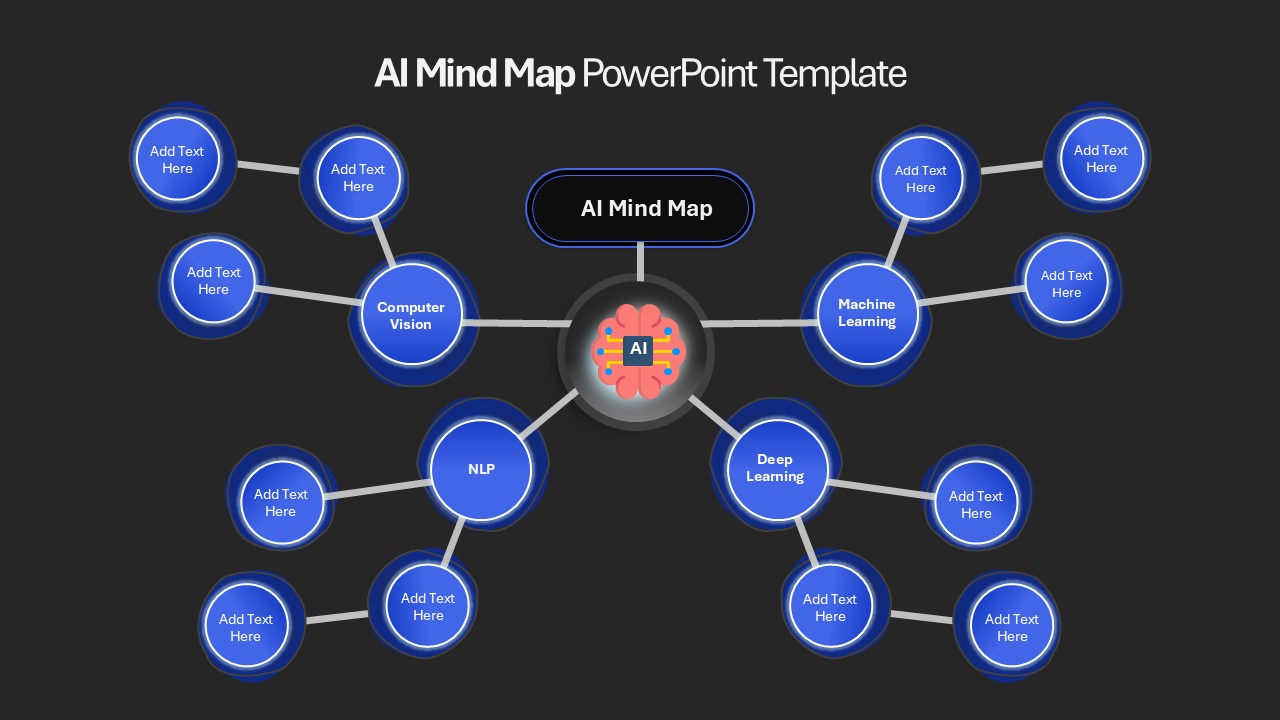
AI Mind Map & Hub-and-Spoke Diagram Template for PowerPoint & Google Slides
Mind Maps
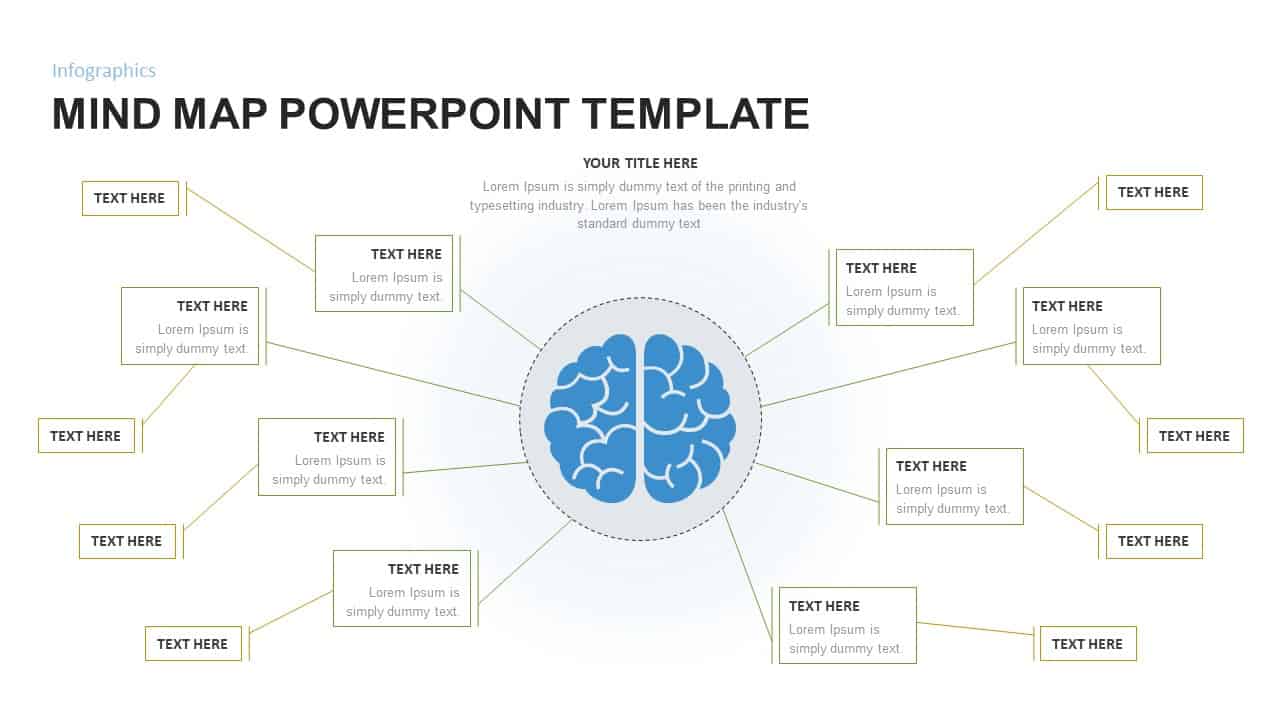
Mind Map PowerPoint template for PowerPoint & Google Slides
Mind Maps

Simple Multi-Branch Mind Map Template for PowerPoint & Google Slides
Mind Maps

Multi-Cluster Mind Map Infographic Template for PowerPoint & Google Slides
Mind Maps
Colorful Mind Map Infographic Template with Icons for PowerPoint & Google Slides
Mind Maps
Colorful Mind Map Infographic Template for PowerPoint & Google Slides
Mind Maps
Mind Map Infographic Slide Template for PowerPoint & Google Slides
Mind Maps
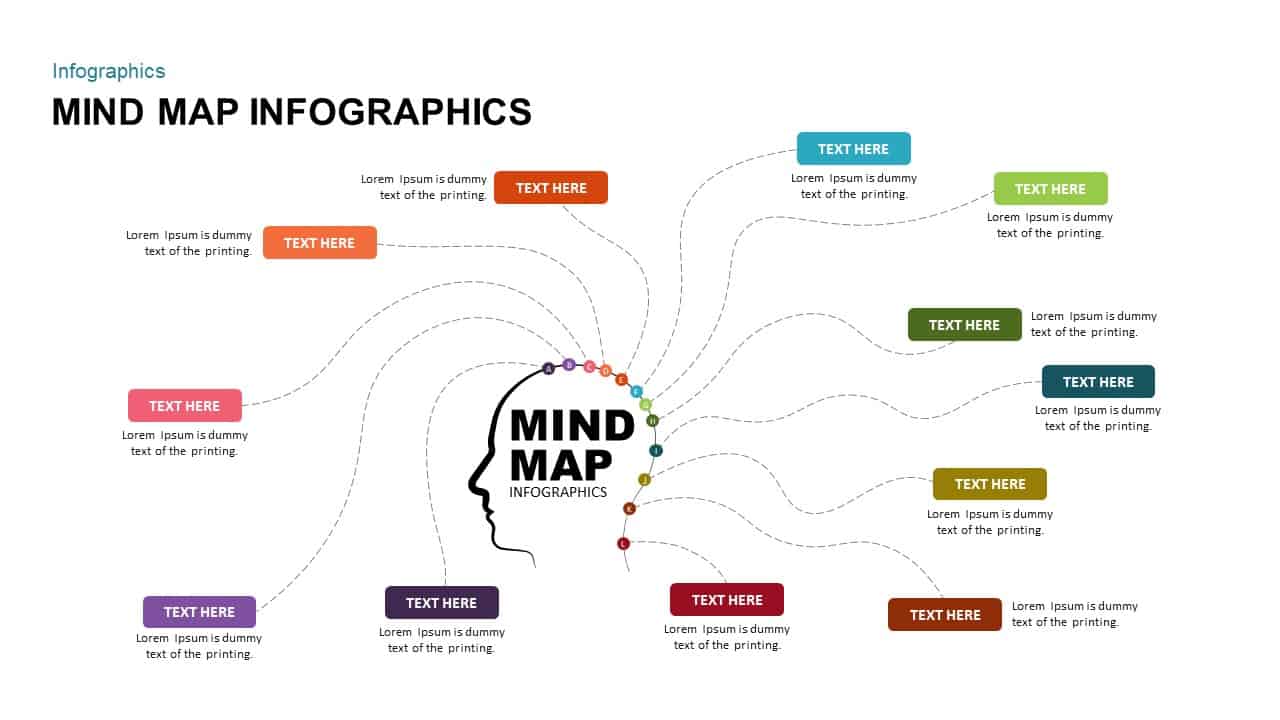
Mind Map Infographics template for PowerPoint & Google Slides
Mind Maps
Versatile Mind Map Infographic Template for PowerPoint & Google Slides
Mind Maps
Dual Topic Mind Map Infographic Template for PowerPoint & Google Slides
Mind Maps
Tri-Cluster Mind Map Infographic Template for PowerPoint & Google Slides
Mind Maps
Mind Map Template for PowerPoint & Google Slides
Mind Maps
Mind Map Template for PowerPoint & Google Slides
Mind Maps
Colorful Mind Map Template for PowerPoint & Google Slides
Mind Maps
Colorful Mind Map Template for PowerPoint & Google Slides
Mind Maps
Circular Mind Map Template for PowerPoint & Google Slides
Mind Maps
Colorful Mind Map with Icons Template for PowerPoint & Google Slides
Mind Maps
Colorful Mind Map Template for PowerPoint & Google Slides
Mind Maps
Mind Map Template for PowerPoint & Google Slides
Mind Maps
Connect the Dots Mind Map template for PowerPoint & Google Slides
Mind Maps
Modern Custom Eight-Branch Mind Map Template for PowerPoint & Google Slides
Mind Maps
Colorful Multi-Branch Mind Map Slide Template for PowerPoint & Google Slides
Mind Maps
Eight-Step Job Hiring Mind Map Template for PowerPoint & Google Slides
Mind Maps
Creative Bubble Mind Map Template for PowerPoint & Google Slides
Mind Maps
Five-Branch Mind Mapping Diagram template for PowerPoint & Google Slides
Mind Maps
Mind Mapping Hub and Spoke Diagram Template for PowerPoint & Google Slides
Mind Maps
Mind Mapping Hub and Spoke Diagram Template for PowerPoint & Google Slides
Mind Maps
Creative Mind Mapping Diagram with Icons Template for PowerPoint & Google Slides
Mind Maps
Social Media Mind Network Infographic Template for PowerPoint & Google Slides
Digital Marketing
Mind Mapping Template for PowerPoint & Google Slides
Mind Maps
Mind Mapping Template for PowerPoint & Google Slides
Mind Maps
Creative Mind Mapping Template for PowerPoint & Google Slides
Mind Maps
Red & Black Theme Deck Template for PowerPoint & Google Slides
Company Profile
Red Corporate Cover Slide Template for PowerPoint & Google Slides
Company Profile

Red Company Profile Presentation Template for PowerPoint & Google Slides
Company Profile
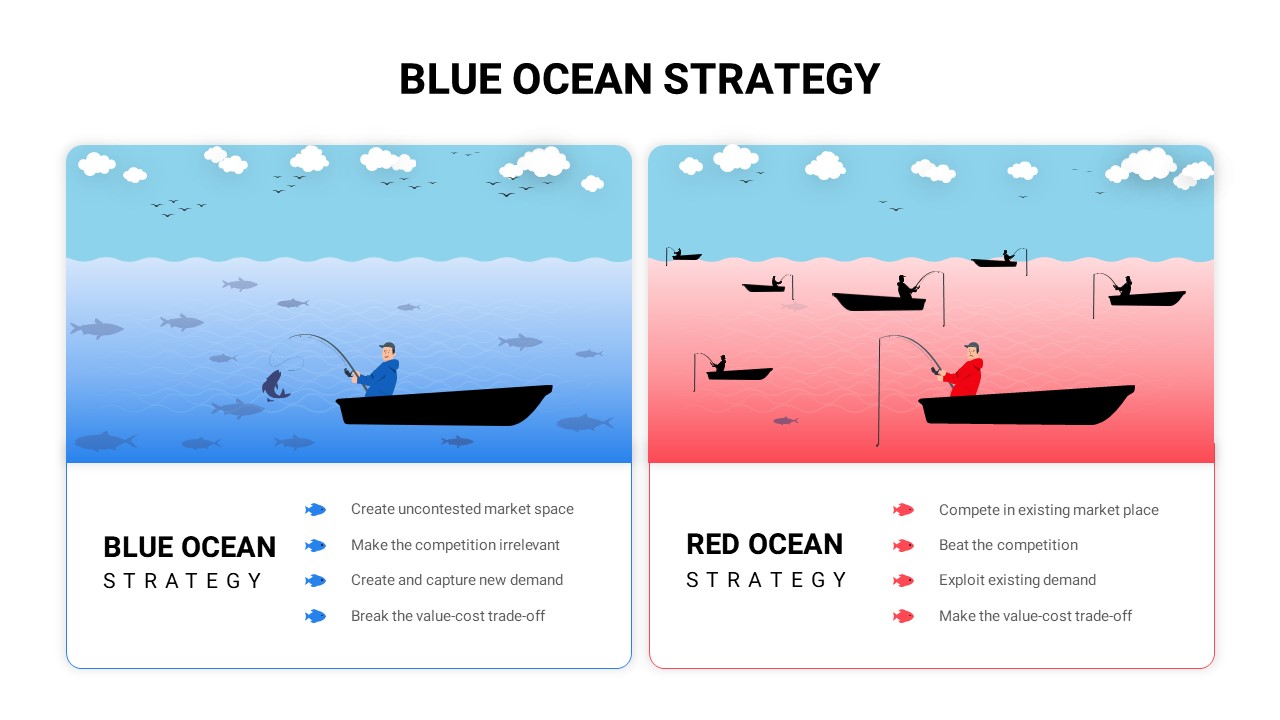
Blue vs Red Ocean Strategy Comparison Template for PowerPoint & Google Slides
Business Strategy

Red Executive Coaching Template for PowerPoint & Google Slides
Company Profile
Red and White Healthy Food Pitch Deck Template for PowerPoint & Google Slides
Pitch Deck
Red & White Company Profile Pitch Deck Template for PowerPoint & Google Slides
Company Profile

Dark Portfolio with Red Accent Template for PowerPoint & Google Slides
Pitch Deck
Red and Black Bike Theme Template for PowerPoint & Google Slides
Pitch Deck
Black and Red Theme Presentation for PowerPoint & Google Slides
Company Profile
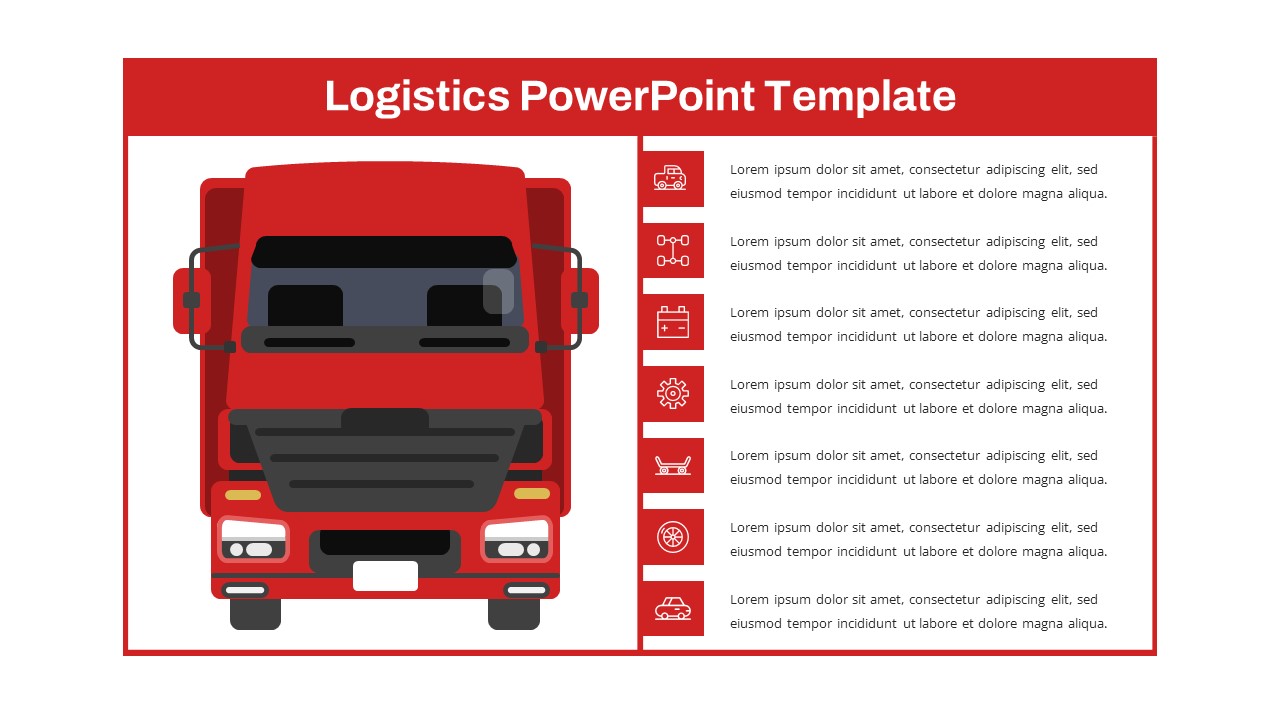
Free Red Truck Logistics Overview Slide for PowerPoint & Google Slides
Infographics
Free
Risk Management Heat Map Diagram Template for PowerPoint & Google Slides
Comparison Chart
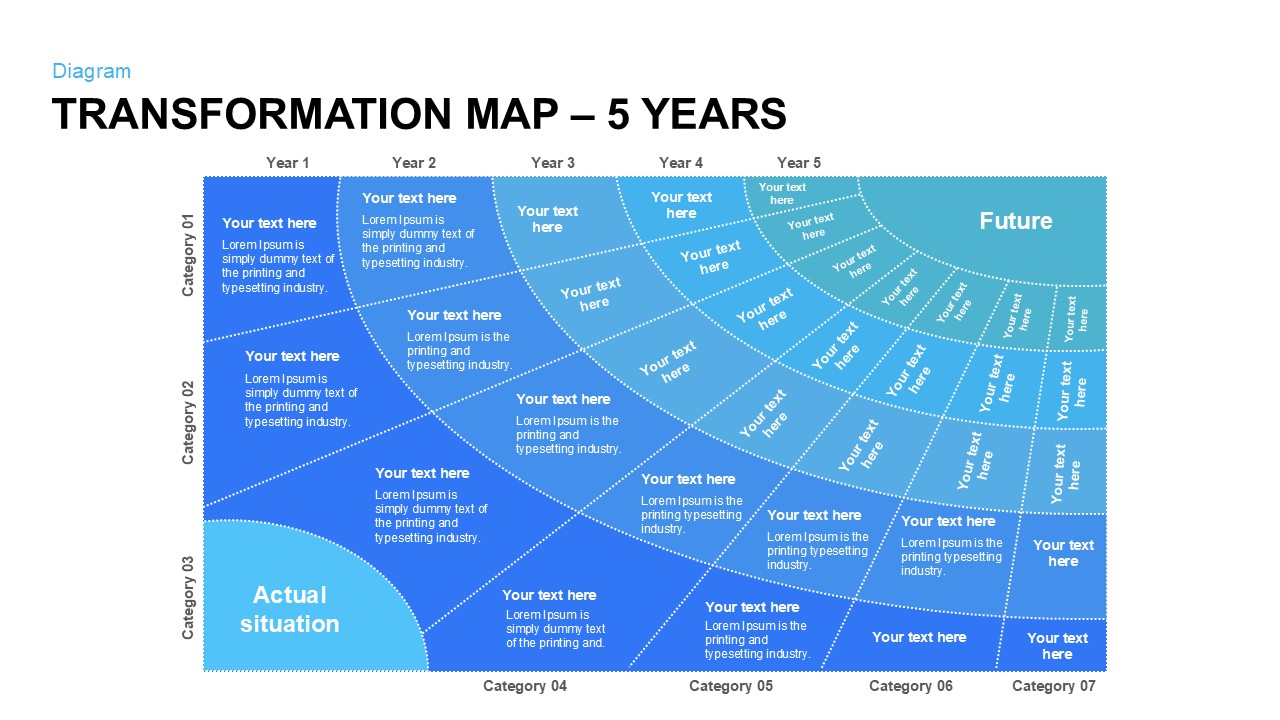
Five-Year Transformation Map Diagram Template for PowerPoint & Google Slides
Process
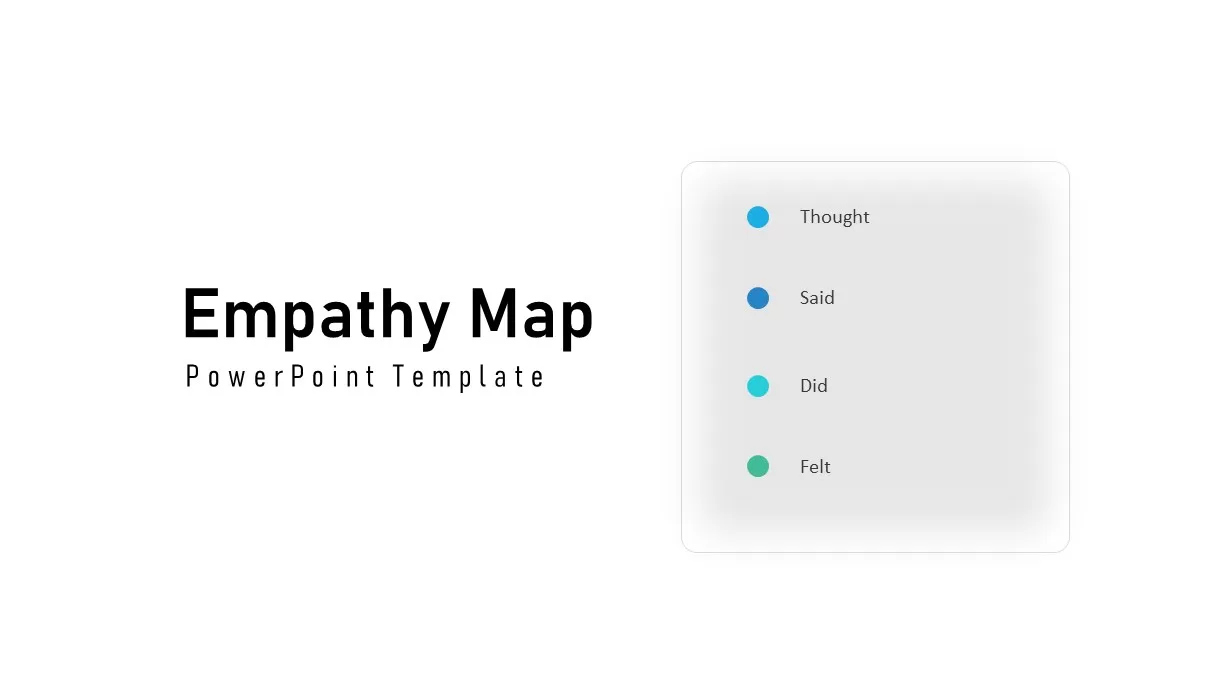
Interactive Empathy Map Diagram Template for PowerPoint & Google Slides
Process
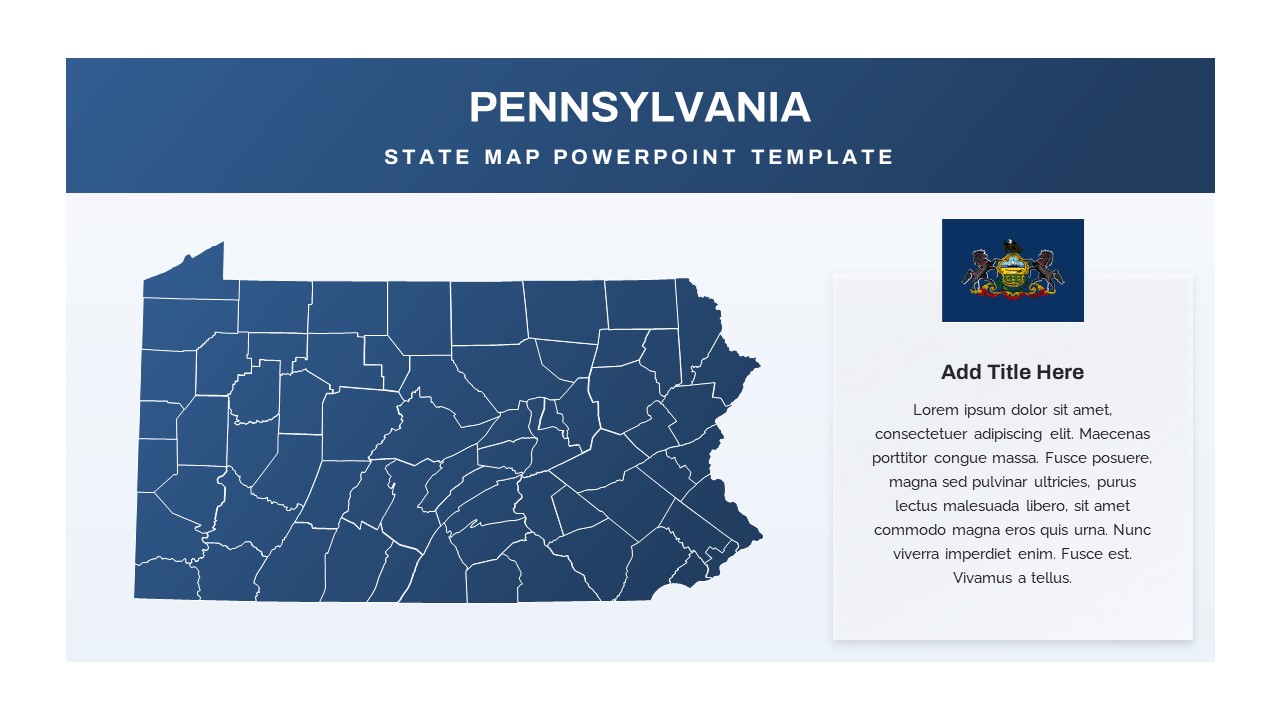
Pennsylvania State Map Diagram Template for PowerPoint & Google Slides
World Maps
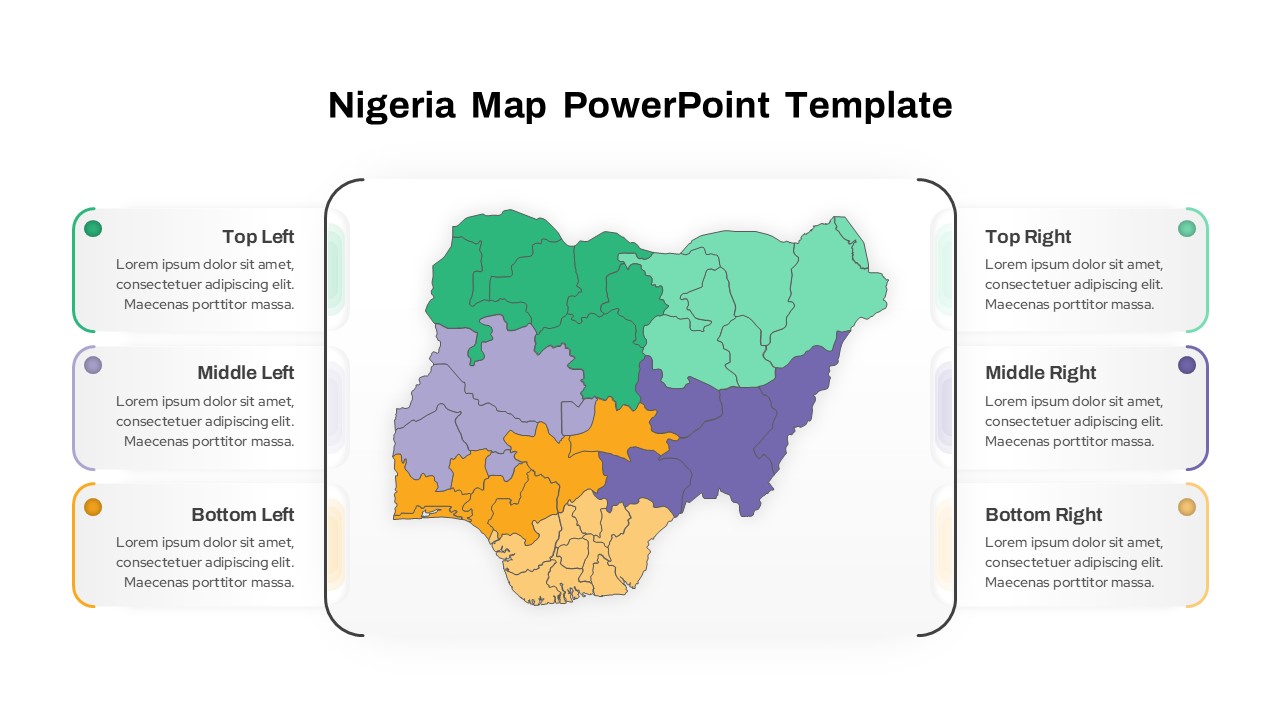
Nigeria Regional Callout Map Diagram Template for PowerPoint & Google Slides
Maps
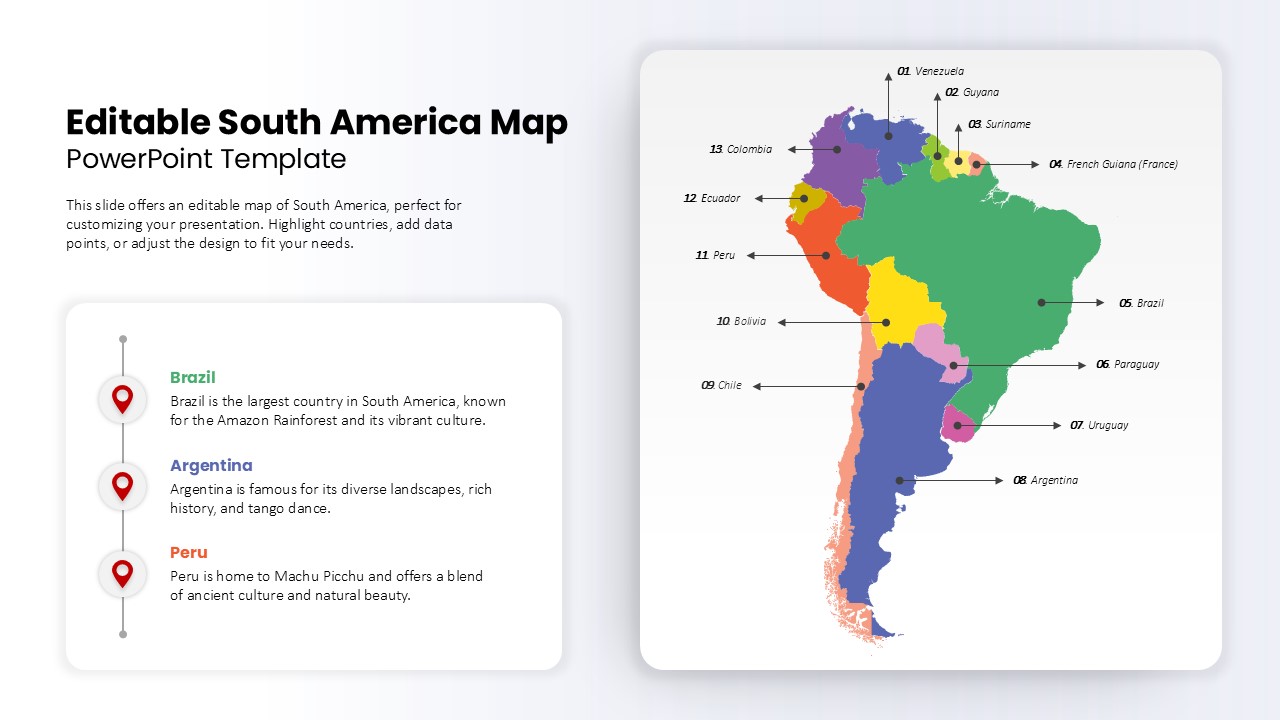
Editable South America Map Diagram Template for PowerPoint & Google Slides
Maps
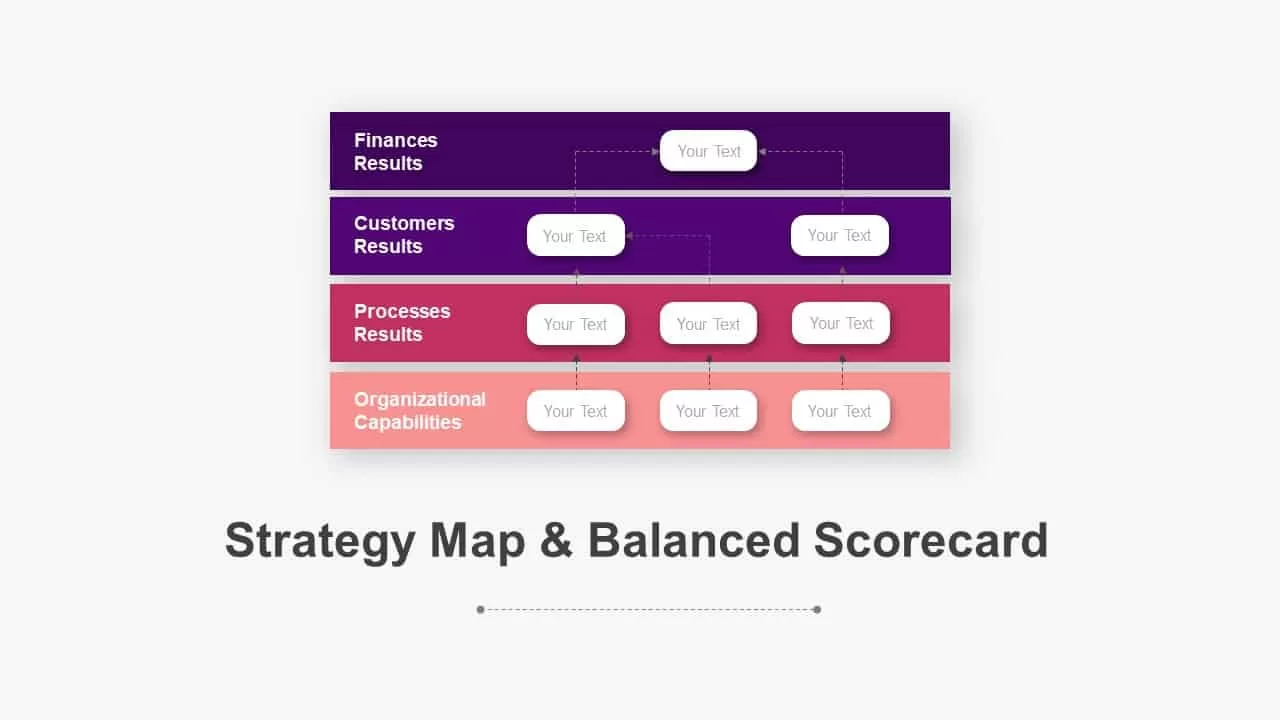
Balanced Scorecard Strategy Map Diagram Pack for PowerPoint & Google Slides
Business Strategy
Editable Colombia Map PowerPoint Template for PowerPoint & Google Slides
Business Models
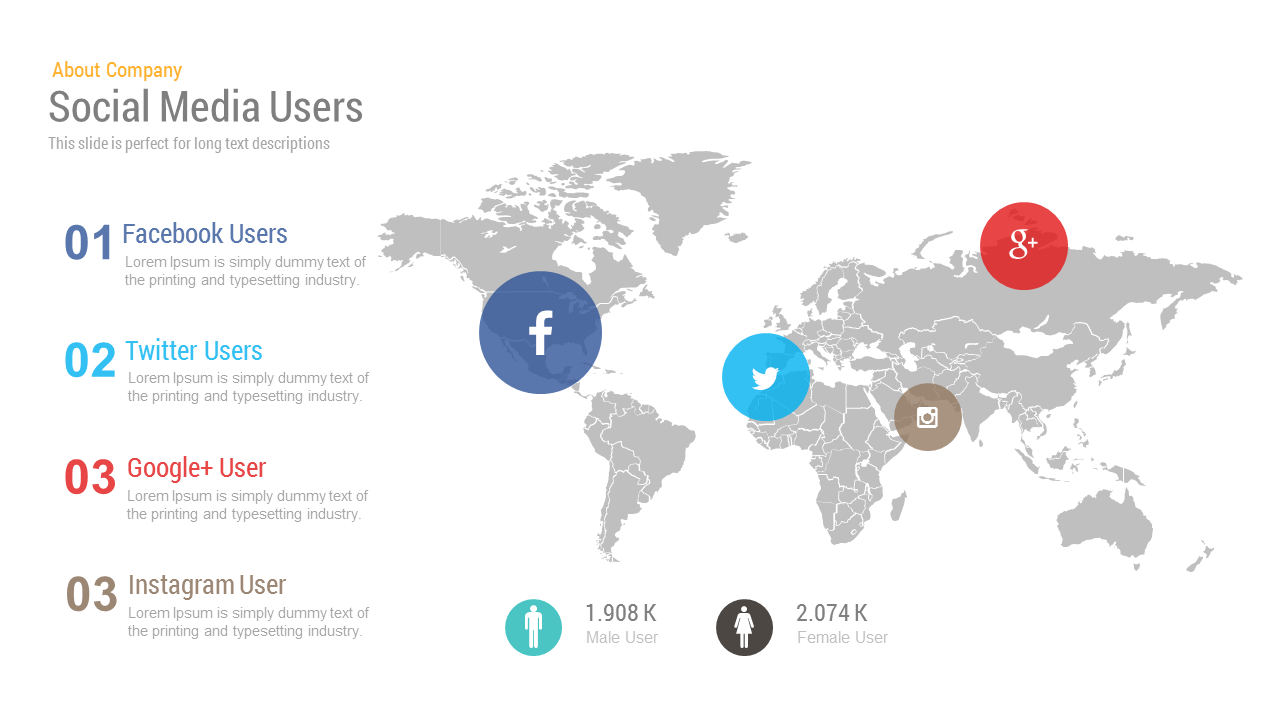
Free Social Media Users Map template for PowerPoint & Google Slides
World Maps
Free
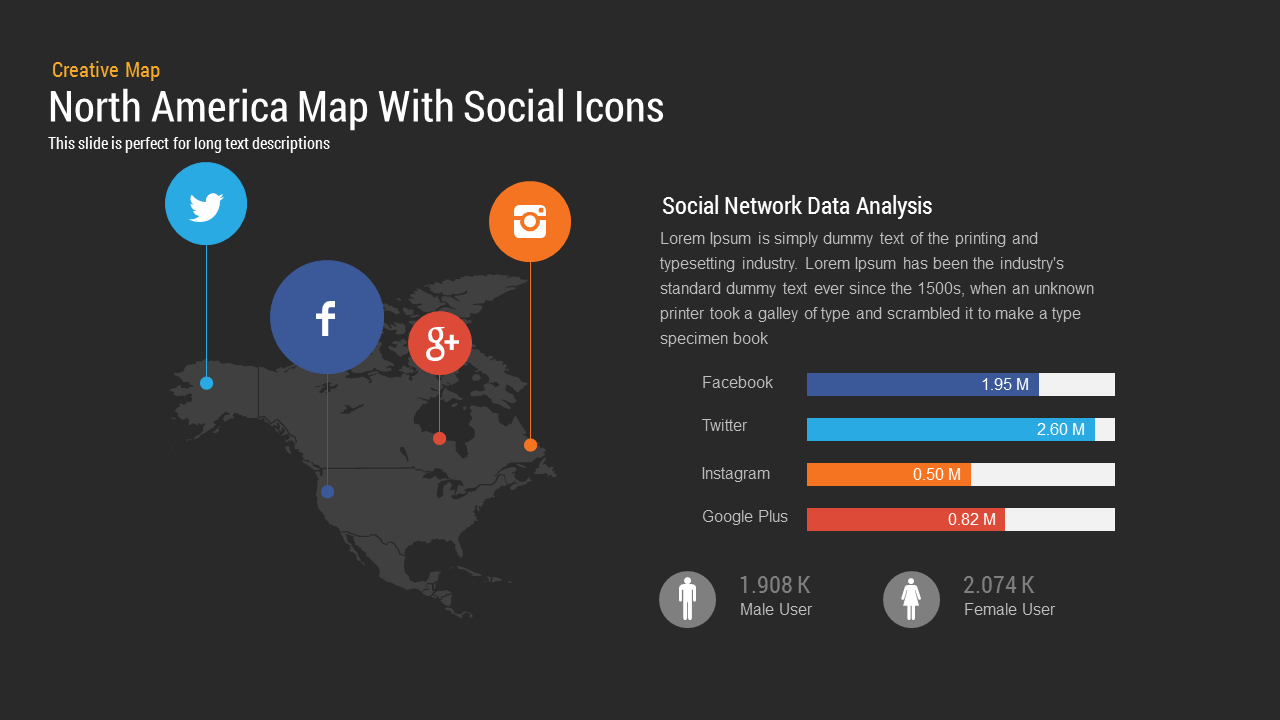
North America Map template for PowerPoint & Google Slides
World Maps
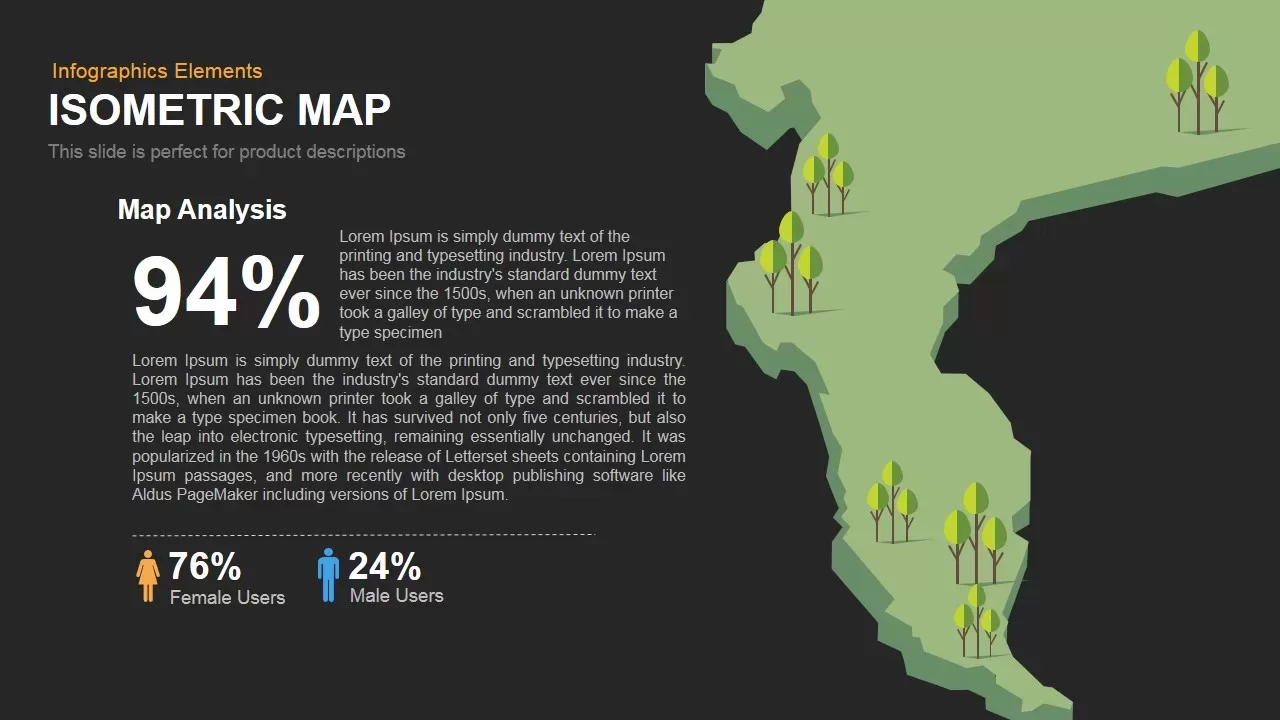
Isometric Map Analysis Slide Template for PowerPoint & Google Slides
World Maps
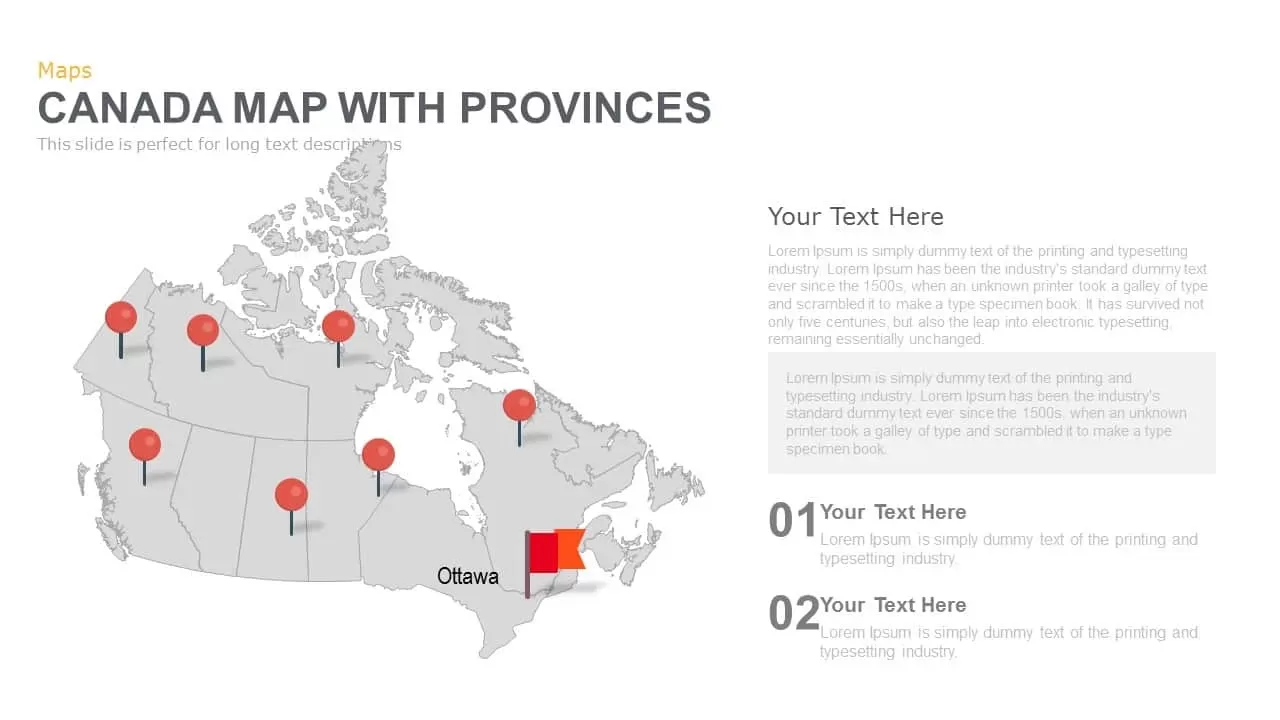
Canada Provinces Map Multi-Layout Template for PowerPoint & Google Slides
World Maps
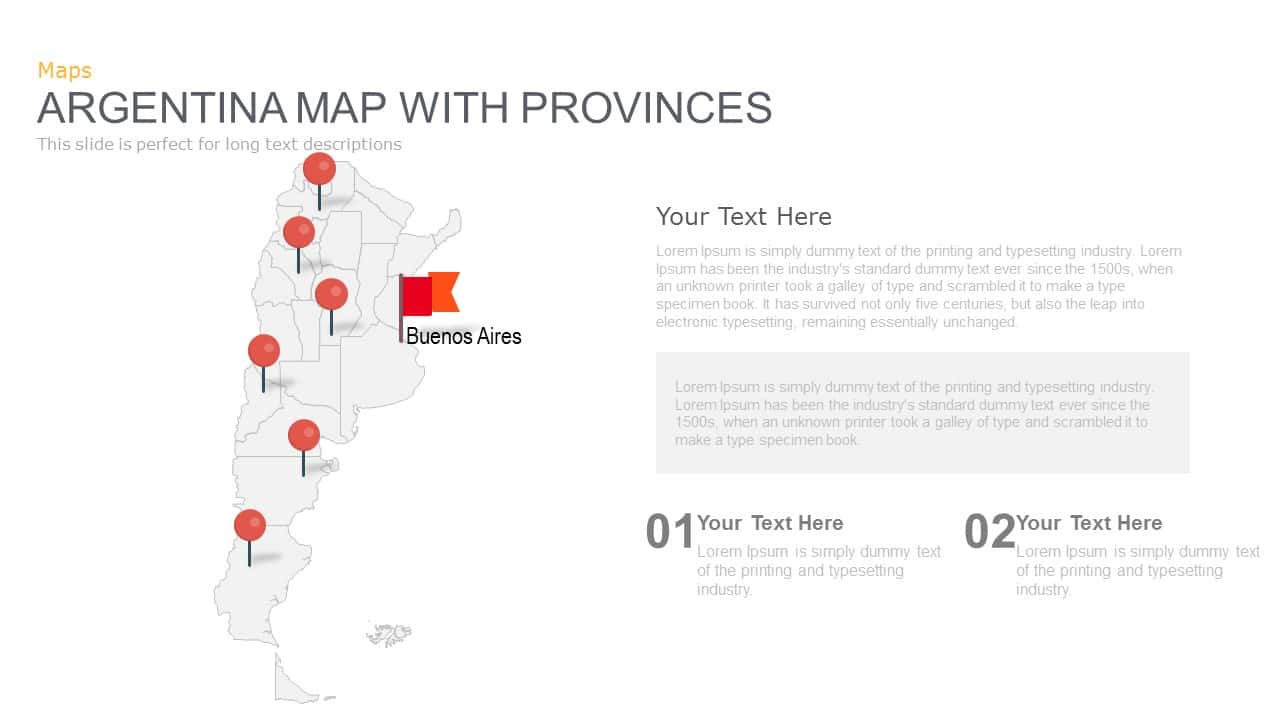
Argentina Province Map Markers Template for PowerPoint & Google Slides
World Maps
Curved Road Map Timeline Infographic Template for PowerPoint & Google Slides
Roadmap
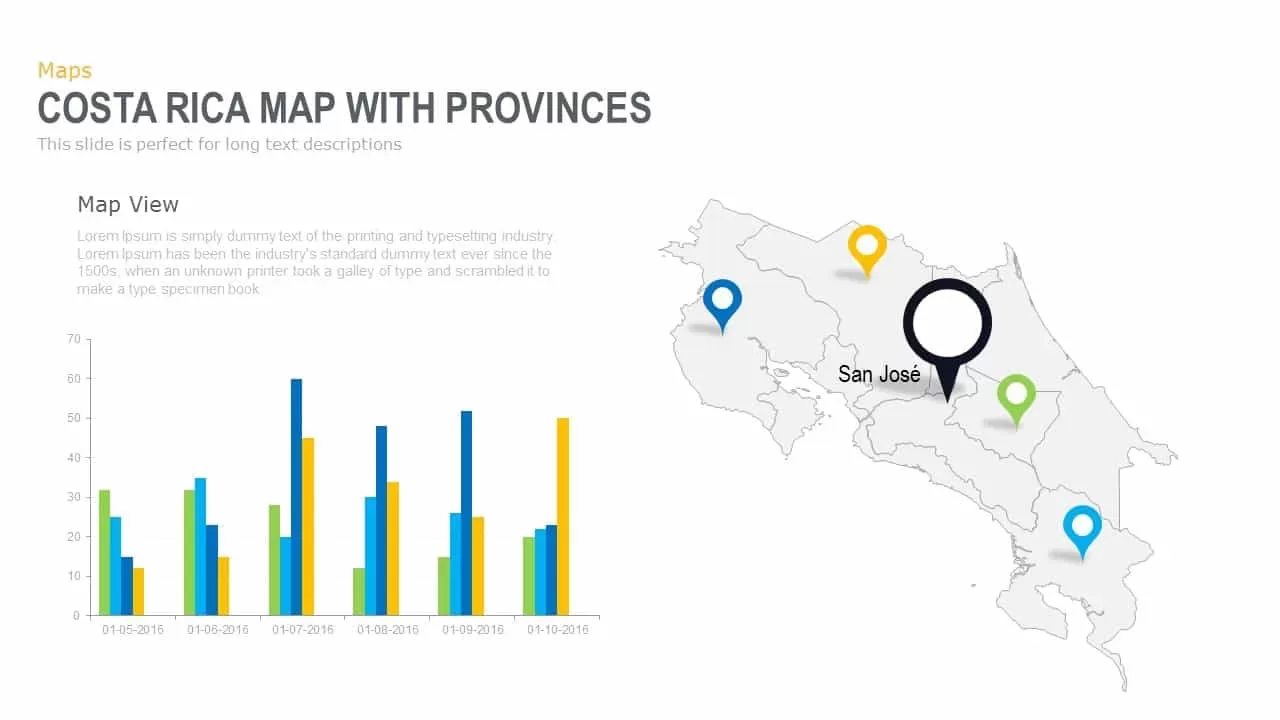
Interactive Costa Rica Province Map Template for PowerPoint & Google Slides
World Maps
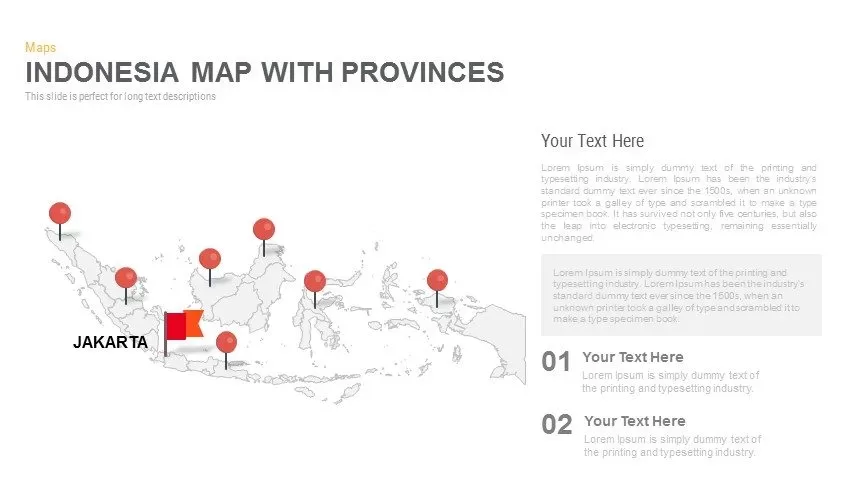
Indonesia Province Map Callout Slide Template for PowerPoint & Google Slides
Maps
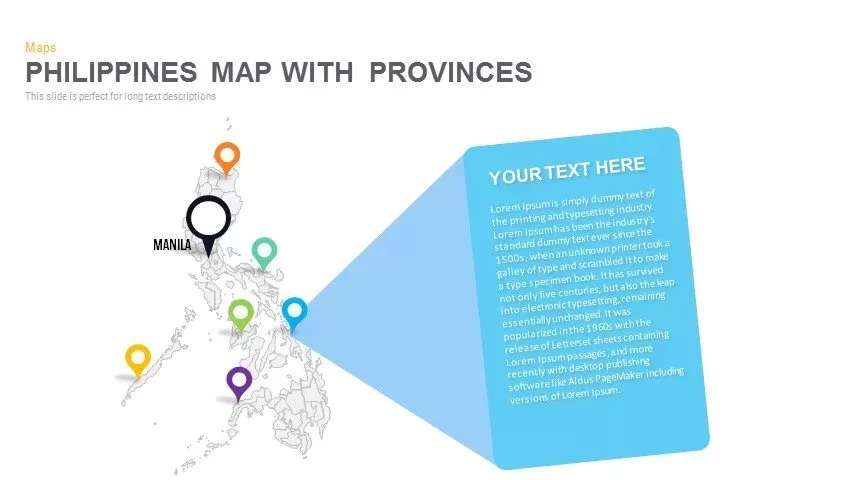
Philippines Map with Provinces Pack Template for PowerPoint & Google Slides
Maps
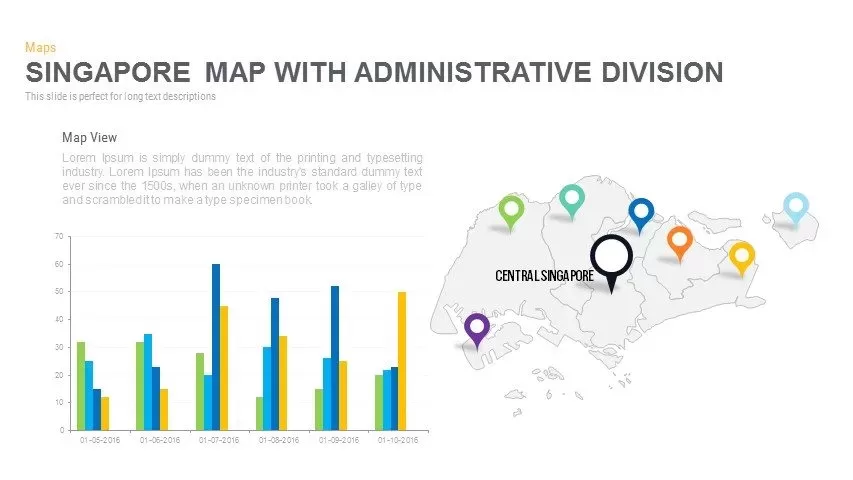
Singapore Map Pack Template for PowerPoint & Google Slides
Maps
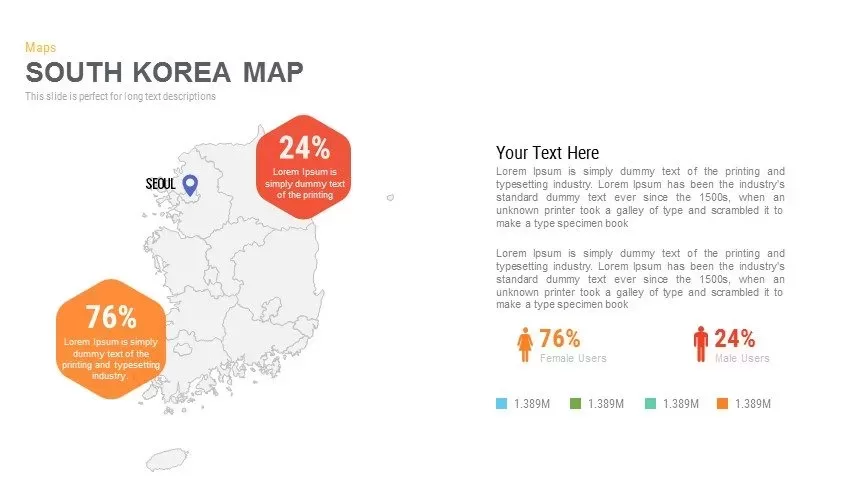
Infographic South Korea Map Template for PowerPoint & Google Slides
Maps
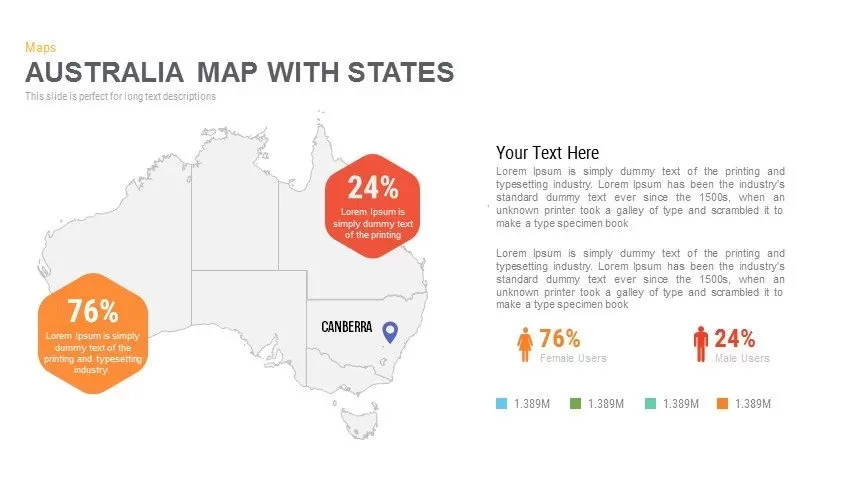
Australia Map with State Markers Template for PowerPoint & Google Slides
Maps
Angola Map with Provinces Slide Pack Template for PowerPoint & Google Slides
World Maps
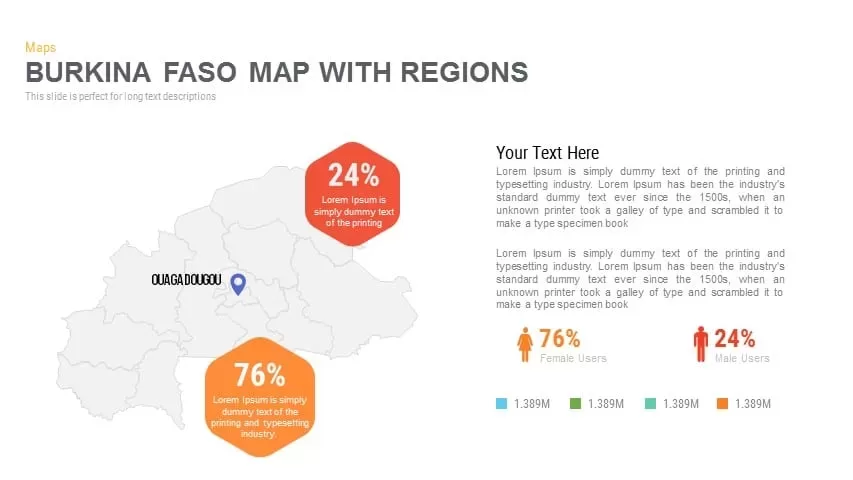
Burkina Faso Map with Regions Slide Pack Template for PowerPoint & Google Slides
World Maps
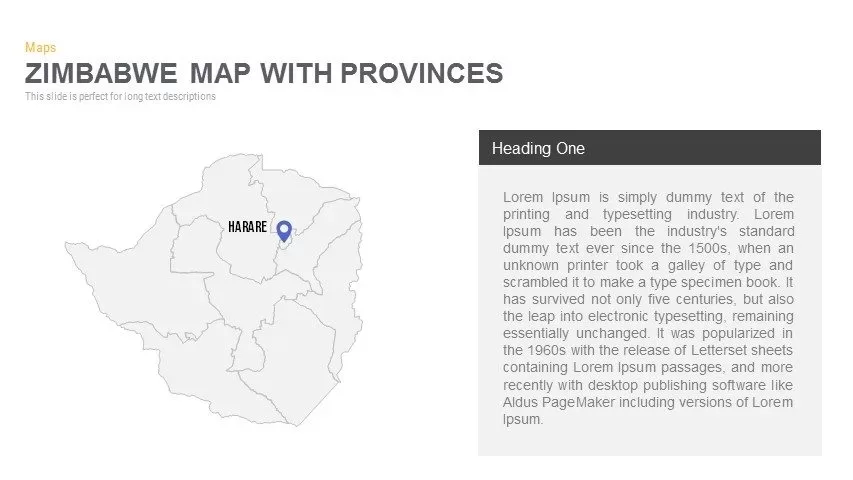
Zimbabwe Map with Provinces Slide Pack Template for PowerPoint & Google Slides
World Maps

Road Map Timeline Presentation template for PowerPoint & Google Slides
Roadmap
Modern World Map Callout Infographic Template for PowerPoint & Google Slides
World Maps
North America Location Pin Map Overview Template for PowerPoint & Google Slides
World Maps
Customizable Canada Map Outline Template for PowerPoint & Google Slides
World Maps
Heat Map Risk Assessment Presentation Template for PowerPoint & Google Slides
Risk Management
Professional Interactive Heat Map Matrix Template for PowerPoint & Google Slides
Comparison Chart
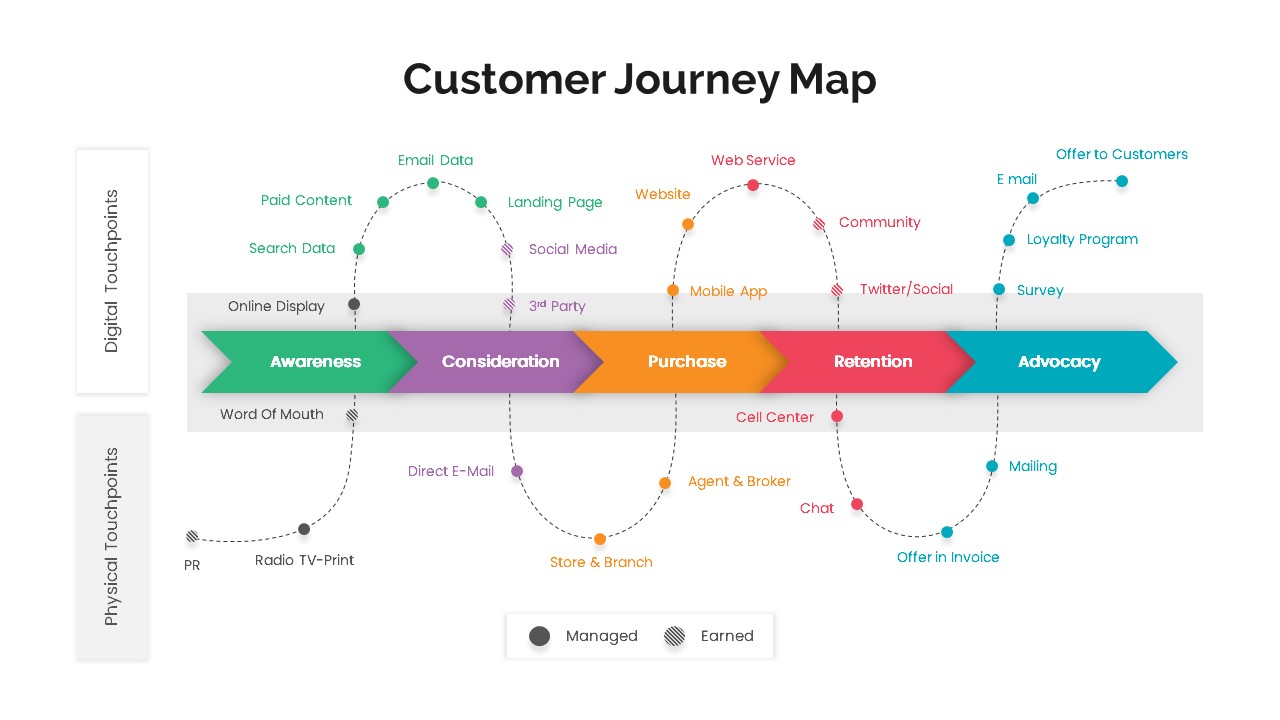
Versatile Customer Journey Map Template for PowerPoint & Google Slides
Customer Journey
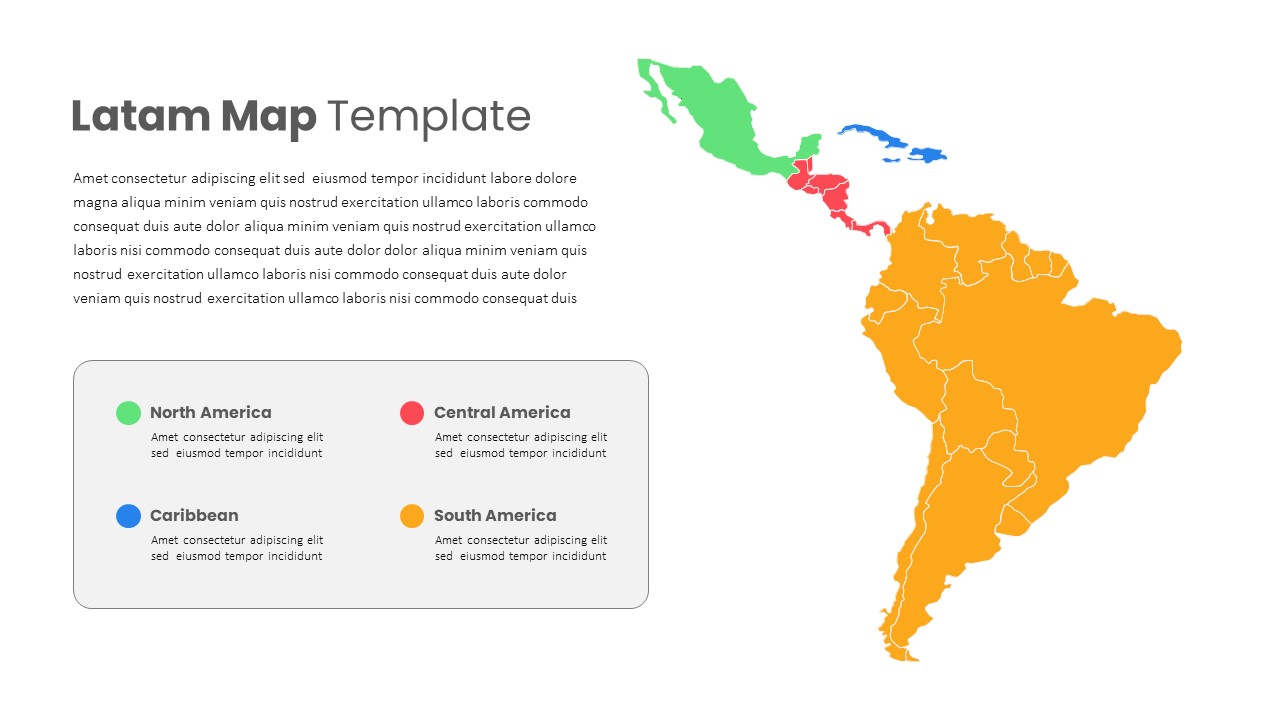
Latin America Regional Map Breakdown Template for PowerPoint & Google Slides
World Maps
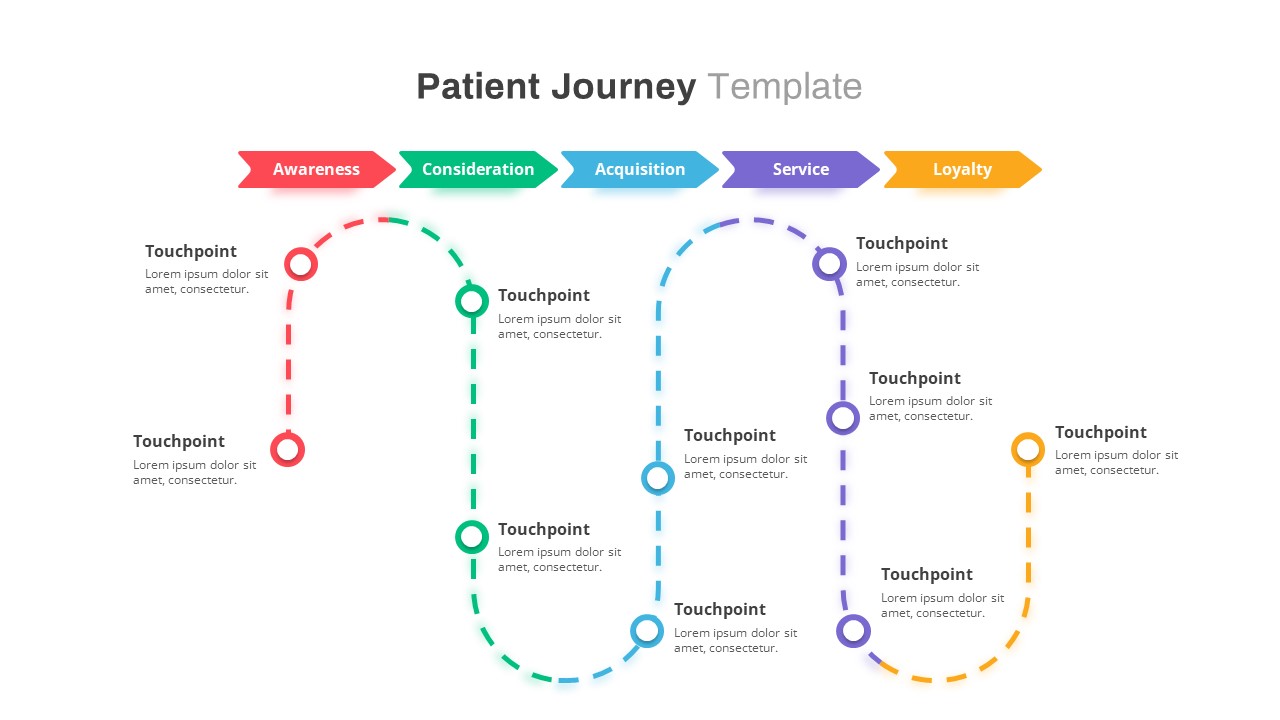
Healthcare Patient Journey Map Overview Template for PowerPoint & Google Slides
Health
UK Counties Map Data Visualization Template for PowerPoint & Google Slides
World Maps
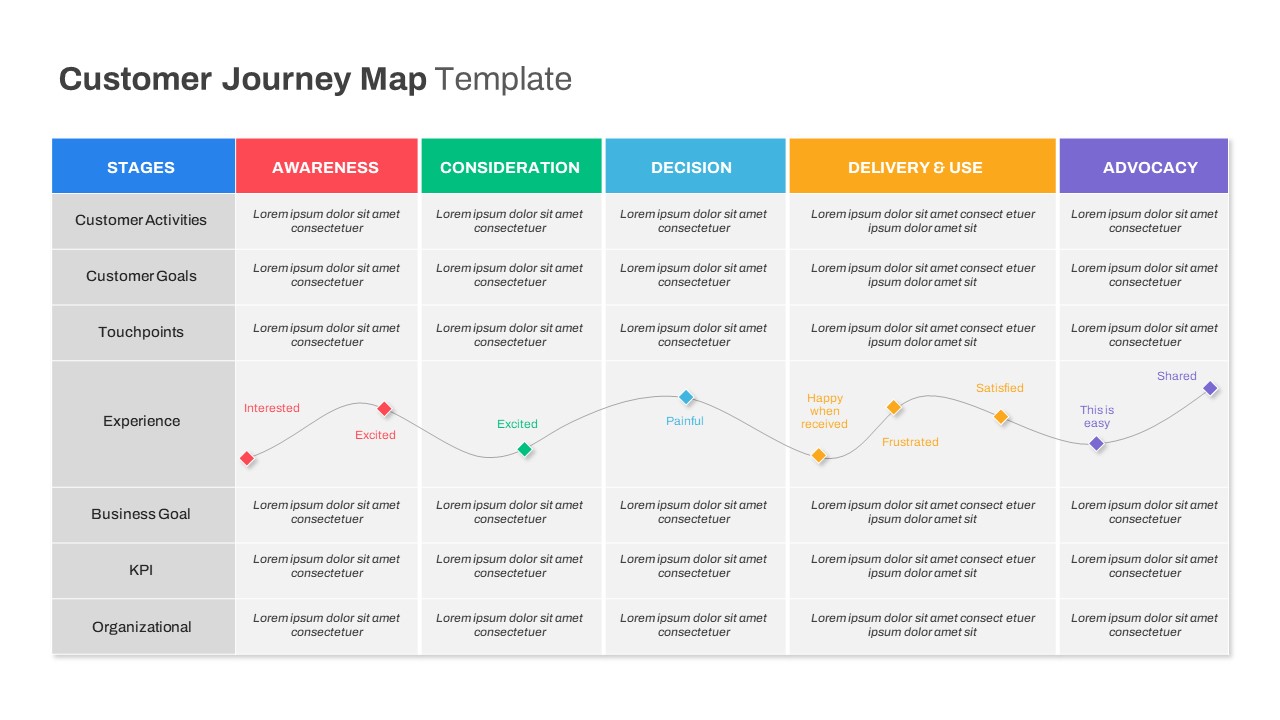
Comprehensive Customer Journey Map Template for PowerPoint & Google Slides
Customer Journey
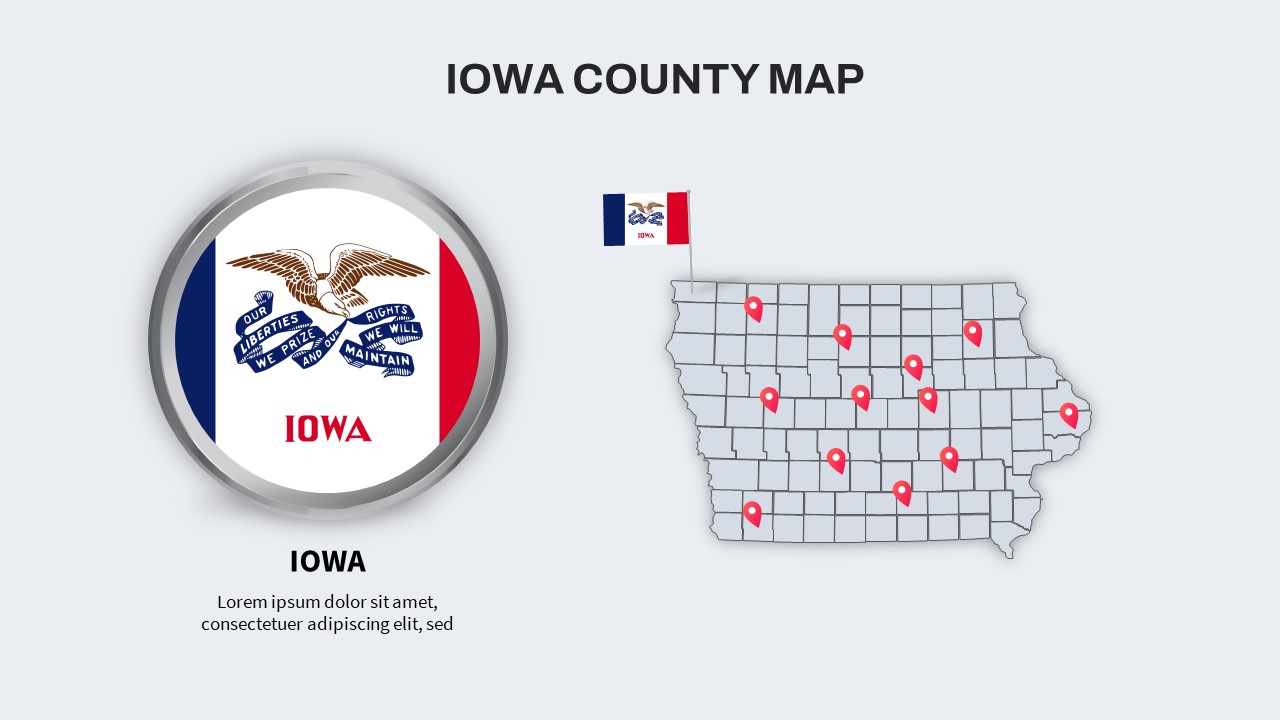
Iowa County Map with Location Markers Template for PowerPoint & Google Slides
World Maps
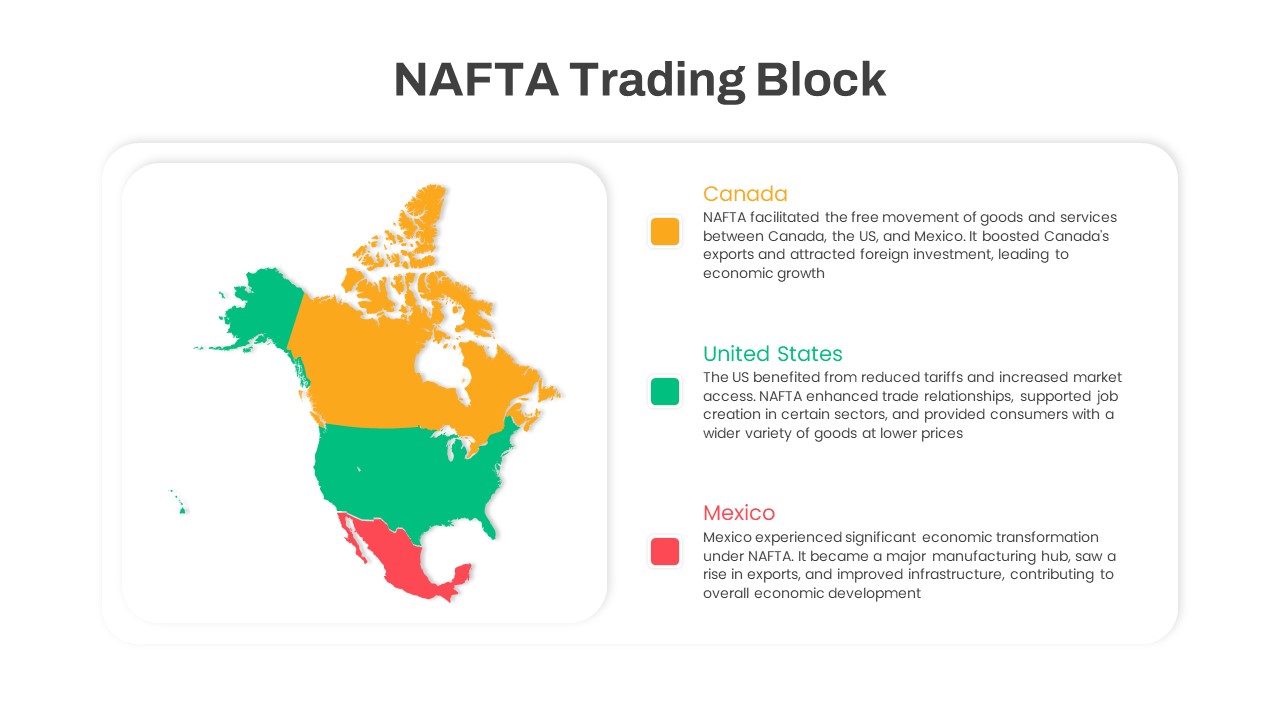
NAFTA Trading Block Map Infographic Template for PowerPoint & Google Slides
World Maps
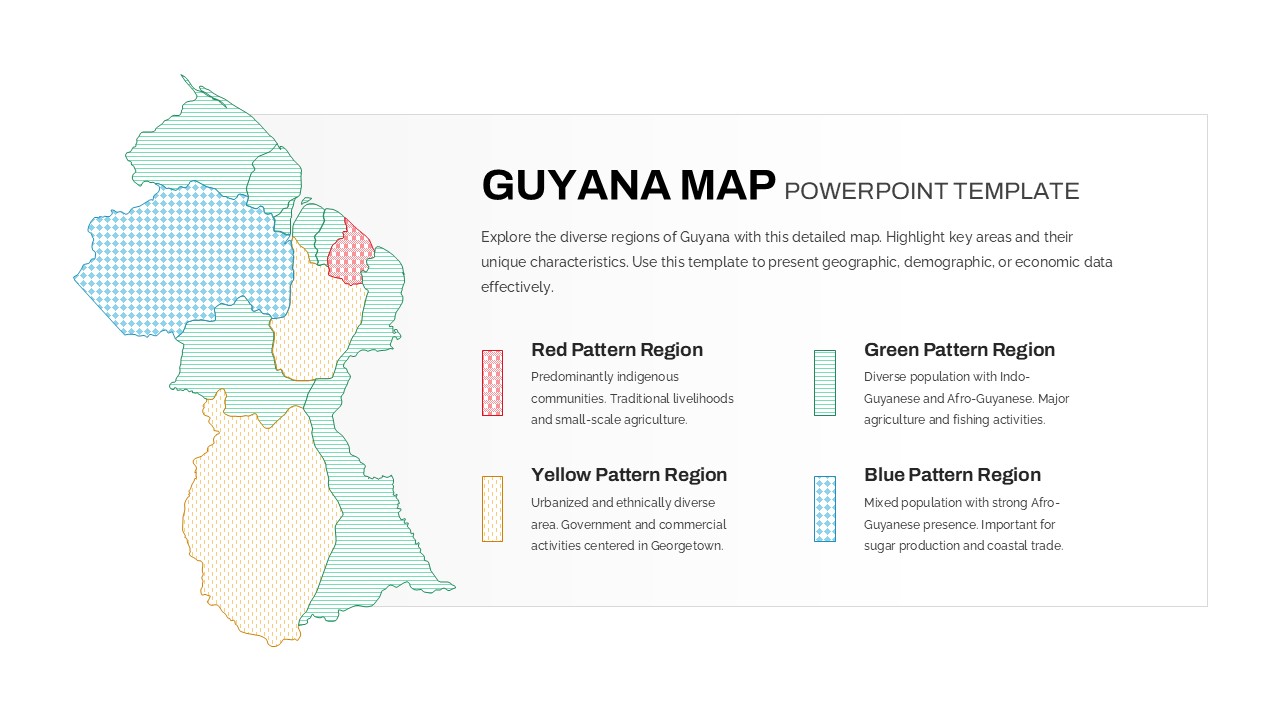
Patterned Guyana Regional Map Template for PowerPoint & Google Slides
World Maps
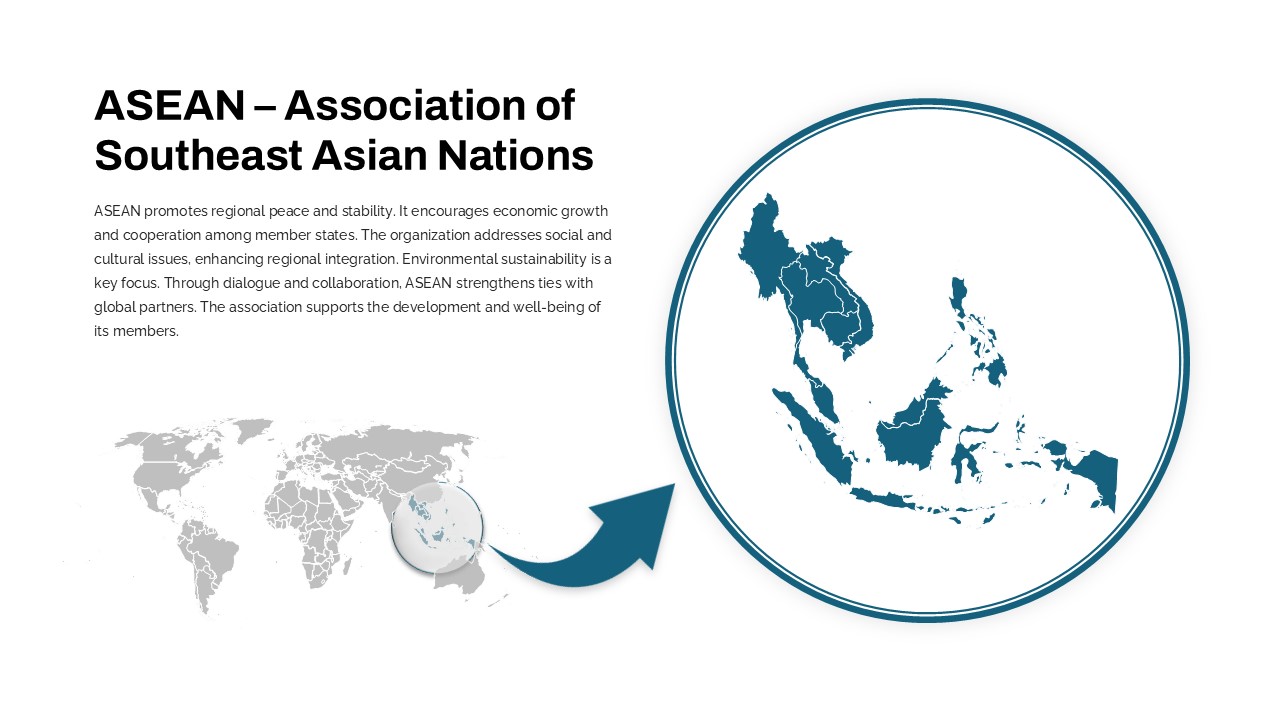
Professional ASEAN Region Zoom Map Slide Template for PowerPoint & Google Slides
World Maps
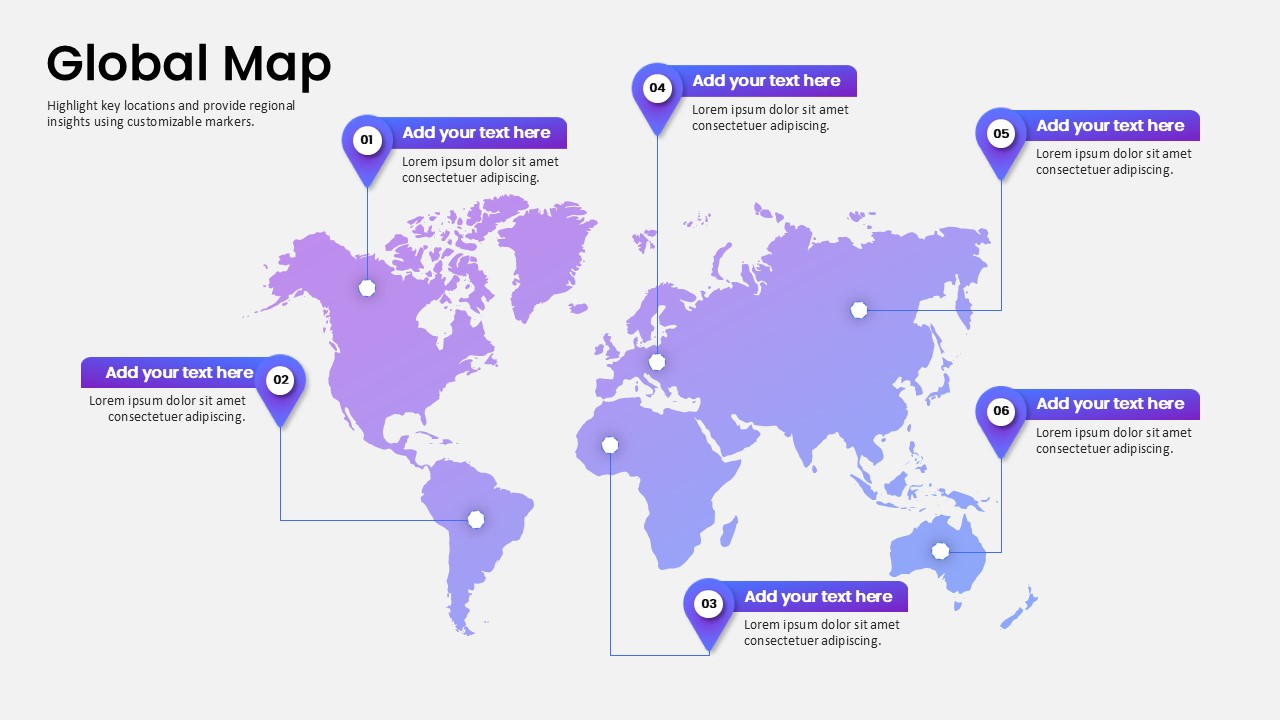
Global Map Highlighting Key Locations template for PowerPoint & Google Slides
World Maps
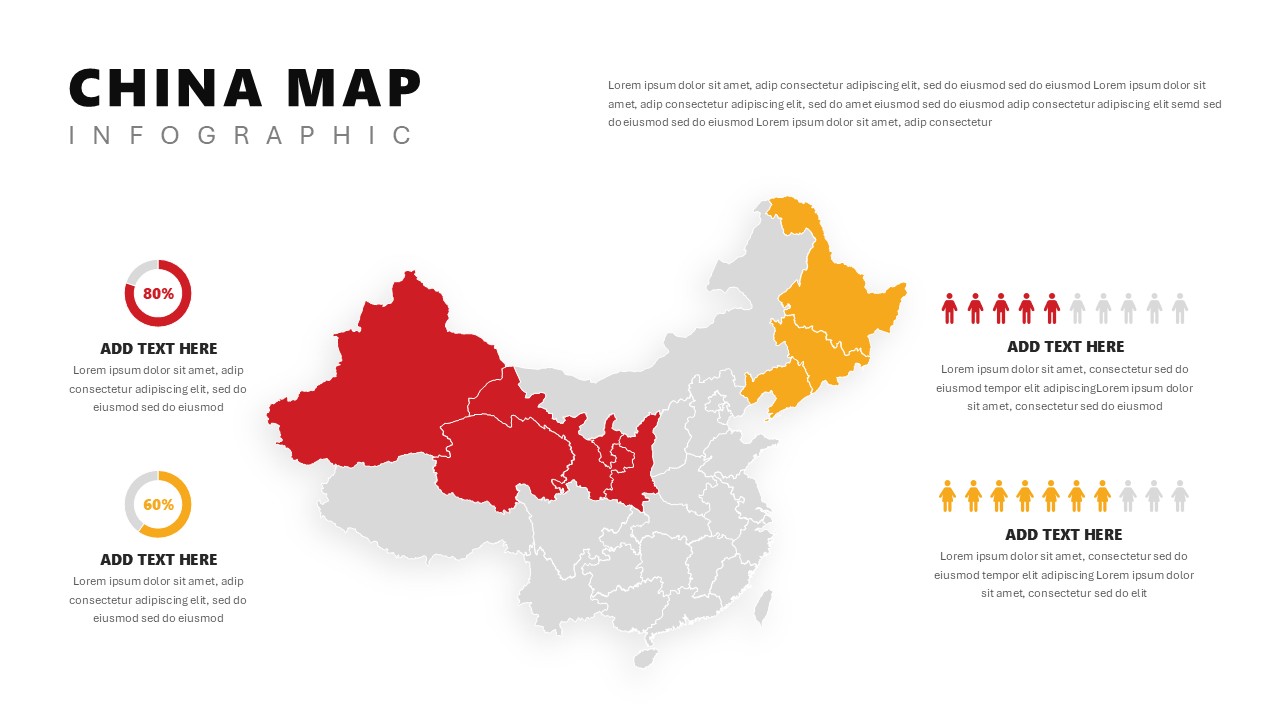
China Map Infographic Regional Stats Template for PowerPoint & Google Slides
World Maps
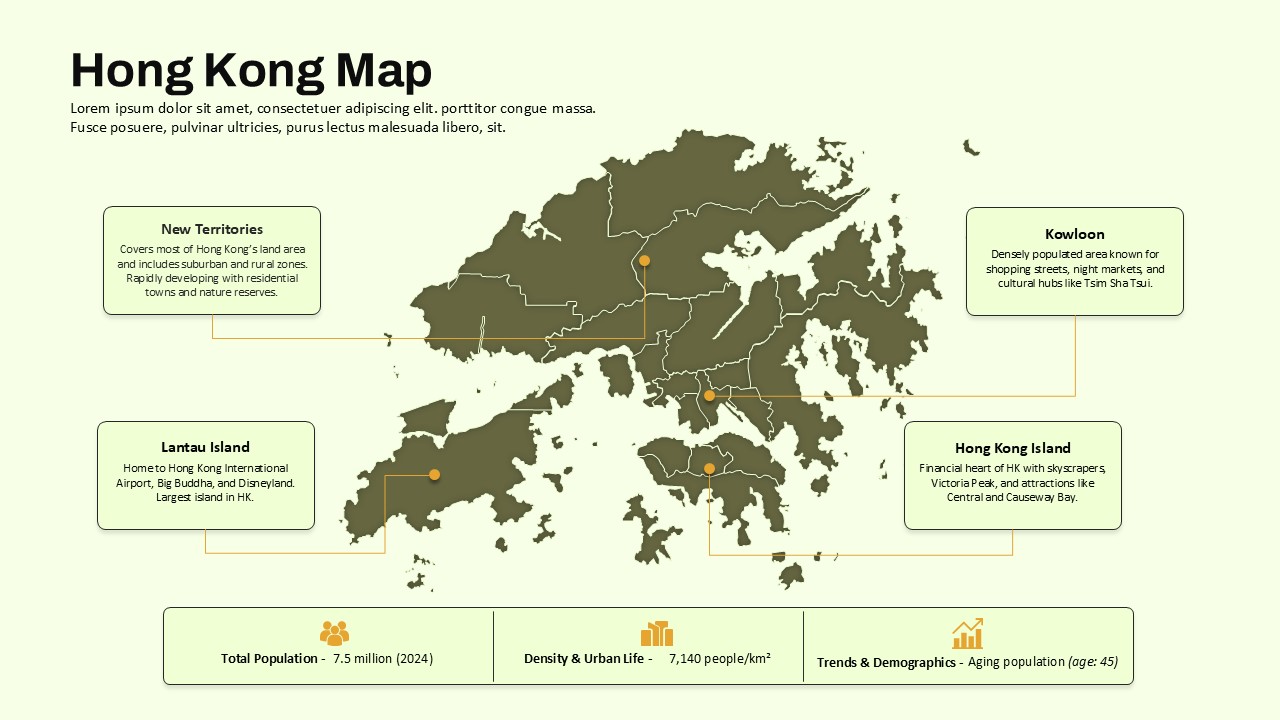
Hong Kong Geographic Map Infographic Template for PowerPoint & Google Slides
World Maps
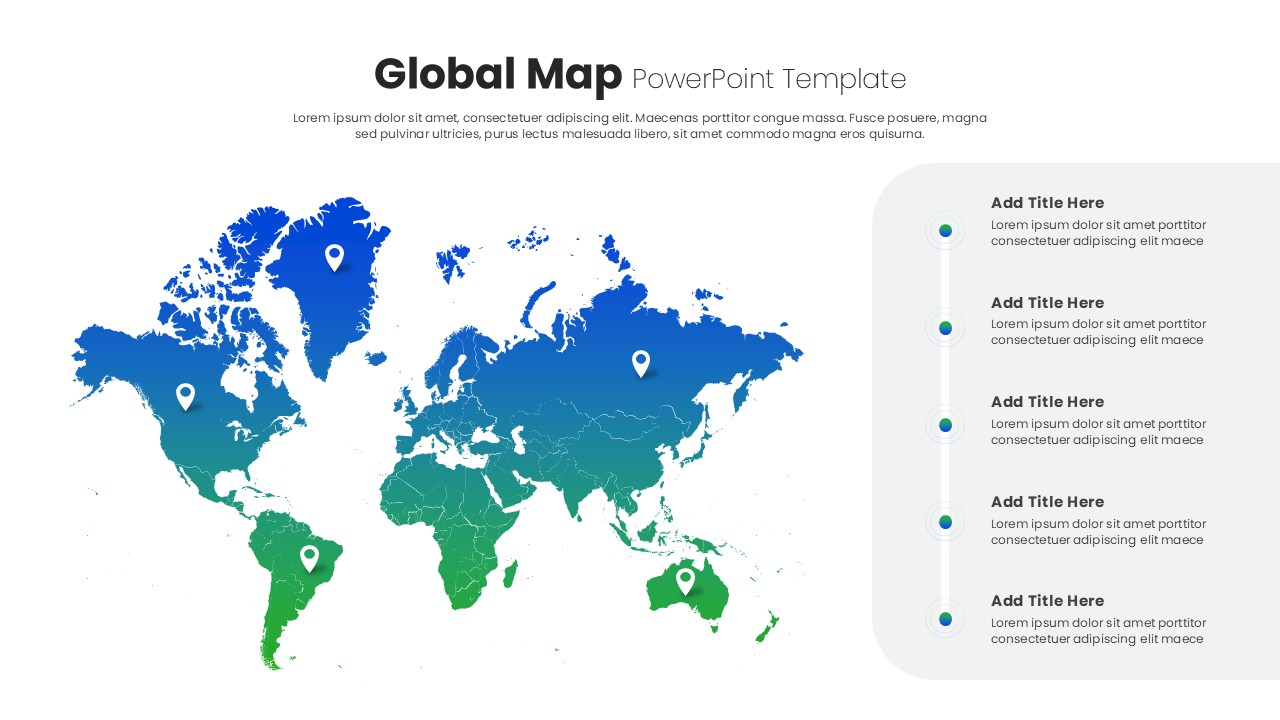
Global Map with Pinpoint Markers template for PowerPoint & Google Slides
Business
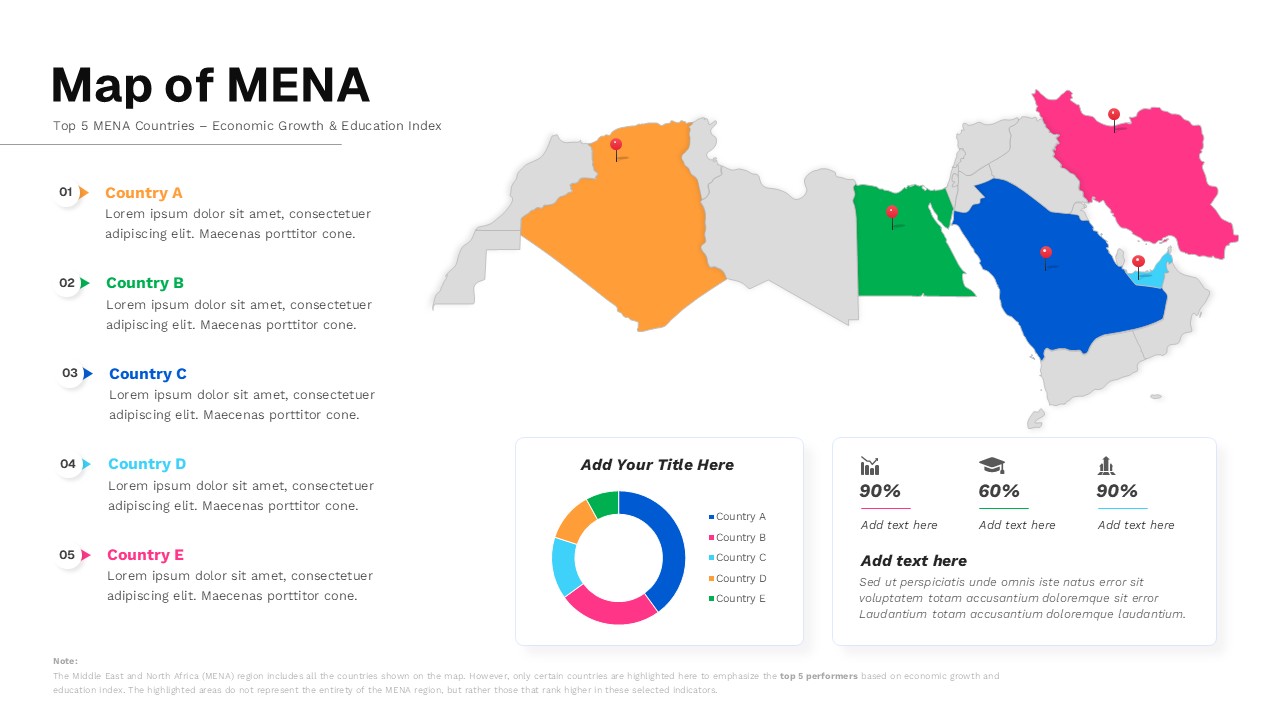
Map of MENA Infographic Template for PowerPoint & Google Slides
World Maps