Map of MENA Infographic Template for PowerPoint & Google Slides


Description
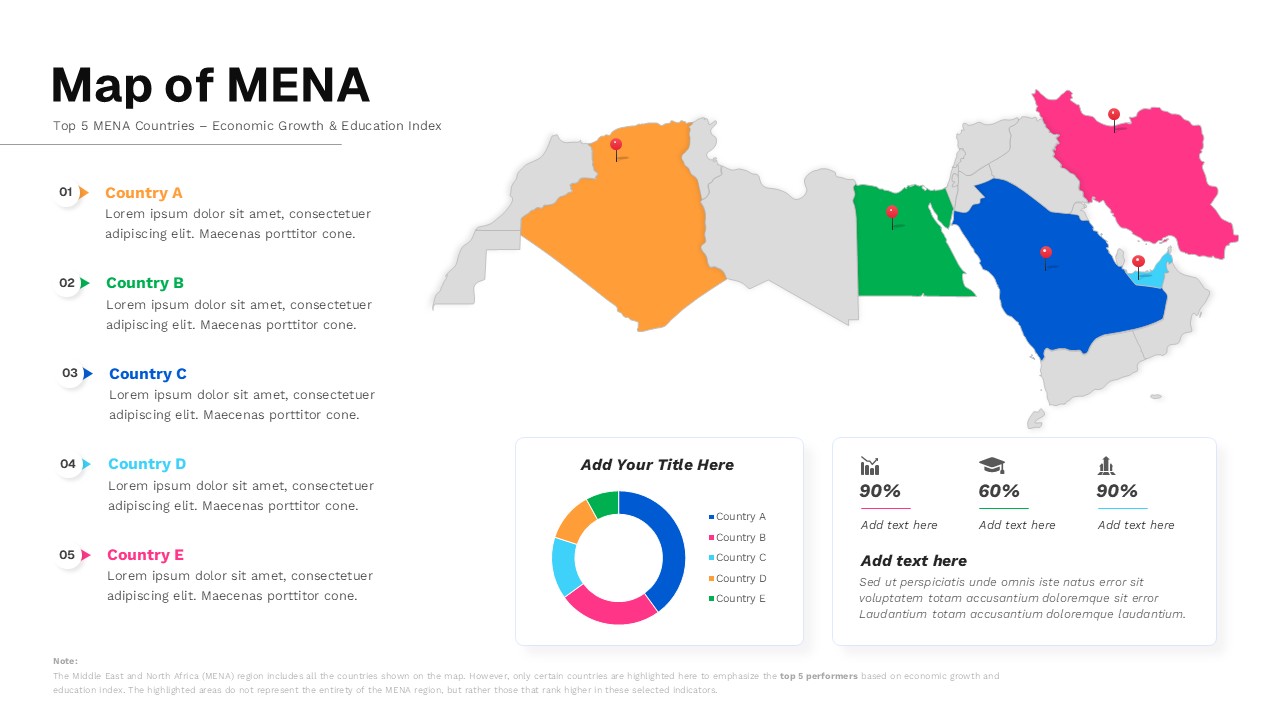
Showcase regional performance insights with this visually engaging Map of MENA infographic slide. Designed to highlight the top five Middle East and North Africa countries based on economic growth and education index metrics, this layout combines a color-coded regional map with supporting data visualizations. Each highlighted country is clearly marked and paired with descriptive text placeholders, enabling you to present comparative insights with clarity and precision.
The slide also features a donut chart for proportional comparison and KPI-style metric blocks to emphasize key statistics such as growth rates, literacy levels, or development indicators. Clean typography, balanced spacing, and distinct color differentiation ensure your audience can quickly interpret regional rankings and performance highlights. Fully editable map elements, labels, and charts allow you to customize country names, update data values, and align colors with your branding. Optimized for both PowerPoint and Google Slides, this infographic maintains professional formatting and visual consistency across devices.
Who is it for
This slide is ideal for economists, policy analysts, consultants, educators, and business strategists presenting regional development trends. Government agencies, research institutions, and investment firms can use it to communicate MENA market insights effectively.
Other Uses
Beyond economic growth analysis, repurpose this map slide for market expansion strategies, trade analysis, demographic comparisons, investment briefings, or regional education performance reviews. It also supports academic lectures and international business presentations.
Login to download this file

Item ID
SB05636Designed By
Filda
Related Templates

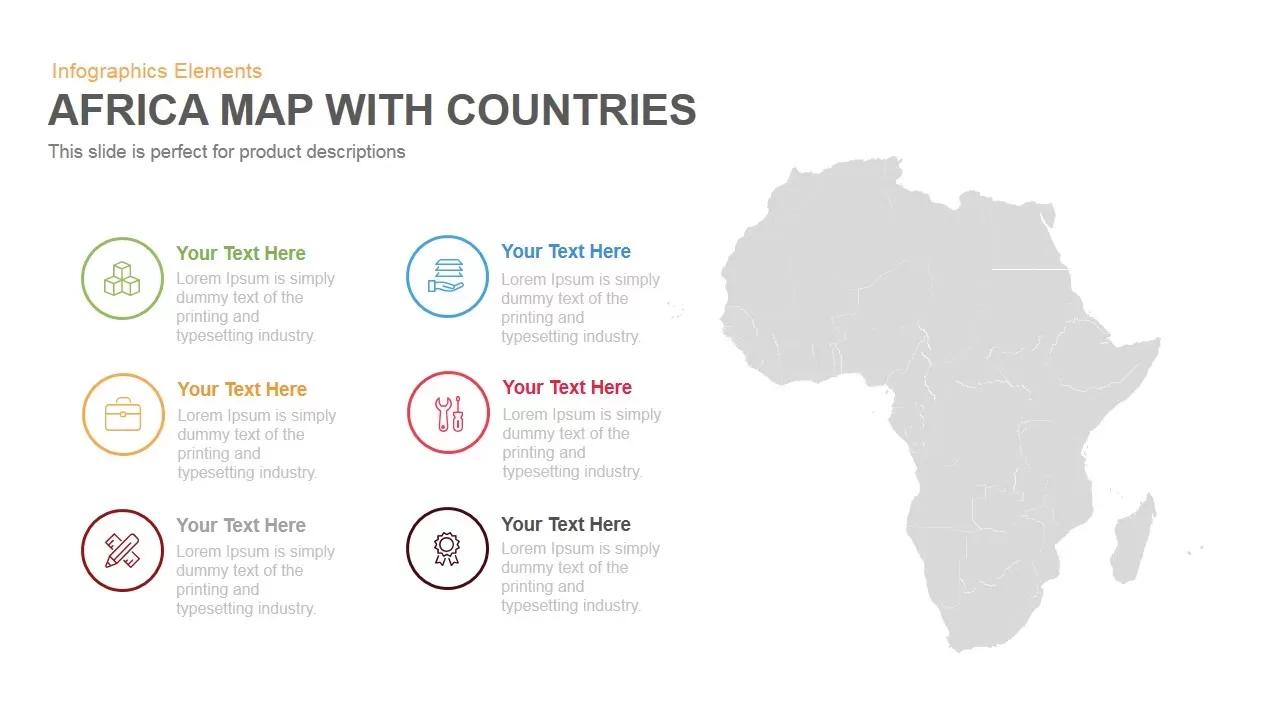
Africa Country Map Infographic Template for PowerPoint & Google Slides
World Maps
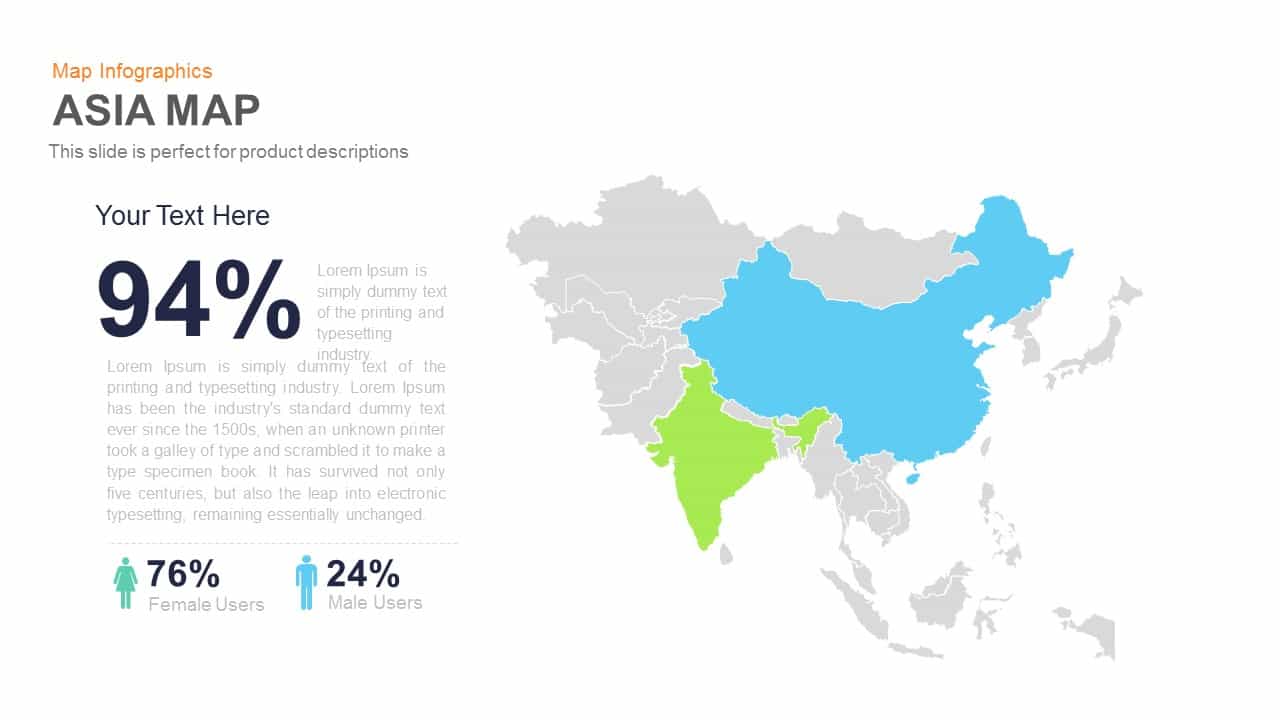
Asia Map Infographic with Demographics template for PowerPoint & Google Slides
World Maps
Curved Roadmap Concept for PowerPoint and Google Slides
Roadmap

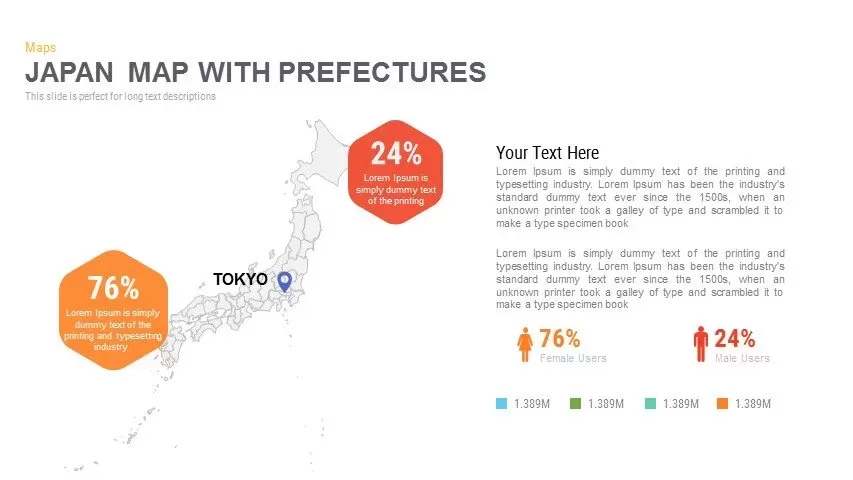
Japan Province Map Infographic Template for PowerPoint & Google Slides
Maps
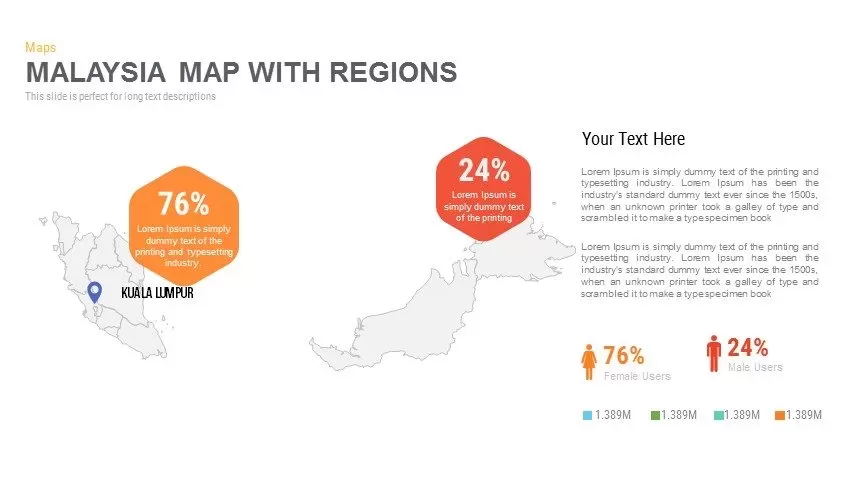
Malaysia Regional Map Infographic Template for PowerPoint & Google Slides
Maps
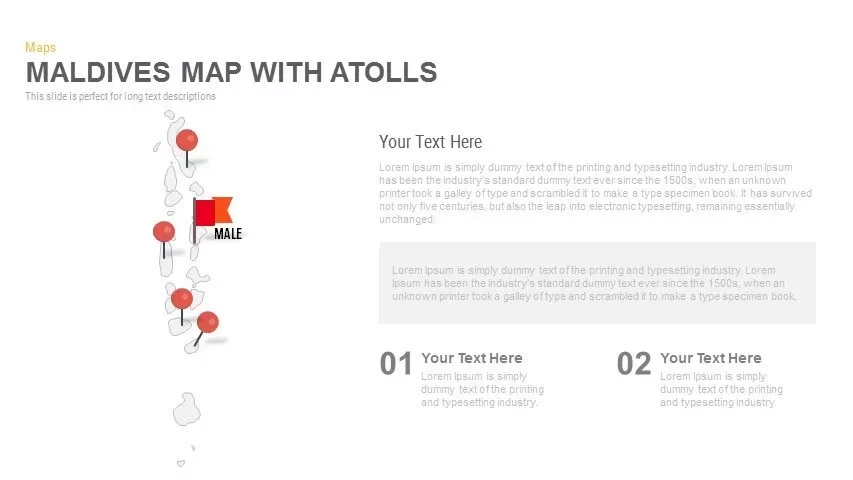
Maldives Map Infographic Template for PowerPoint & Google Slides
Maps
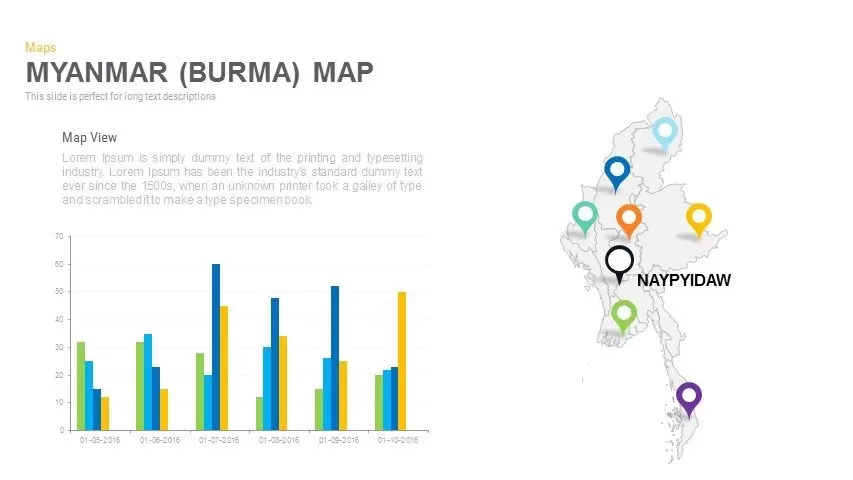
Myanmar (Burma) Provincial Map Infographic Template for PowerPoint & Google Slides
Maps
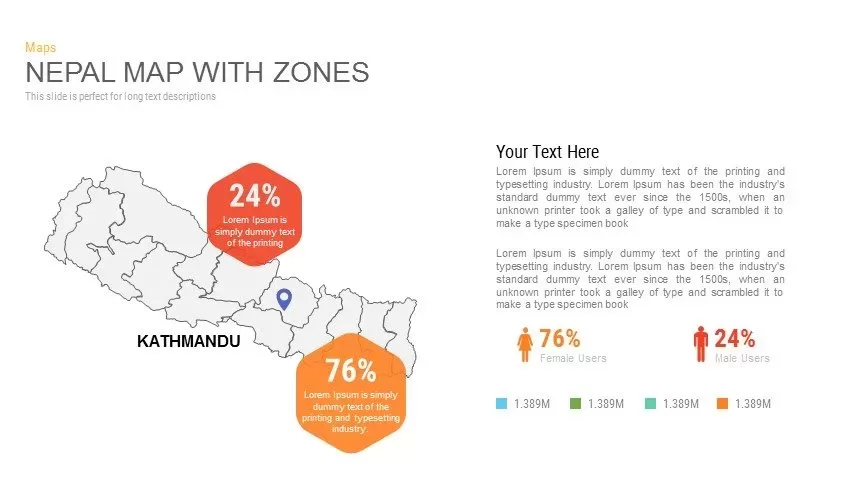
Nepal Map with Zones Infographic Template for PowerPoint & Google Slides
Maps
North Korea Map with Provinces Infographic Pack Template for PowerPoint & Google Slides
Maps
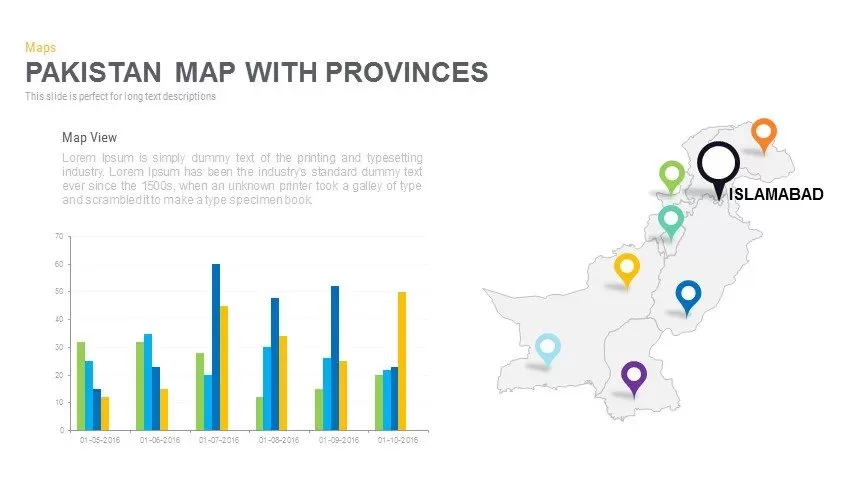
Pakistan Provinces Map Infographic Pack Template for PowerPoint & Google Slides
Maps
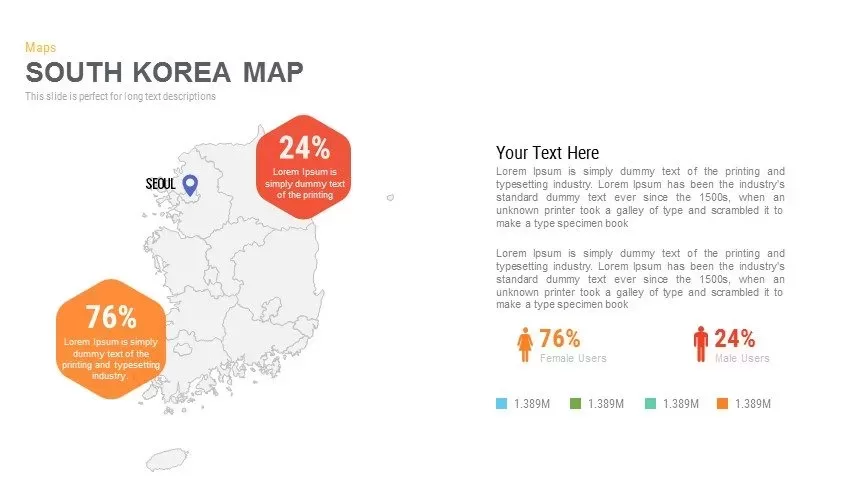
Infographic South Korea Map Template for PowerPoint & Google Slides
Maps
Sri Lanka Map Infographic Pack Template for PowerPoint & Google Slides
Maps
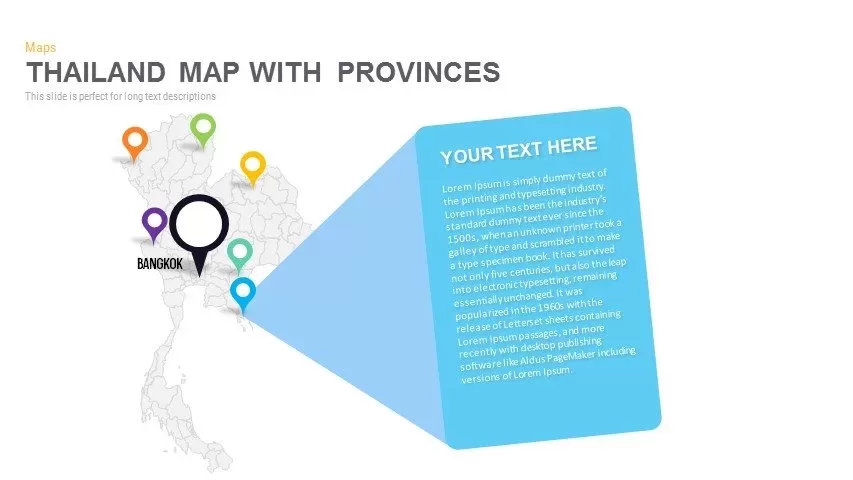
Thailand Provinces Map Infographic Pack Template for PowerPoint & Google Slides
Maps
Vietnam Provinces Map Infographic Pack Template for PowerPoint & Google Slides
Maps
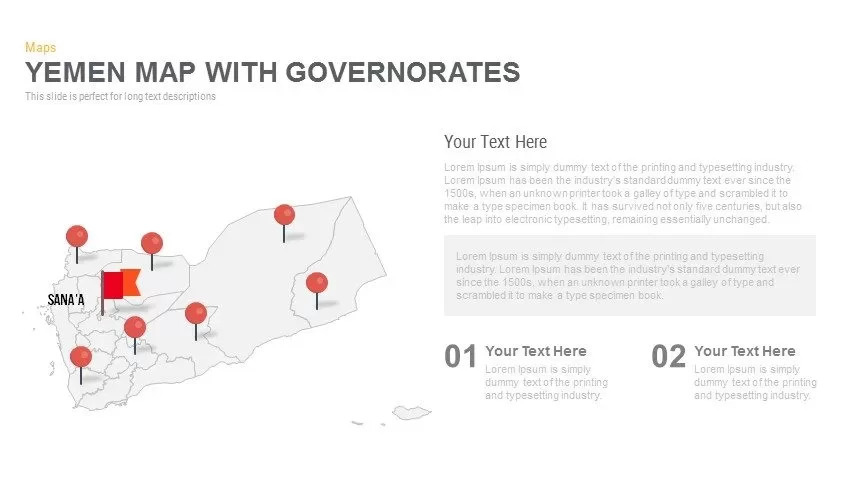
Yemen Governorates Infographic Map Template for PowerPoint & Google Slides
Maps

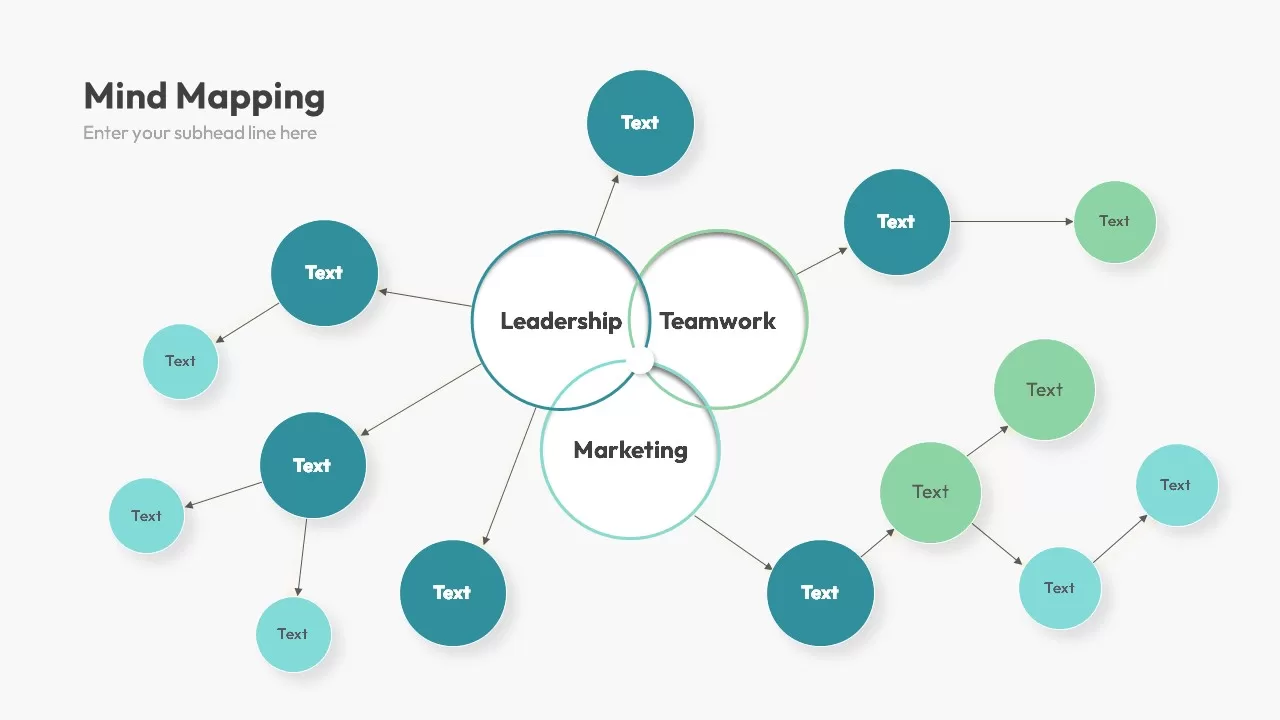
Multi-Cluster Mind Map Infographic Template for PowerPoint & Google Slides
Mind Maps
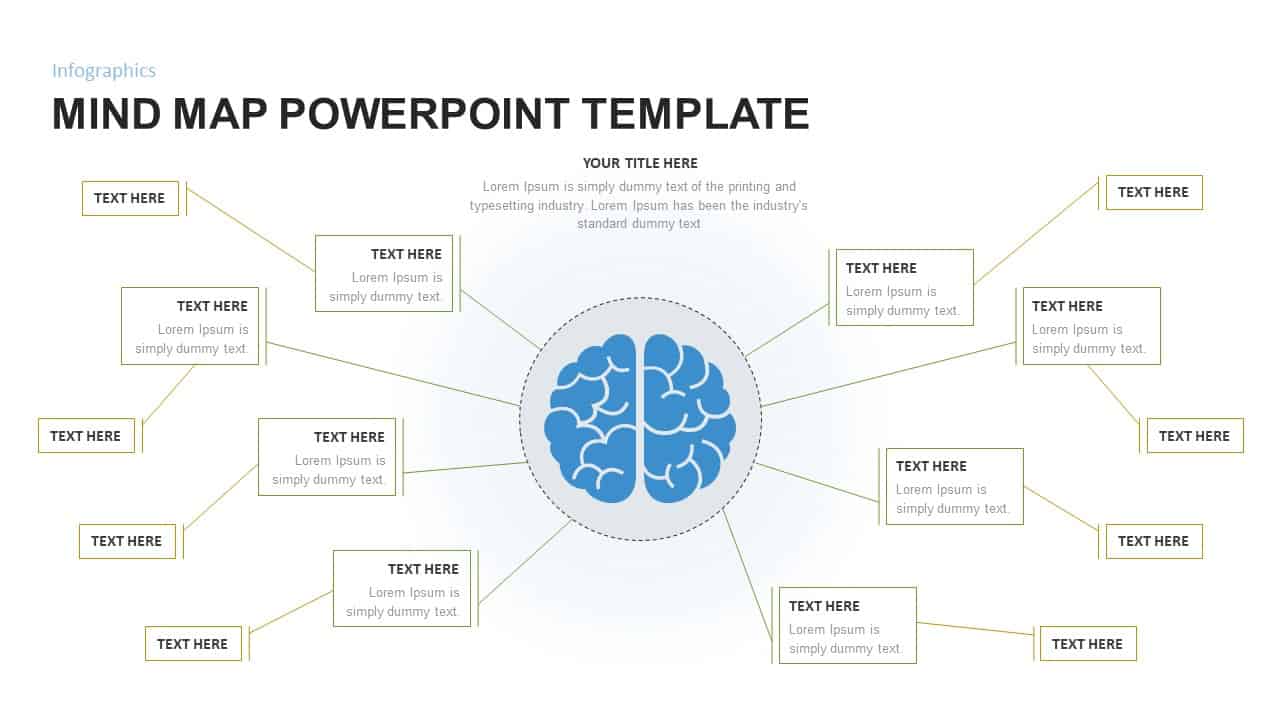
Mind Map PowerPoint Template and Google Slides
Mind Maps
Colorful Mind Map Infographic Template for PowerPoint & Google Slides
Mind Maps
Mind Map Infographic Slide Template for PowerPoint & Google Slides
Mind Maps

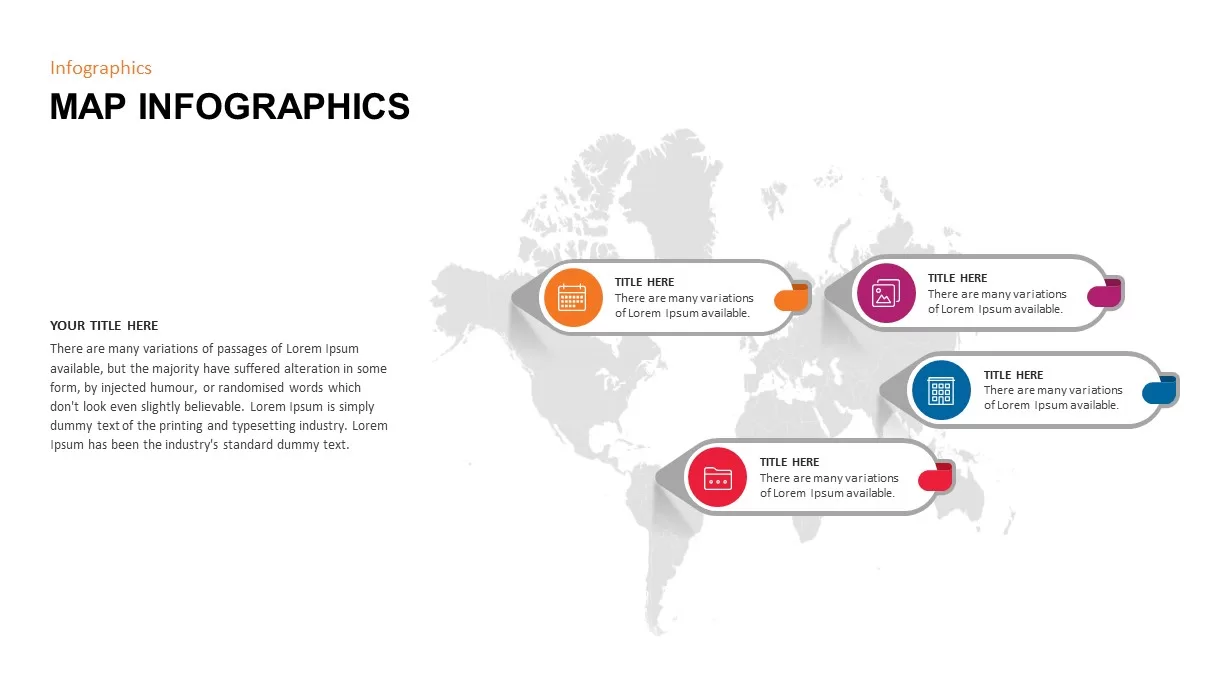
Modern World Map Callout Infographic Template for PowerPoint & Google Slides
World Maps
Eight-Node Mind Map Infographic Diagram Template for PowerPoint & Google Slides
Mind Maps
Six-Stage Road Map Infographic Timeline Template for PowerPoint & Google Slides
Roadmap
Versatile Mind Map Infographic Template for PowerPoint & Google Slides
Mind Maps
Structured Mind Map Infographic Diagram Template for PowerPoint & Google Slides
Mind Maps
Dual Topic Mind Map Infographic Template for PowerPoint & Google Slides
Mind Maps
Tri-Cluster Mind Map Infographic Template for PowerPoint & Google Slides
Mind Maps
Fully Editable World Map Infographic Template for PowerPoint & Google Slides
World Maps
Editable World Map Callout Infographic Template for PowerPoint & Google Slides
World Maps
Editable World Map Callout Infographic Template for PowerPoint & Google Slides
World Maps
North America Percentage Map Infographic Template for PowerPoint & Google Slides
World Maps
North America Map Infographic Slide Template for PowerPoint & Google Slides
World Maps
Editable Africa Map Infographic Data Template for PowerPoint & Google Slides
World Maps
Editable Ireland Map Infographic Slide Template for PowerPoint & Google Slides
World Maps
Free
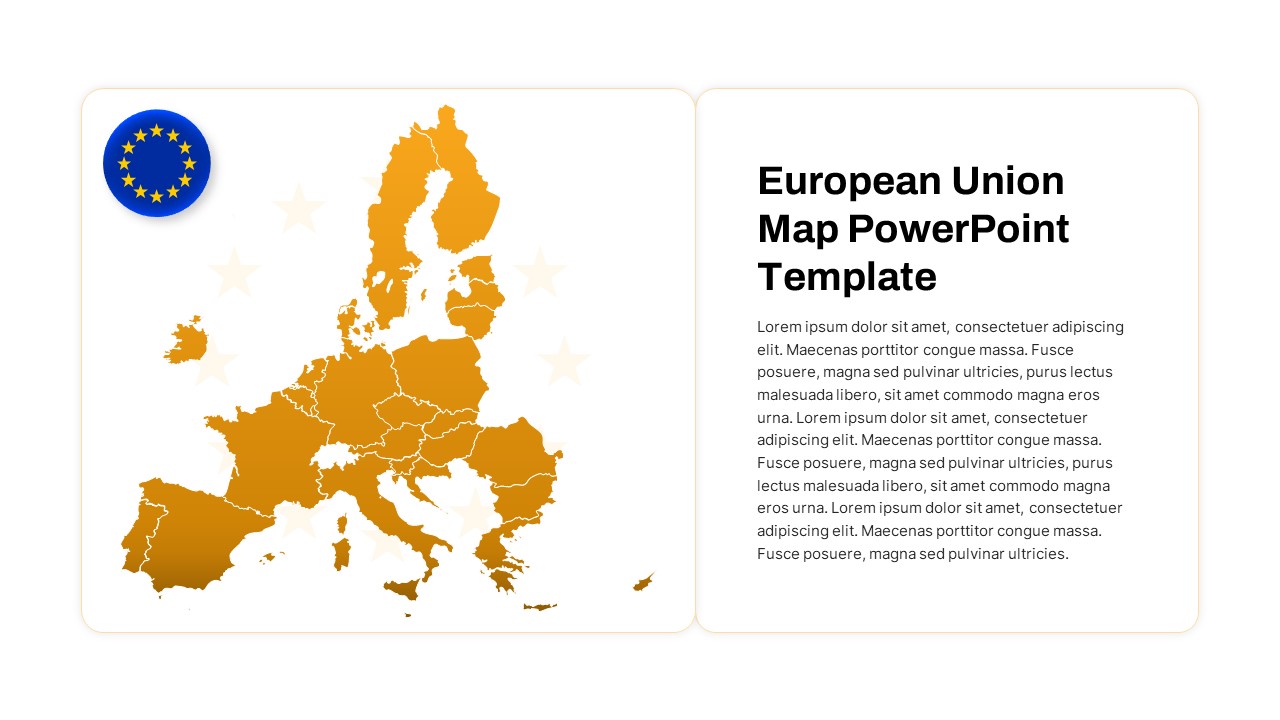
European Union Map Infographic Template for PowerPoint & Google Slides
World Maps
Syria Regional Data Map Infographic Template for PowerPoint & Google Slides
World Maps
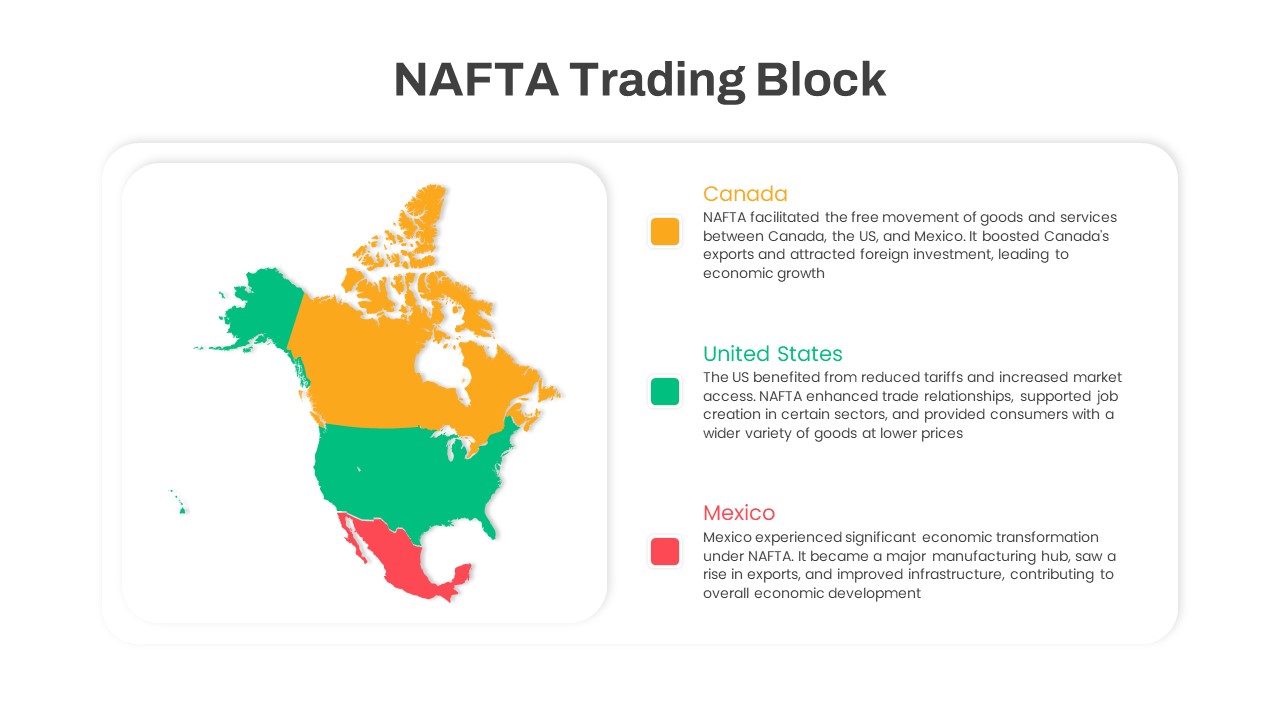
NAFTA Trading Block Map Infographic Template for PowerPoint & Google Slides
World Maps
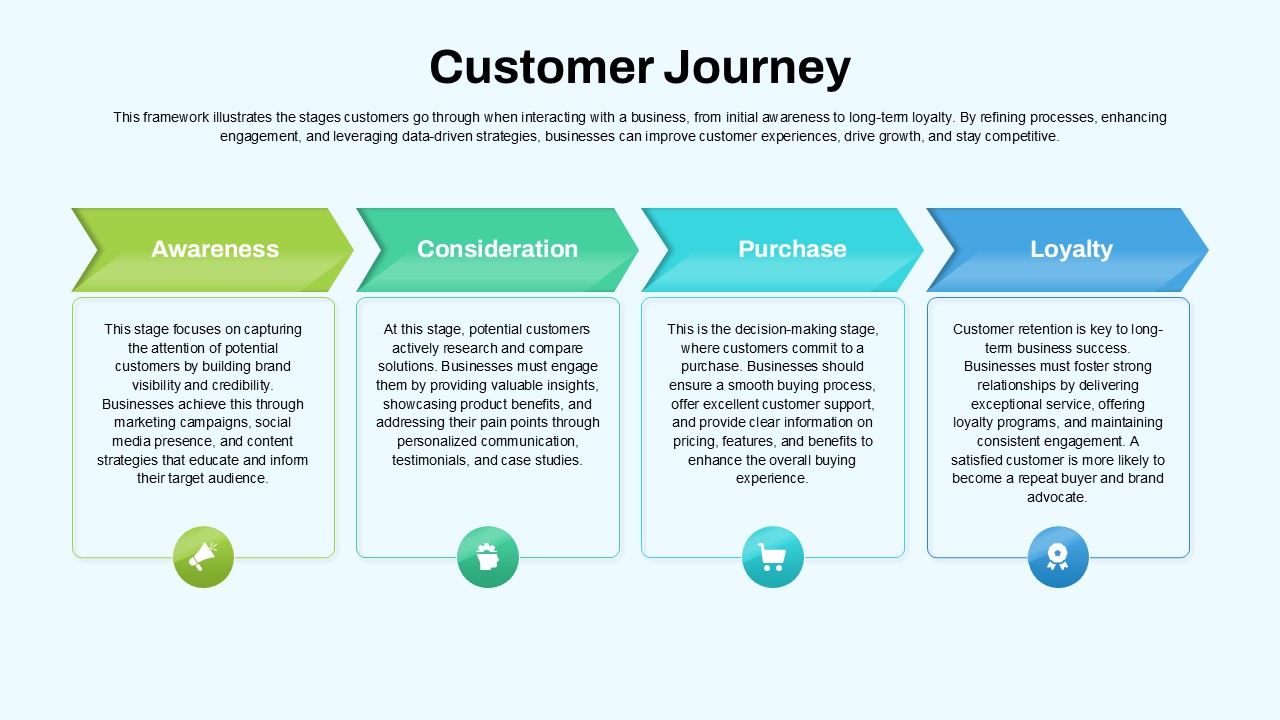
Customer Journey Process Map Infographic Template for PowerPoint & Google Slides
Customer Journey
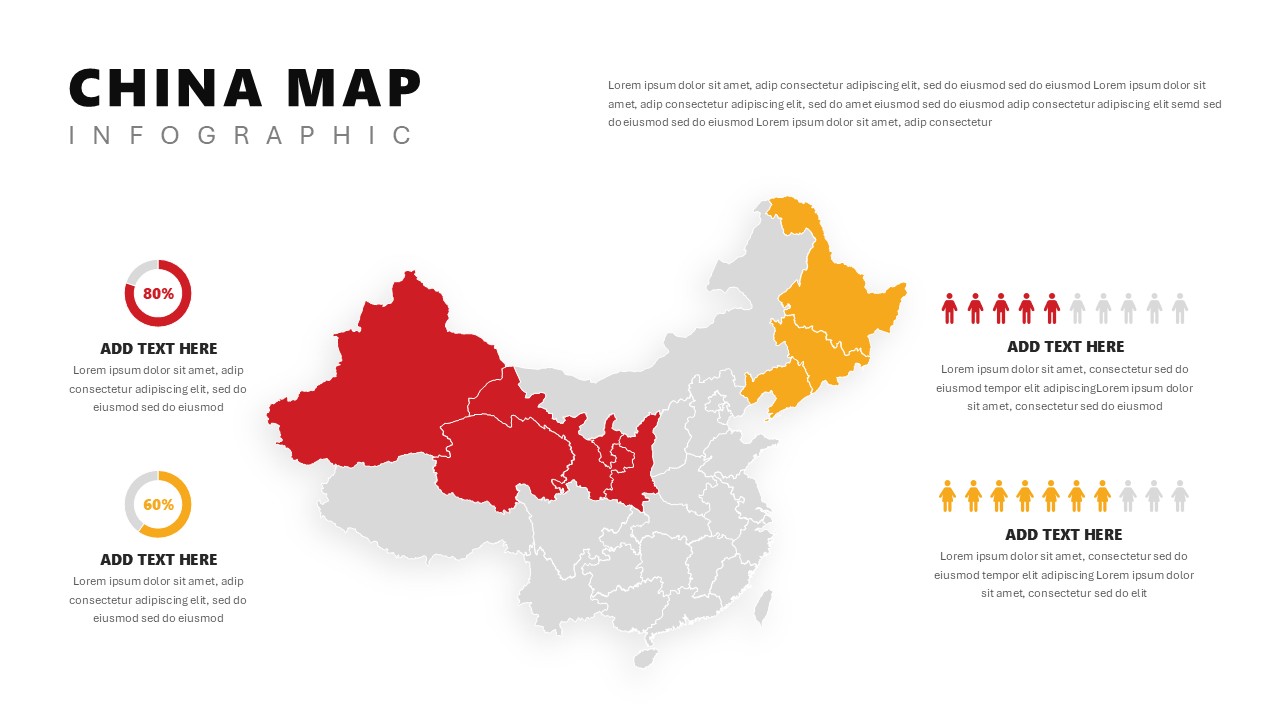
China Map Infographic Regional Stats Template for PowerPoint & Google Slides
World Maps
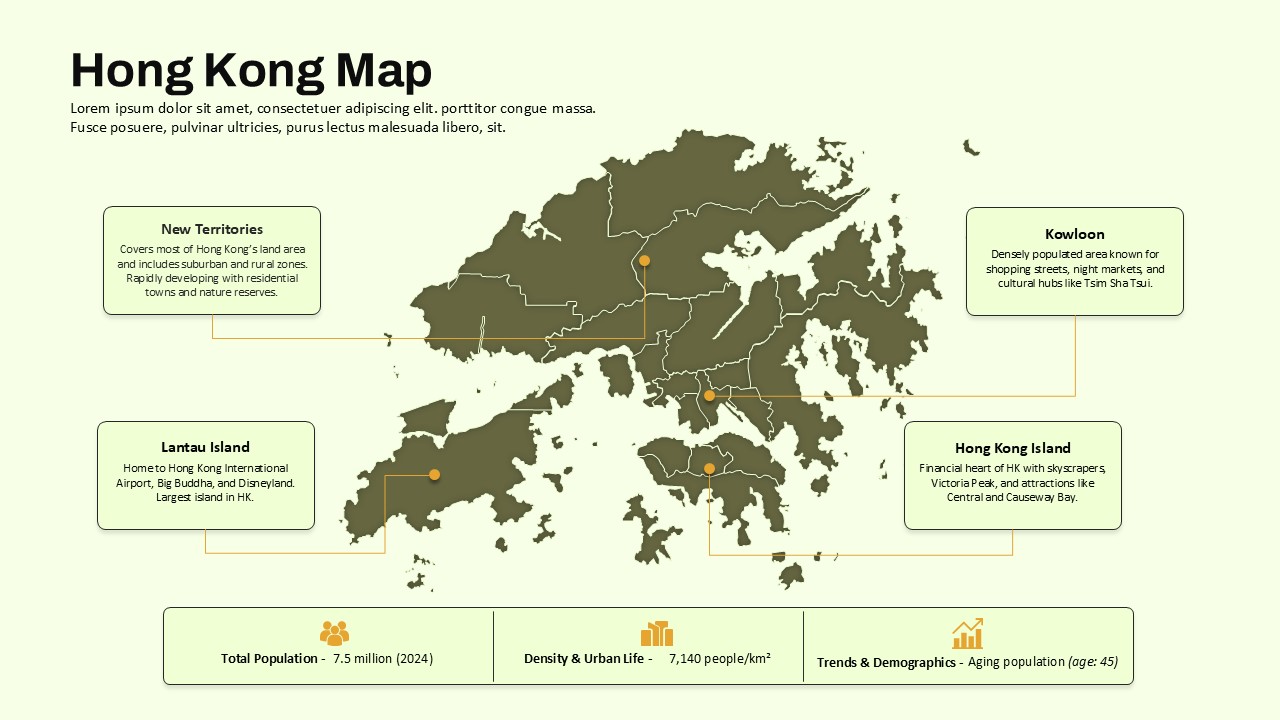
Hong Kong Geographic Map Infographic Template for PowerPoint & Google Slides
World Maps

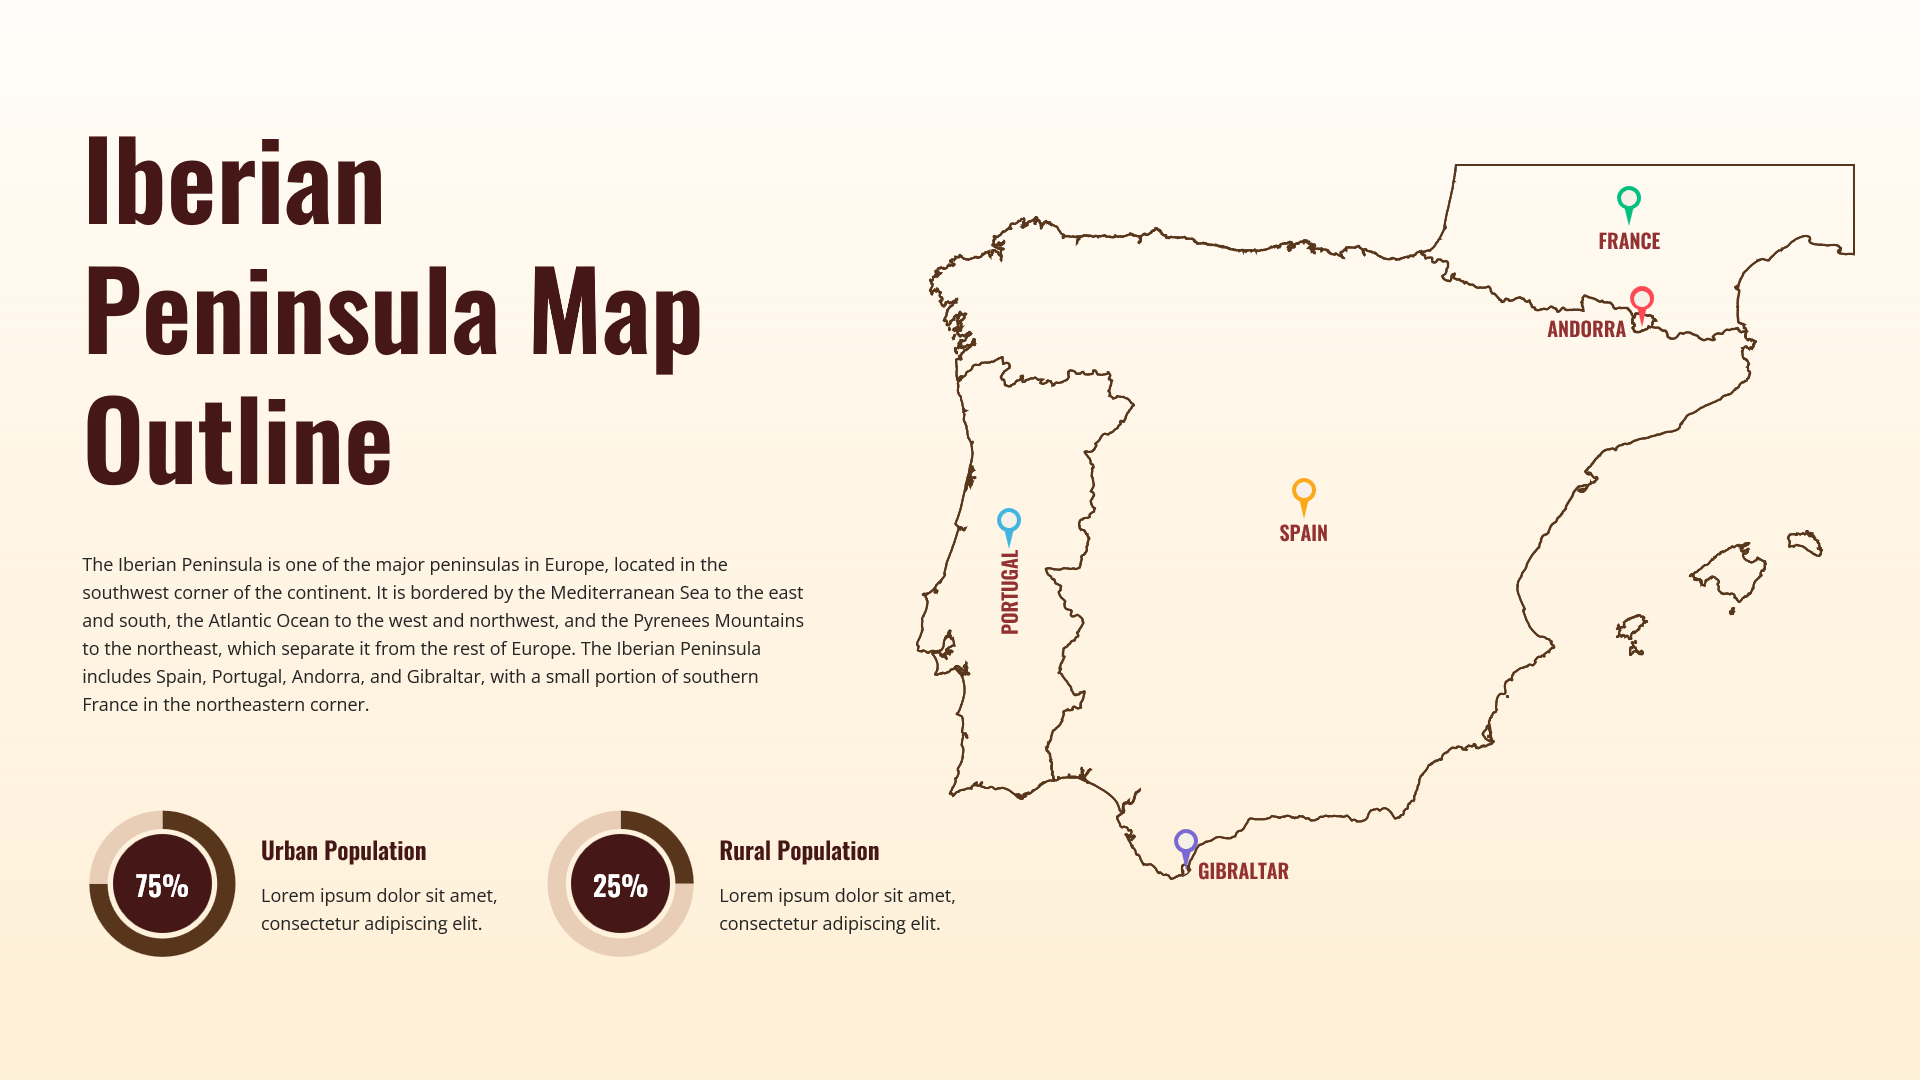
Iberian Peninsula Map Outline Infographic Template for PowerPoint & Google Slides
World Maps
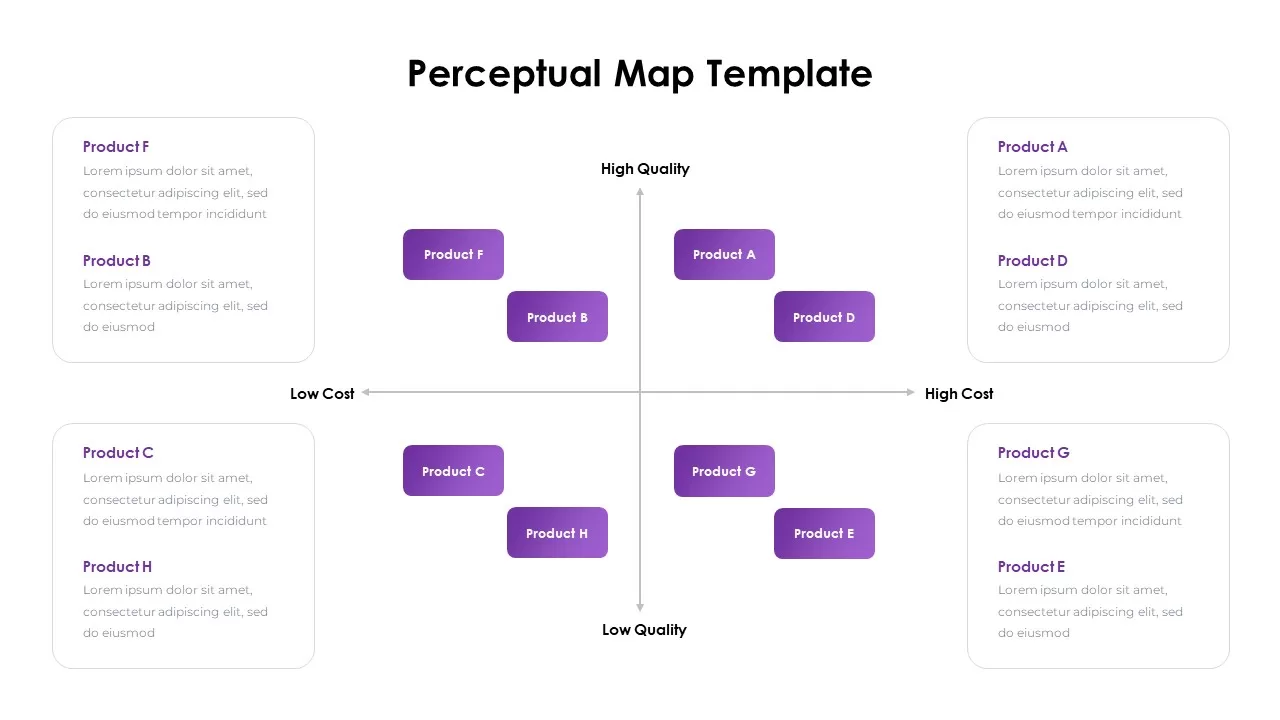
Perceptual Map infographic for PowerPoint & Google Slides
Competitor Analysis
Mind Map PowerPoint template for PowerPoint & Google Slides
Mind Maps
Editable Colombia Map PowerPoint Template for PowerPoint & Google Slides
Business Models
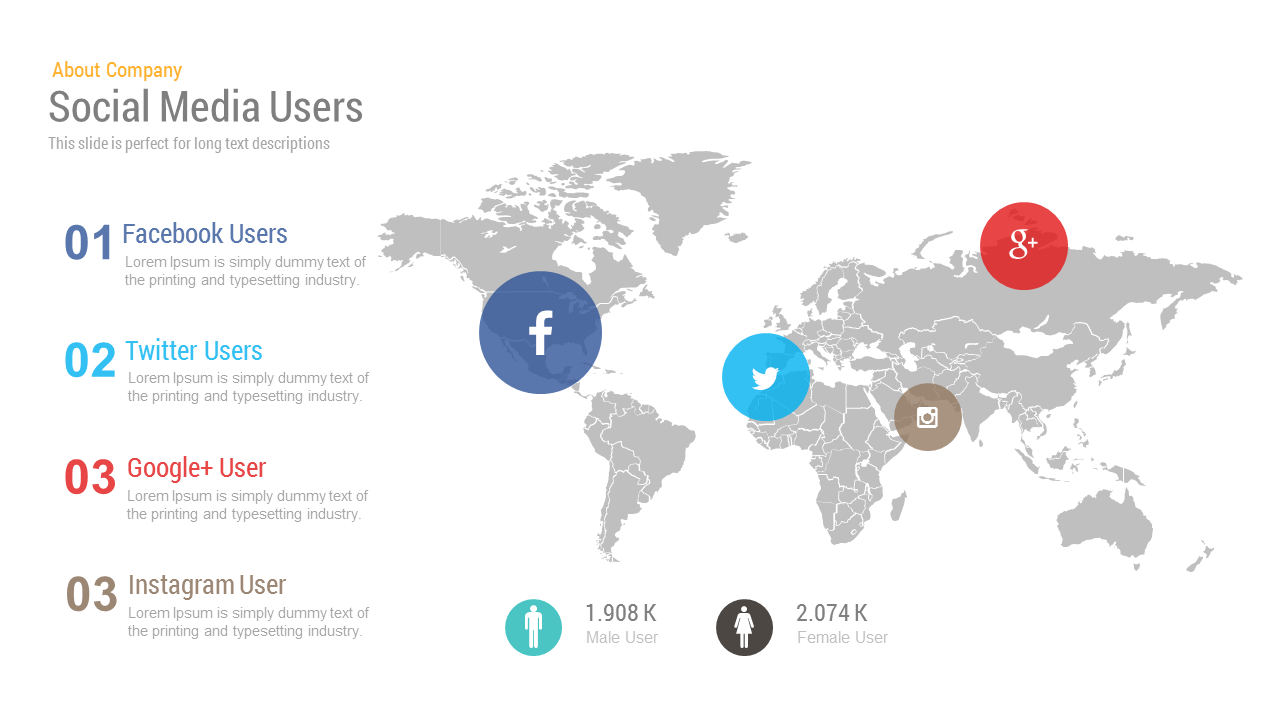
Free Editable Social Media Users Map Template for PowerPoint & Google Slides
World Maps
Free
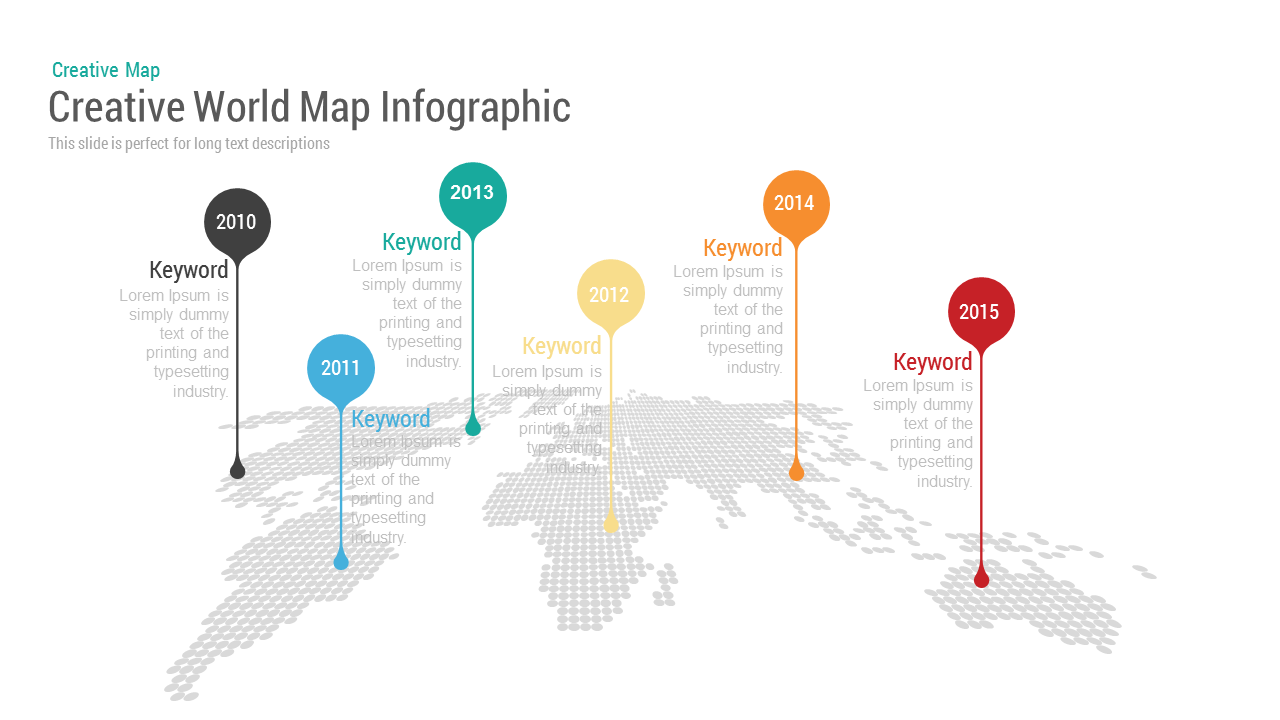
Creative World Map template for PowerPoint & Google Slides
World Maps
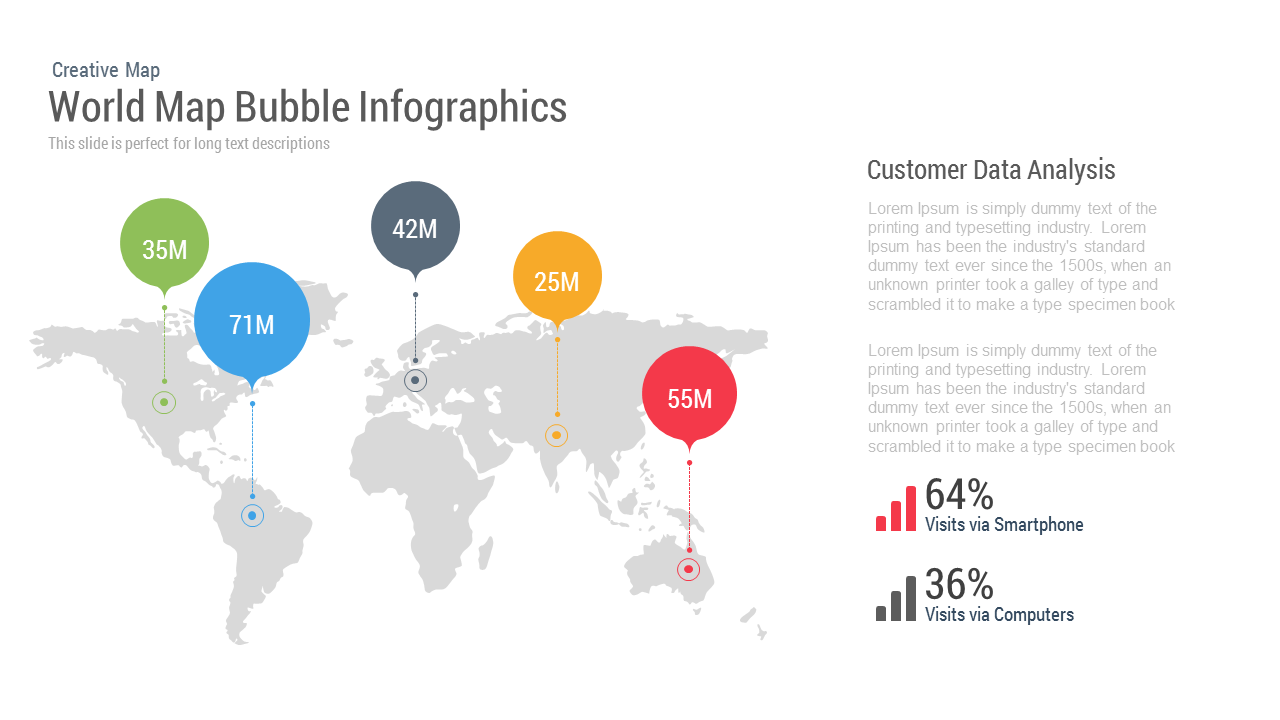
World Map Bubble template for PowerPoint & Google Slides
World Maps

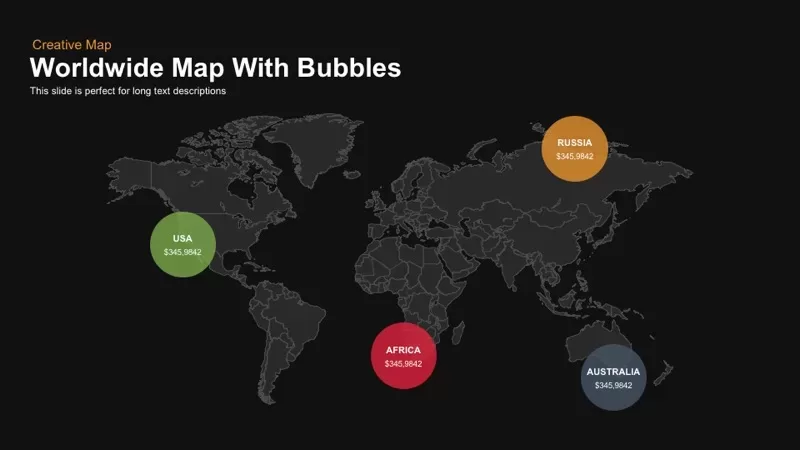
Worldwide Map with Bubbles template for PowerPoint & Google Slides
World Maps
Interactive US Population Data Map Slide Template for PowerPoint & Google Slides
World Maps
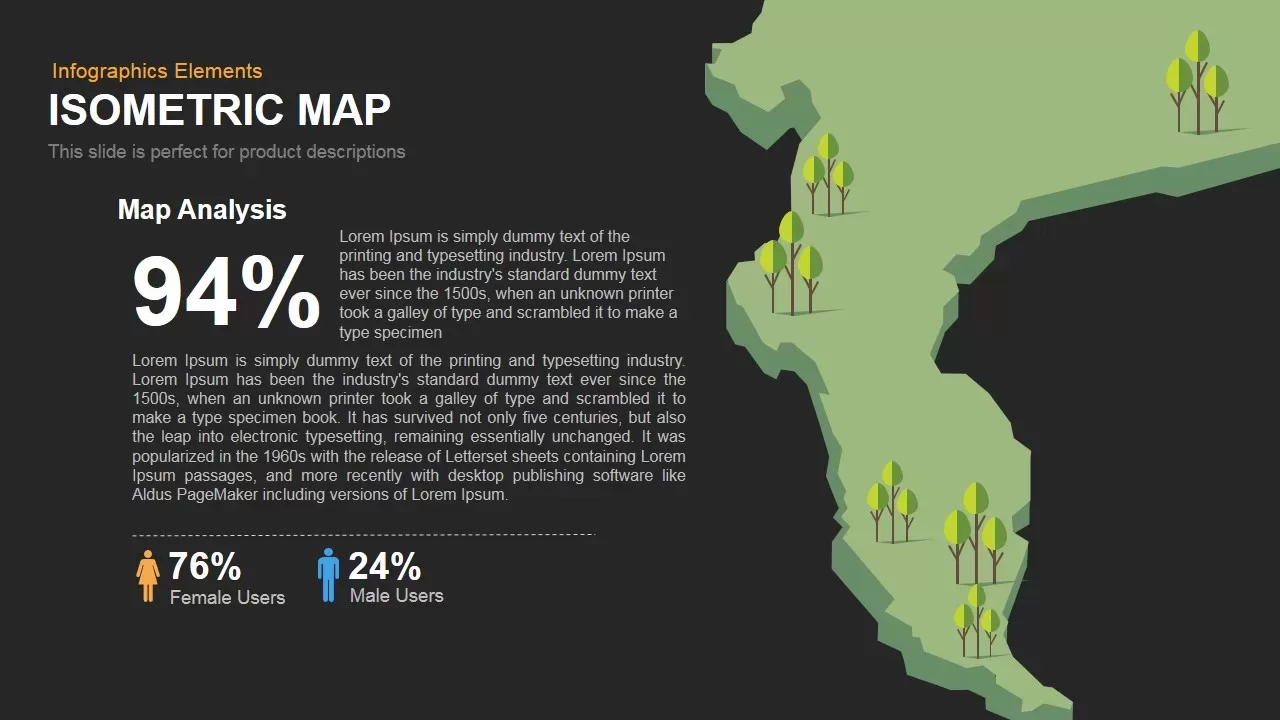
Isometric Map Analysis Slide Template for PowerPoint & Google Slides
World Maps
Asia Map with KPI Metrics and Legend Template for PowerPoint & Google Slides
World Maps
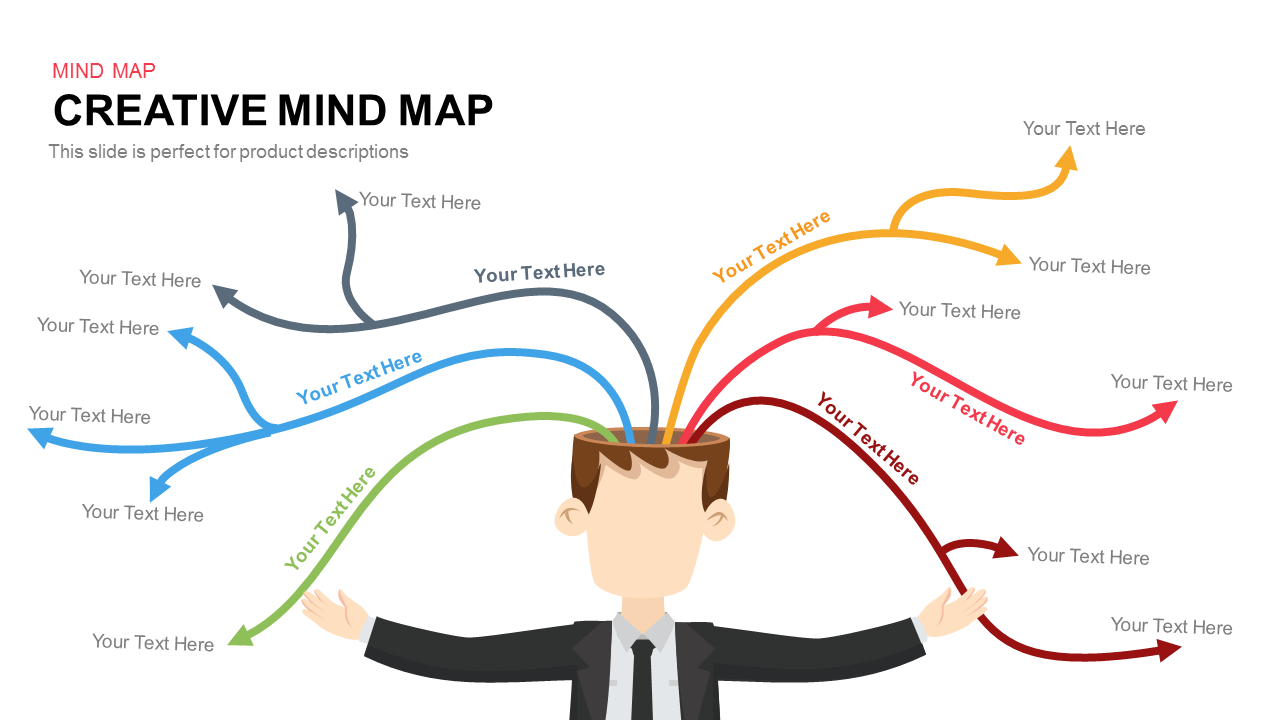
Creative Mind Map PowerPoint Template
Mind Maps
Simple Multi-Branch Mind Map Template for PowerPoint & Google Slides
Mind Maps
Customizable USA Map With State Markers Template for PowerPoint & Google Slides
World Maps
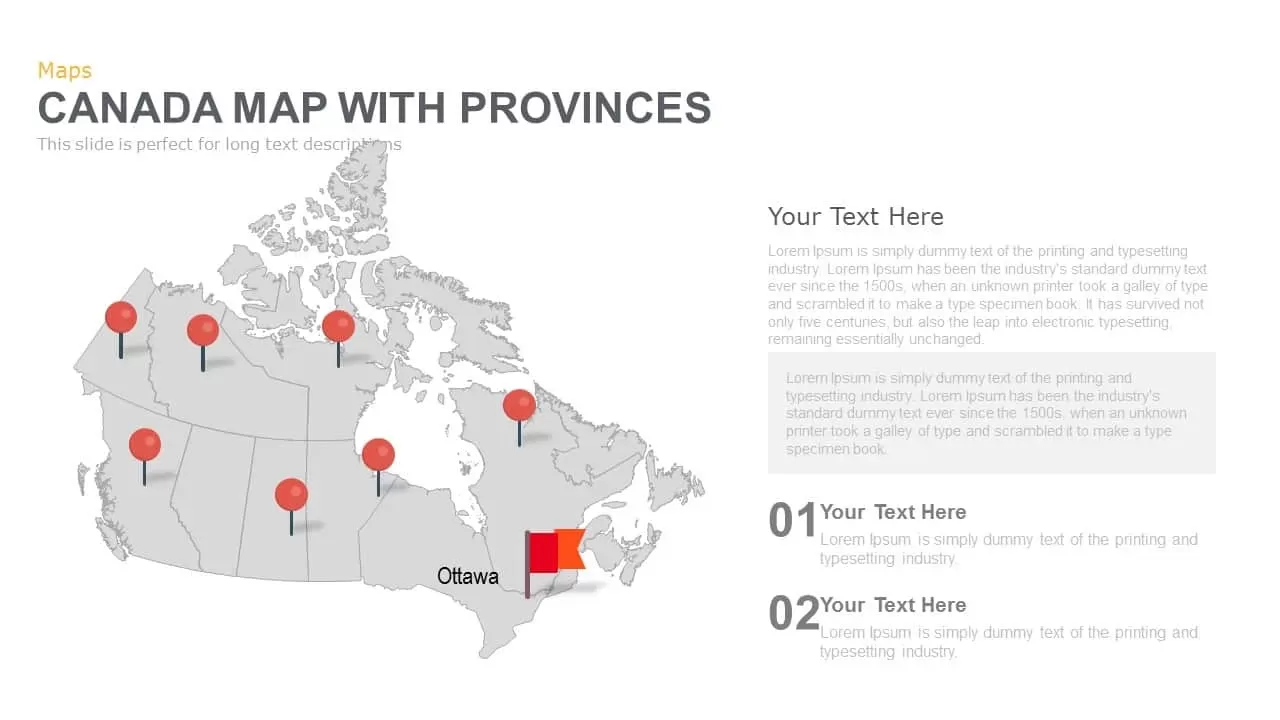
Canada Provinces Map Multi-Layout Template for PowerPoint & Google Slides
World Maps
Mexico Map With States Template for PowerPoint & Google Slides
World Maps
Argentina Map With Provinces For PowerPoint
World Maps
Panama Map with Region Markers Template for PowerPoint & Google Slides
World Maps
Venezuela Map with States and Regions Template for PowerPoint & Google Slides
World Maps
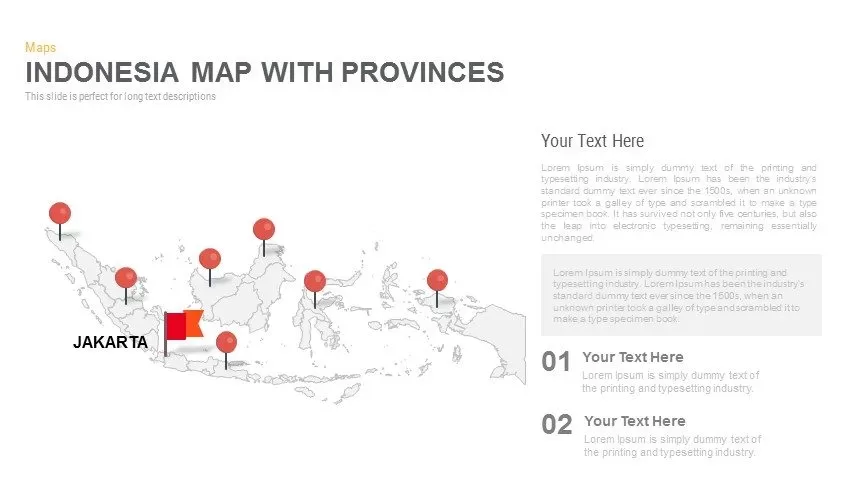
Indonesia Province Map Callout Slide Template for PowerPoint & Google Slides
Maps
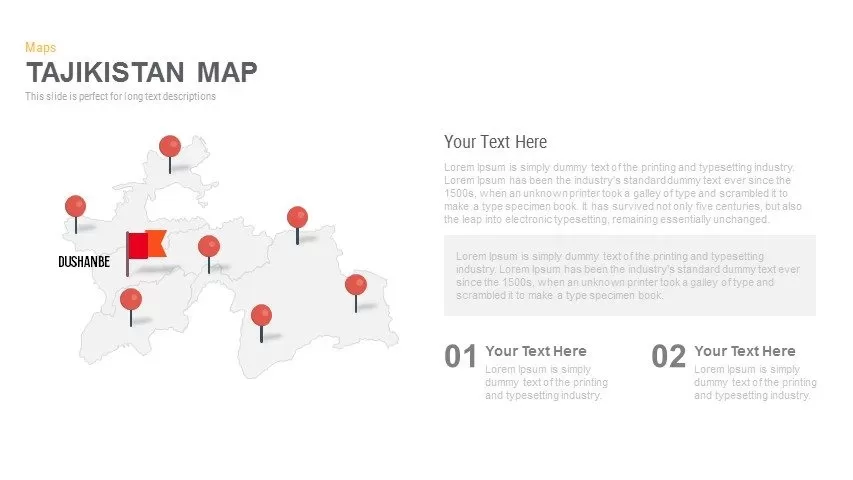
Editable Tajikistan Provinces Map Pack Template for PowerPoint & Google Slides
Maps
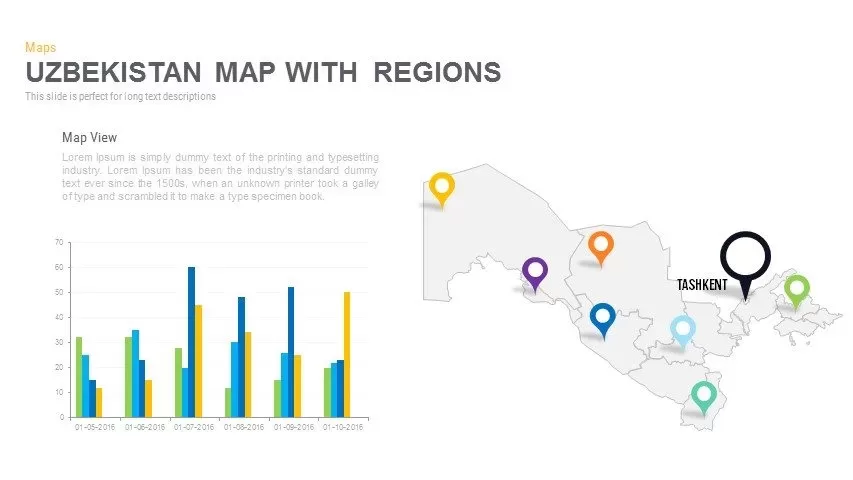
Uzbekistan Map with Regions Pack Template for PowerPoint & Google Slides
Maps
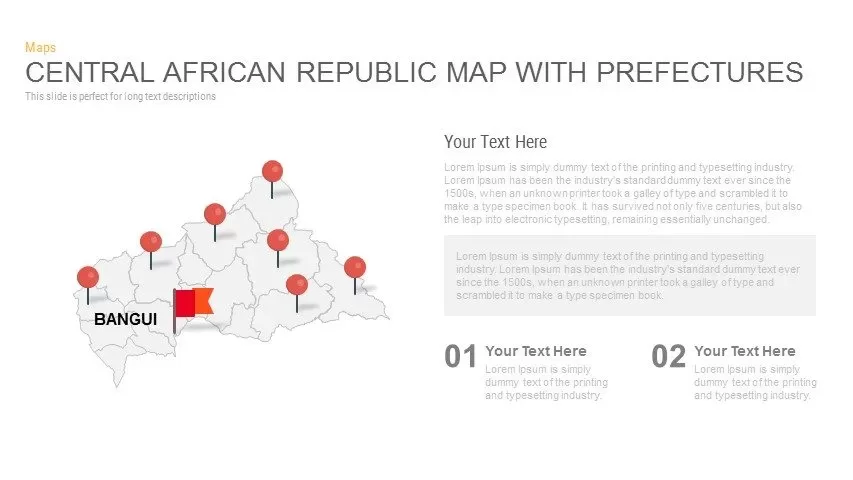
Central African Republic Prefectures Map Template for PowerPoint & Google Slides
World Maps
Chad Map with Regions Slide Pack Template for PowerPoint & Google Slides
World Maps
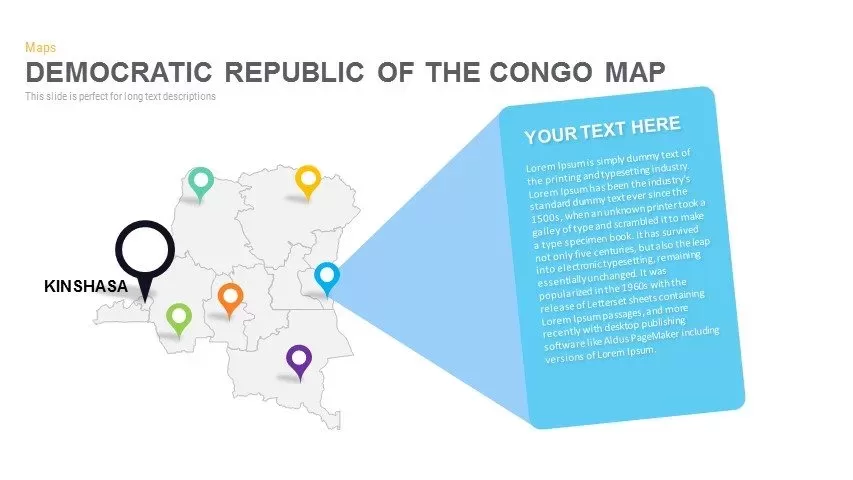
DR Congo Prefecture Map Slide Pack Template for PowerPoint & Google Slides
World Maps
Egypt Regional Map Slide Pack Template for PowerPoint & Google Slides
World Maps
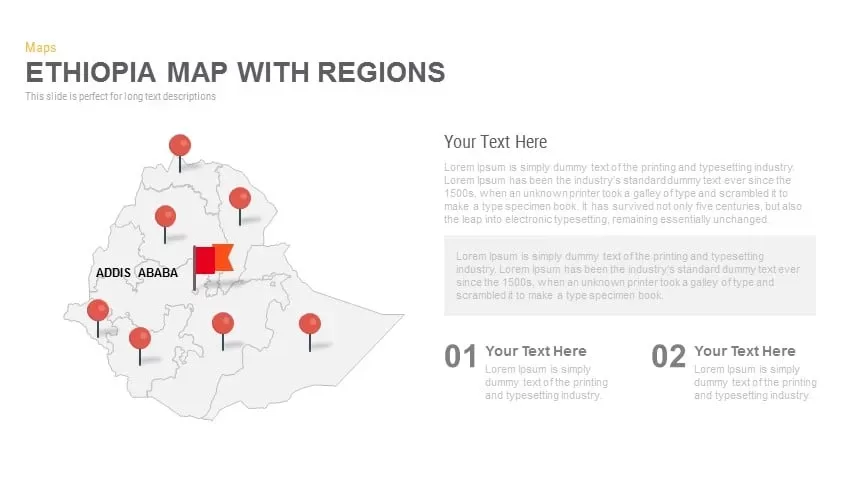
Ethiopia Map with Regions Slide Pack Template for PowerPoint & Google Slides
World Maps

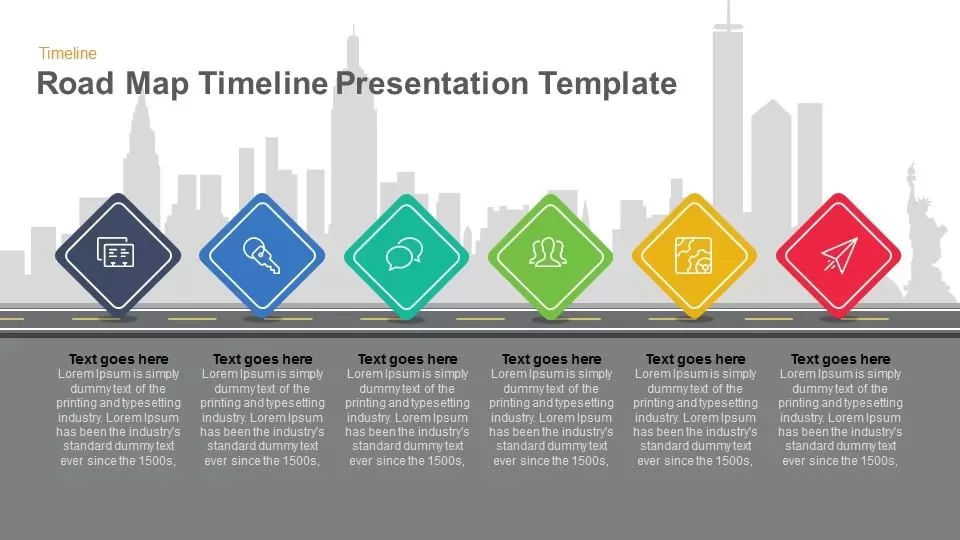
Road Map Timeline Presentation template for PowerPoint & Google Slides
Roadmap
Four Staged Road Map template for PowerPoint & Google Slides
Roadmap

World Map PowerPoint Template Location Navigation Pin
World Maps
Mind Map Infographics template for PowerPoint & Google Slides
Mind Maps
Concept Map Presentation Template for PowerPoint & Google Slides
Mind Maps
Stakeholder Map Template for PowerPoint & Google Slides
Business
Mind Map Template for PowerPoint & Google Slides
Mind Maps
Colorful Mind Map Template for PowerPoint & Google Slides
Mind Maps
Colorful Mind Map Template for PowerPoint & Google Slides
Mind Maps
Circular Mind Map Template for PowerPoint & Google Slides
Mind Maps
Mind Map Template for Presentation
Mind Maps
Marketing Roadmap Template
Timeline
Customizable Canada Map Outline Template for PowerPoint & Google Slides
World Maps
North American Map
World Maps
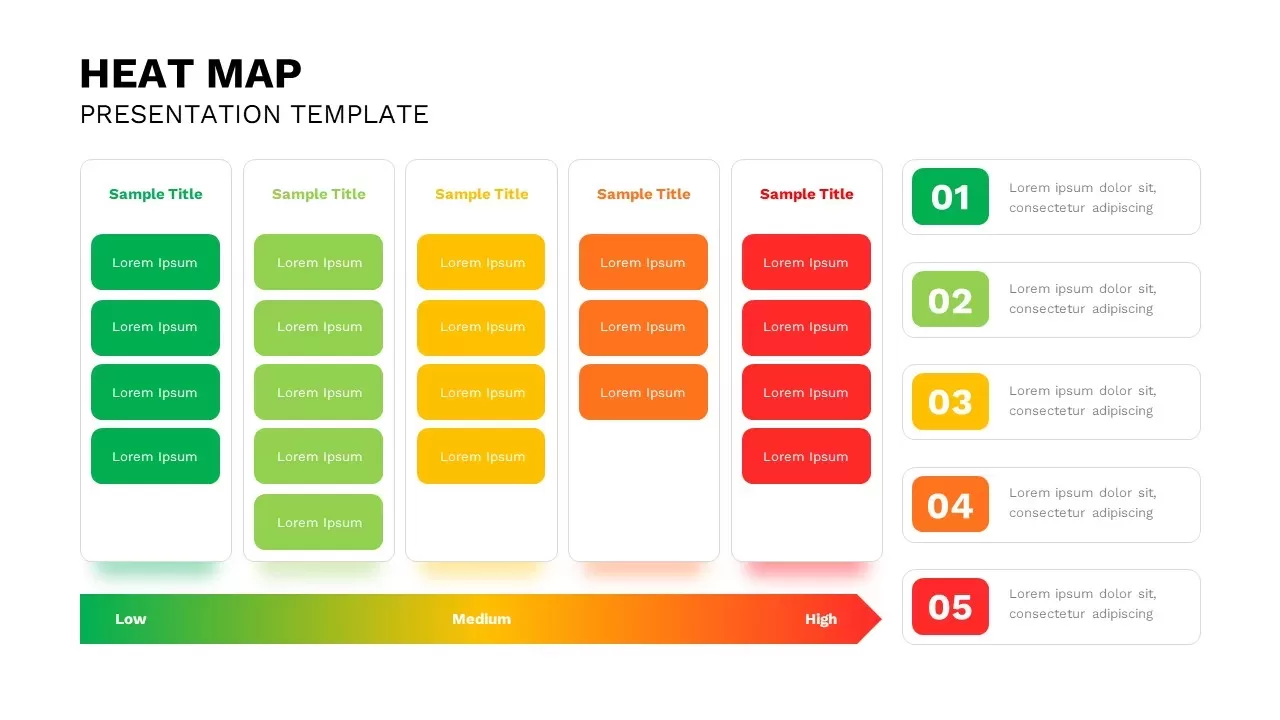
Heat Map Analysis Template for PowerPoint & Google Slides
Risk Management
Heat Map Risk Assessment Presentation Template for PowerPoint & Google Slides
Risk Management
Heat Map Template for PowerPoint
Bar/Column
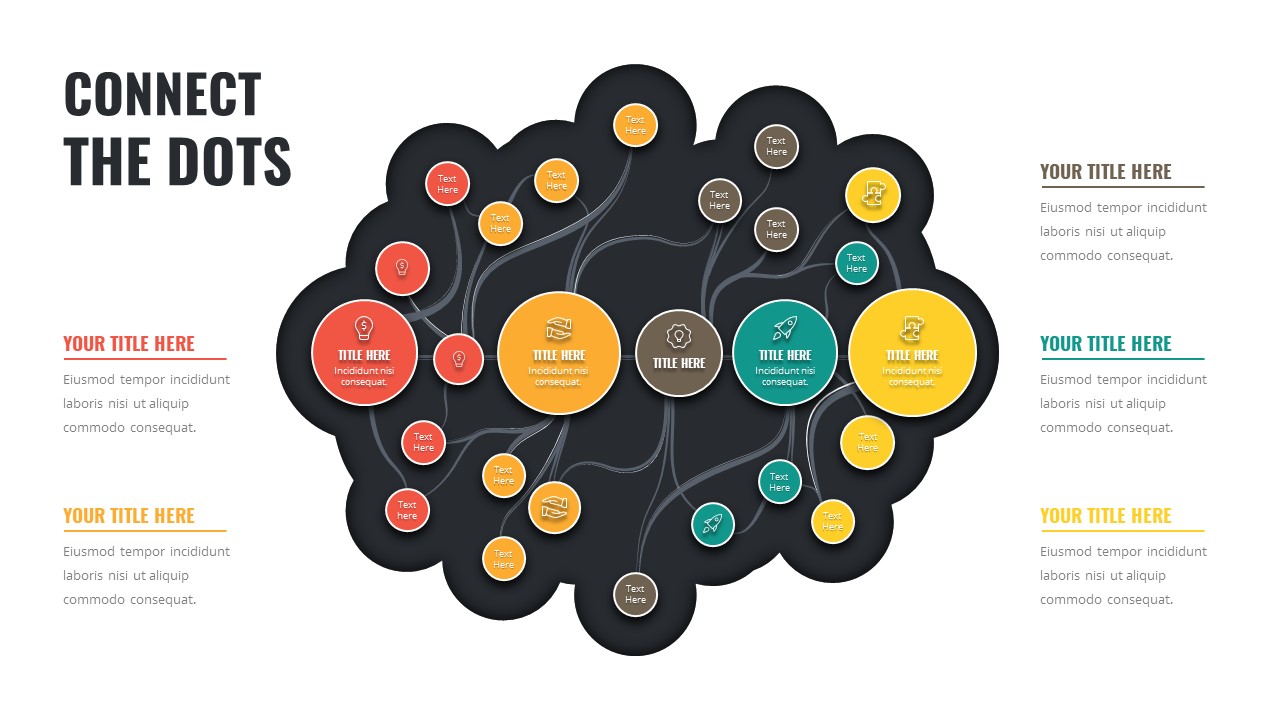
Connect the Dots Mind Map Diagram Template for PowerPoint & Google Slides
Mind Maps
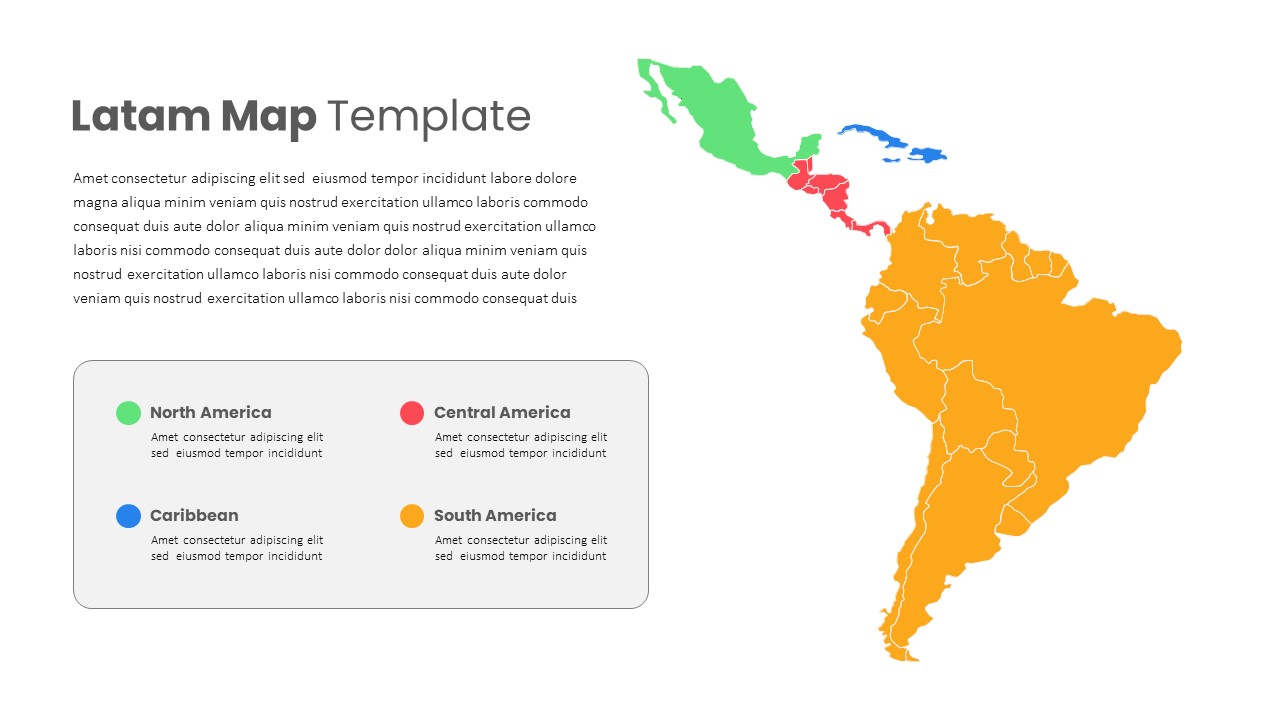
Latin America Regional Map Breakdown Template for PowerPoint & Google Slides
World Maps
Free Editable U.S. Map Template for PowerPoint
World Maps
Free
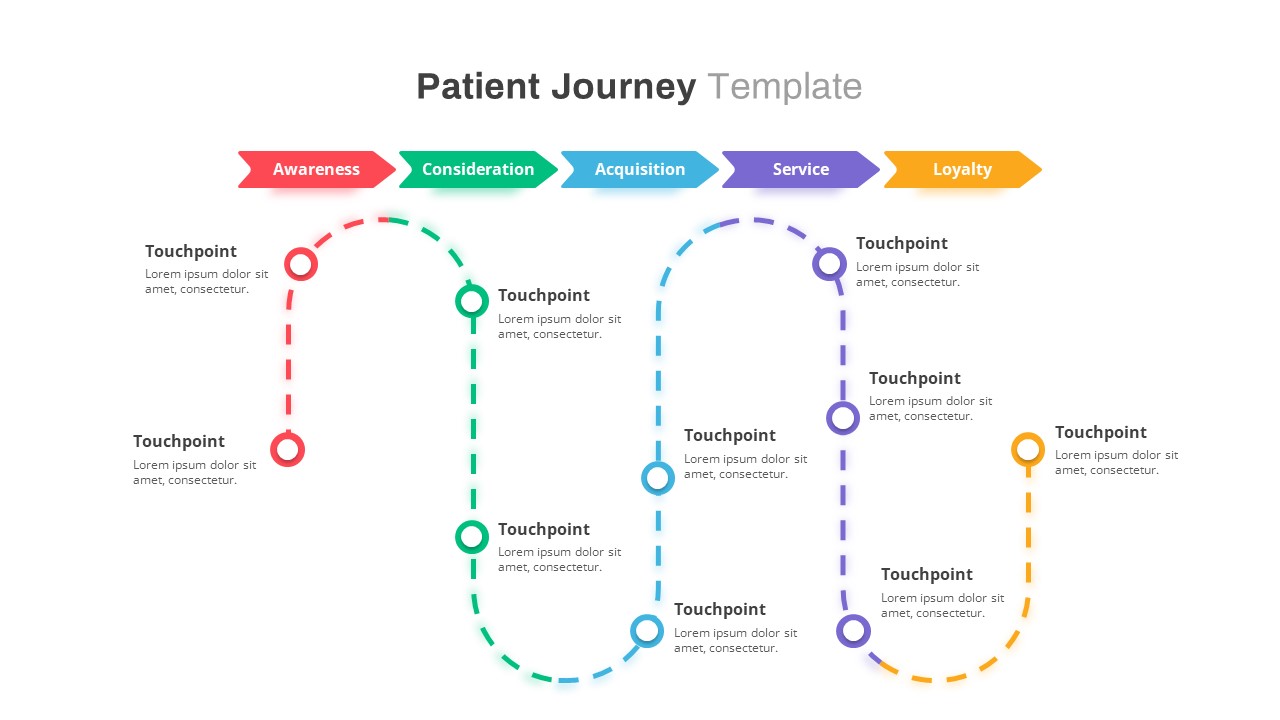
Patient Journey Map Template
Health
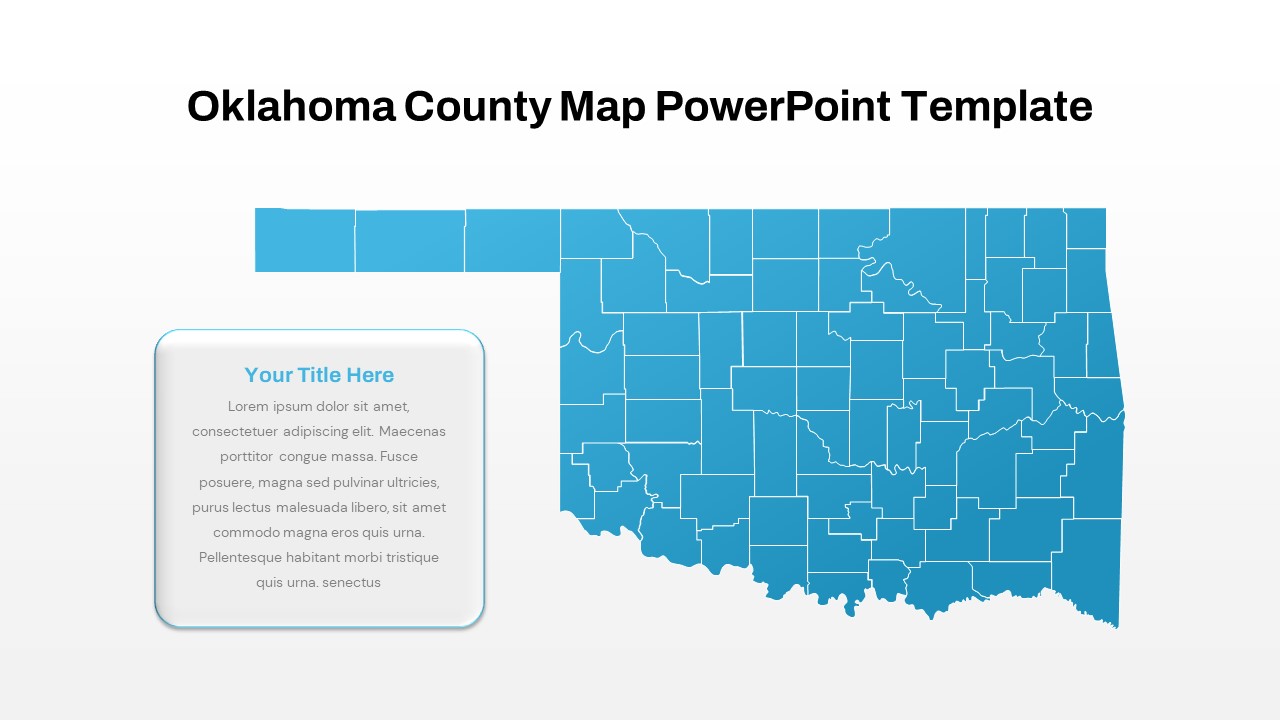
Interactive Oklahoma County Map Template for PowerPoint & Google Slides
World Maps
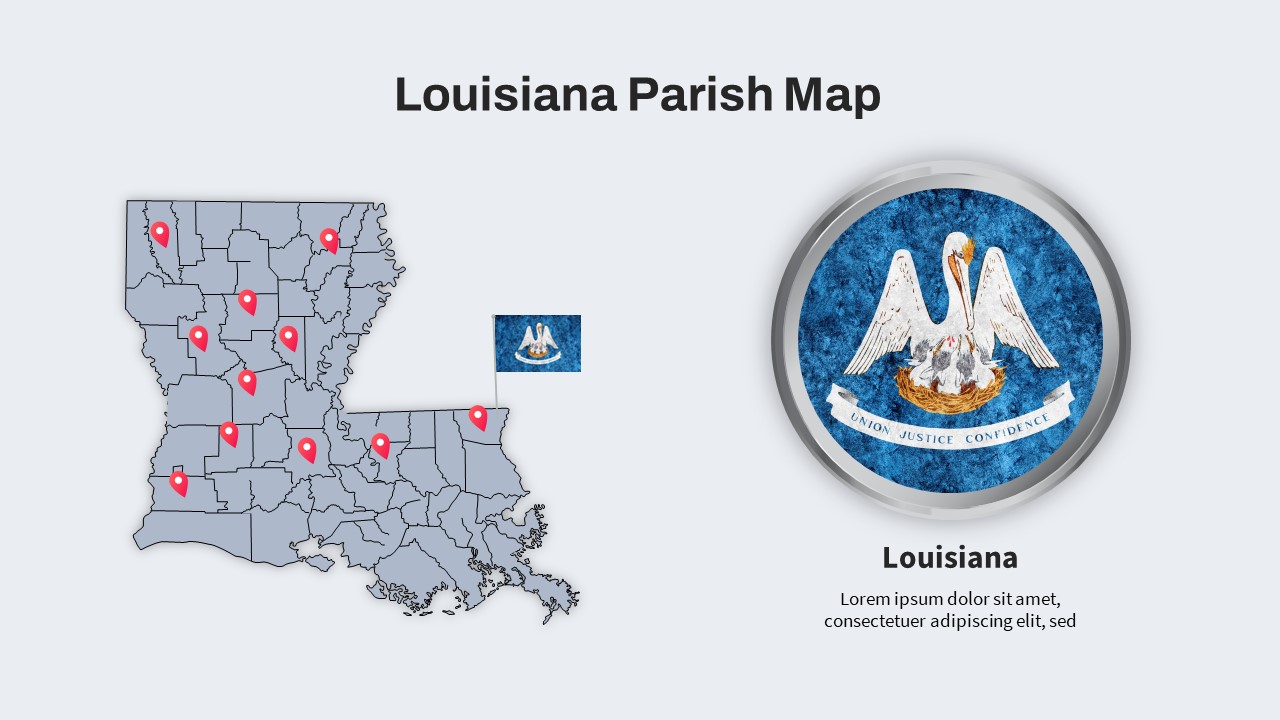
Louisiana Parish Map with Markers Template for PowerPoint & Google Slides
Maps
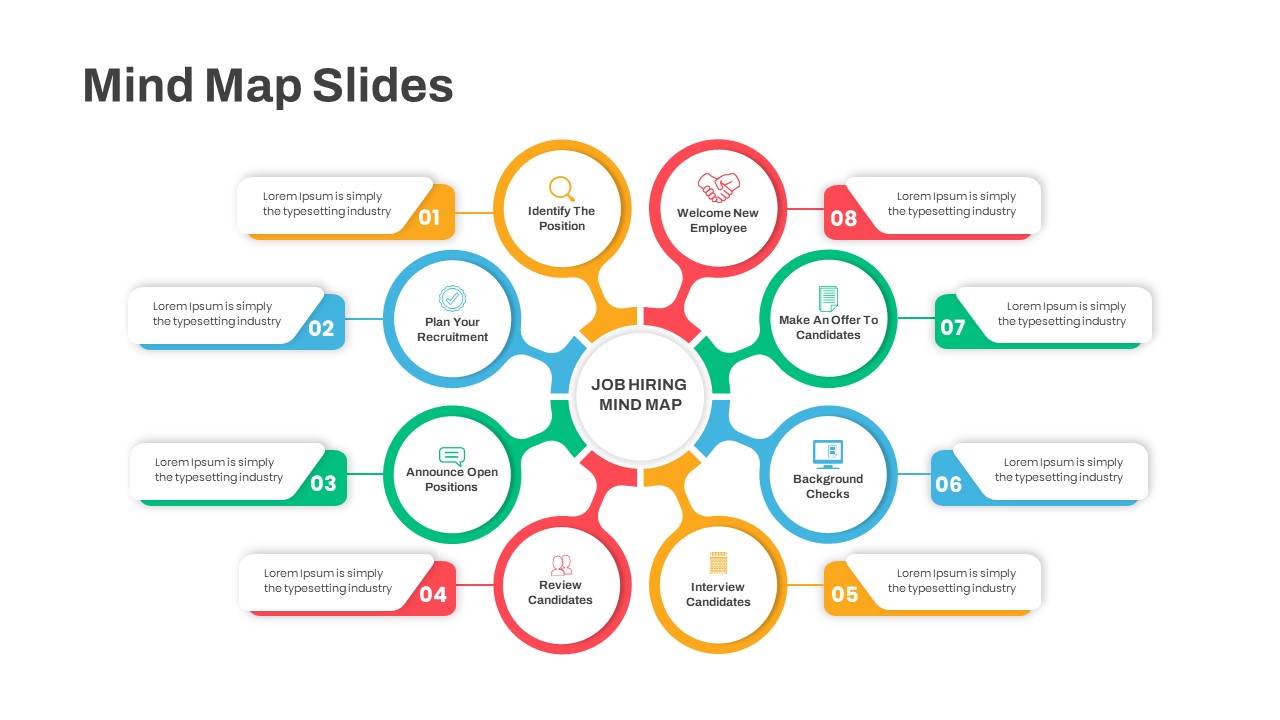
Eight-Step Job Hiring Mind Map Template for PowerPoint & Google Slides
Mind Maps
Michigan County Map with KPI Dashboard Template for PowerPoint & Google Slides
World Maps
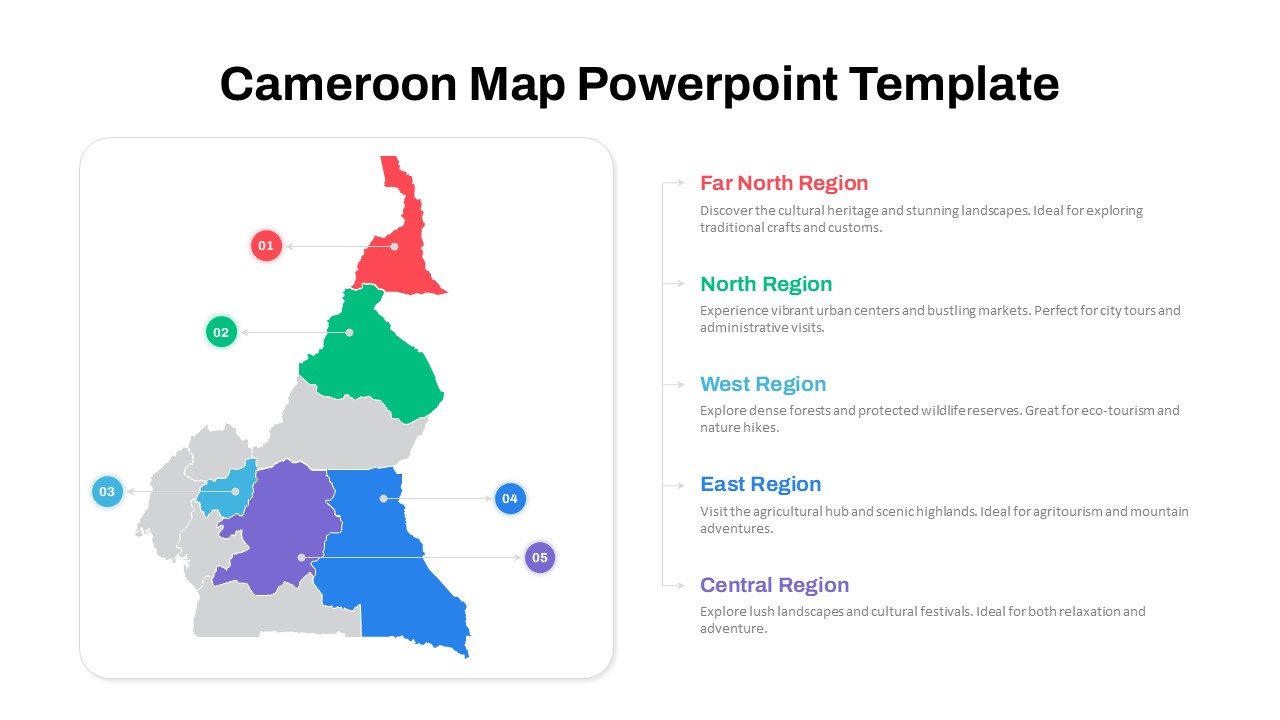
Numbered Cameroon Regional Map Slide Template for PowerPoint & Google Slides
World Maps
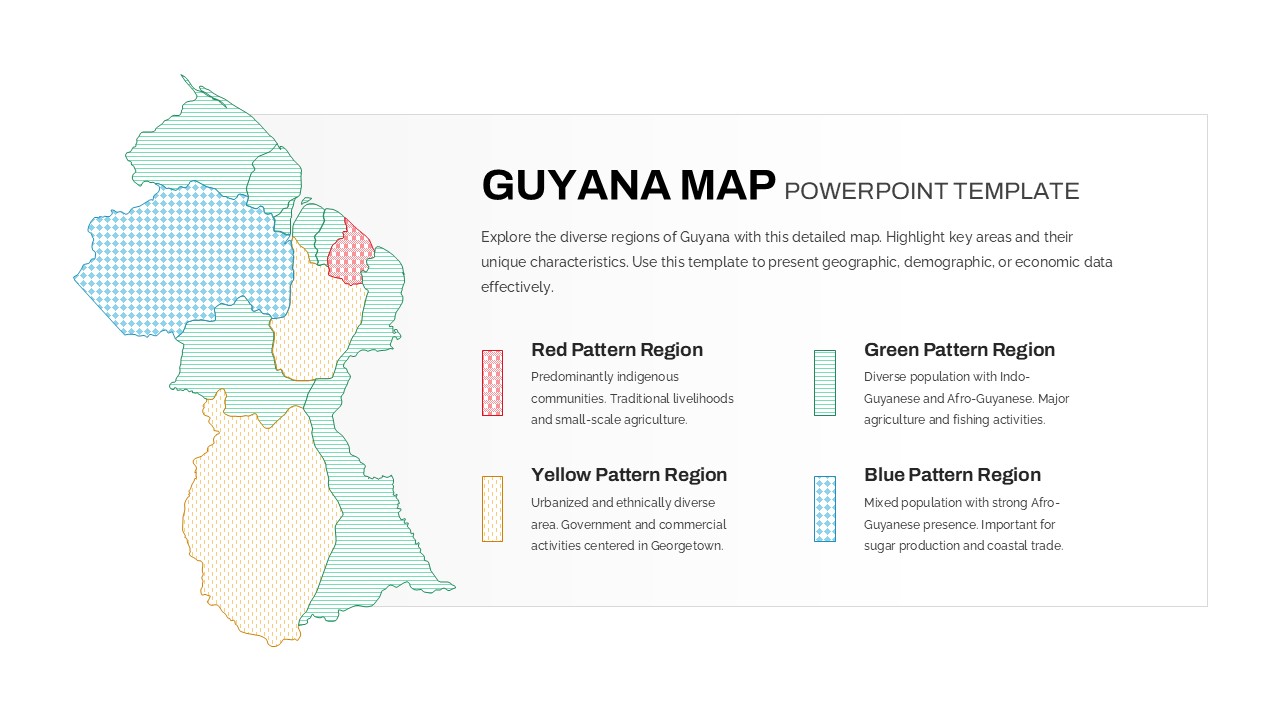
Patterned Guyana Regional Map Template for PowerPoint & Google Slides
World Maps
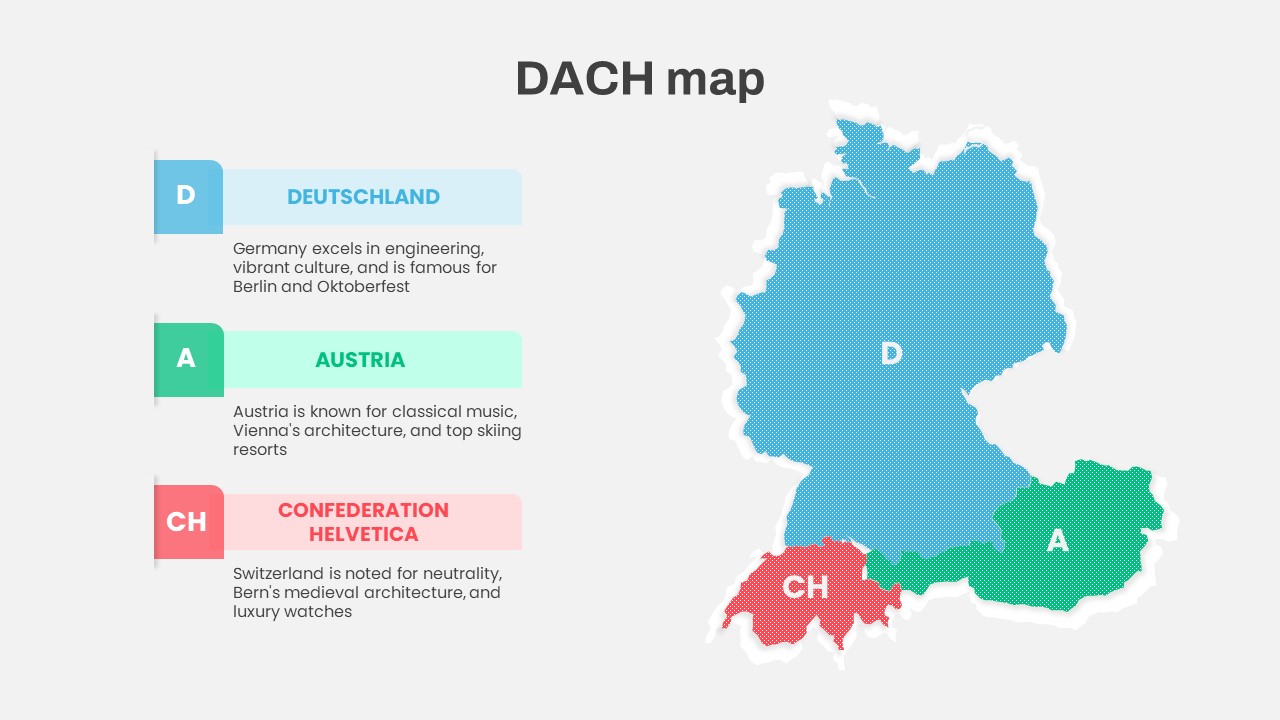
DACH Region Map with Country Highlights Template for PowerPoint & Google Slides
Maps
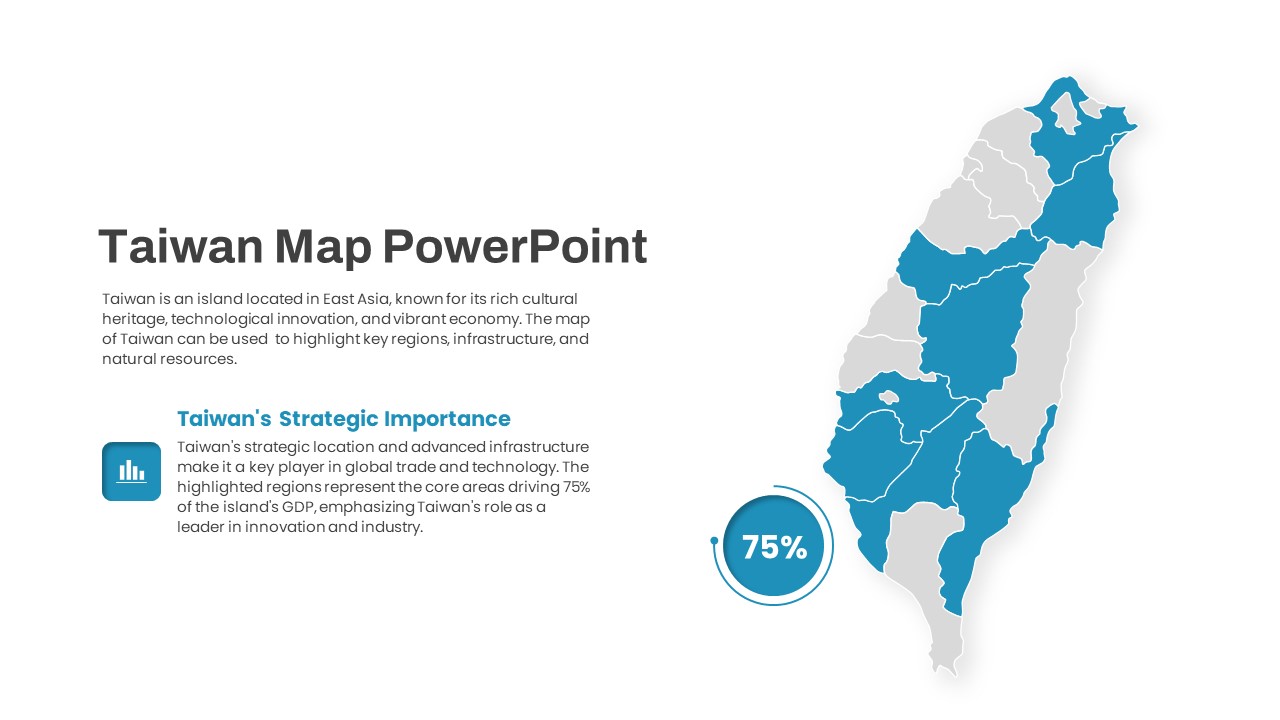
Interactive Taiwan Map Highlight Template for PowerPoint & Google Slides
World Maps
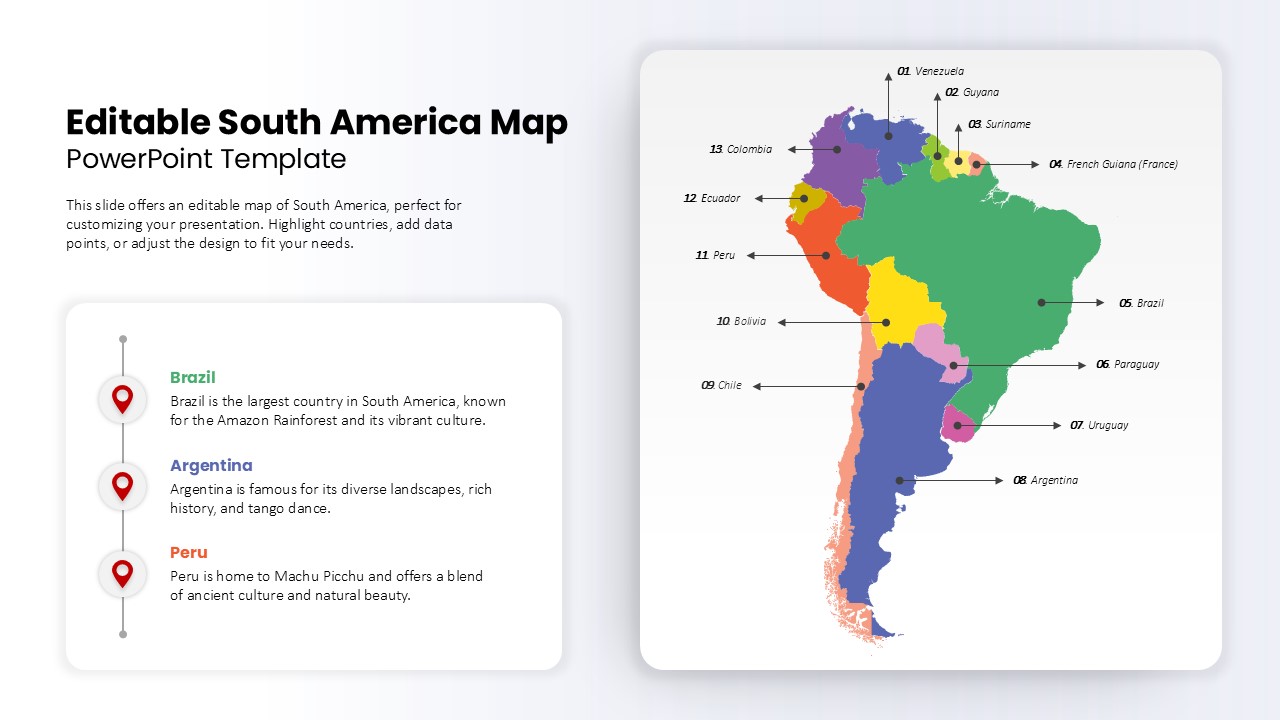
Editable South America Map Diagram Template for PowerPoint & Google Slides
Maps
AI and Data Ecosystem Map Template for PowerPoint & Google Slides
AI
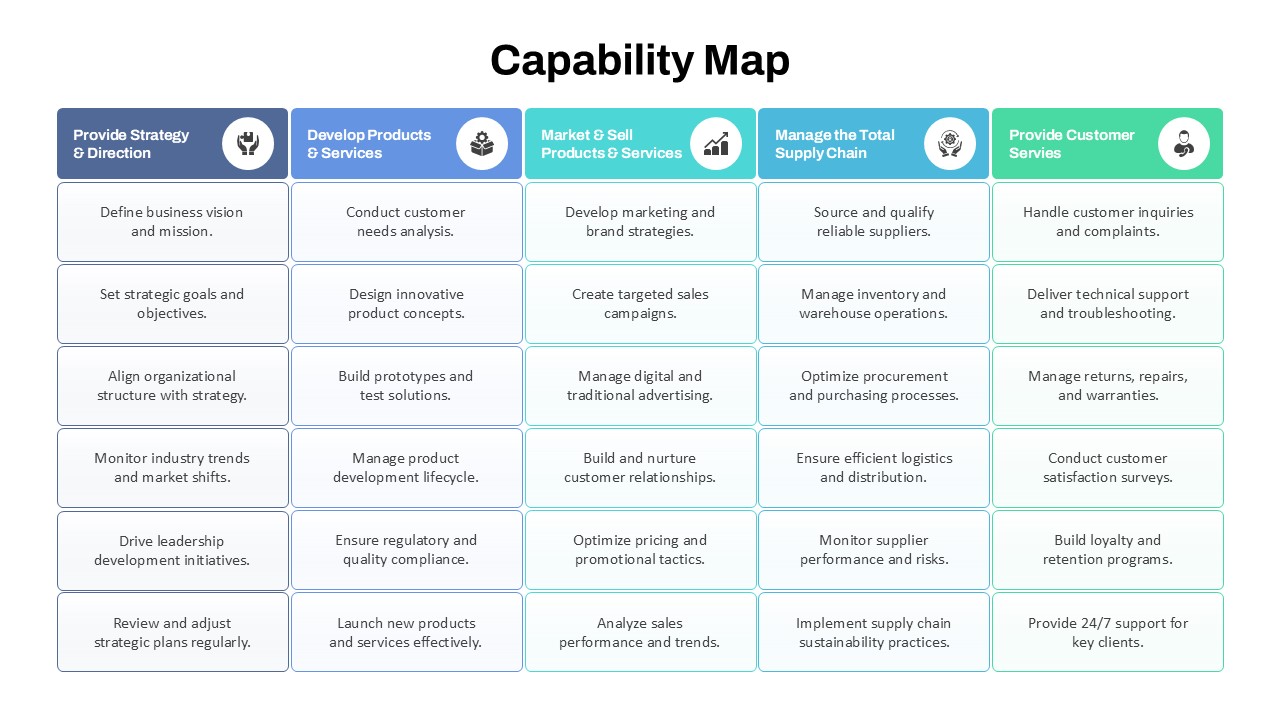
Capability Map Overview Template for PowerPoint & Google Slides
Business Strategy
USA Map with Bar Chart Template for PowerPoint & Google Slides
World Maps
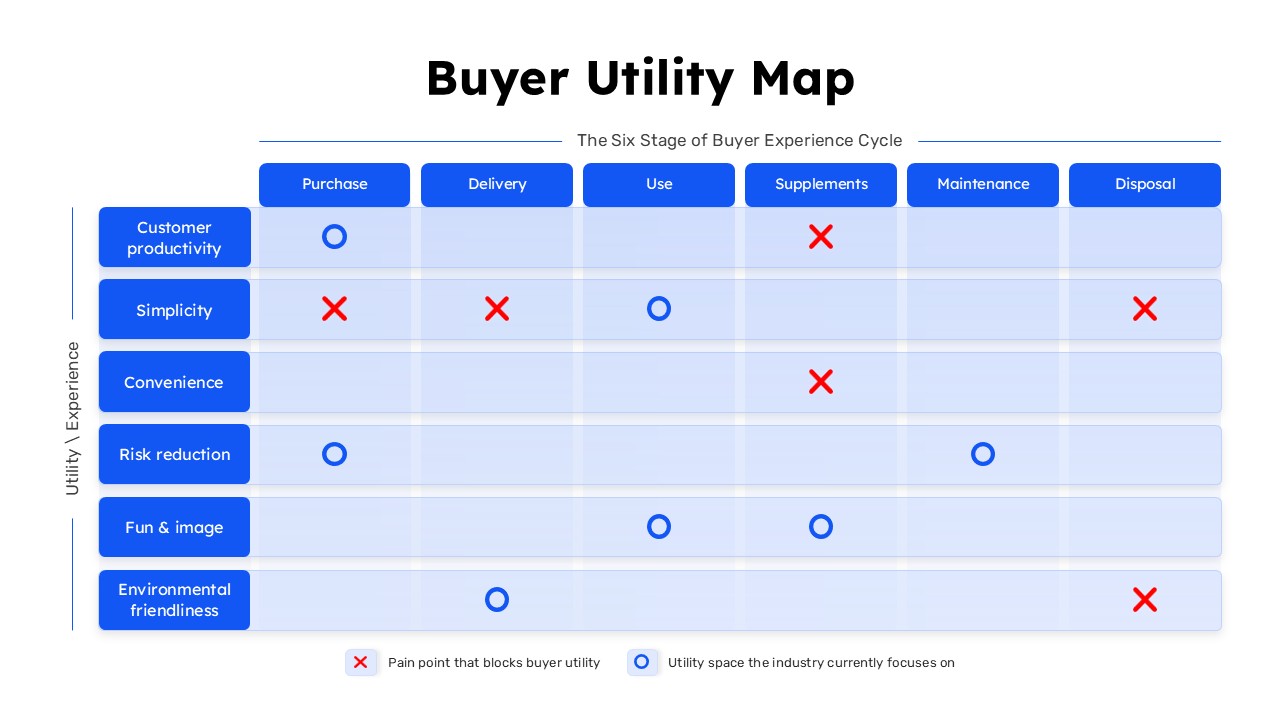
Buyer Utility Map Strategy Matrix Template for PowerPoint & Google Slides
Customer Journey