Horizontal Organizational Chart Template for PowerPoint & Google Slides


Description
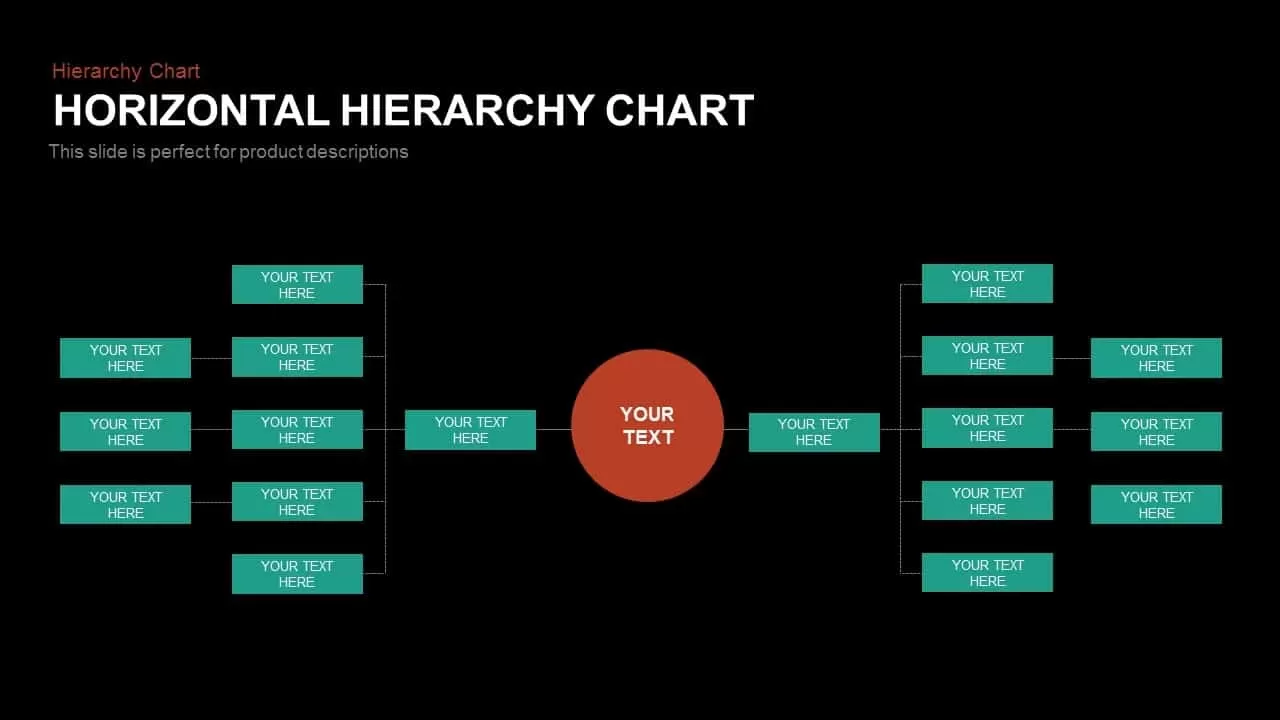
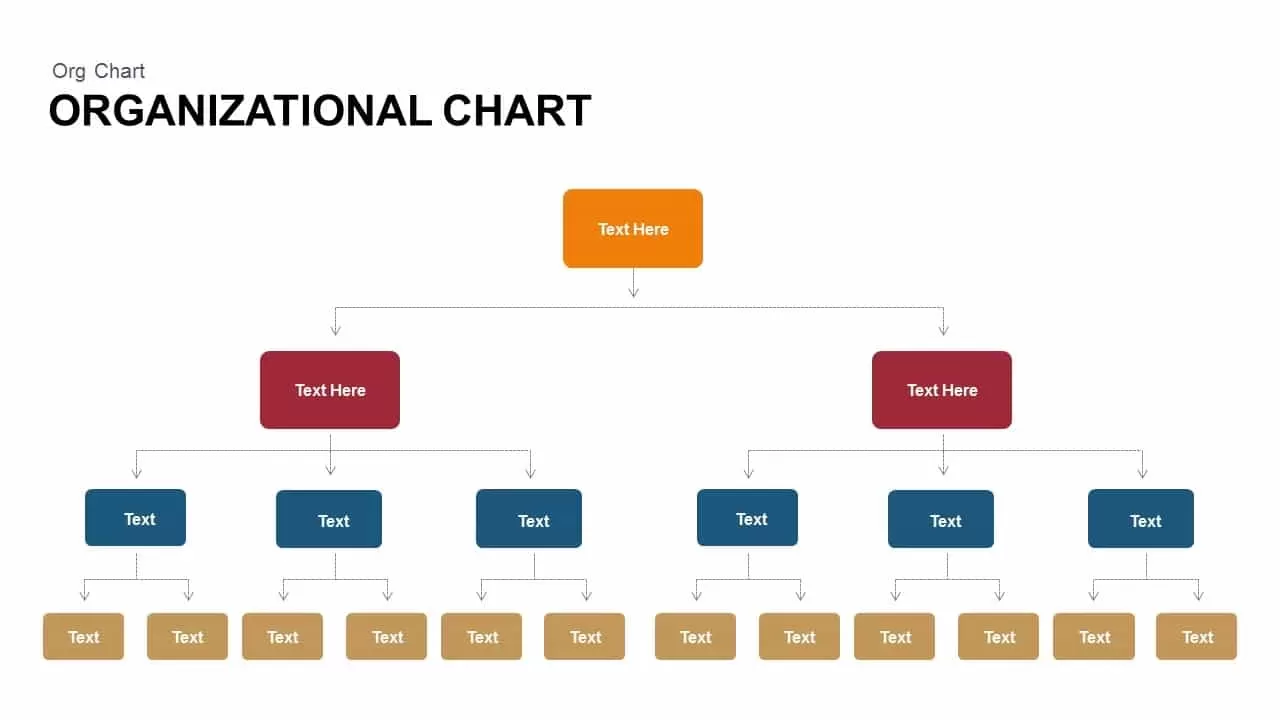
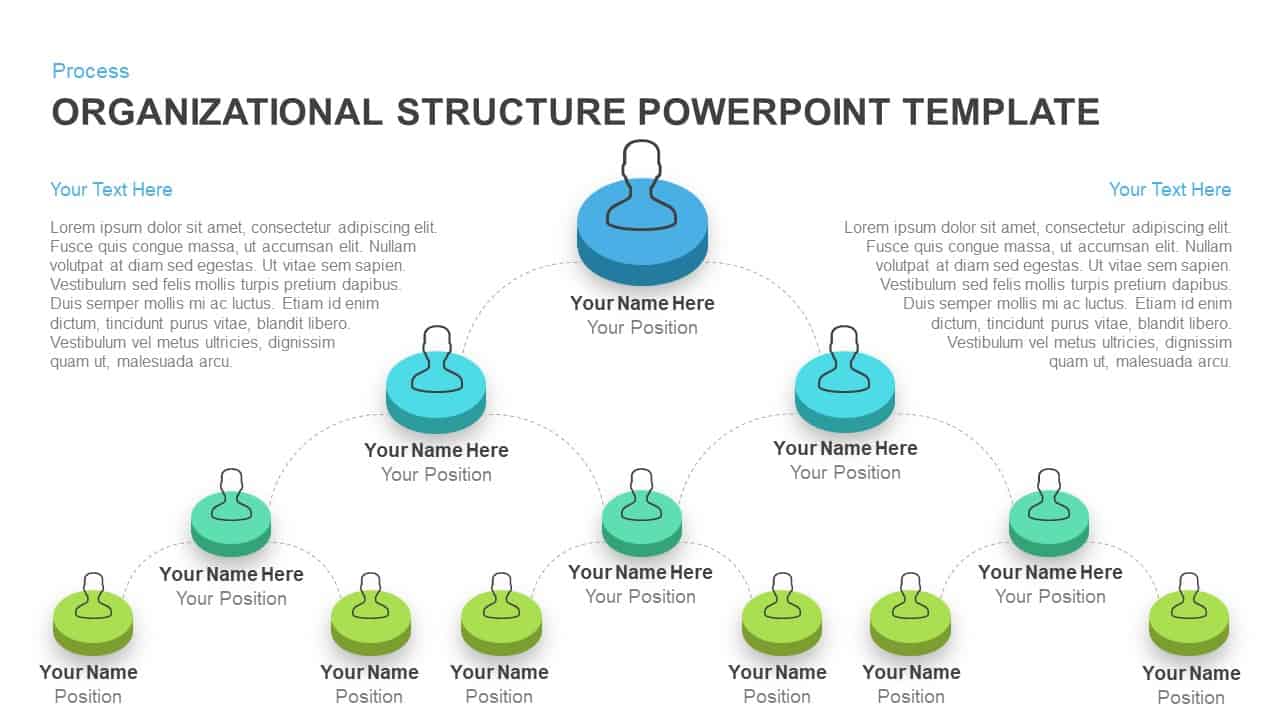
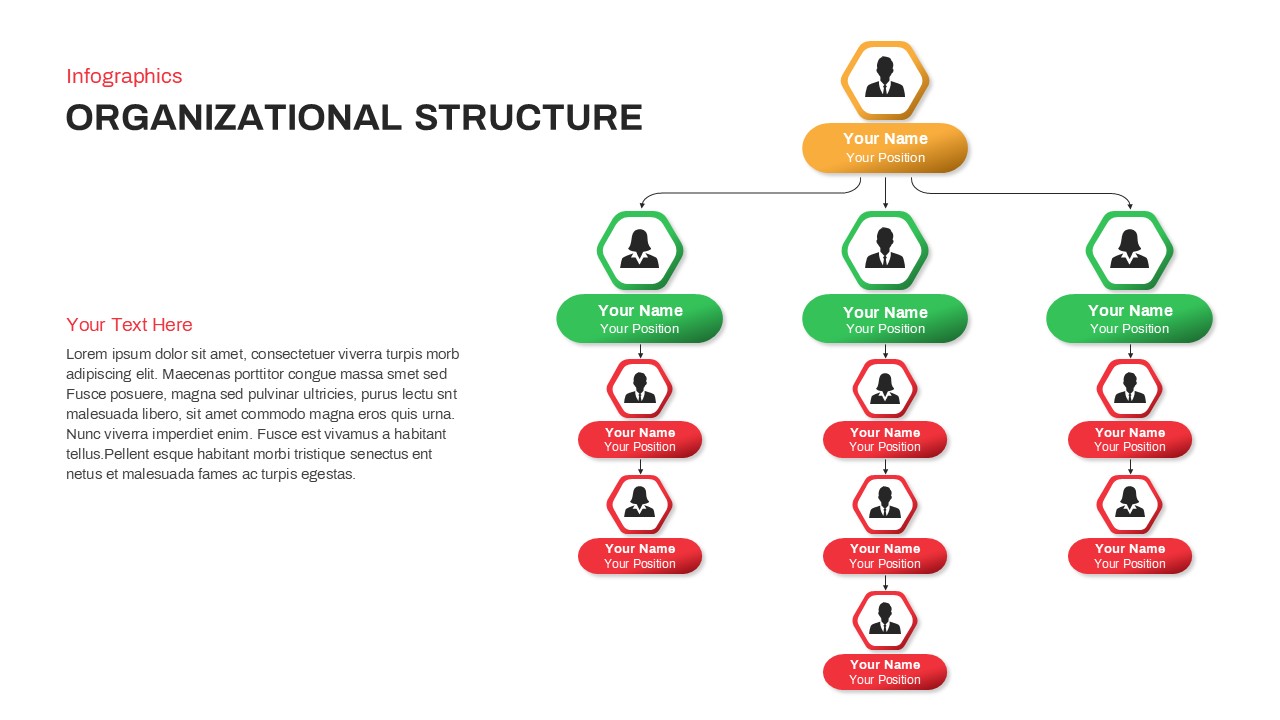
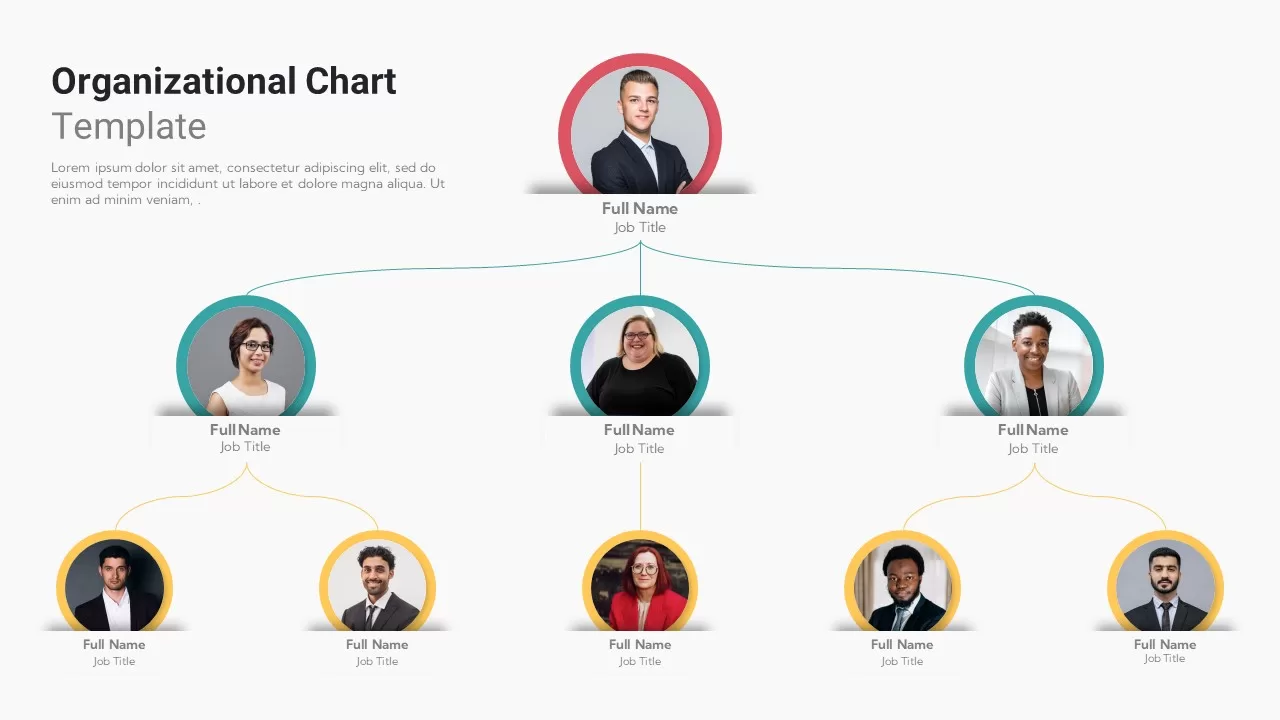
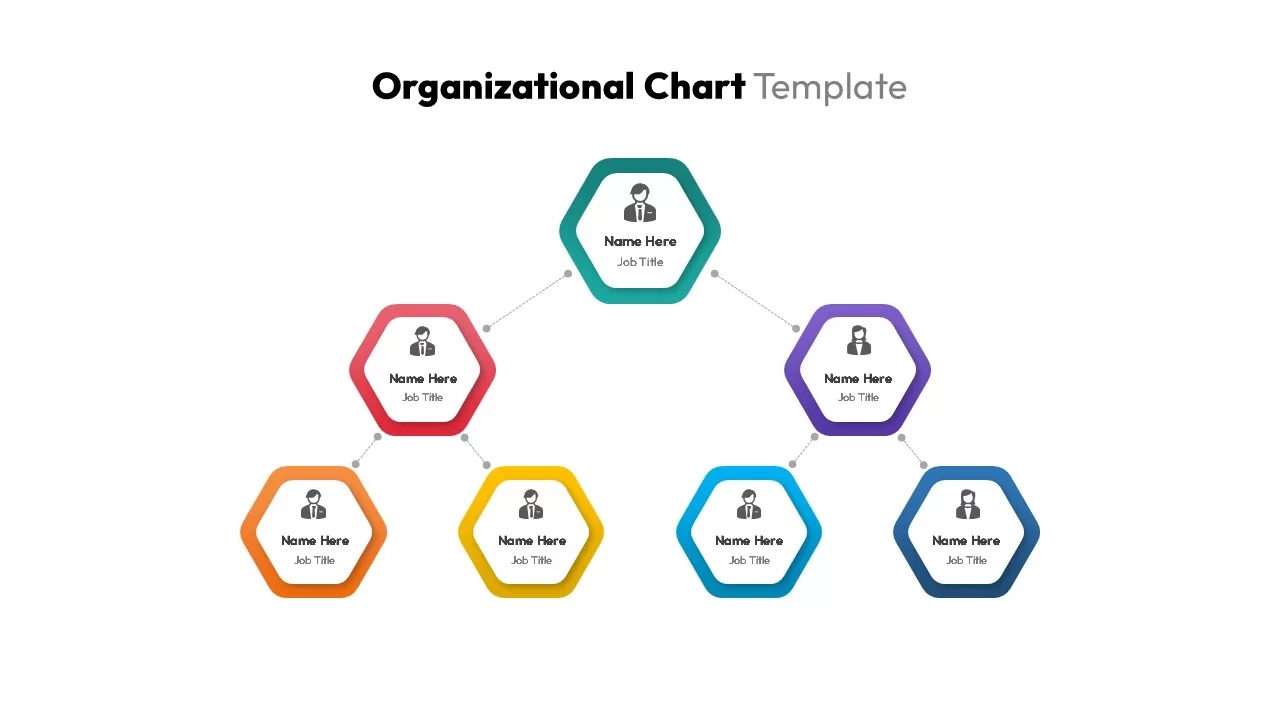
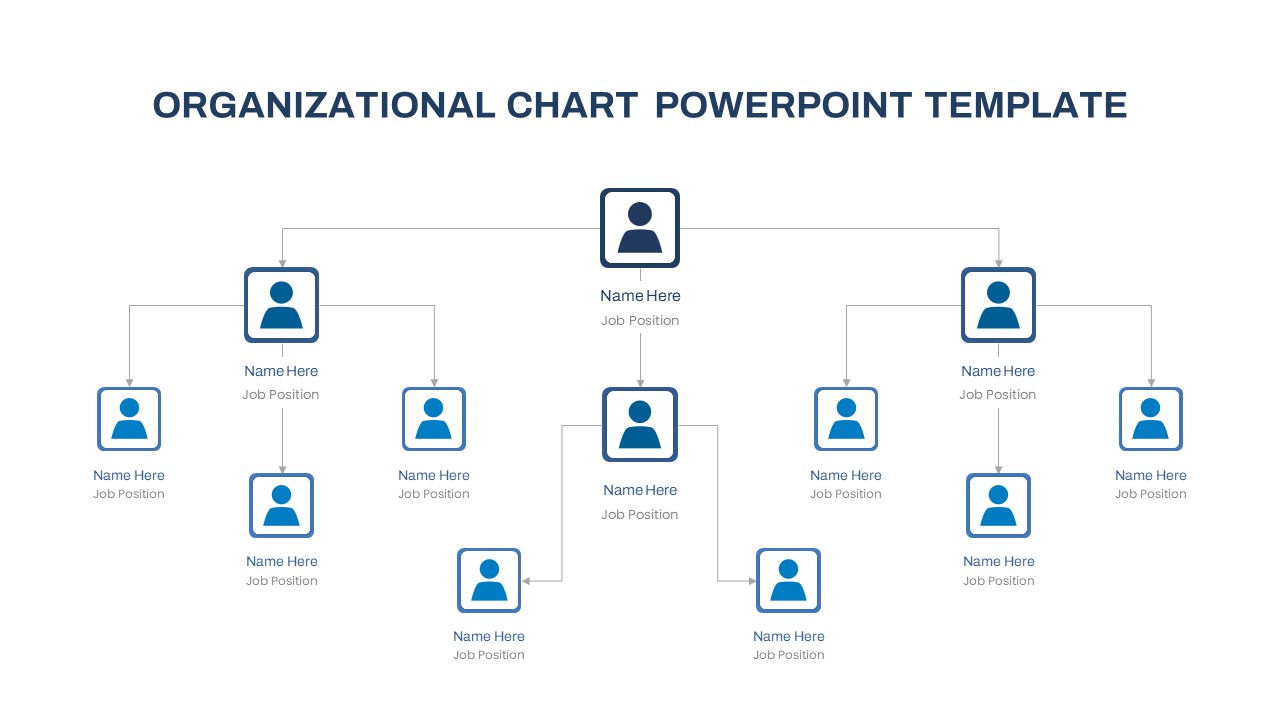
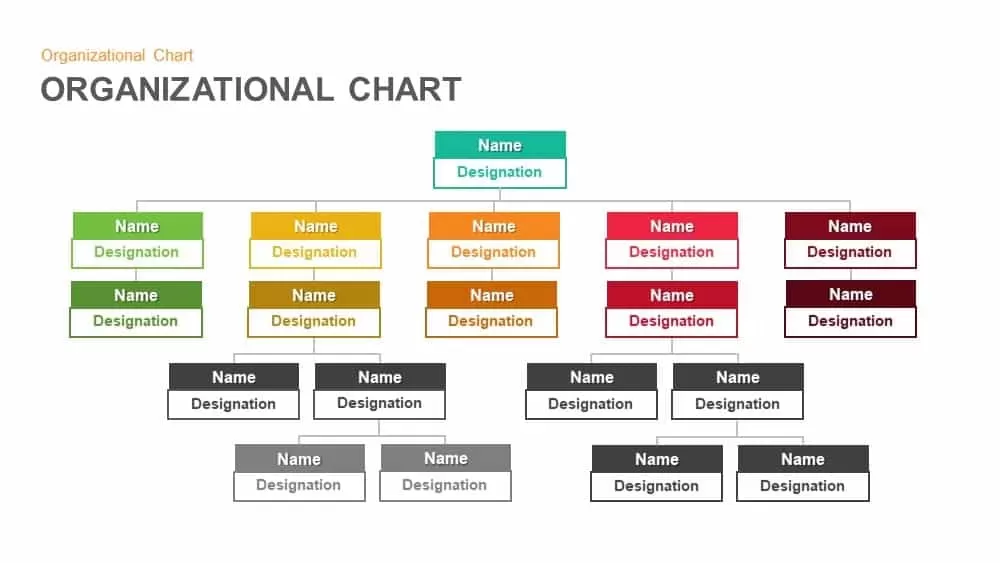
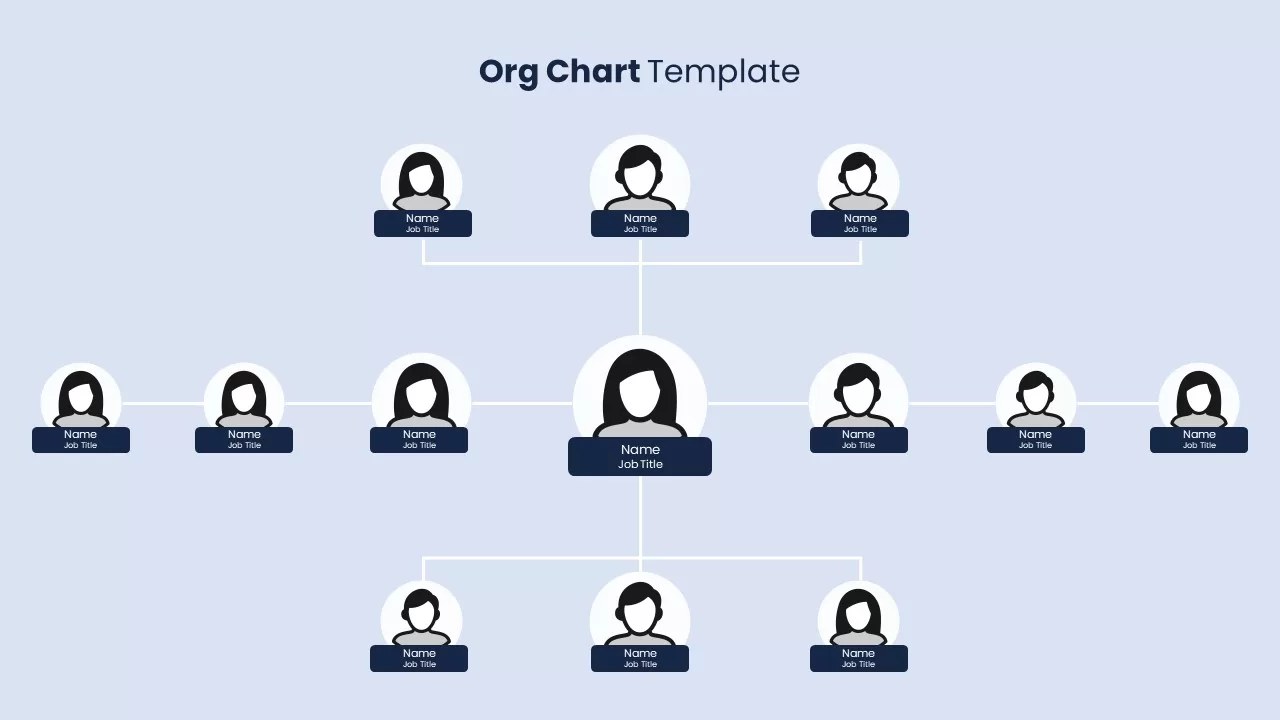
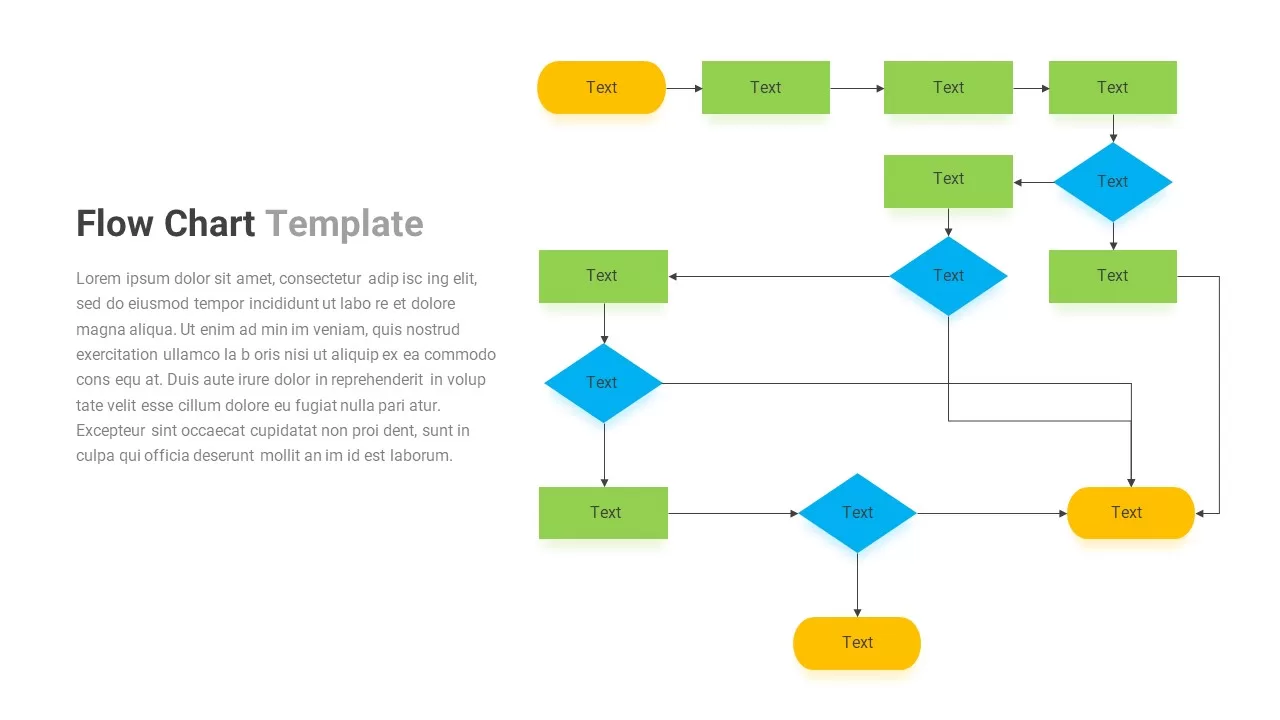
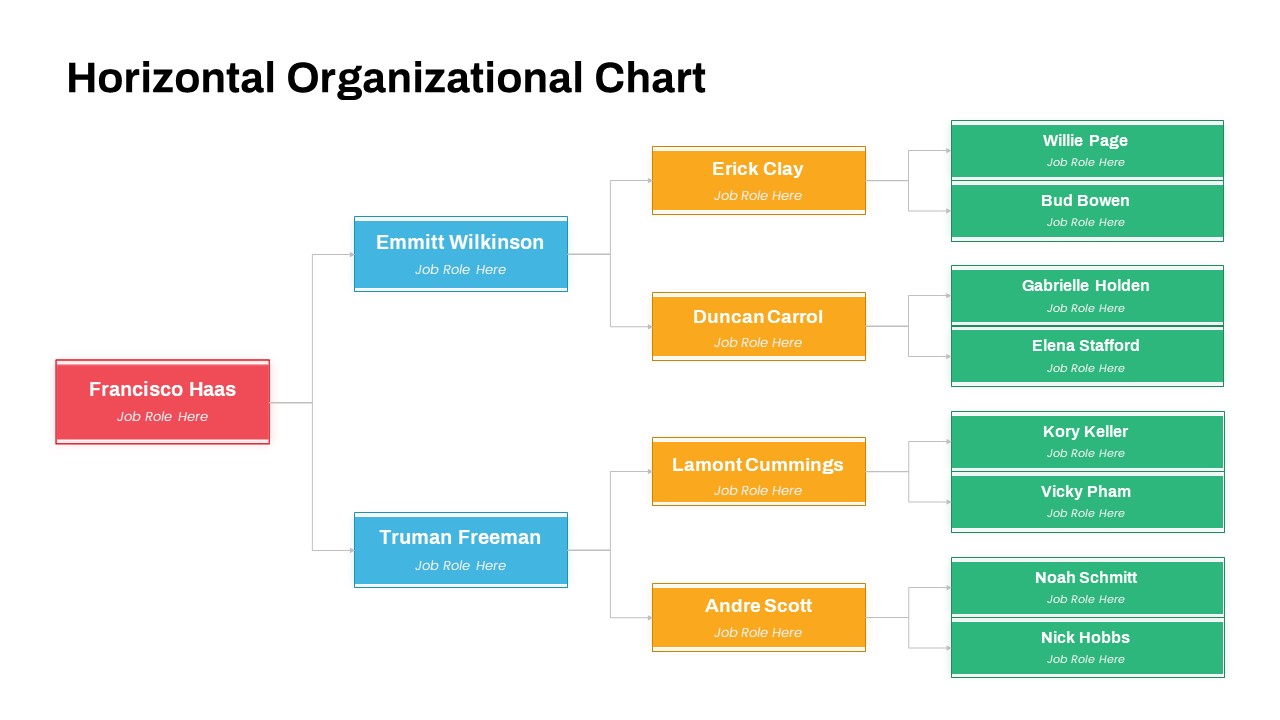
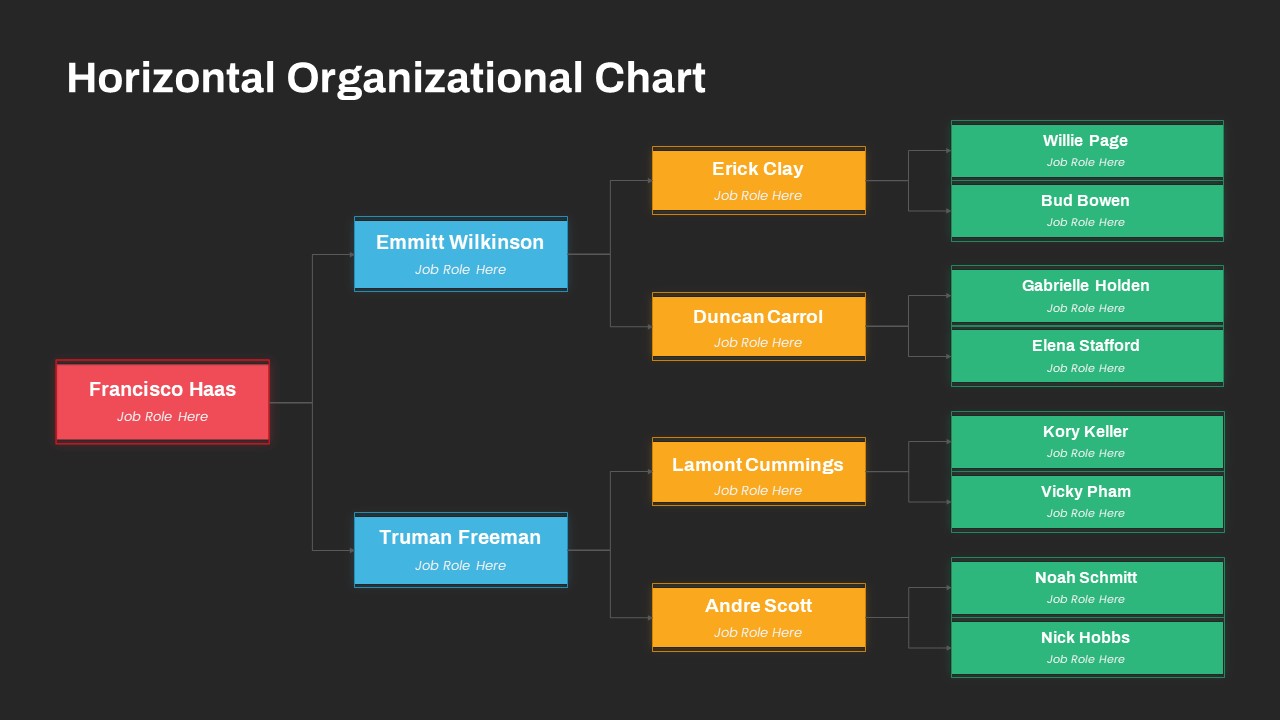
Organize complex reporting structures with this horizontal organizational chart slide, featuring a root node, two management tiers, and four team clusters aligned across a clean white canvas. Color-coded rectangles in red, blue, orange, and green clearly distinguish leadership levels, while thin grey connector lines map out reporting relationships. Shapes are grouped for easy template editing, and built-in alignment guides help maintain consistent spacing. Directional arrows and “Yes”/“No” callouts can be added to denote conditional reporting or dotted-line relationships. The slide also includes a ready-to-use legend for shape definitions, ensuring your audience can quickly interpret each symbol.
Built on master layouts for both PowerPoint and Google Slides, this template offers fully editable text placeholders, vector shapes, and connector styles to adapt to any organization’s structure. Simply replace the sample names with your own, drag and drop to rearrange positions, or adjust lane widths without disrupting design consistency. Connector arrows are uniformly styled and remain attached when shapes are repositioned, streamlining updates. High-resolution graphics guarantee crisp display on screens of any size, and the master slide approach ensures consistent formatting across multiple diagrams in your deck.
Ideal for mapping product development workflows, compliance procedures, or customer journey diagrams, this template streamlines documentation and presentation of multi-team processes. Use it to communicate handoff points between departments, visualize approval gates, or train new employees on standard operating procedures. With a separate component slide for easy reference, you can customize symbol definitions, add new shapes, or repurpose lanes for strategic planning tasks. For more visual structures, the org chart collection offers alternative layouts suited to different team sizes and workflow styles.
Who is it for
Operations managers, business analysts, and project leads will benefit from this flow chart when designing or documenting interdepartmental workflows and decision processes. Quality assurance teams and compliance officers can also leverage it for SOP documentation and audit readouts.
Other Uses
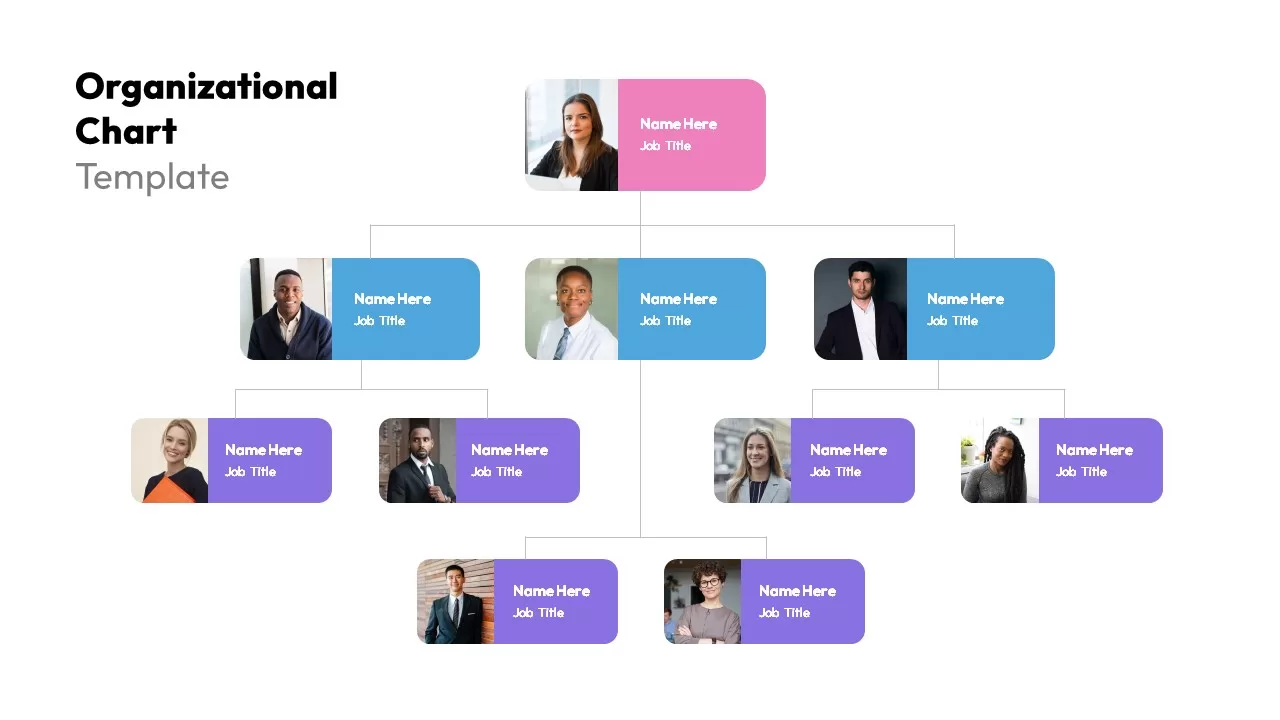
Beyond operational workflows, repurpose this slide for service design mapping, IT system architectures, risk assessment sequences, training materials, workshop exercises, or team onboarding modules. A vibrant alternative layout is available in the colorful organizational chart diagram template, suitable for teams seeking clearer visual separation between roles.
Login to download this file

Item ID
SB03803
Related Templates

Horizontal Organizational Chart Template for PowerPoint & Google Slides
Org Chart
Horizontal Org Chart template for PowerPoint & Google Slides
Org Chart
Horizontal Multi-Level Hierarchy Chart template for PowerPoint & Google Slides
Org Chart
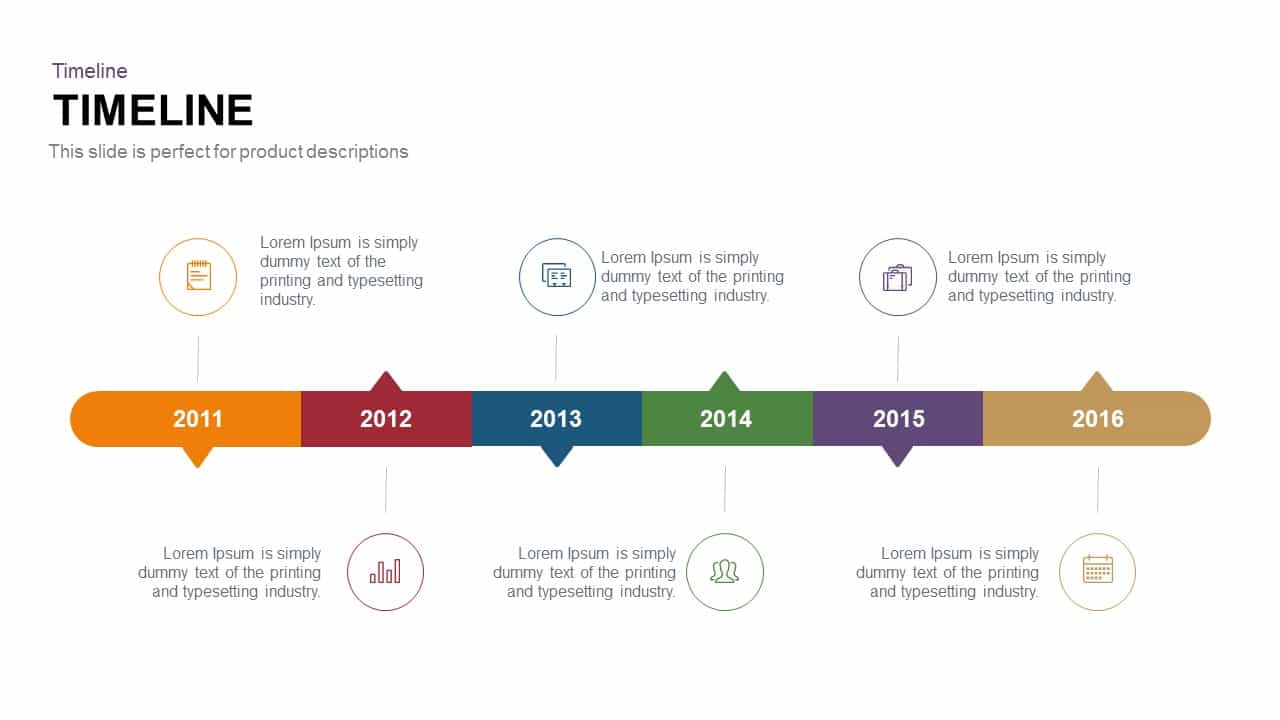
Five-Phase Horizontal Timeline Chart Template for PowerPoint & Google Slides
Timeline
Horizontal Bar Chart Slide with Icons Template for PowerPoint & Google Slides
Bar/Column
Horizontal Timeline Infographic Template for PowerPoint & Google Slides
Timeline
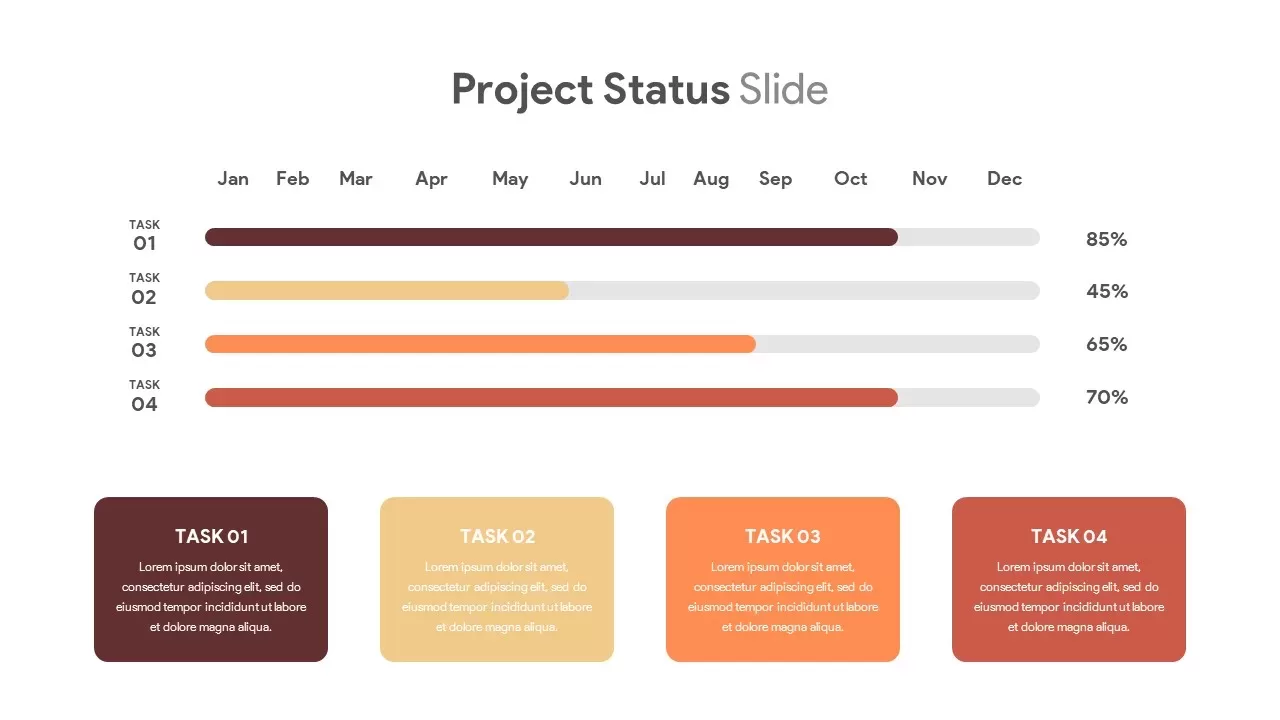
Horizontal Timeline Project Status Template for PowerPoint & Google Slides
Project Status
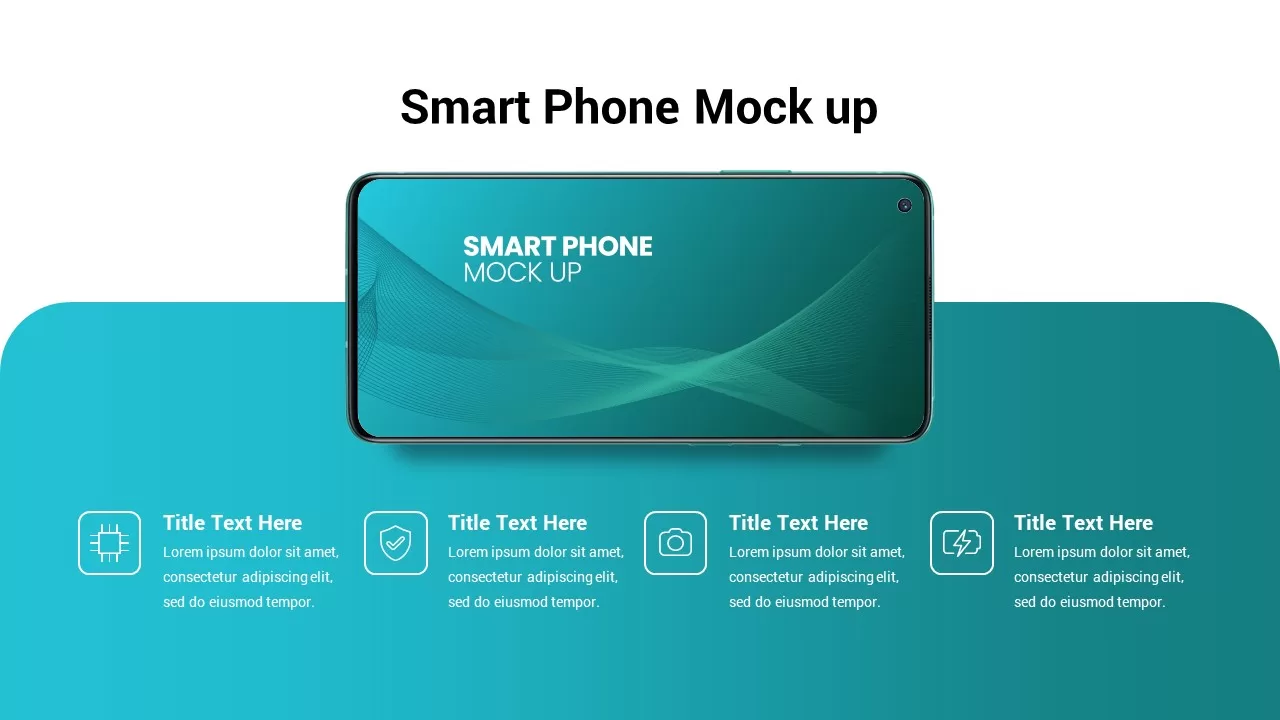
Horizontal Smartphone Feature Highlights Template for PowerPoint & Google Slides
Graphics
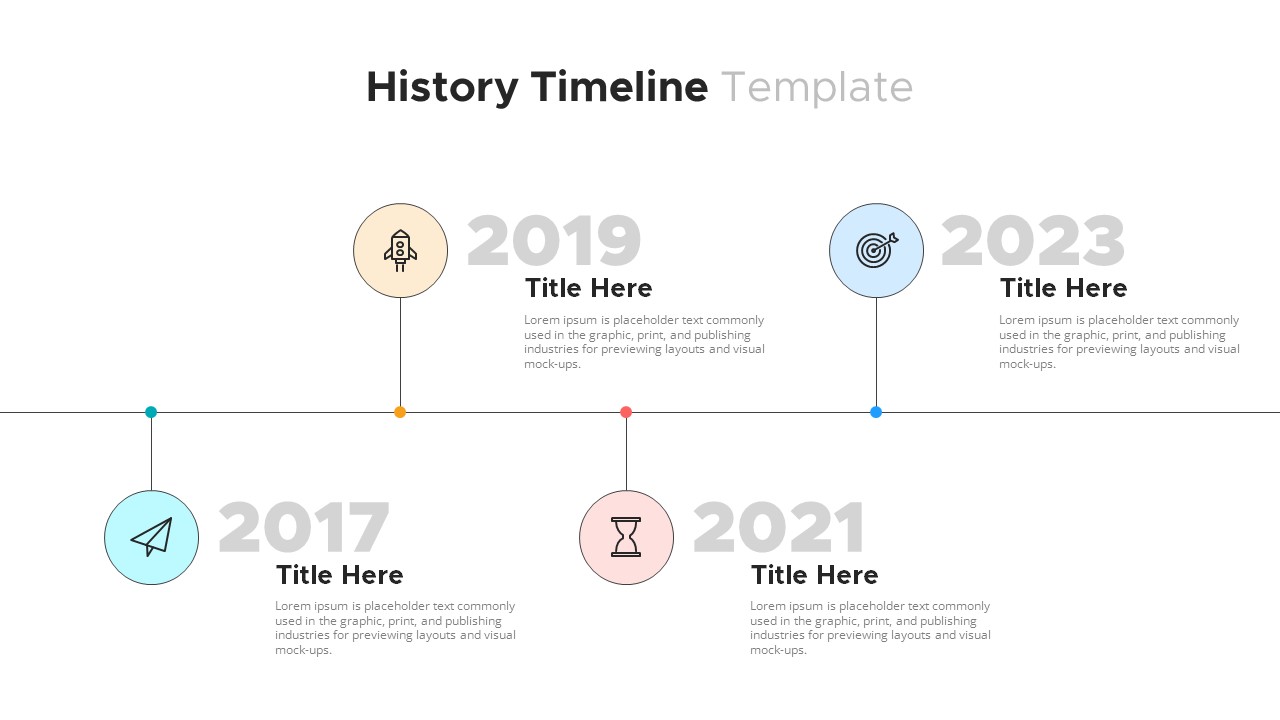
Modern Horizontal History Timeline Template for PowerPoint & Google Slides
Timeline
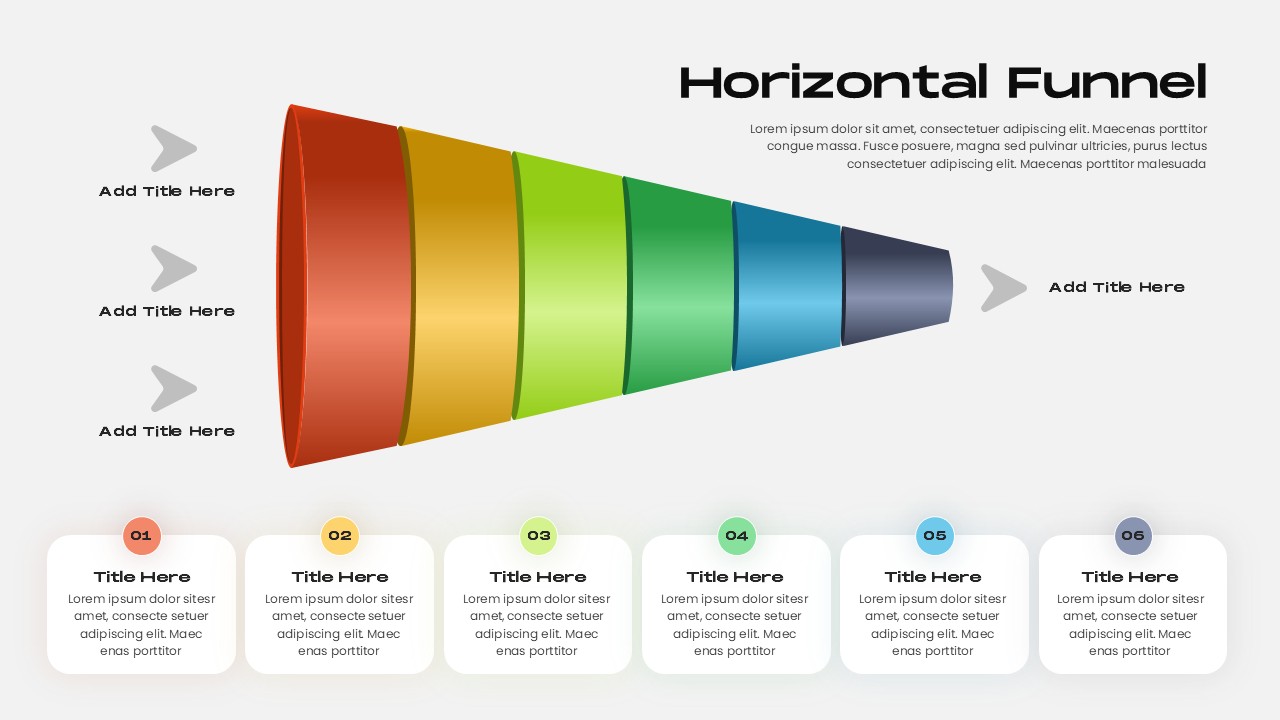
Horizontal Funnel Diagram Process Template for PowerPoint & Google Slides
Funnel
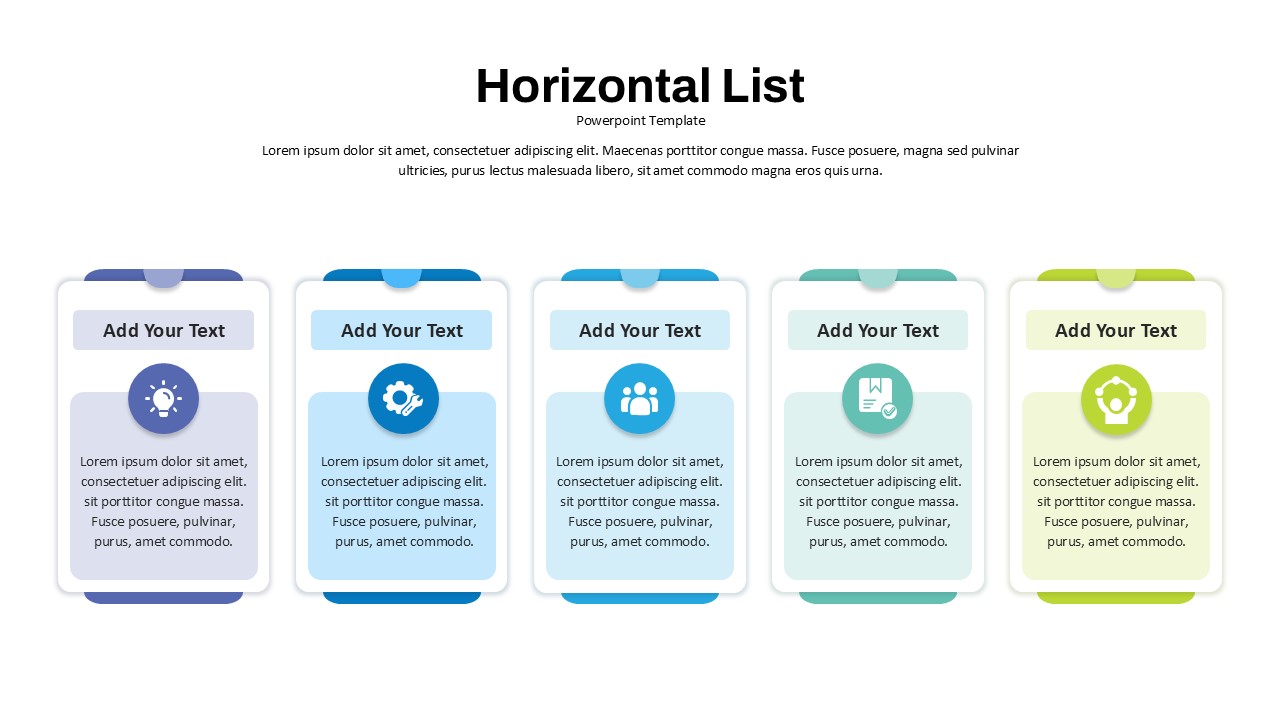
Modern Four-Step Horizontal List Template for PowerPoint & Google Slides
Process
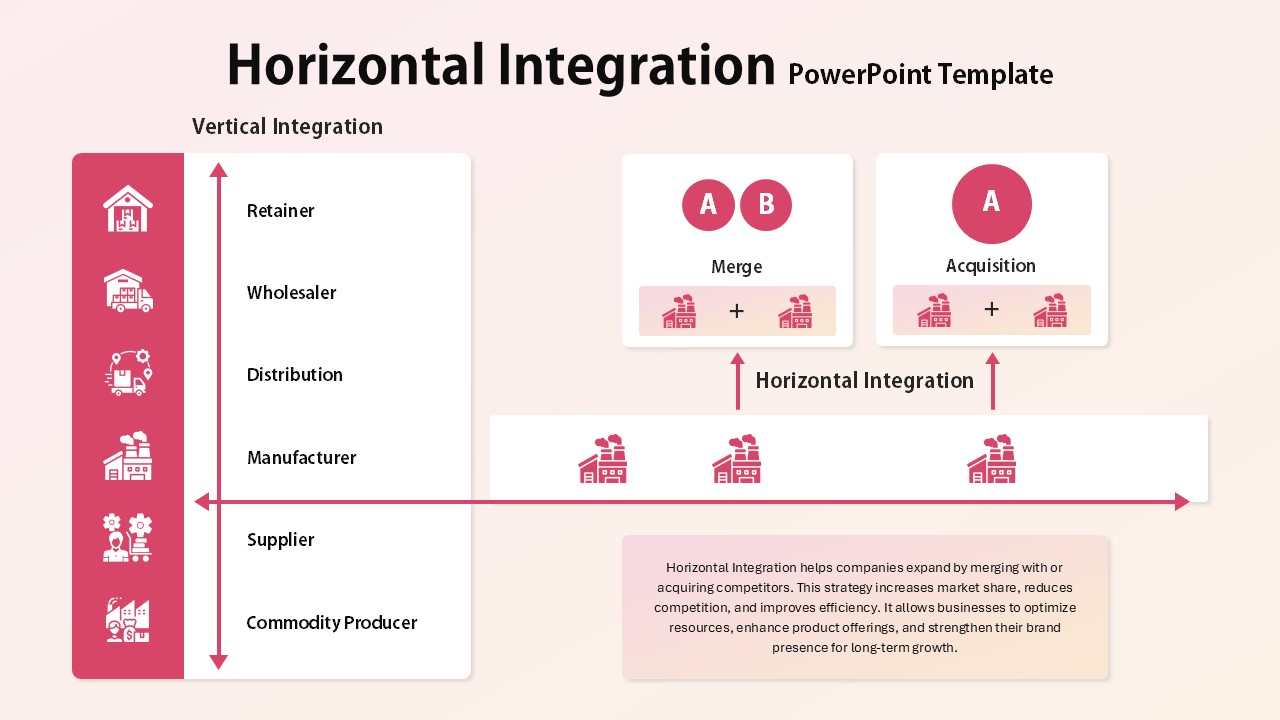
Horizontal Integration Strategy Template for PowerPoint & Google Slides
Competitor Analysis
Six-Item Horizontal List Infographic Template for PowerPoint & Google Slides
Process
Key Assumptions Horizontal List Diagram Template for PowerPoint & Google Slides
Business Plan
Dark Horizontal Timeline Infographic Template for PowerPoint & Google Slides
Timeline
7 Horizontal Layered Diagram for PowerPoint & Google Slides
Process
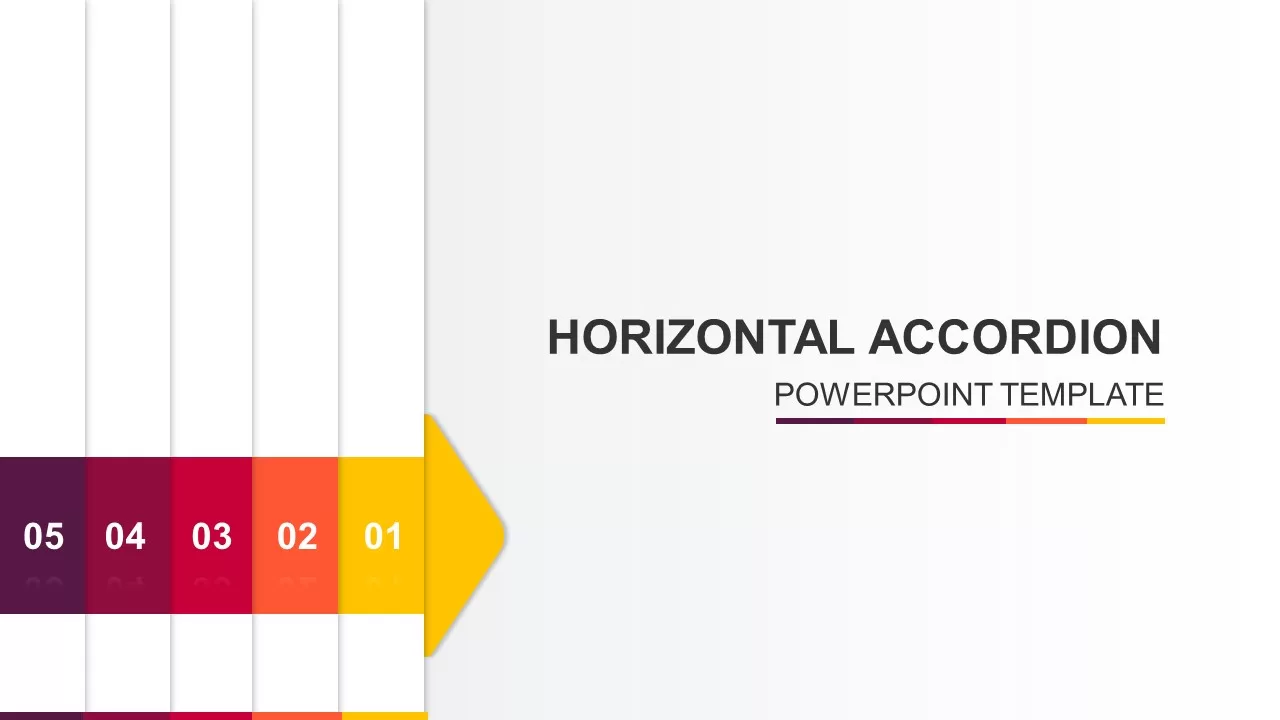
Horizontal Accordion Animated for PowerPoint & Google Slides
Business
Simple Organizational Chart Infographic Template for PowerPoint & Google Slides
Org Chart
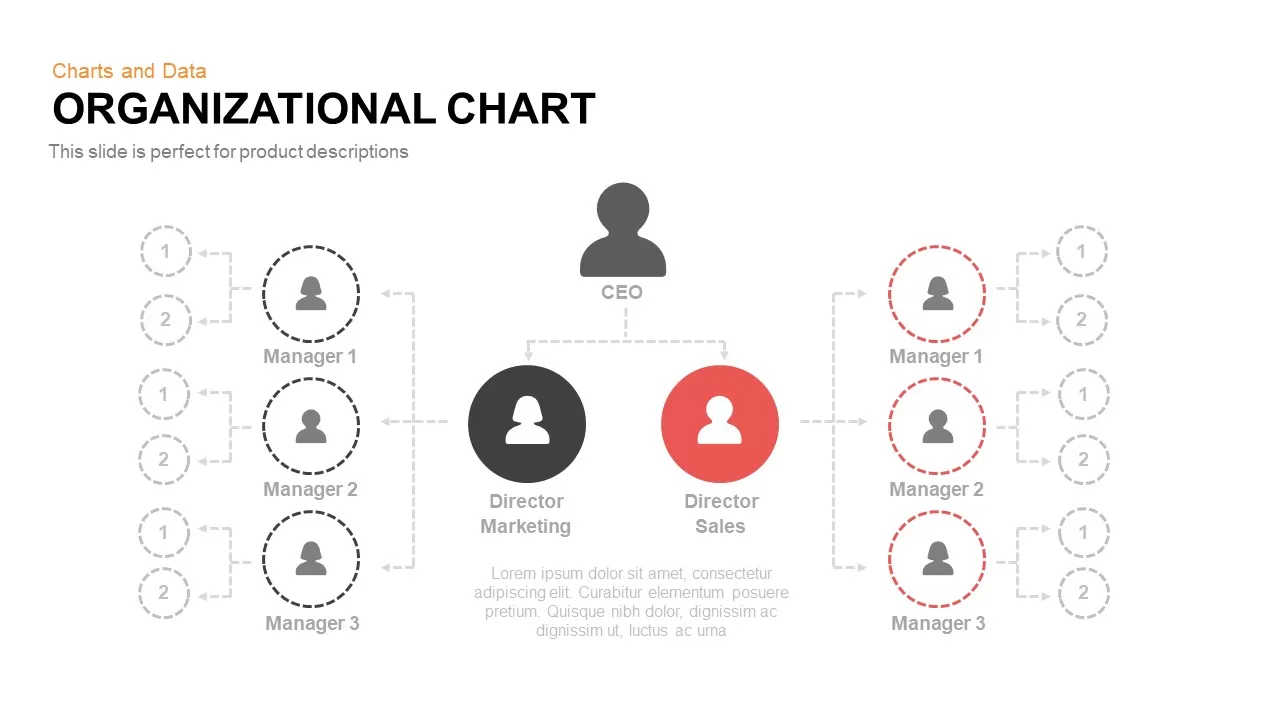
Organizational Chart Template for PowerPoint & Google Slides
Org Chart
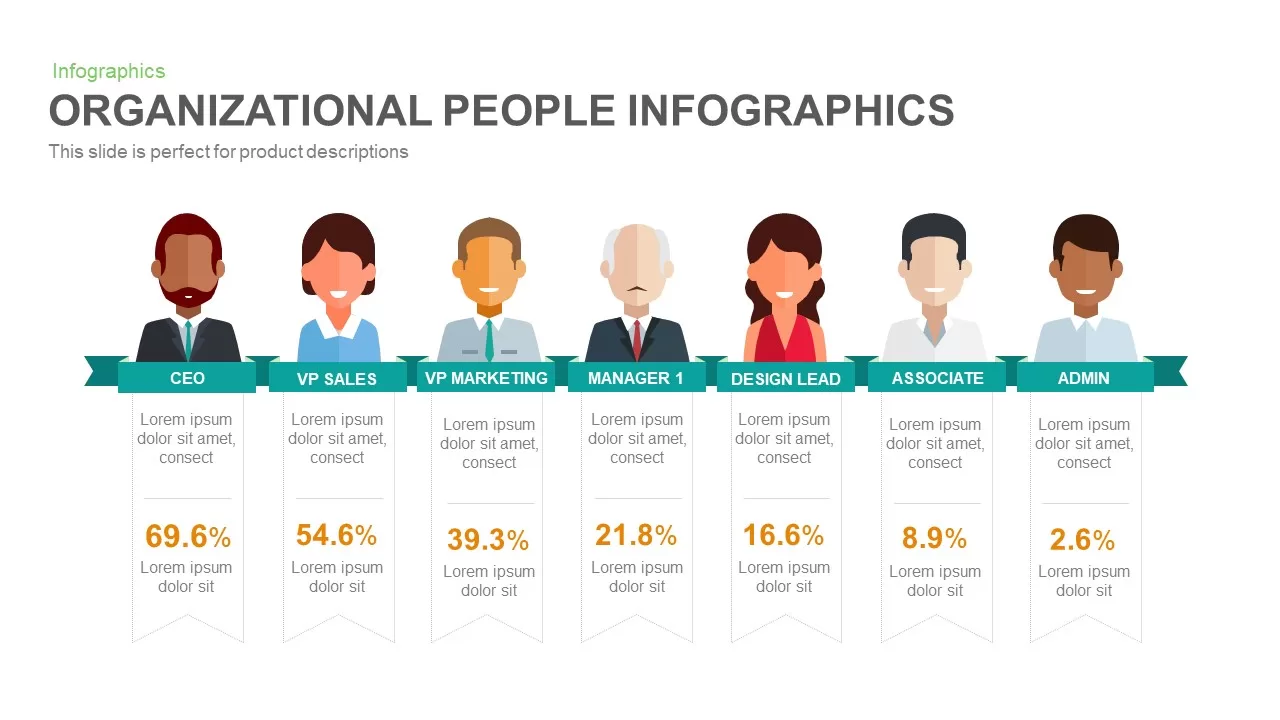
Organizational People Percentage Chart template for PowerPoint & Google Slides
Org Chart
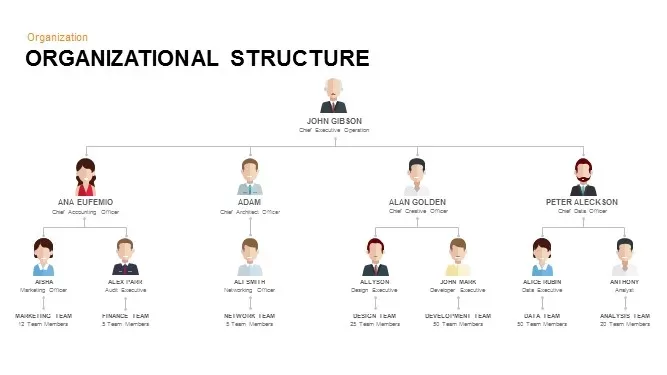
Organizational Structure Org Chart Template for PowerPoint & Google Slides
Org Chart
Organizational Chart Structure template for PowerPoint & Google Slides
Org Chart
Isometric Organizational Structure Chart Template for PowerPoint & Google Slides
Org Chart
Corporate Organizational Chart Hierarchy Template for PowerPoint & Google Slides
Org Chart
Organizational Structure Hierarchy Chart Template for PowerPoint & Google Slides
Org Chart
Modern Organizational Chart Hierarchy Template for PowerPoint & Google Slides
Org Chart
Creative Organizational Chart Template for PowerPoint & Google Slides
Org Chart
Professional Organizational Chart Diagram Template for PowerPoint & Google Slides
Org Chart
Modern Photo-Based Organizational Chart Template for PowerPoint & Google Slides
Org Chart
Modern Image-Based Organizational Chart Template for PowerPoint & Google Slides
Infographics
Organizational Chart Overview template for PowerPoint & Google Slides
Org Chart
Organizational Chart Structure template for PowerPoint & Google Slides
Business Plan
Organizational Chart Template for PowerPoint & Google Slides
Our Team
Organizational Chart template for PowerPoint & Google Slides
Org Chart
Organizational Chart template for PowerPoint & Google Slides
Org Chart
Divisional Organizational Chart Diagram Template for PowerPoint & Google Slides
Org Chart
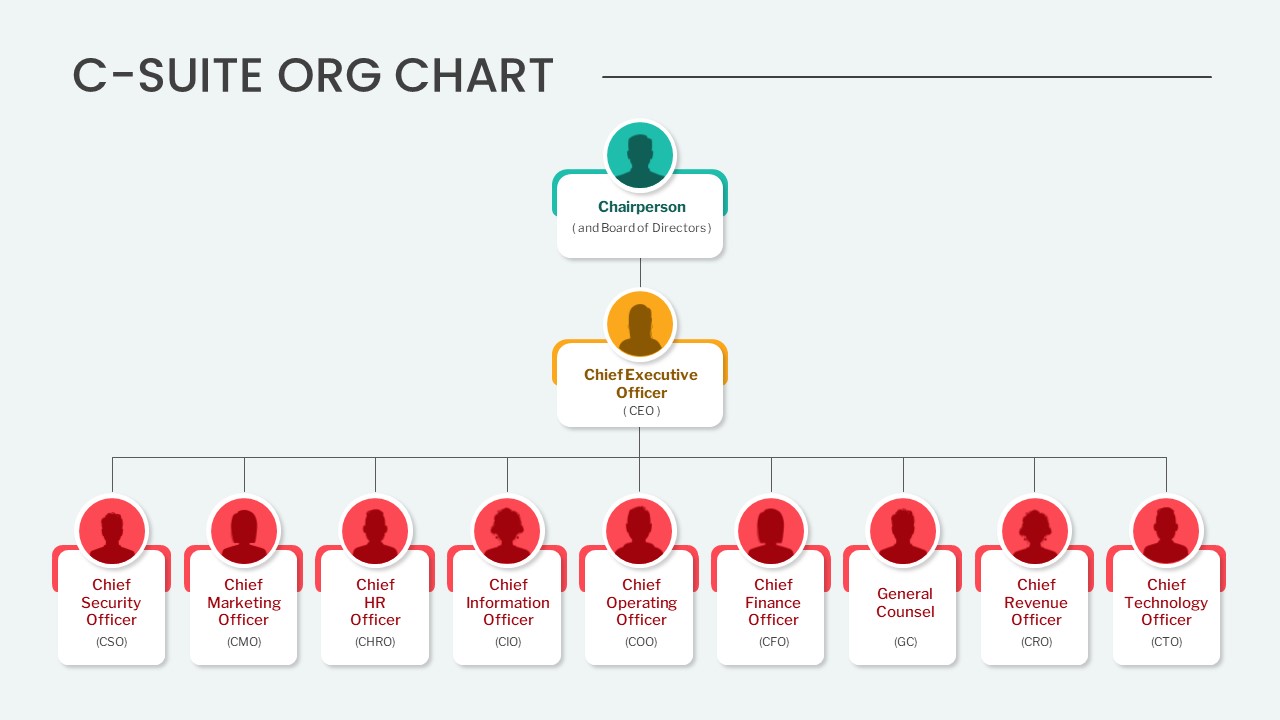
Editable C-Suite Organizational Chart Template for PowerPoint & Google Slides
Org Chart
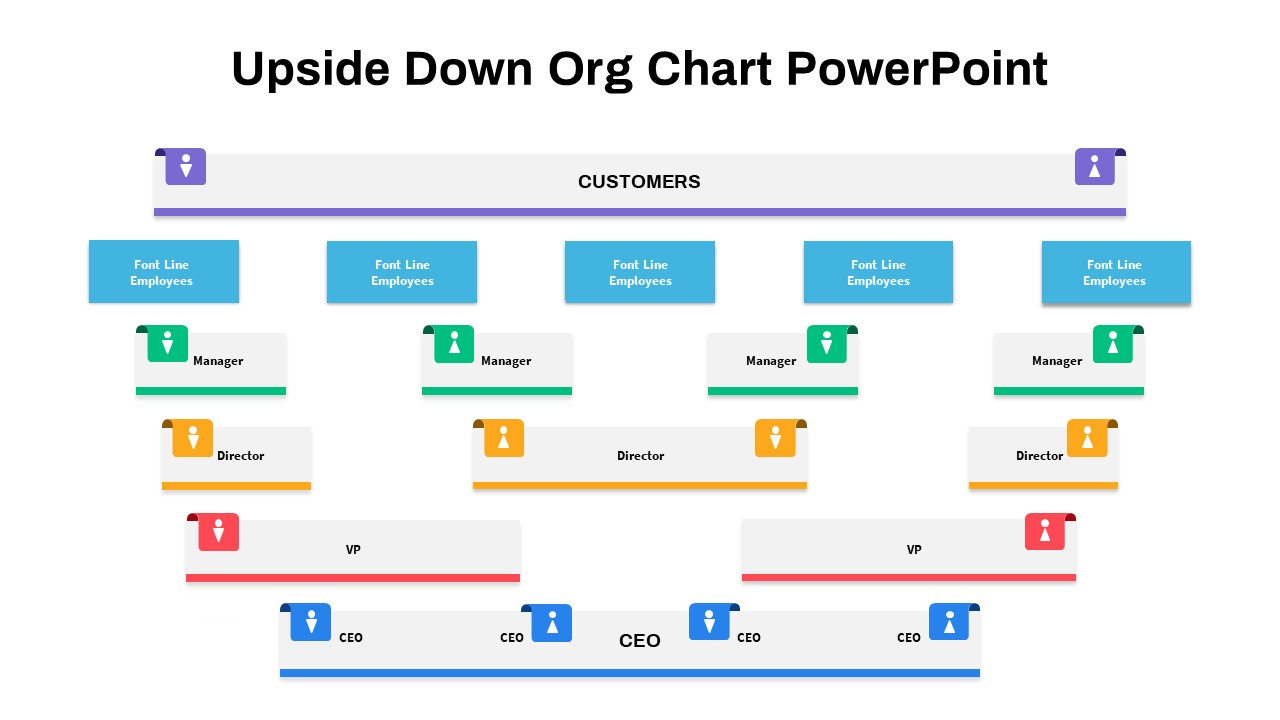
Upside-Down Organizational Chart Diagram Template for PowerPoint & Google Slides
Org Chart
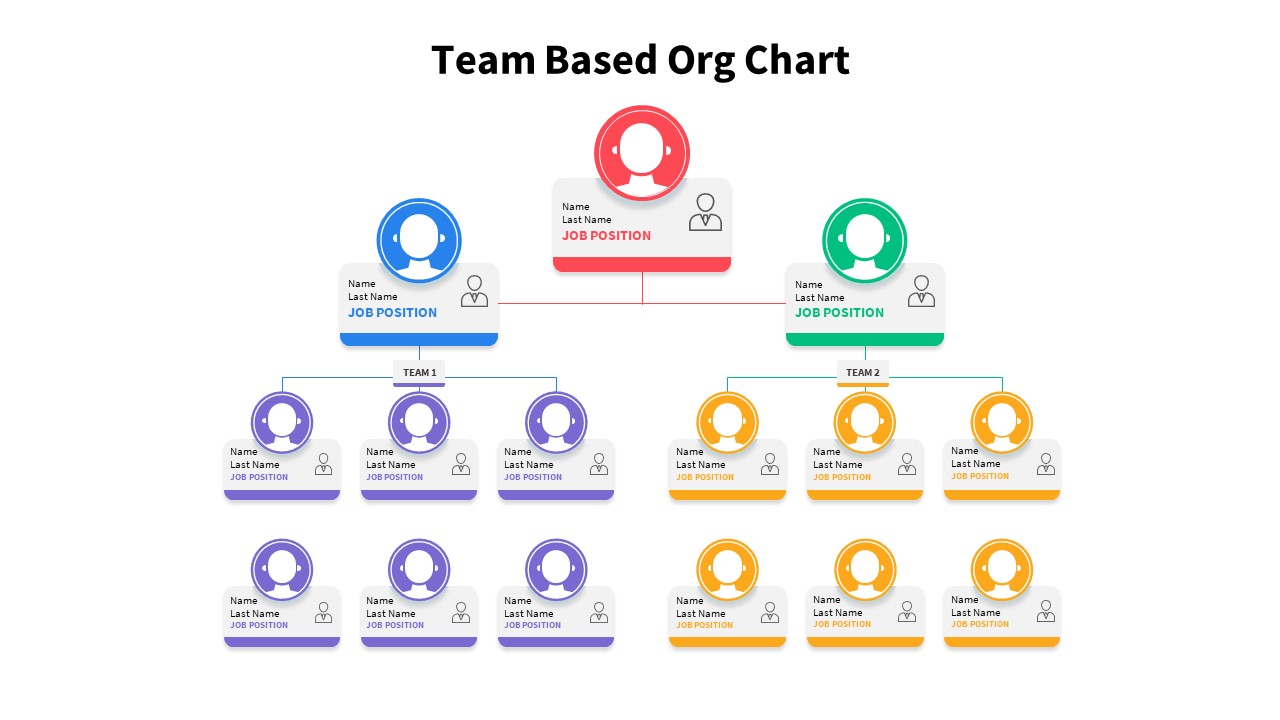
Team-Based Organizational Chart Template for PowerPoint & Google Slides
Org Chart
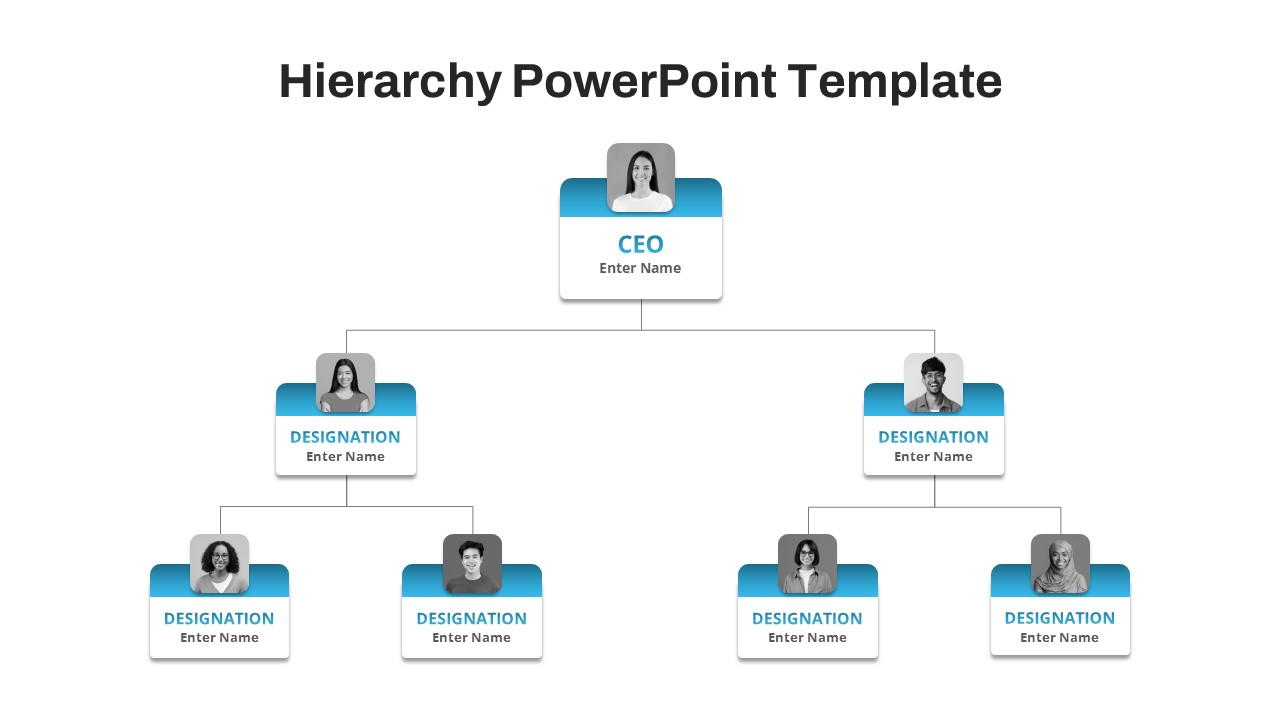
Free Corporate Hierarchy Organizational Chart Template for PowerPoint & Google Slides
Org Chart
Free

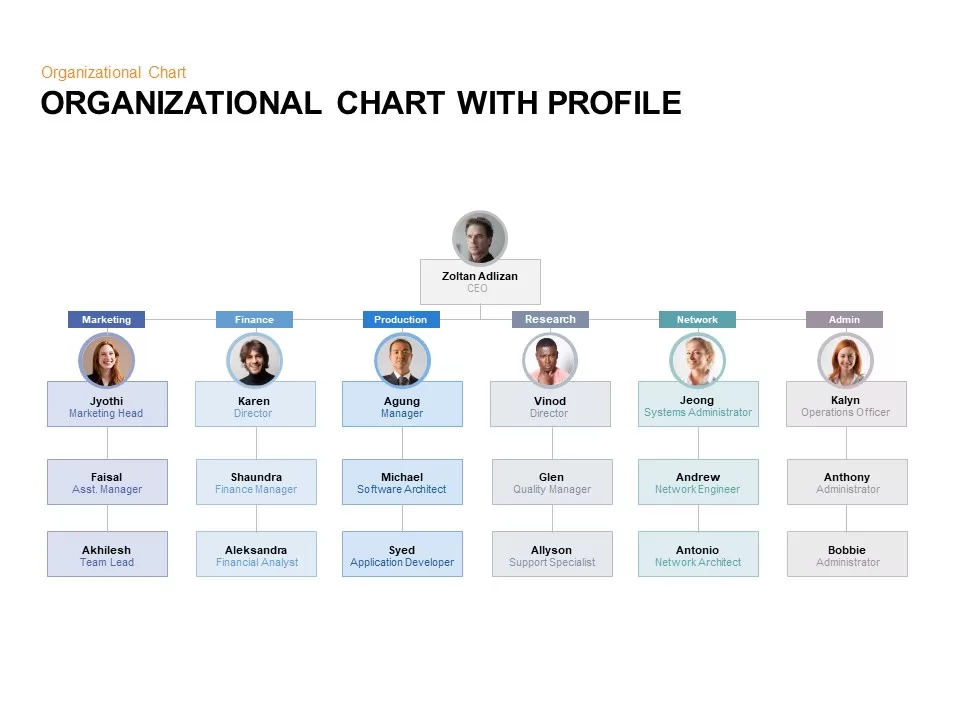
Organizational Chart with Profile for PowerPoint & Google Slides
Org Chart
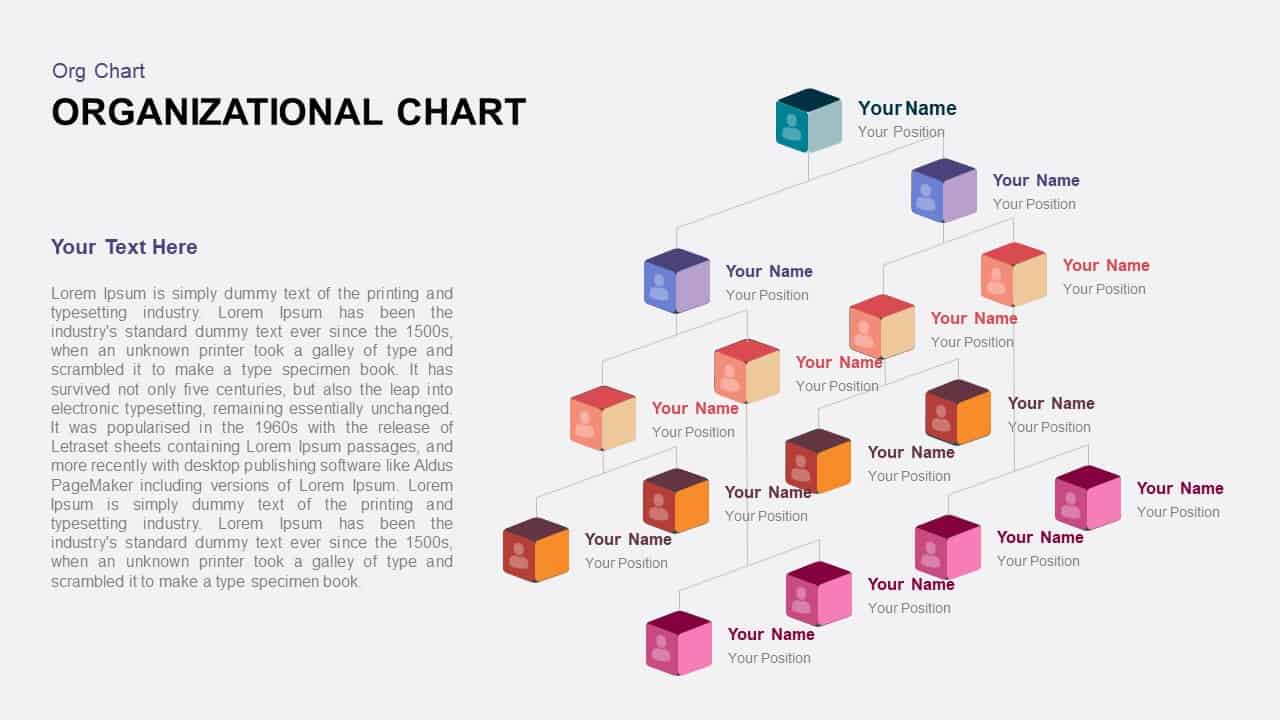
3D Color Block Organizational Chart Slide for PowerPoint & Google Slides
Org Chart
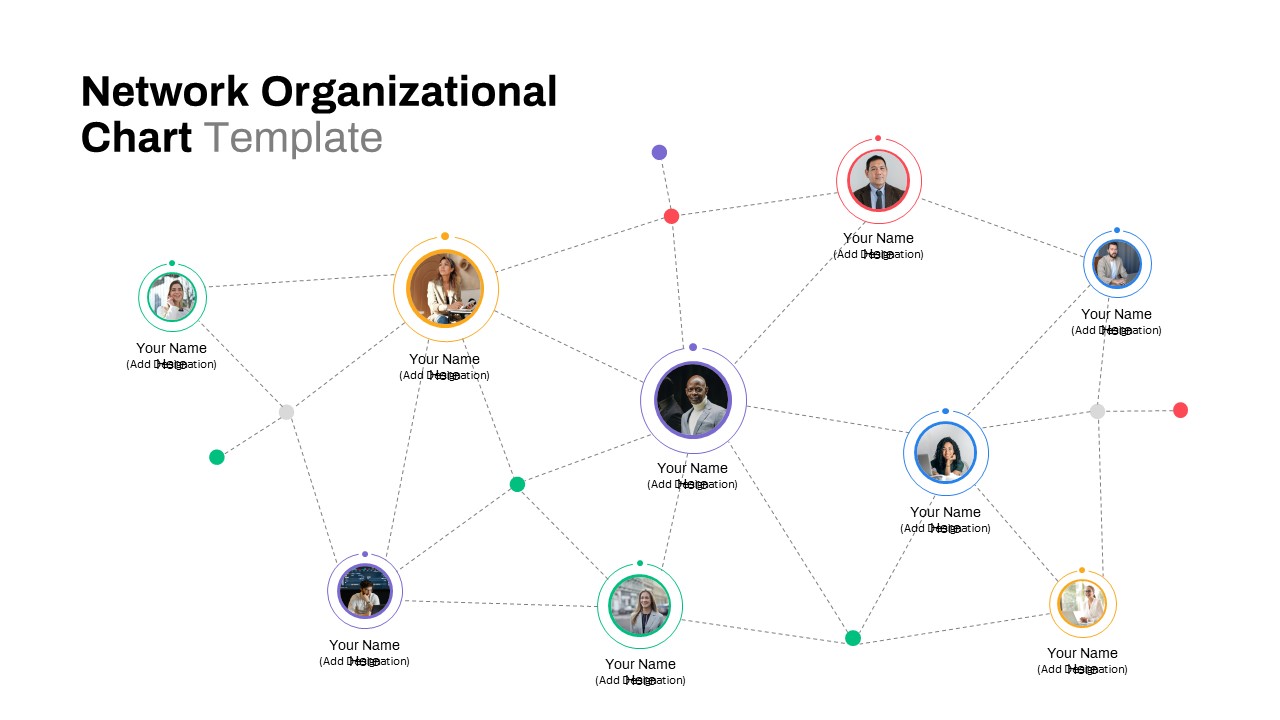
Network Organizational Chart for PowerPoint & Google Slides
Business
Free Organizational Chart for PowerPoint & Google Slides
Business
Free

Organizational Chart Hierarchy Templates for PowerPoint and Keynote
Org Chart
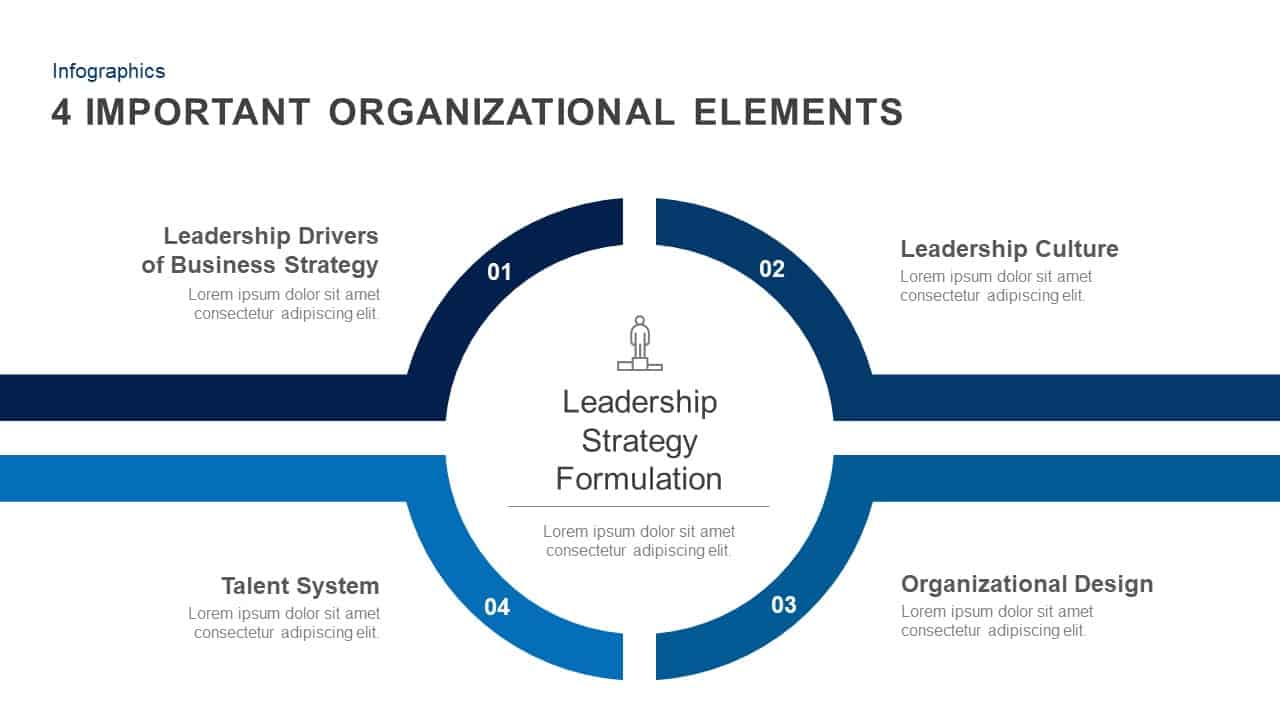
4 Important Organizational Elements template for PowerPoint & Google Slides
Infographics
Hierarchical Organizational Structure Template for PowerPoint & Google Slides
Org Chart
Organizational Structure Diagram Template for PowerPoint & Google Slides
Org Chart
Modern Organizational Hierarchy Diagram Template for PowerPoint & Google Slides
Org Chart
Circular Organizational Structure Layout Template for PowerPoint & Google Slides
Org Chart
Organizational Maturity Model Diagram Template for PowerPoint & Google Slides
Process
Mintzberg Organizational Model Gradient Template for PowerPoint & Google Slides
Business
Circular Organizational Structure Template for PowerPoint & Google Slides
Org Chart
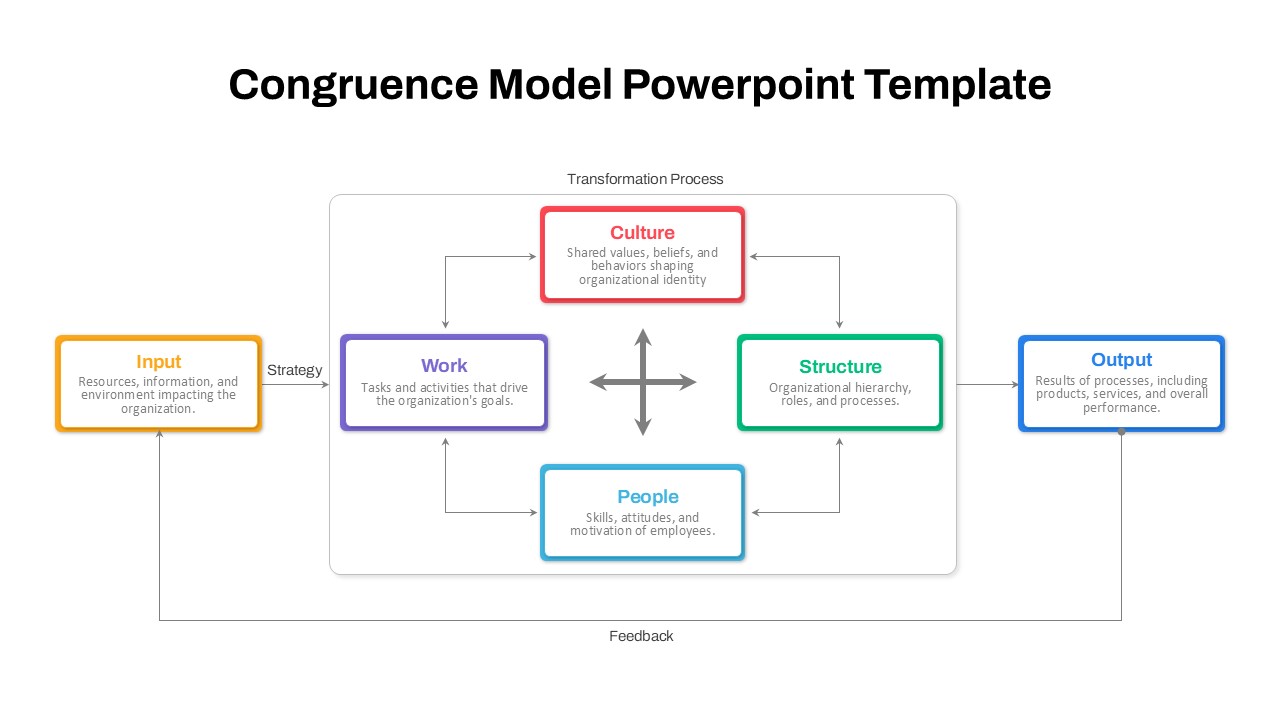
Organizational Congruence Model Diagram Template for PowerPoint & Google Slides
Process
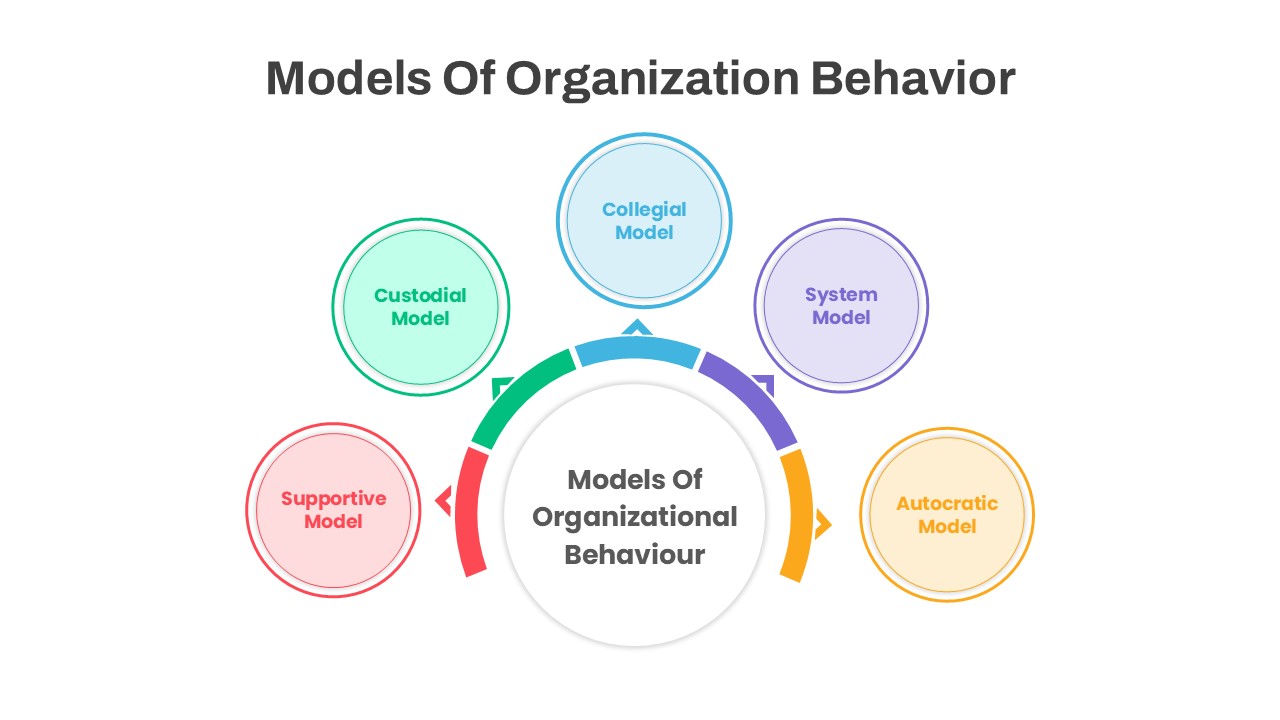
Organizational Behavior Hexagon Diagram Template for PowerPoint & Google Slides
Circular
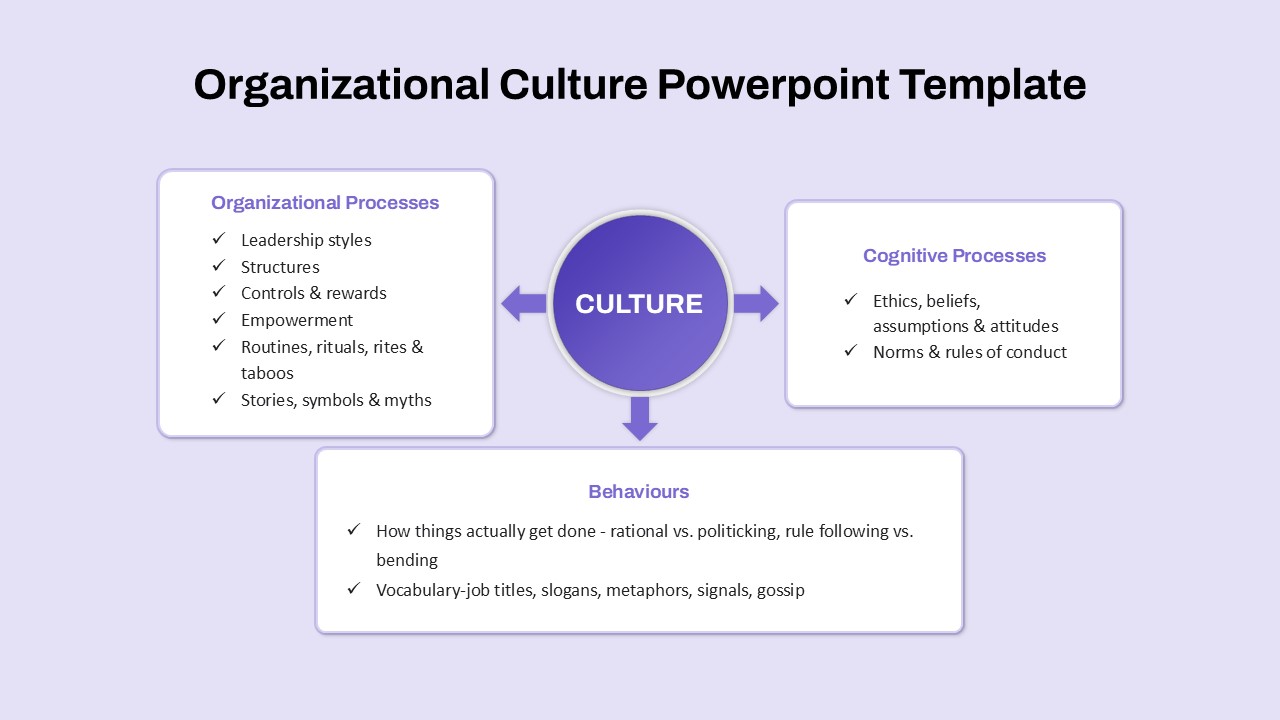
Organizational Culture Framework Diagram Template for PowerPoint & Google Slides
Arrow
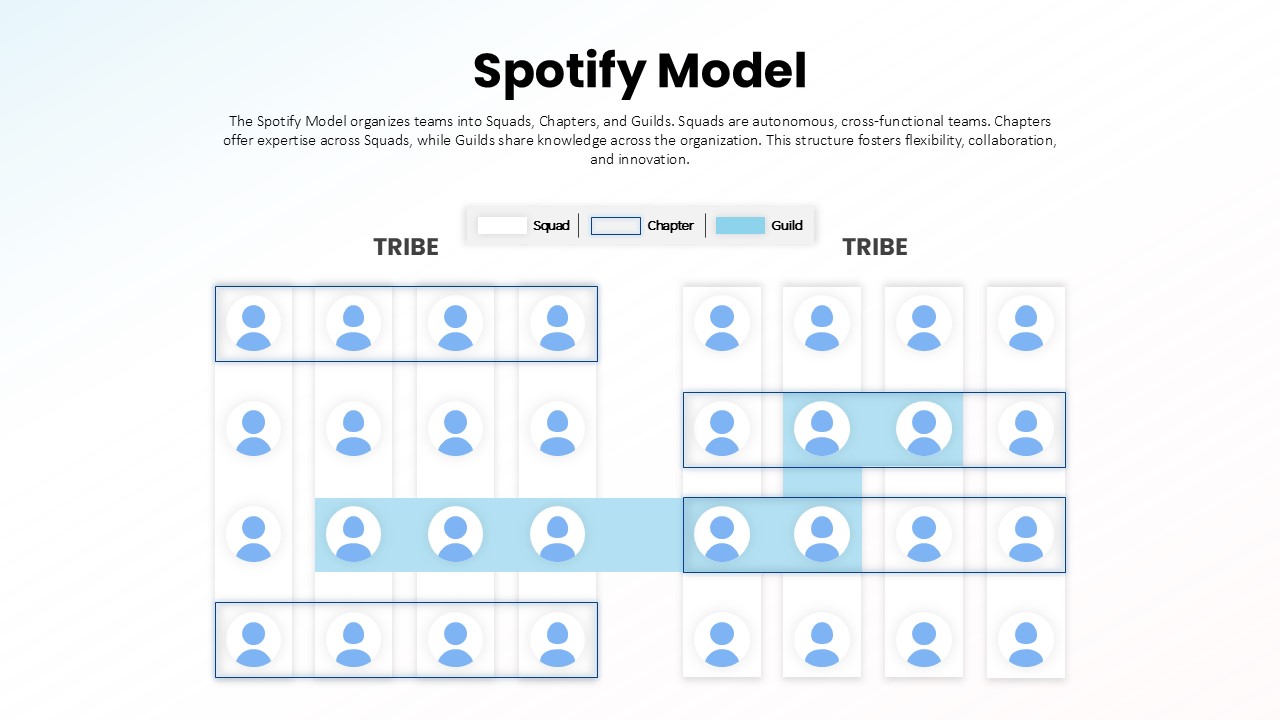
Spotify Model Organizational Structure template for PowerPoint & Google Slides
Business Strategy
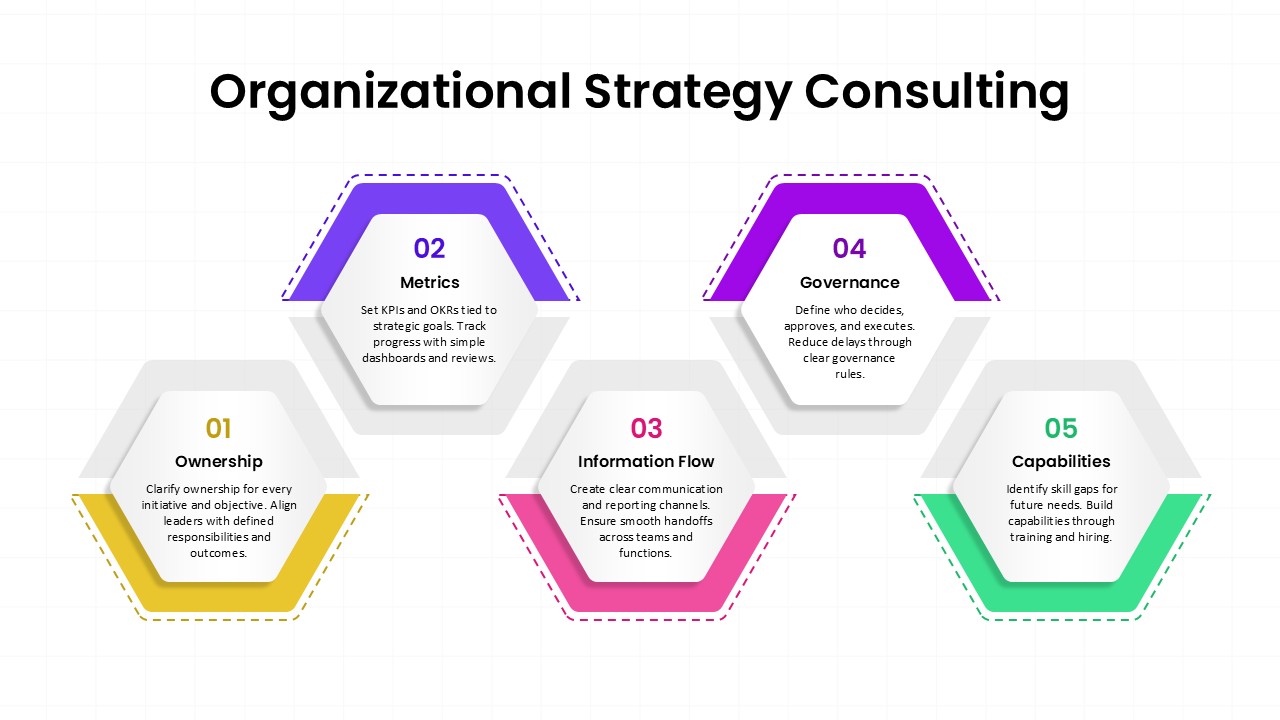
Organizational Strategy Consulting Framework Template for PowerPoint & Google Slides
Consulting

Organizational Structure Diagram for PowerPoint & Google Slides
Org Chart
Quad Chart Infographic Pack of 8 Slides Template for PowerPoint & Google Slides
Comparison Chart
Free Professional Gantt Chart Pack – 4 Slides Template for PowerPoint & Google Slides
Gantt Chart
Free
Bar Chart Sample template for PowerPoint & Google Slides
Bar/Column
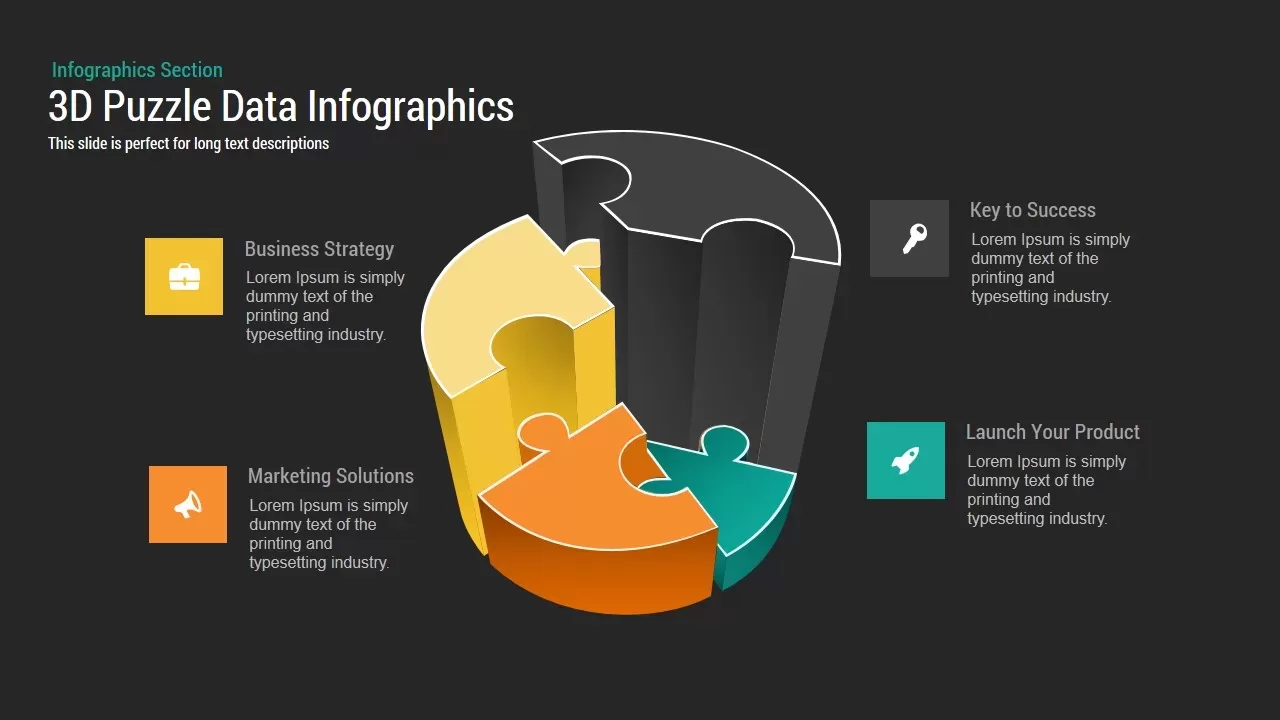
3D Puzzle Chart template for PowerPoint & Google Slides
Infographics
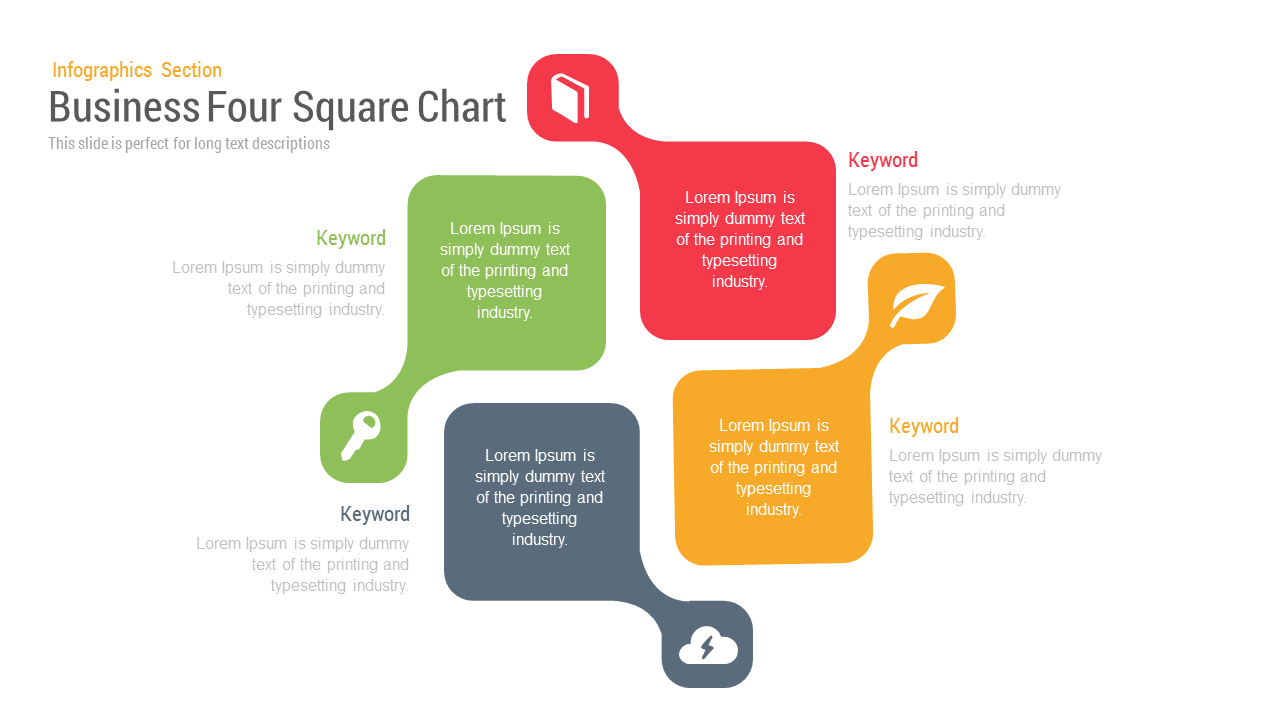
Business Four Square Chart template for PowerPoint & Google Slides
Business
3D Cone Chart Data Visualization template for PowerPoint & Google Slides
Bar/Column

Product Roadmap Gantt Chart Timeline template for PowerPoint & Google Slides
Gantt Chart
Comparison Chart Overview template for PowerPoint & Google Slides
Comparison Chart
RASCI Responsibility Matrix Chart Template for PowerPoint & Google Slides
Business
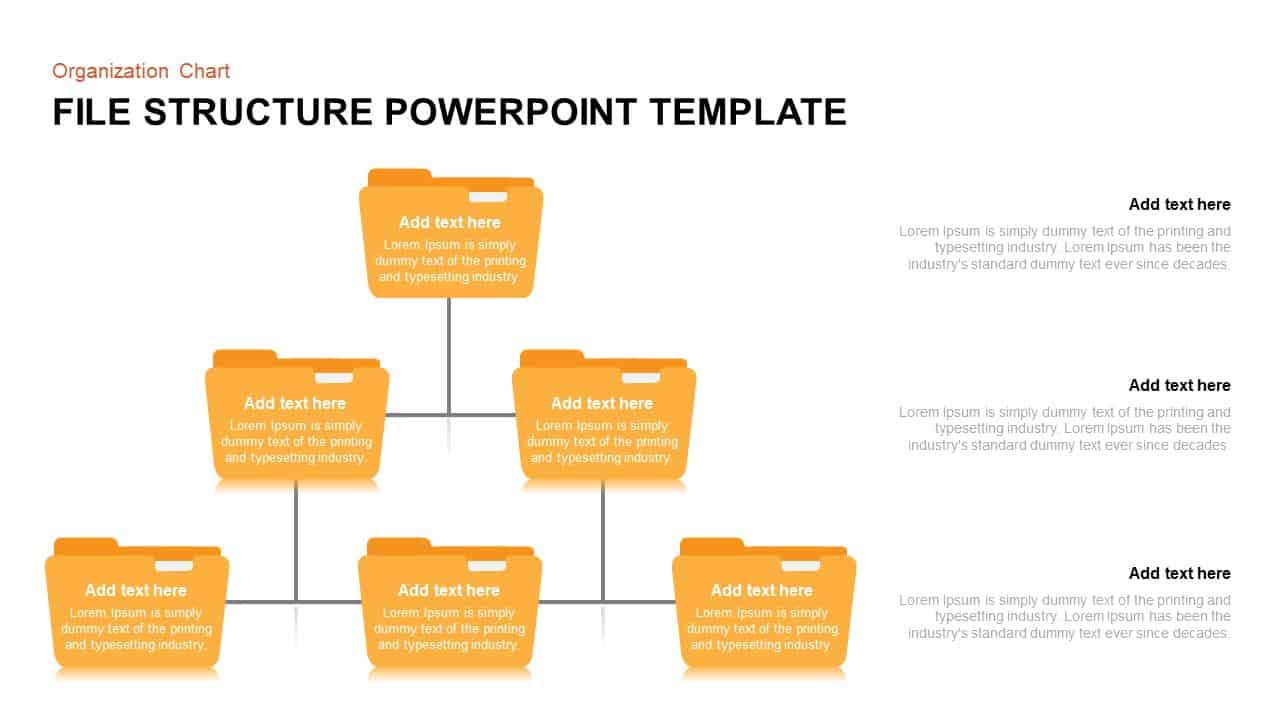
File Structure Organization Chart Template for PowerPoint & Google Slides
Org Chart
Capital Structure Dynamic Split Chart Template for PowerPoint & Google Slides
Comparison Chart
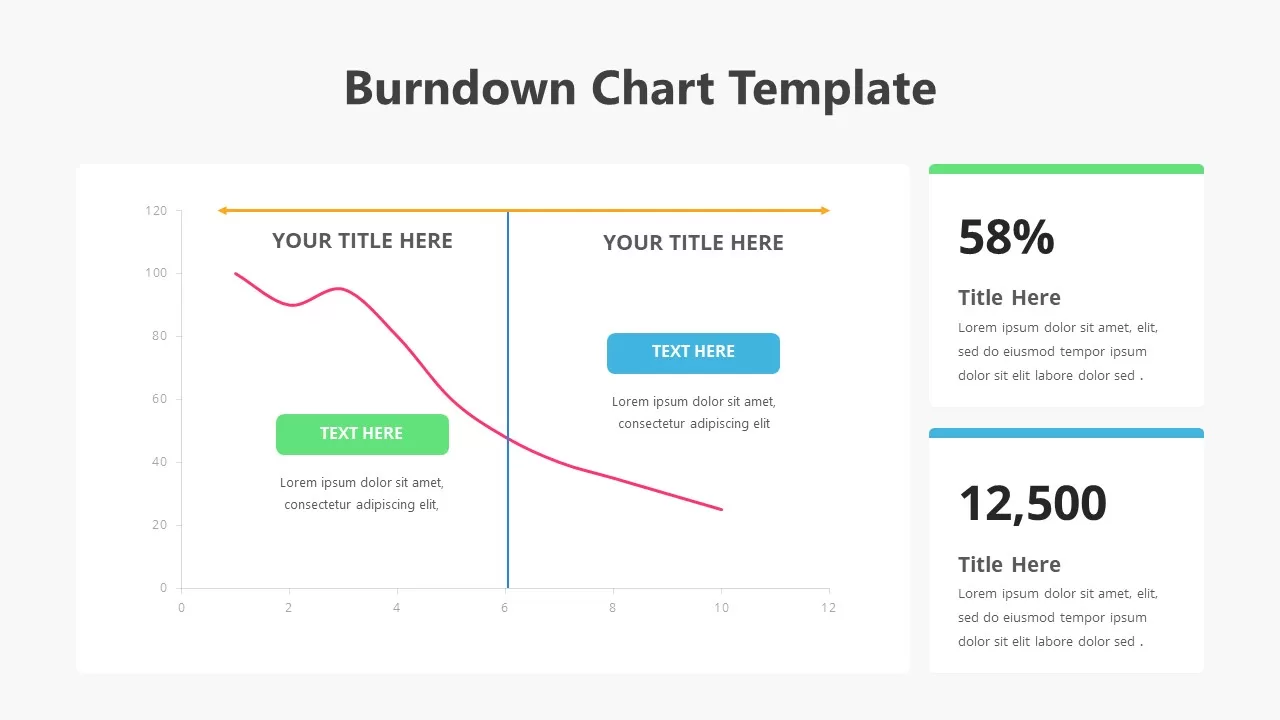
Burndown Chart Template for PowerPoint & Google Slides
Charts
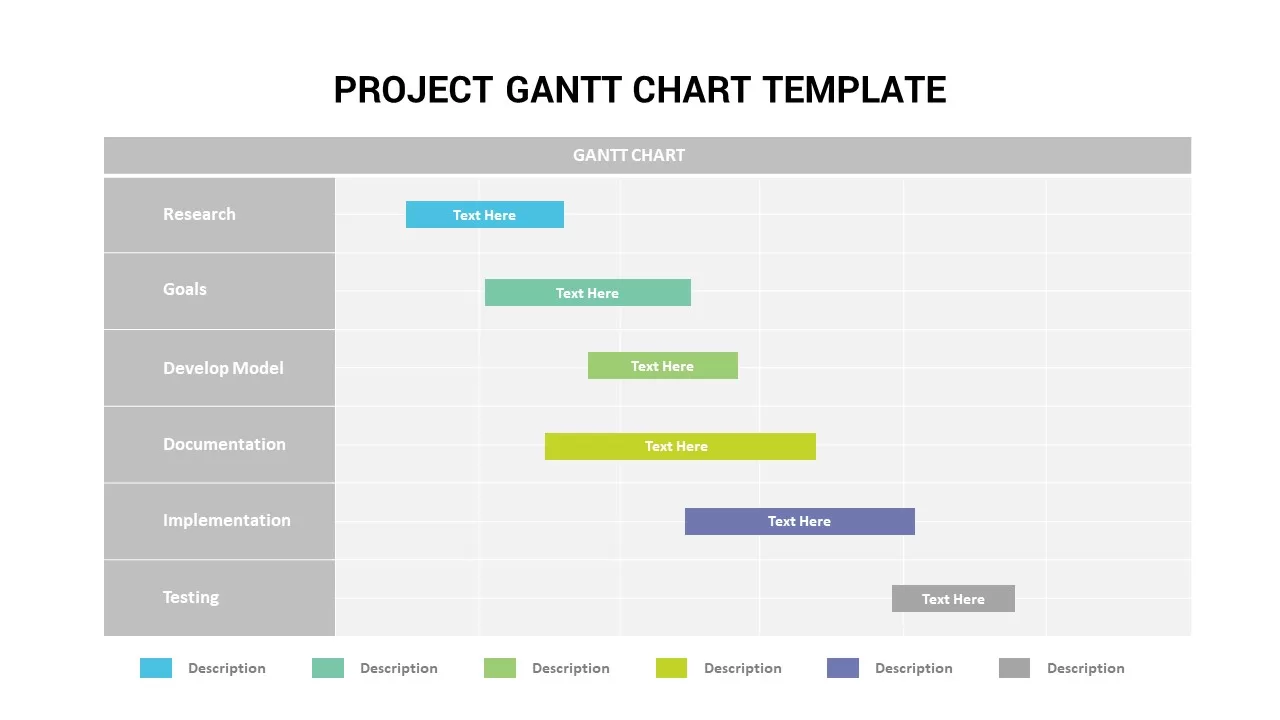
Project Gantt Chart template for PowerPoint & Google Slides
Gantt Chart
Pugh Matrix Decision Comparison Chart Template for PowerPoint & Google Slides
Comparison Chart
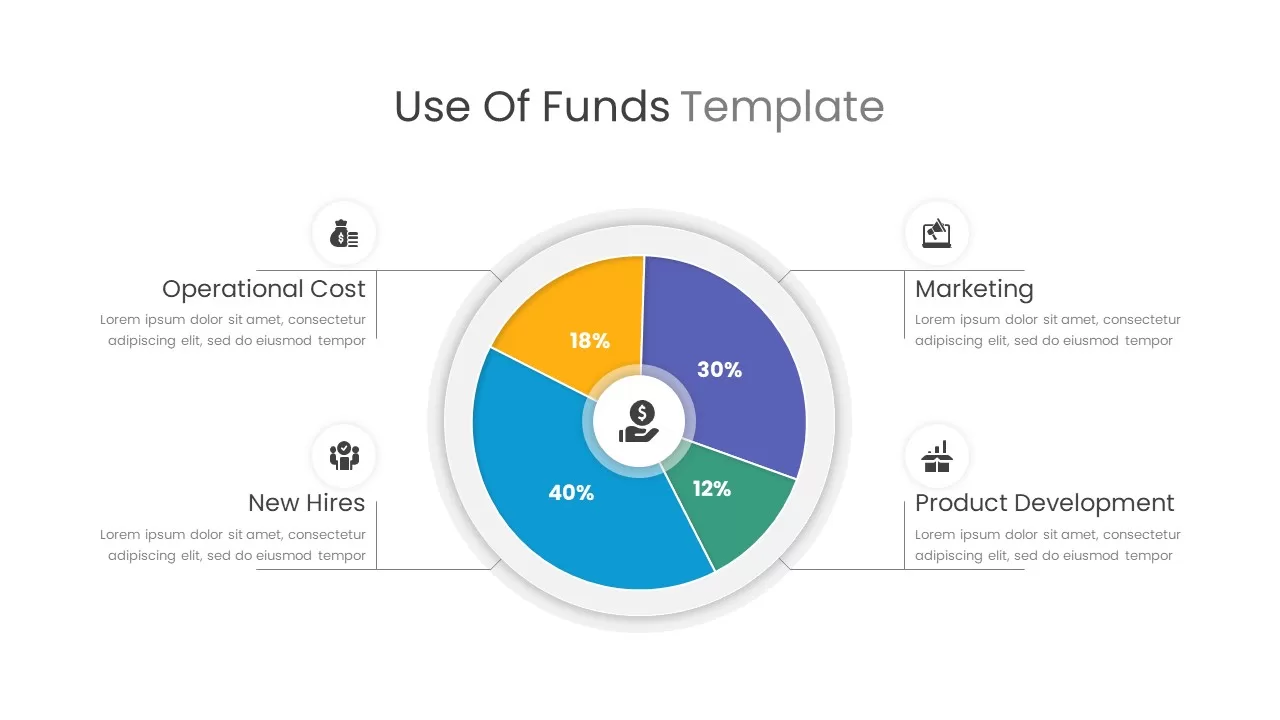
Use of Funds Donut Chart Infographic Template for PowerPoint & Google Slides
Circular
Flow Chart template for PowerPoint & Google Slides
Flow Charts
MABA Attractiveness Matrix Chart Template for PowerPoint & Google Slides
Comparison Chart
Comprehensive Hiring Process Flow Chart Template for PowerPoint & Google Slides
Flow Charts
Waffle Chart Data Visualization Template for PowerPoint & Google Slides
Comparison Chart
People Demographic Comparison Chart Template for PowerPoint & Google Slides
Comparison
Minimal Multi-Year Column Chart Template for PowerPoint & Google Slides
Bar/Column
Waterfall Column Chart Analysis Template for PowerPoint & Google Slides
Bar/Column
Colorful Four-Segment Wheel Chart Template for PowerPoint & Google Slides
Circular
Mekko Chart with Segmented Branches & Leaves Template for PowerPoint & Google Slides
Bar/Column
Mirror Bar Chart Comparison Template for PowerPoint & Google Slides
Bar/Column
Free Learning Retention Pyramid Chart Template for PowerPoint & Google Slides
Pyramid
Free
Proportional Area Chart Analysis Template for PowerPoint & Google Slides
Comparison Chart
Skimming Pricing Strategy Line Chart Template for PowerPoint & Google Slides
Business Strategy
Sustainability Goals and Targets Chart Template for PowerPoint & Google Slides
Goals
ESG Initiatives Comparison Chart Template for PowerPoint & Google Slides
Business
Company Structure Hierarchical Org Chart Template for PowerPoint & Google Slides
Org Chart
3D Pyramid Column Chart Infographic Template for PowerPoint & Google Slides
Bar/Column
Technical Skills Donut Chart Overview Template for PowerPoint & Google Slides
HR
Skills Gap Analysis Comparison Chart Template for PowerPoint & Google Slides
Gap
Color-Coded Gantt Chart template for PowerPoint & Google Slides
Business
Team Gantt Chart Overview template for PowerPoint & Google Slides
Project Status
Stacked Gantt Chart Timeline Slide Template for PowerPoint & Google Slides
Gantt Chart
Attribution Modeling Flow Chart Template for PowerPoint & Google Slides
Flow Charts
Marketing Budget Allocation Donut Chart Template for PowerPoint & Google Slides
Marketing
Static Gantt Chart Overview template for PowerPoint & Google Slides
Project Status
USA Map with Bar Chart Template for PowerPoint & Google Slides
World Maps