Corporate Organizational Chart PowerPoint Template


Corporate Organizational Chart Template for PowerPoint and Google Slides
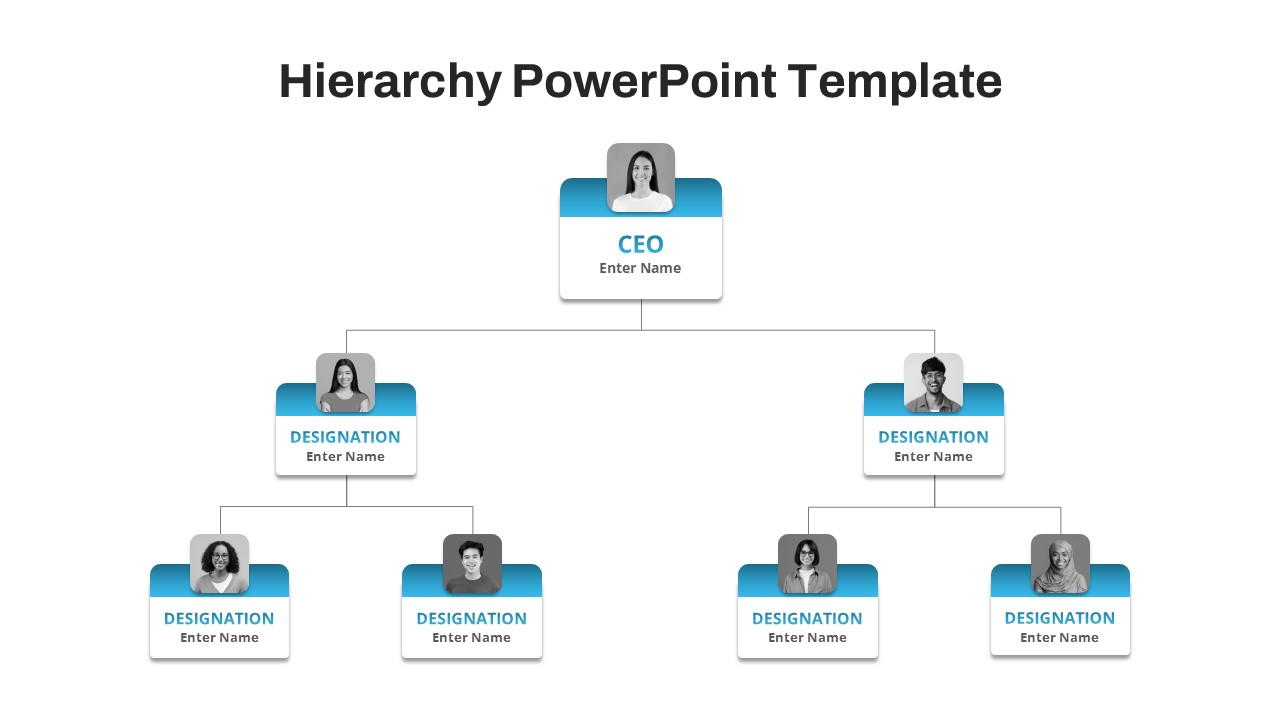
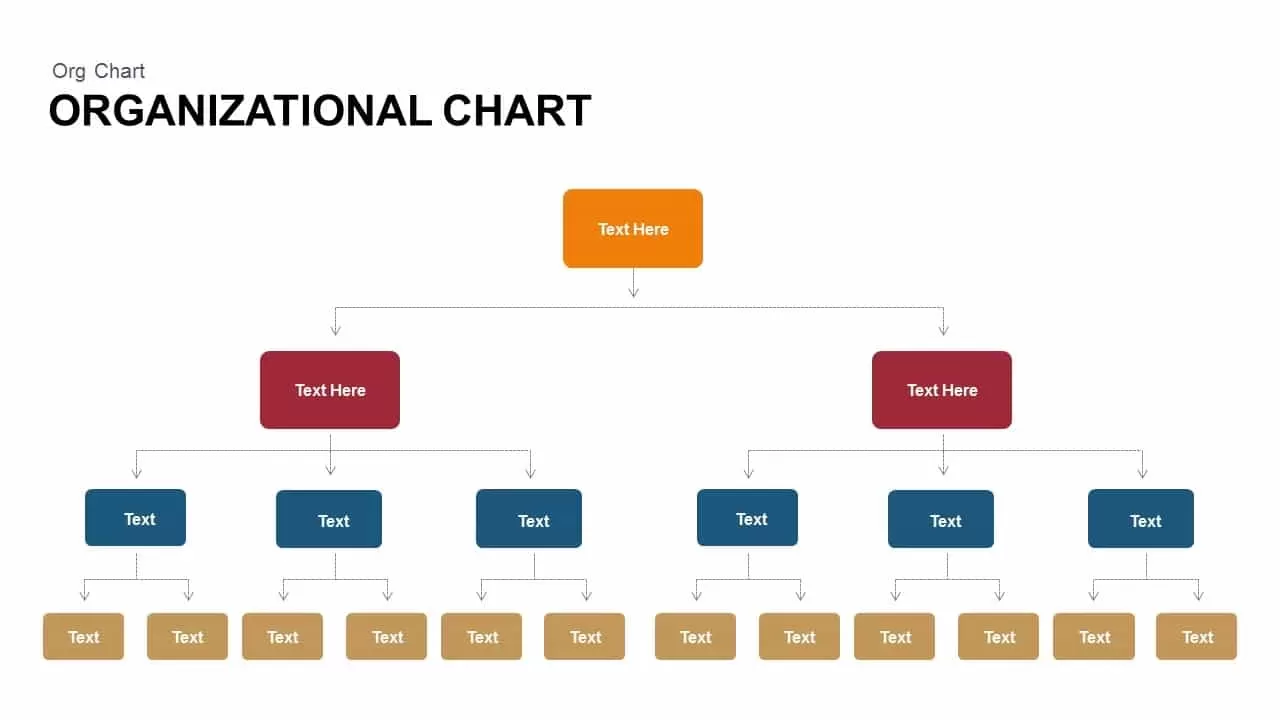
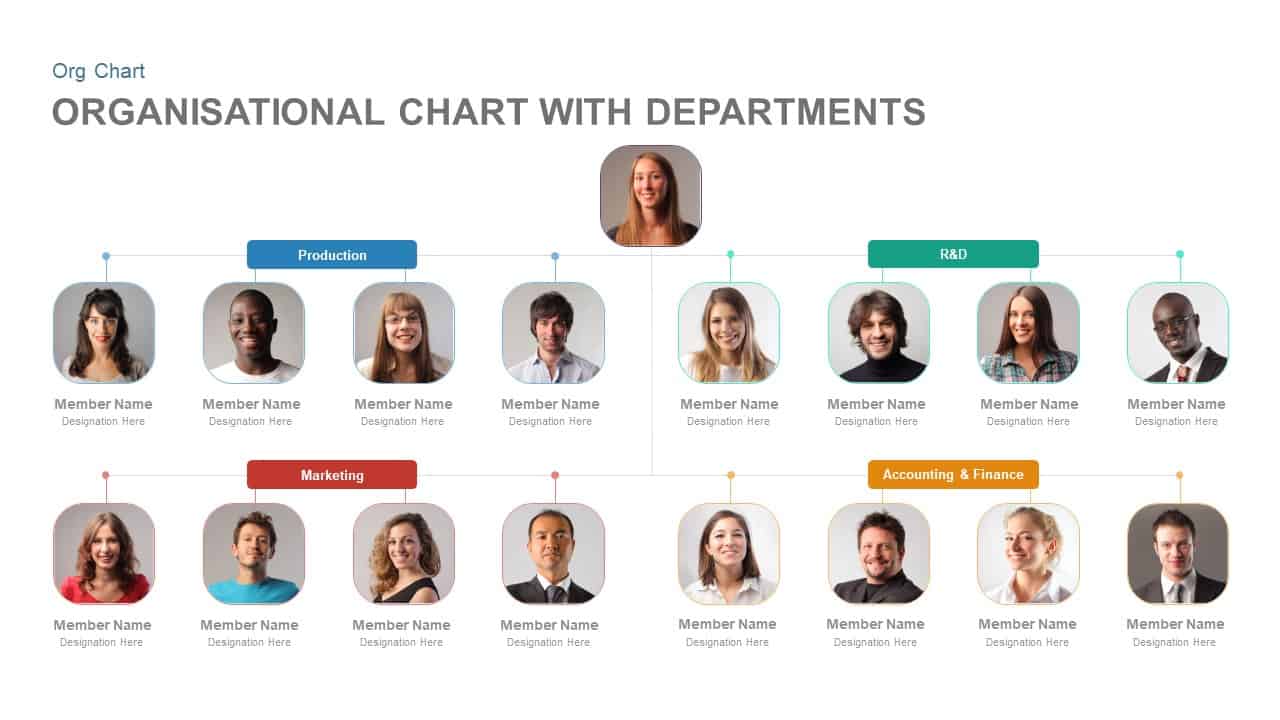
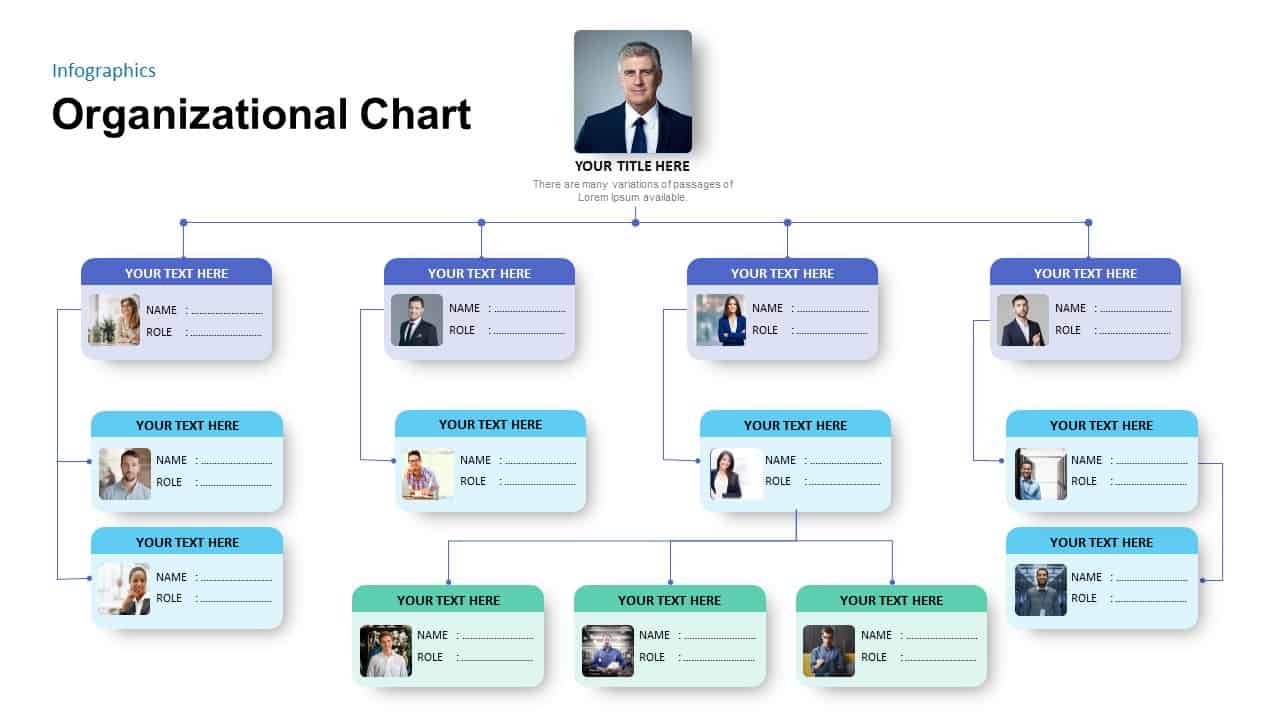
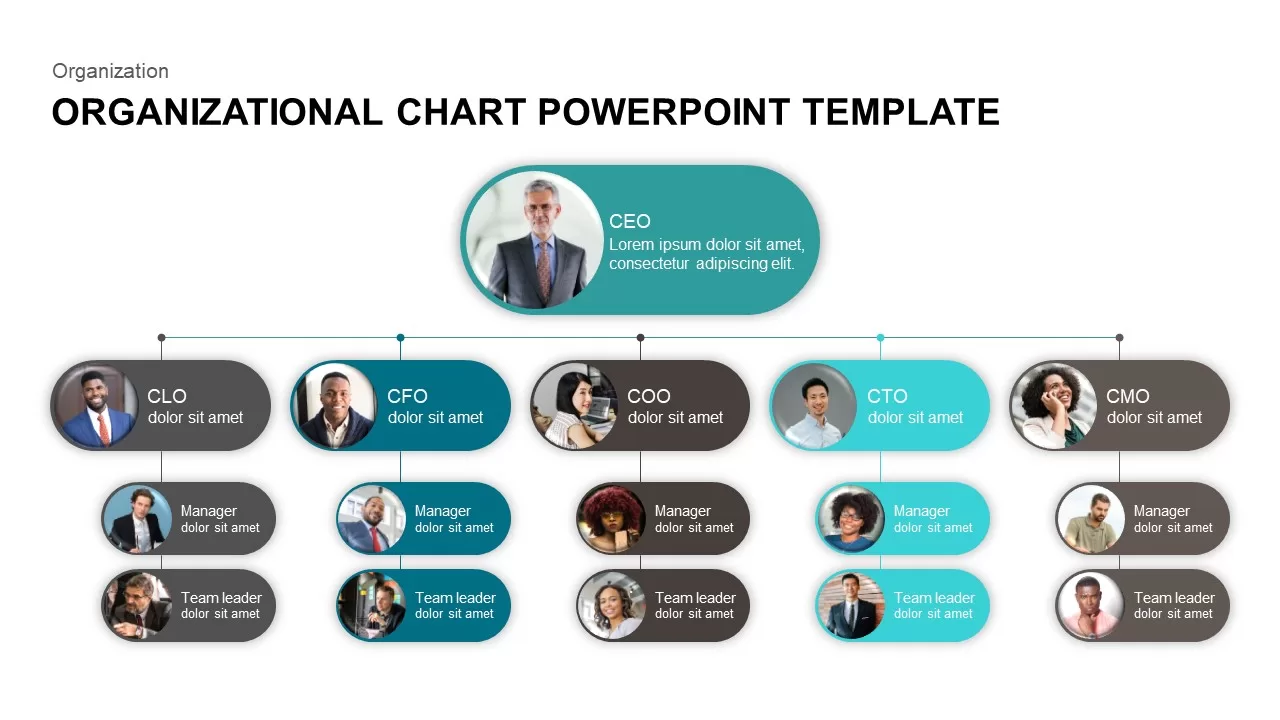
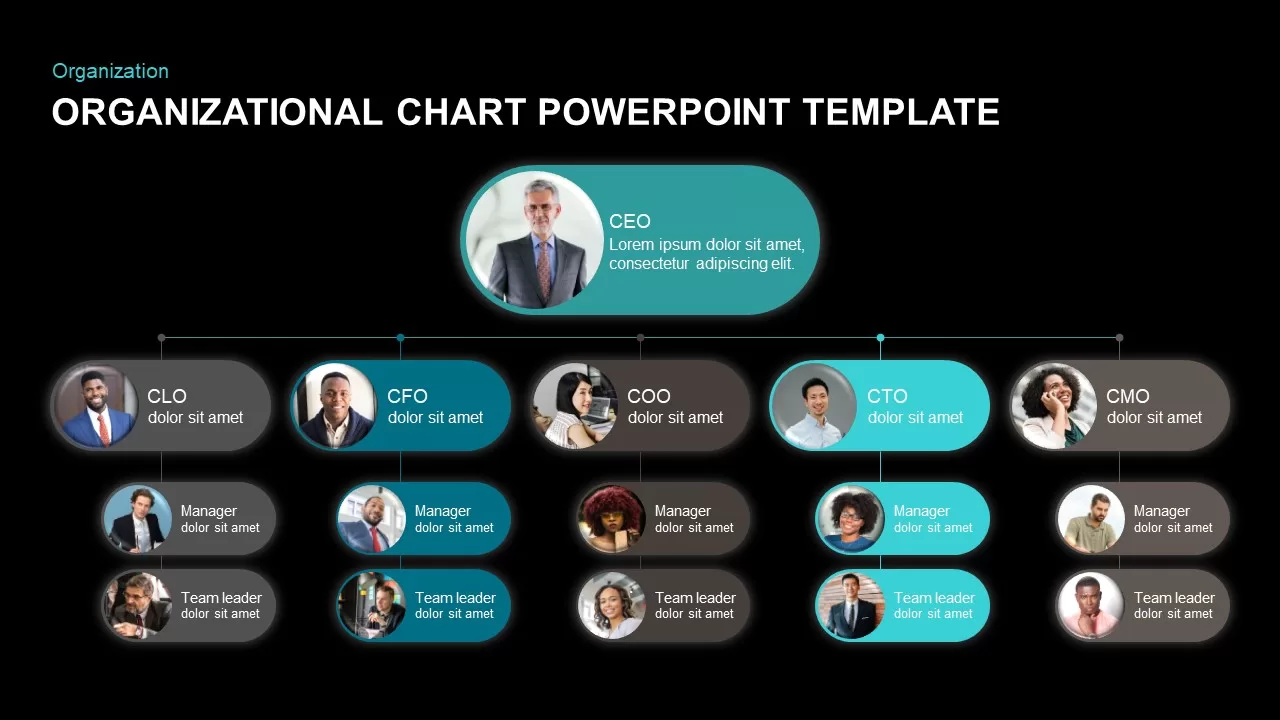
Three-tier hierarchy on one slide. CEO at the top in a large oval capsule with photo and description. Five C-suite roles below (CLO, CFO, COO, CTO, CMO) in pill-shaped cards, each with a circular headshot and title. Under each executive, two more tiers: Manager and Team Leader, in smaller capsule shapes. Thin connector lines link every level. The five columns alternate between teal and gray-brown colors so each reporting chain is visually distinct.
That’s 16 positions total on one slide: 1 CEO, 5 executives, 5 managers, 5 team leaders. Light and dark versions. 16:9 and 4:3. Editable in PowerPoint and Google Slides.
Organizational Chart PowerPoint Template for C-Suite Structures
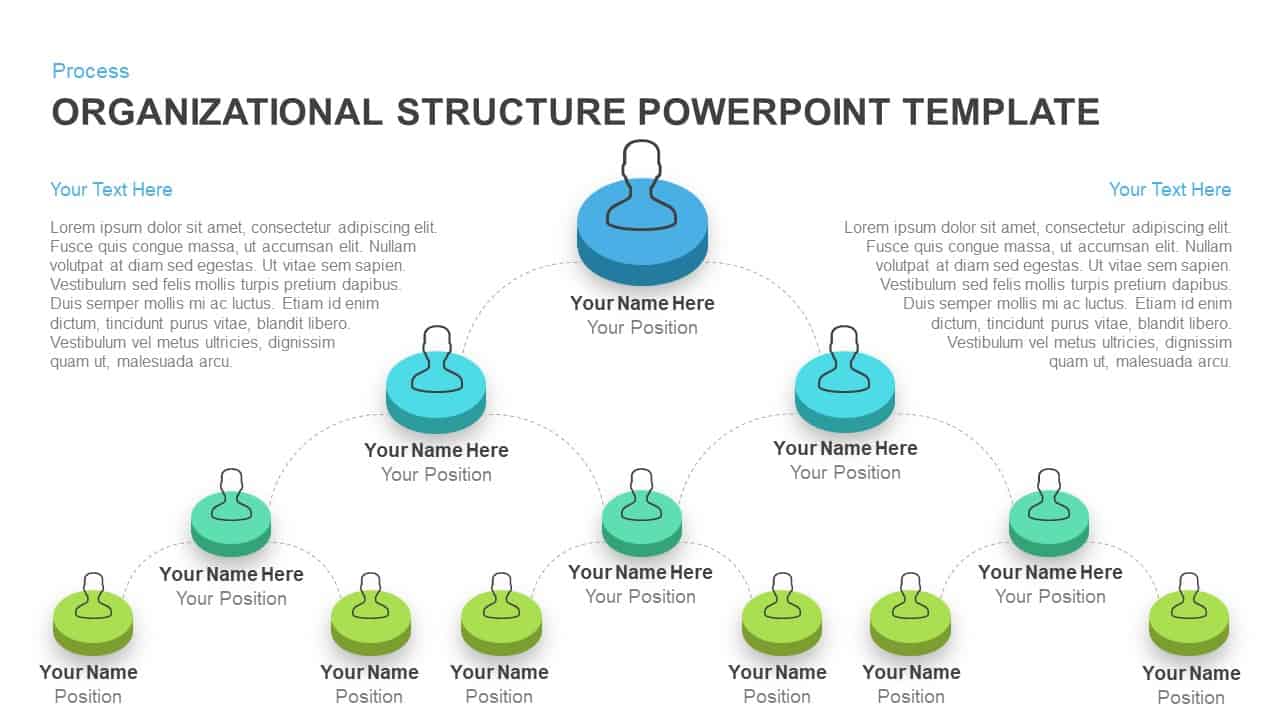
The layout maps to how most mid-size companies are actually structured. CEO on top, five department heads reporting in, each with a manager and team lead below them. If your company has this kind of structure, you just swap in photos and names and the chart is done.
HR teams use this in onboarding decks so new employees can see who reports to whom. It’s faster than explaining the structure verbally and more useful than a text list of names and titles. The photos make it personal, which matters when someone is trying to remember 16 names in their first week.
Executives present this in board meetings when discussing leadership structure, succession planning, or reorganization proposals. If you’re merging two departments or adding a new C-suite role, updating this chart and showing the before/after is the clearest way to communicate the change.
Consultants include org charts in client deliverables when recommending structural changes. Startups use it in pitch decks to show investors the leadership team and how the company is organized. The five-column layout also works for project teams, where the top row is a project sponsor, middle row is workstream leads, and bottom rows are team members.
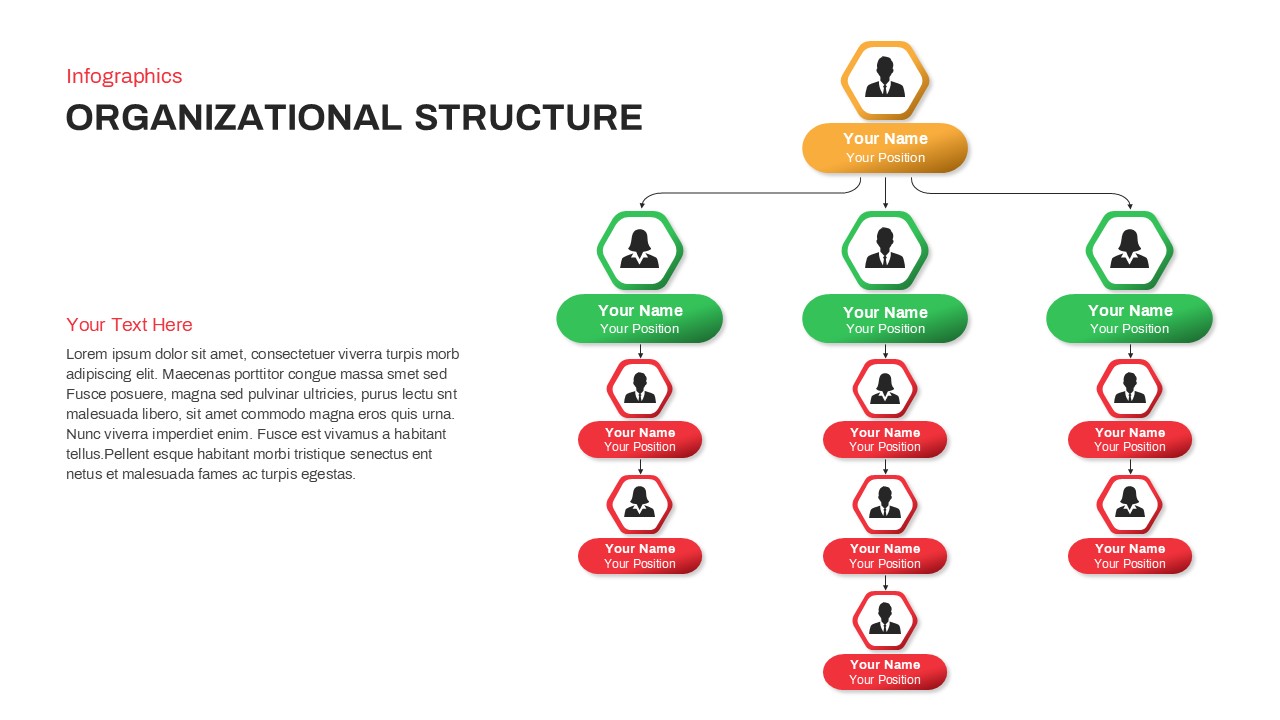
To add more people under any branch, duplicate one of the smaller capsule shapes and connect it. To remove a branch, delete the column. The capsule shapes and connectors are separate objects, not grouped into a single rigid chart, so rearranging is straightforward.
Login to download this file

Item ID
SB01255
Related Templates

Free Corporate Hierarchy Organizational Chart Template for PowerPoint & Google Slides
Org Chart
Free
Simple Organizational Chart Infographic Template for PowerPoint & Google Slides
Org Chart
Organizational Chart Template for PowerPoint & Google Slides
Org Chart
Organizational People Percentage Chart template for PowerPoint & Google Slides
Org Chart
Organizational Structure Org Chart Template for PowerPoint & Google Slides
Org Chart

Organizational Chart with Profile PowerPoint Template
Org Chart
Organizational Chart PowerPoint Template
Org Chart
Organizational Chart PowerPoint Template
Org Chart
Isometric Organizational Structure Chart Template for PowerPoint & Google Slides
Org Chart
Organizational Structure Hierarchy Chart Template for PowerPoint & Google Slides
Org Chart
Modern Organizational Chart Hierarchy Template for PowerPoint & Google Slides
Org Chart
Creative Organizational Chart Template for PowerPoint & Google Slides
Org Chart
Modern Photo-Based Organizational Chart Template for PowerPoint & Google Slides
Org Chart
Modern Image-Based Organizational Chart Template for PowerPoint & Google Slides
Infographics
Organizational Chart Overview template for PowerPoint & Google Slides
Org Chart
Organizational Chart template for PowerPoint & Google Slides
Org Chart
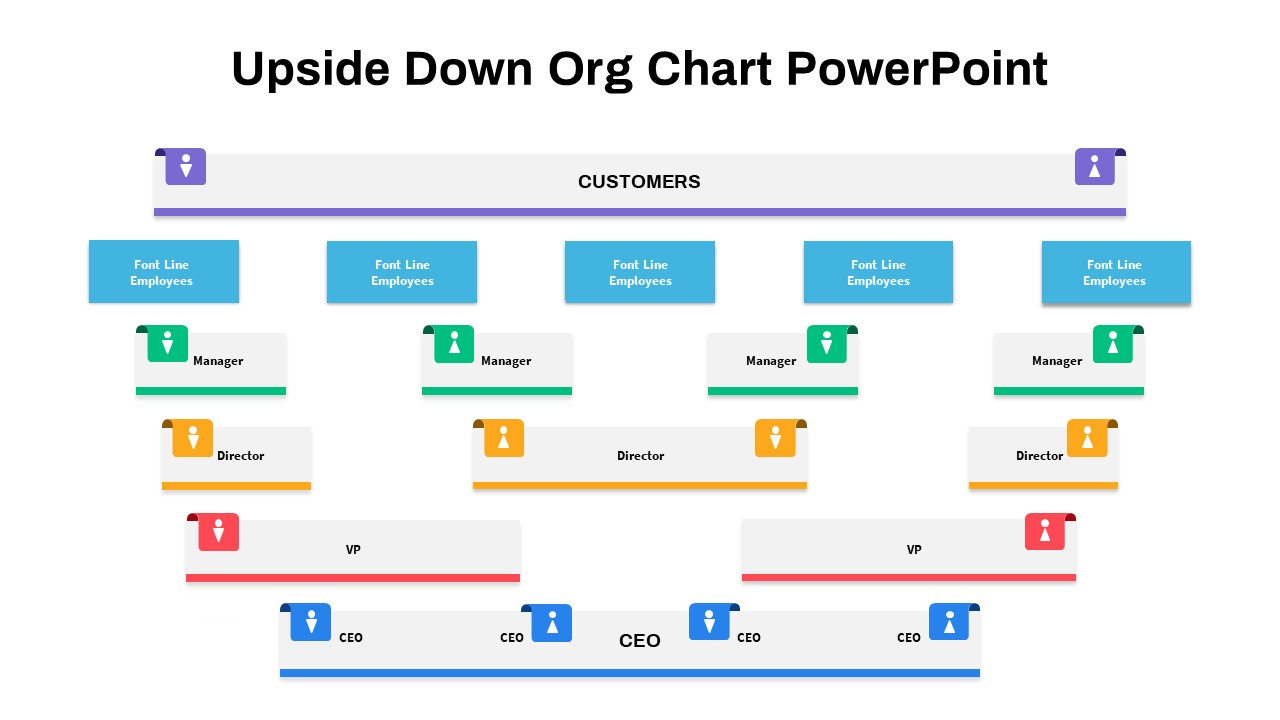
Upside-Down Organizational Chart Diagram Template for PowerPoint & Google Slides
Org Chart
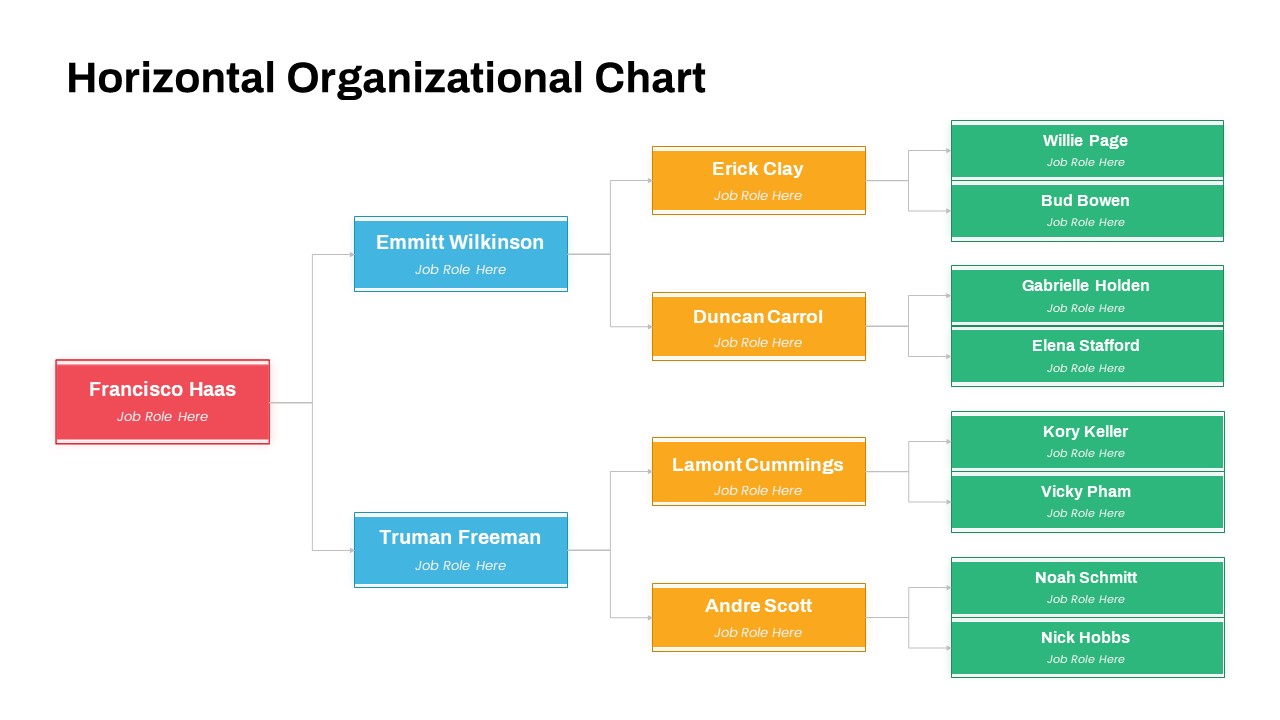
Horizontal Organizational Chart Template for PowerPoint & Google Slides
Org Chart
Horizontal Organizational Chart Template for PowerPoint & Google Slides
Org Chart
Stakeholder Mapping Organizational Chart Template for PowerPoint & Google Slides
Org Chart