Charts Presentation Templates for PowerPoint and Google Slides
![]() Filter
Filter
Filter
-
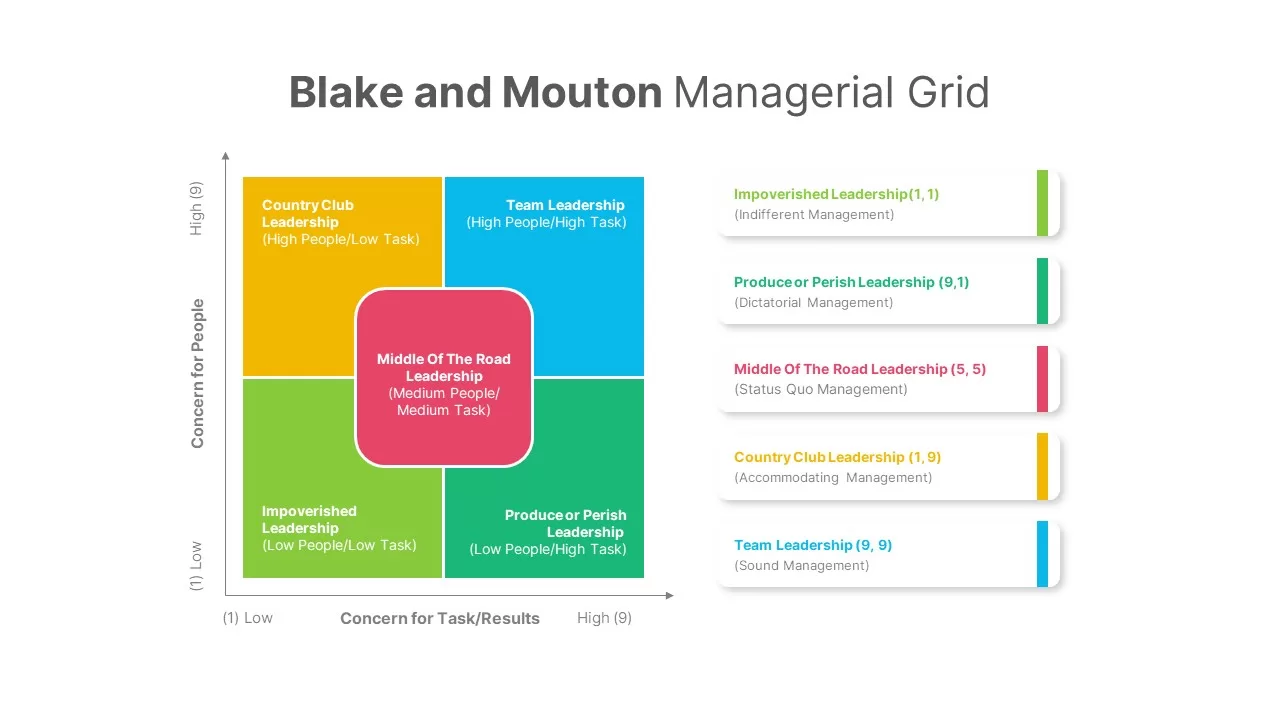
Free Blake and Mouton Leadership Grid Template for PowerPoint & Google Slides
Comparison Chart
Free
-
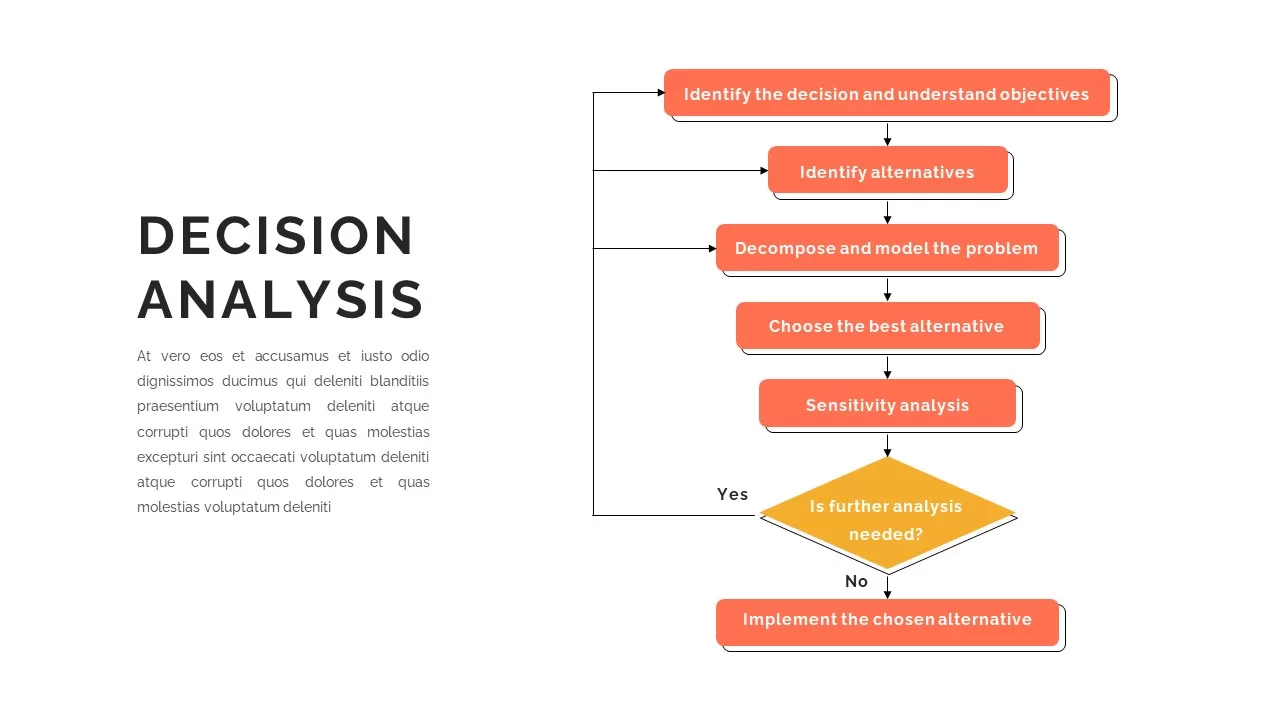
Decision Analysis Process Flowchart Template for PowerPoint & Google Slides
Flow Charts
-
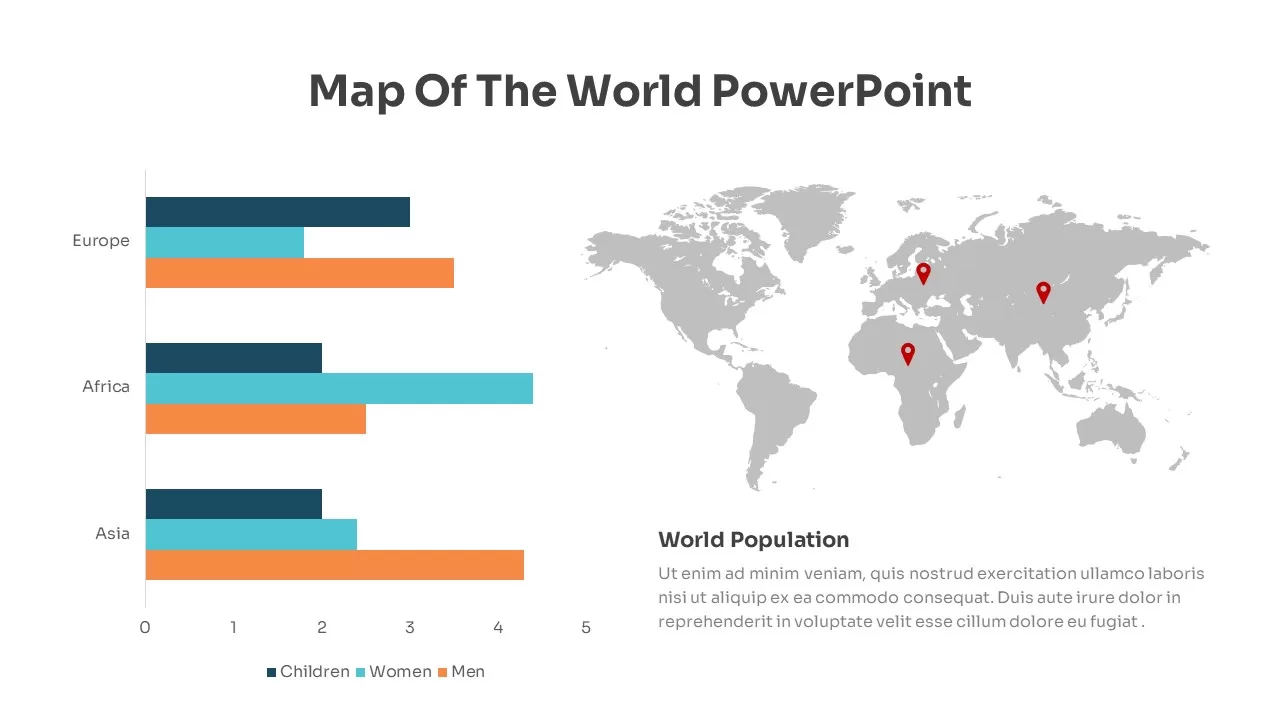
Global Population Demographics & Map Template for PowerPoint & Google Slides
Bar/Column
-

Pugh Matrix Decision Comparison Chart Template for PowerPoint & Google Slides
Comparison Chart
-

Progress Bar Graph Layout Design for PowerPoint & Google Slides
Charts
-
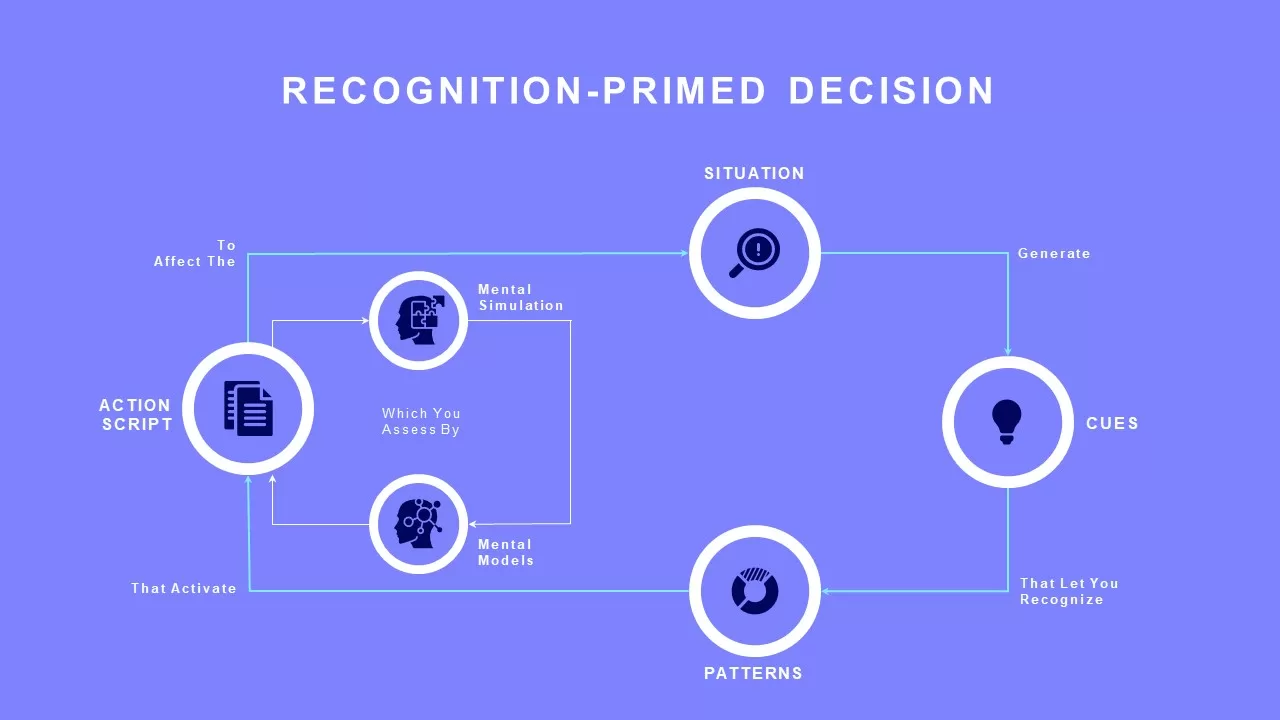
Recognition-Primed Decision Process Flow Template for PowerPoint & Google Slides
Flow Charts
-
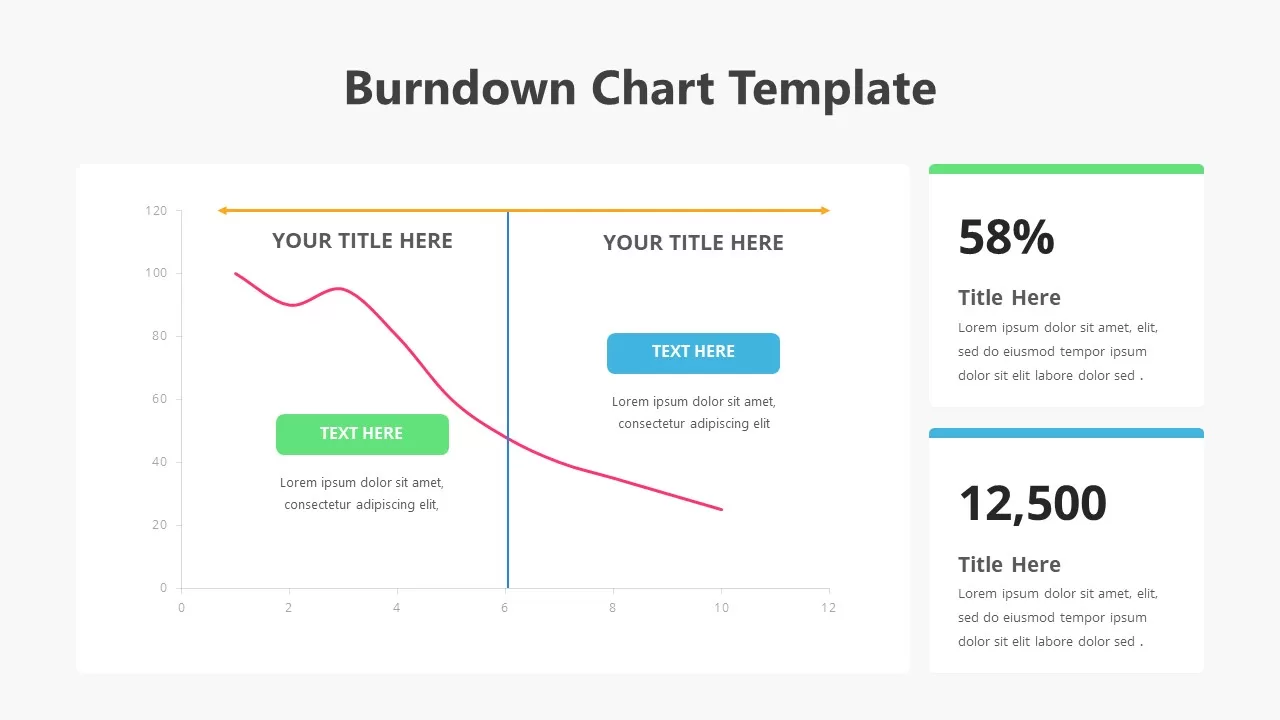
Burndown Chart Template for PowerPoint & Google Slides
Charts
-
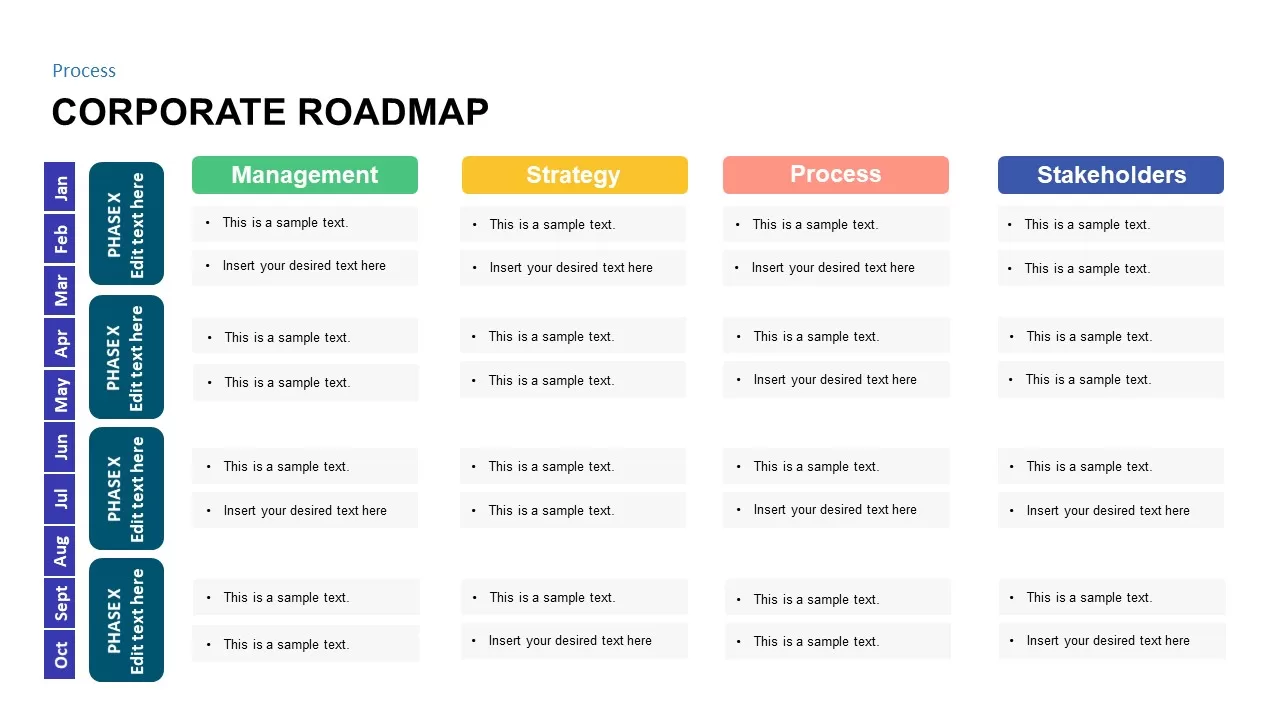
Corporate Roadmap Process Template for PowerPoint & Google Slides
Roadmap
-
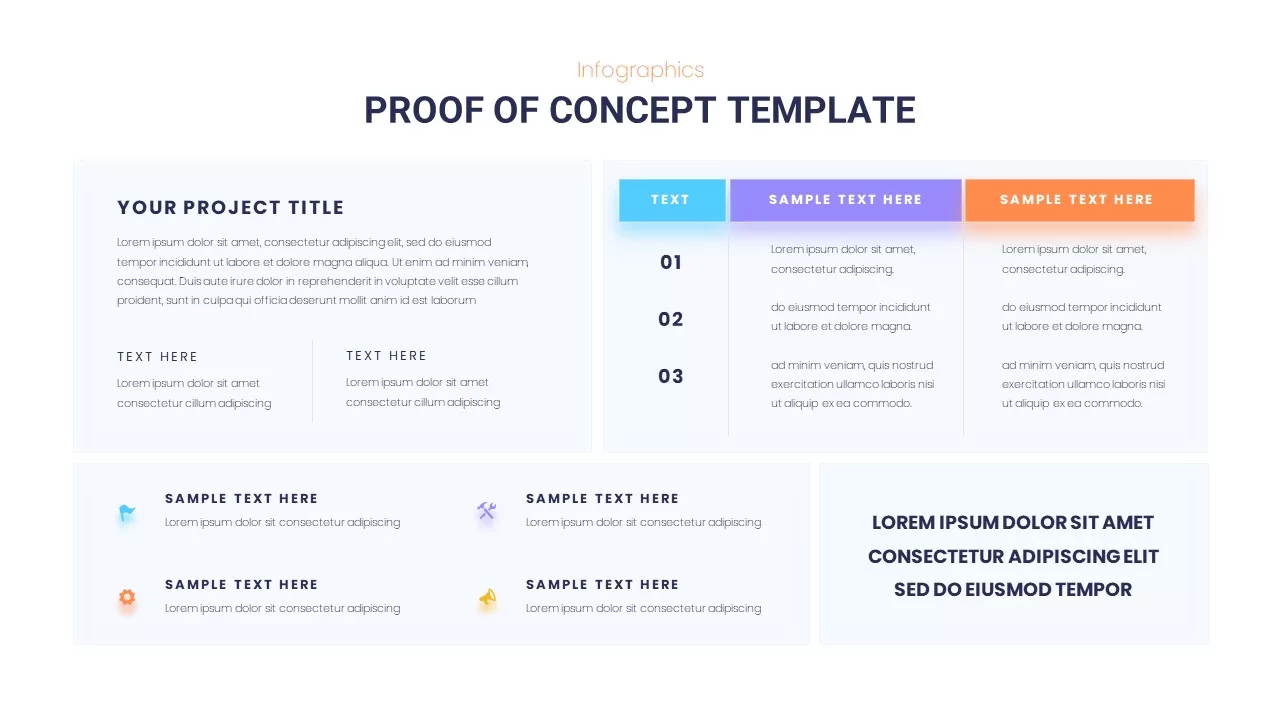
Proof of Concept Roadmap Presentation Template for PowerPoint & Google Slides
Timeline
-
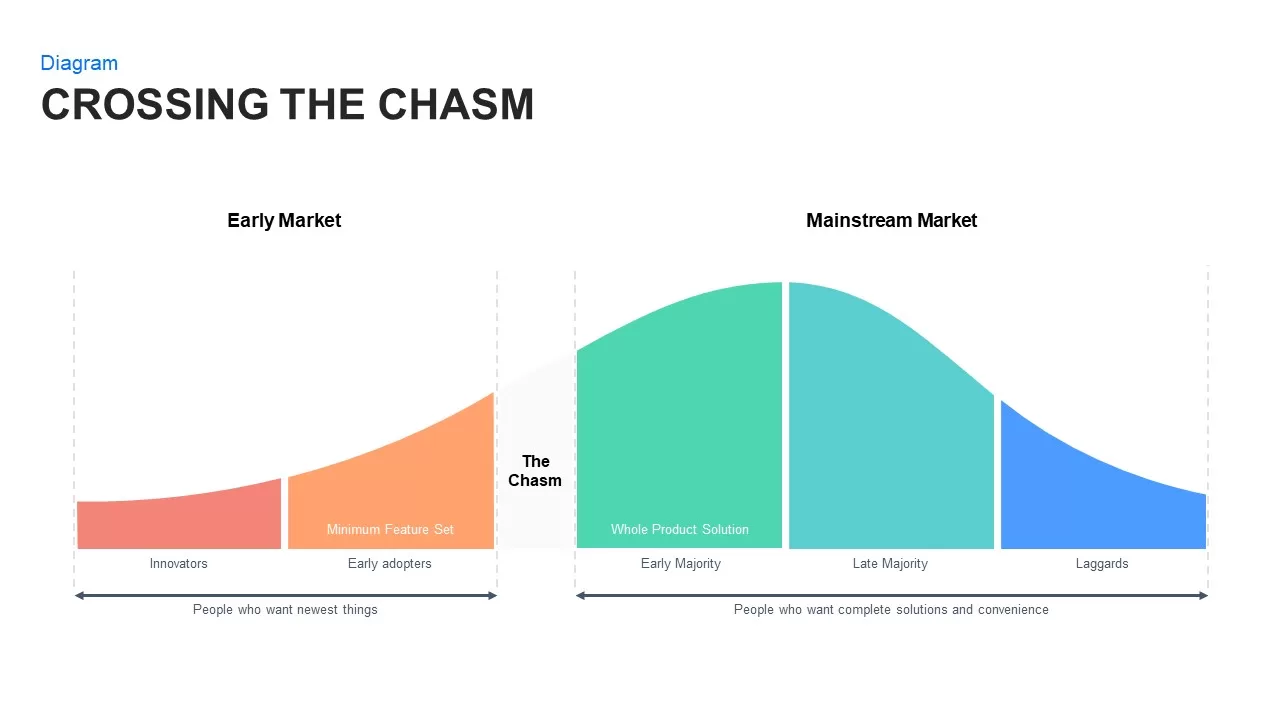
Crossing the Chasm: Technology Adoption Lifecycle template for PowerPoint & Google Slides
Business Strategy
-

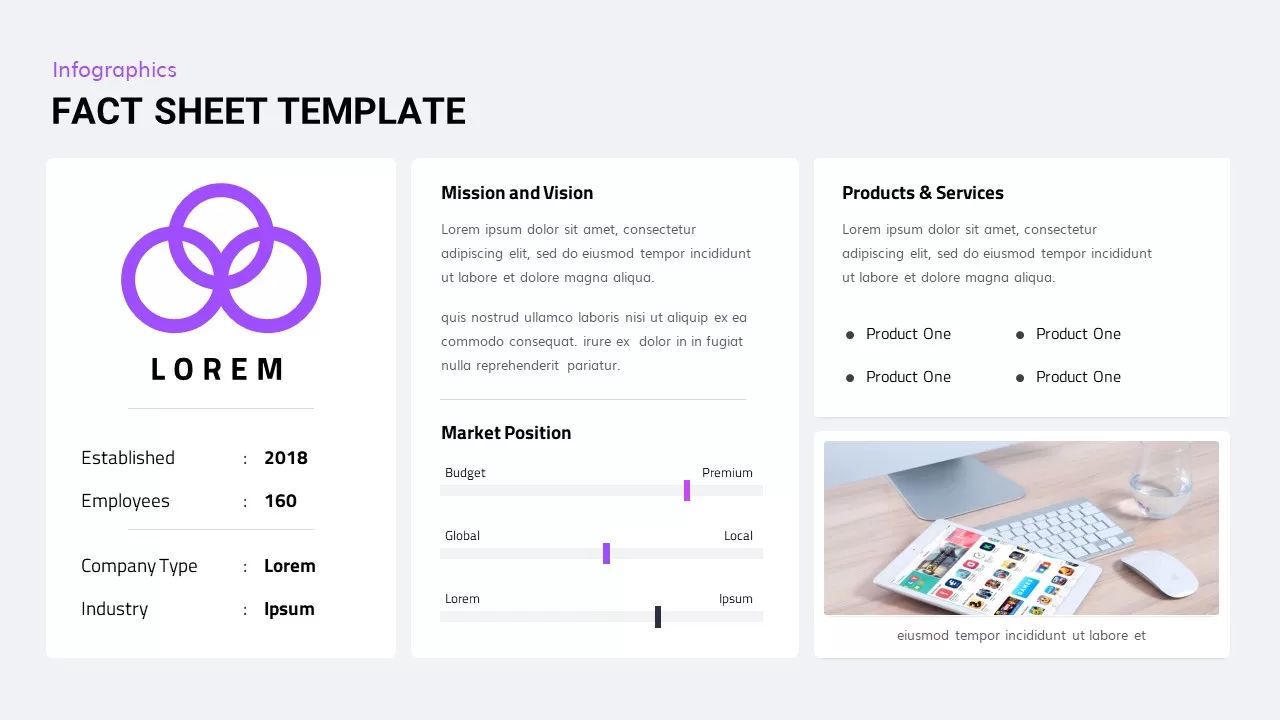
Fact Sheet Template for PowerPoint & Google Slides
Business Report
-
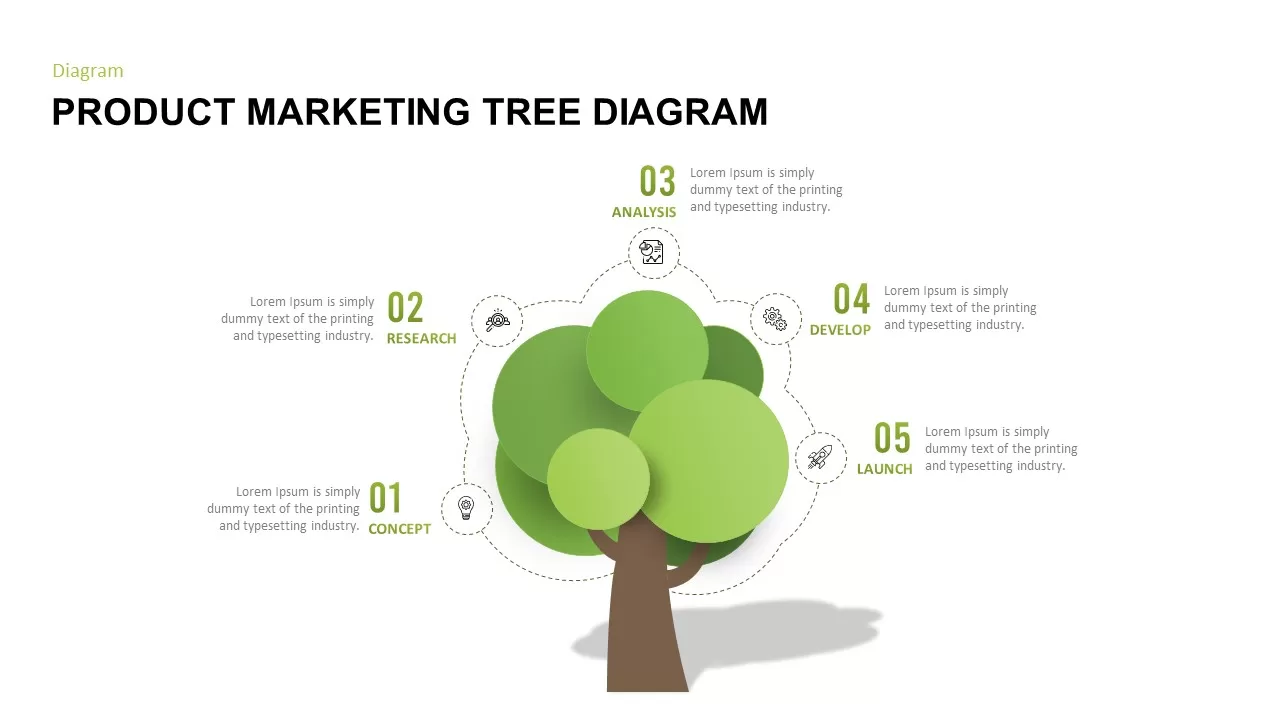
Product Marketing Tree Diagram Template for PowerPoint & Google Slides
Marketing
-
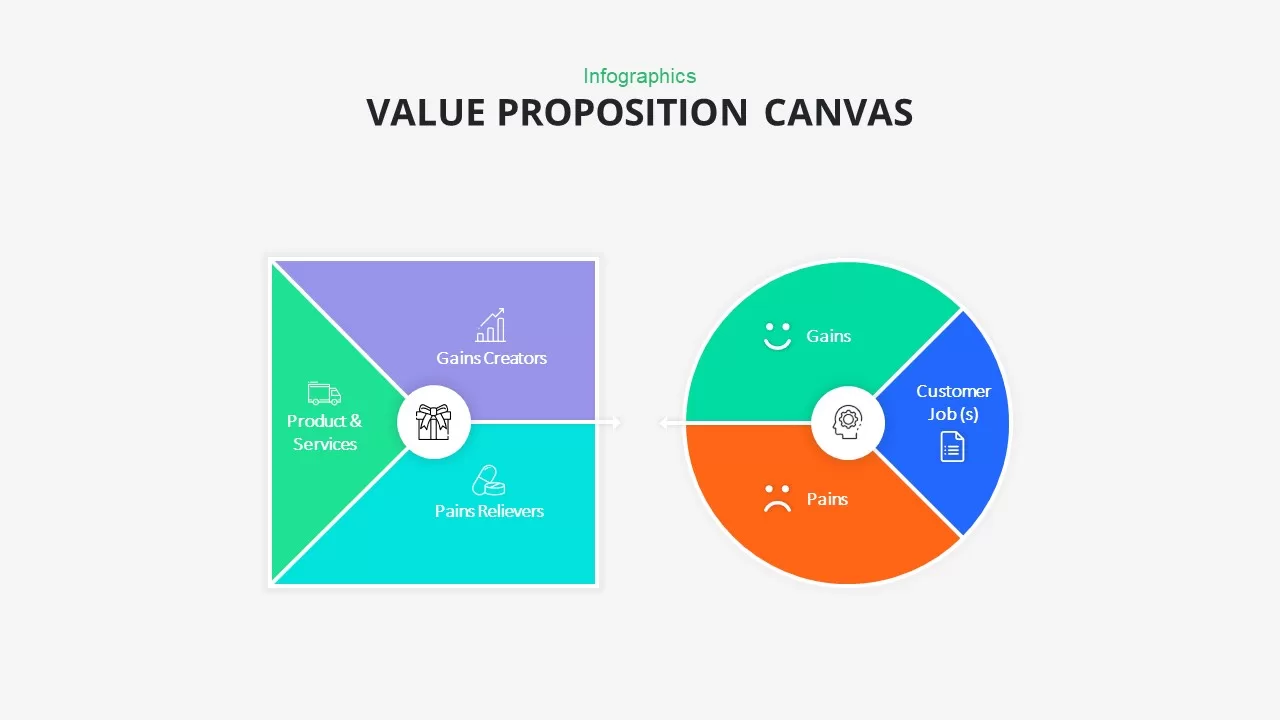
Value Proposition Canvas Infographic Template for PowerPoint & Google Slides
Business Report
-
Flow Chart Diagram Template for PowerPoint & Google Slides
Flow Charts
-
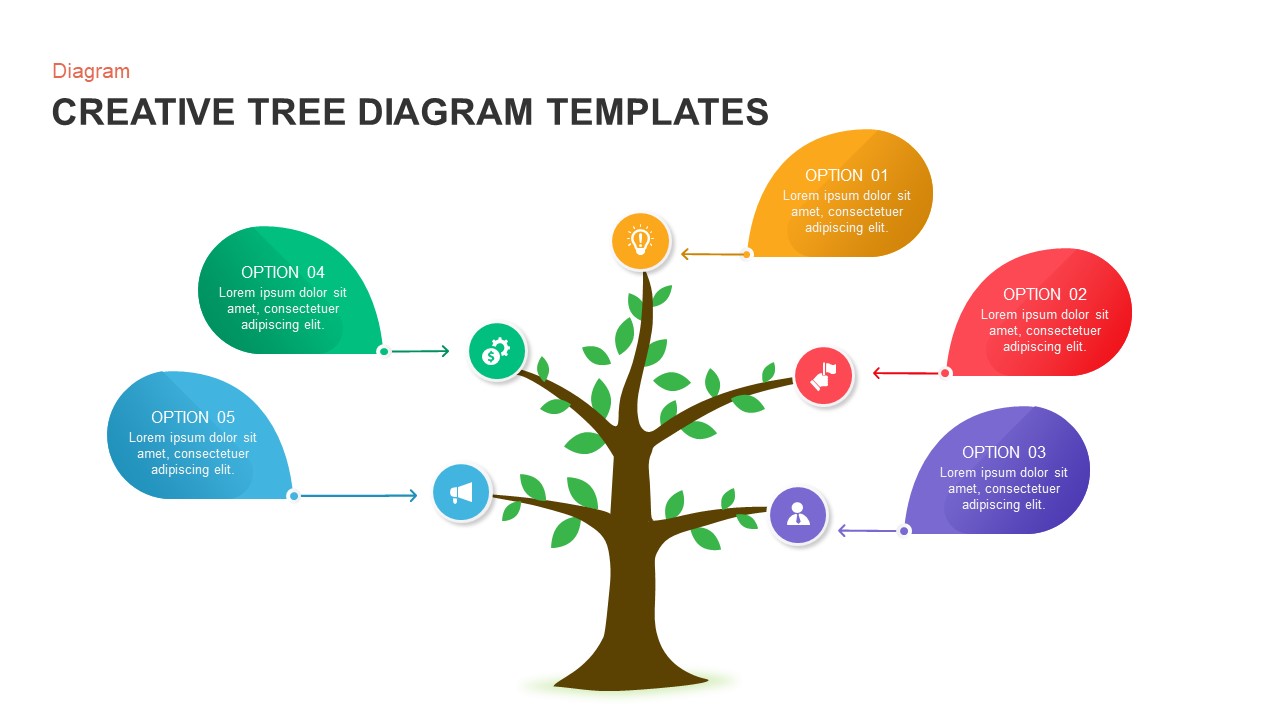
Creative Tree Diagram Infographic Template for PowerPoint & Google Slides
Decision Tree
-
Dashboard Templates for PowerPoint & Google Slides
Bar/Column
-
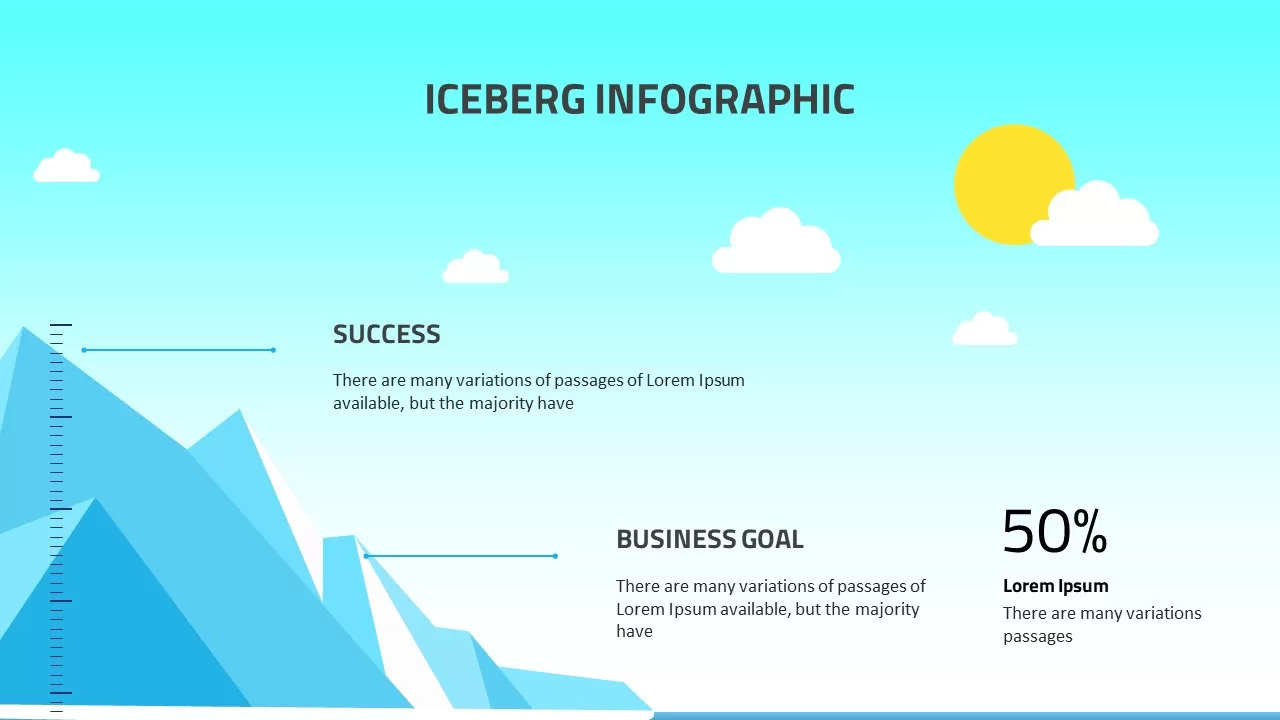
Iceberg Infographic for PowerPoint & Google Slides
Iceberg Charts
-
Supply Positioning Model Matrix Template for PowerPoint & Google Slides
Comparison Chart
-
Social Media Performance Dashboard Template for PowerPoint & Google Slides
Bar/Column
-
Sales Growth Dashboard: KPI Gauge & Line Template for PowerPoint & Google Slides
Revenue
-
Car Sales Market Share Pie Chart Template for PowerPoint & Google Slides
BCG
-
Radar Chart Product Comparison Template for PowerPoint & Google Slides
Comparison Chart
-
Fishbone Diagram Analysis Template for PowerPoint & Google Slides
Flow Charts
-
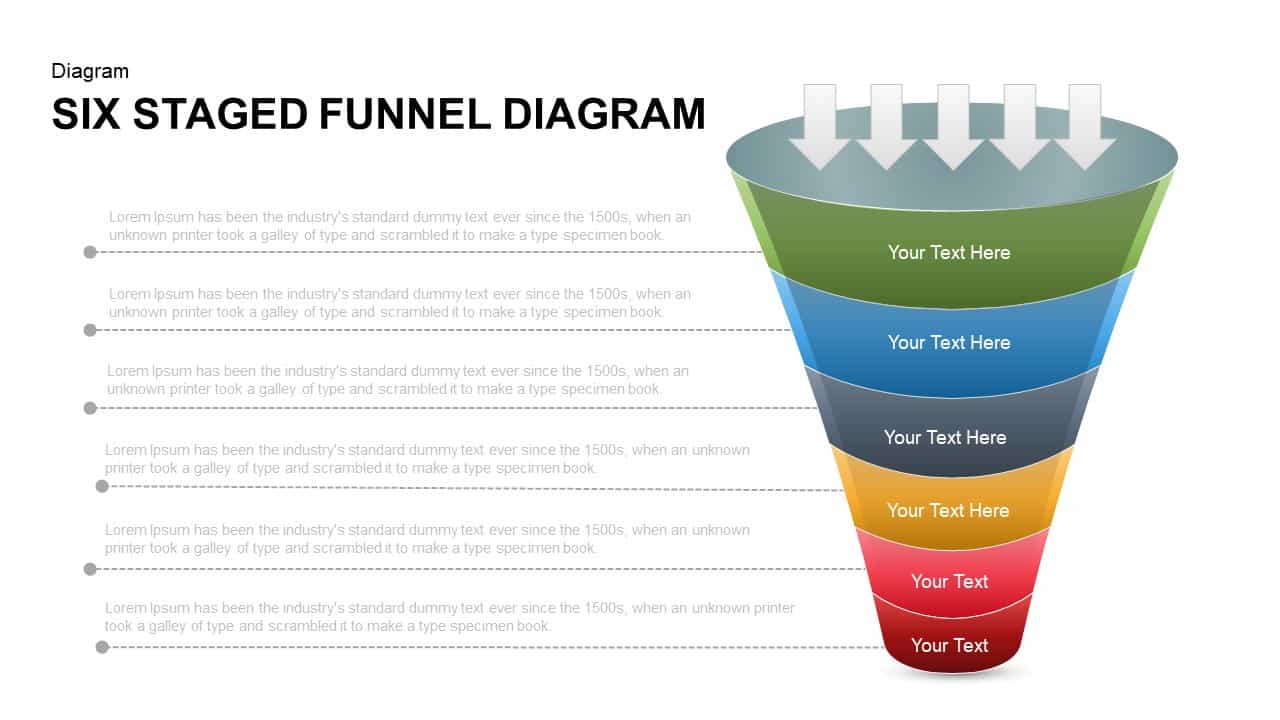
Six Staged Funnel Diagram for PowerPoint & Google Slides
Funnel
-
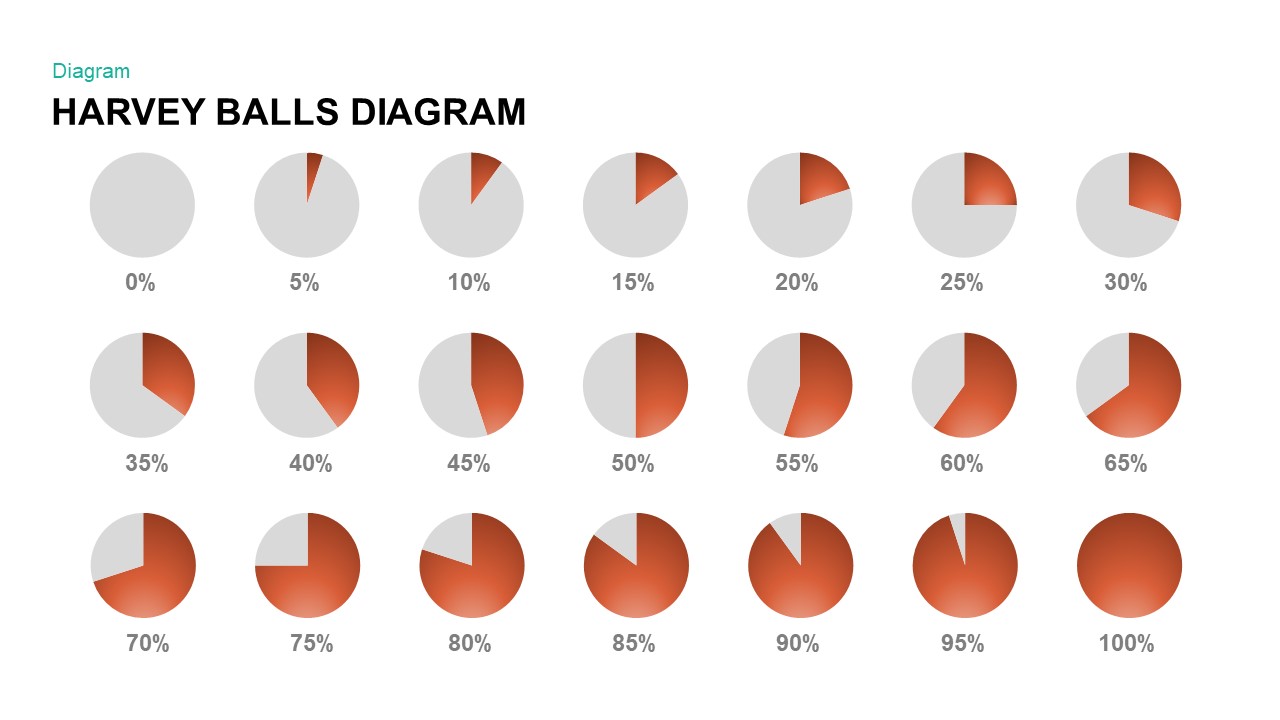
Harvey Balls Percentage Infographic Template for PowerPoint & Google Slides
Harvey Balls
-
Tornado Chart Data Comparison Slide Template for PowerPoint & Google Slides
Bar/Column
-

Clustered Column Chart Data Analysis Template for PowerPoint
Bar/Column
-
Data-Driven Line Chart Diagram Template for PowerPoint
Comparison Chart
-

3D Column Chart with Data Table for PowerPoint & Google Slides
Bar/Column
-

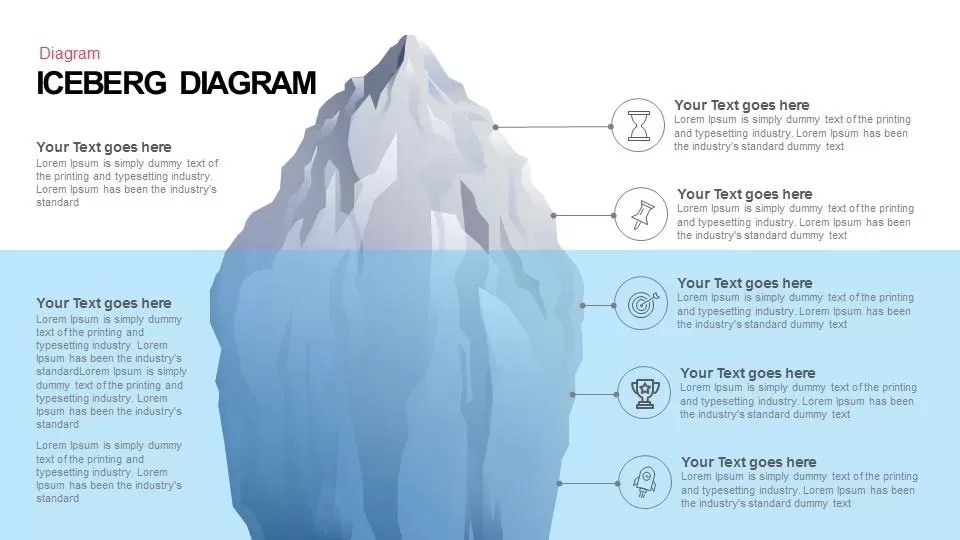
Iceberg Diagram for PowerPoint & Google Slides
Iceberg Charts
-
Line Chart Analysis template for PowerPoint & Google Slides
Charts
-
Weekly Data Chart Slide for PowerPoint & Google Slides
Comparison Chart
-
Bar Data Chart Slide for PowerPoint & Google Slides
Bar/Column
-
Interactive Product Comparison Bar Chart Template for PowerPoint & Google Slides
Bar/Column
-
Sales vs Budget Performance Chart Template for PowerPoint & Google Slides
Bar/Column