PowerPoint Charts and Graphs Templates
![]() Filter
Filter
Filter
-

FlowChart PowerPoint Template
Flow Charts
-

Social Media Performance Dashboard Template for PowerPoint & Google Slides
Bar/Column
-

Decision Making PowerPoint Template for Business Presentation
Arrow
-

Flow Chart Template For PowerPoint Presentations
Flow Charts
-

Sales Growth Dashboard: KPI Gauge & Line Template for PowerPoint & Google Slides
Revenue
-

Cause and Effect Template for PowerPoint & Google Slides
Arrow
-
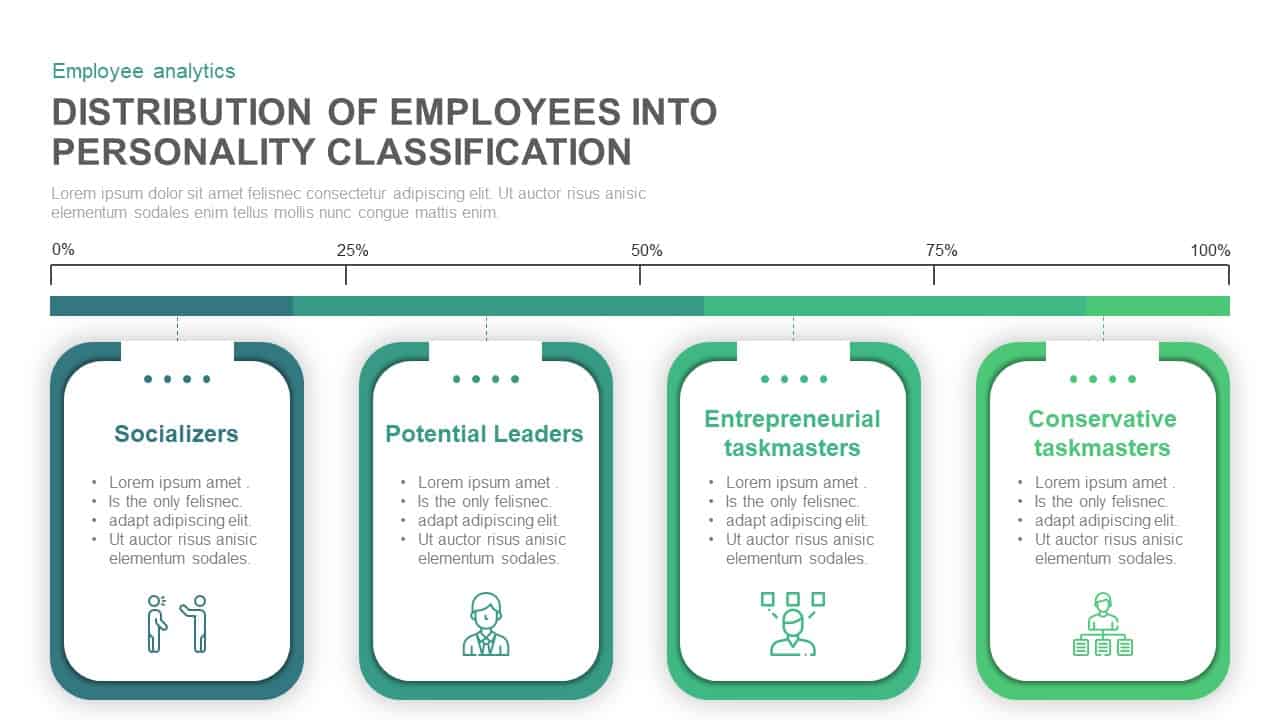
Employee Personality Distribution Chart Template for PowerPoint & Google Slides
Bar/Column
-

Car Sales Market Share Pie Chart Template for PowerPoint & Google Slides
BCG
-

Distracting Factors at Work – Bar Chart Template for PowerPoint
Bar/Column
-

For and Against Vote Count Bar Chart for PowerPoint Presentation
Bar/Column
-

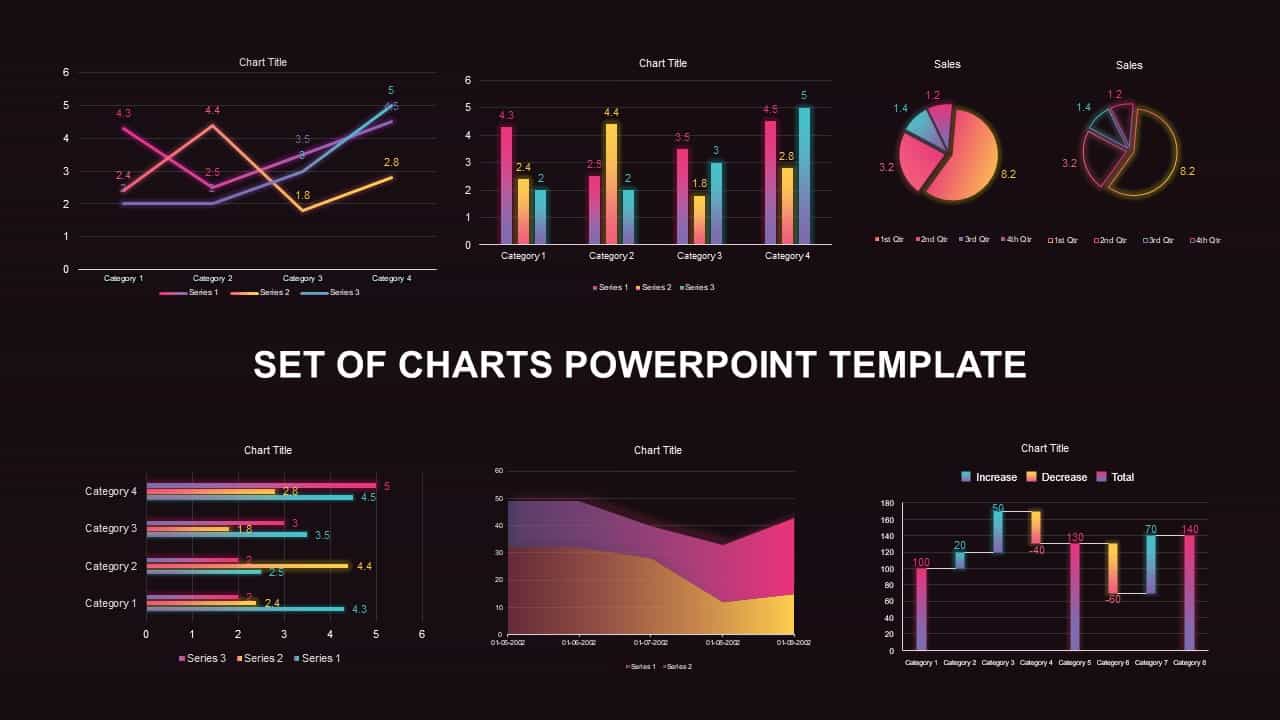
Set of Chart PowerPoint Template and Keynote Diagram
Iceberg Charts
-
Three-Way Decision Process Arrow Diagram Template for PowerPoint & Google Slides
Arrow
-
Radar Chart Product Comparison Template for PowerPoint & Google Slides
Comparison Chart
-
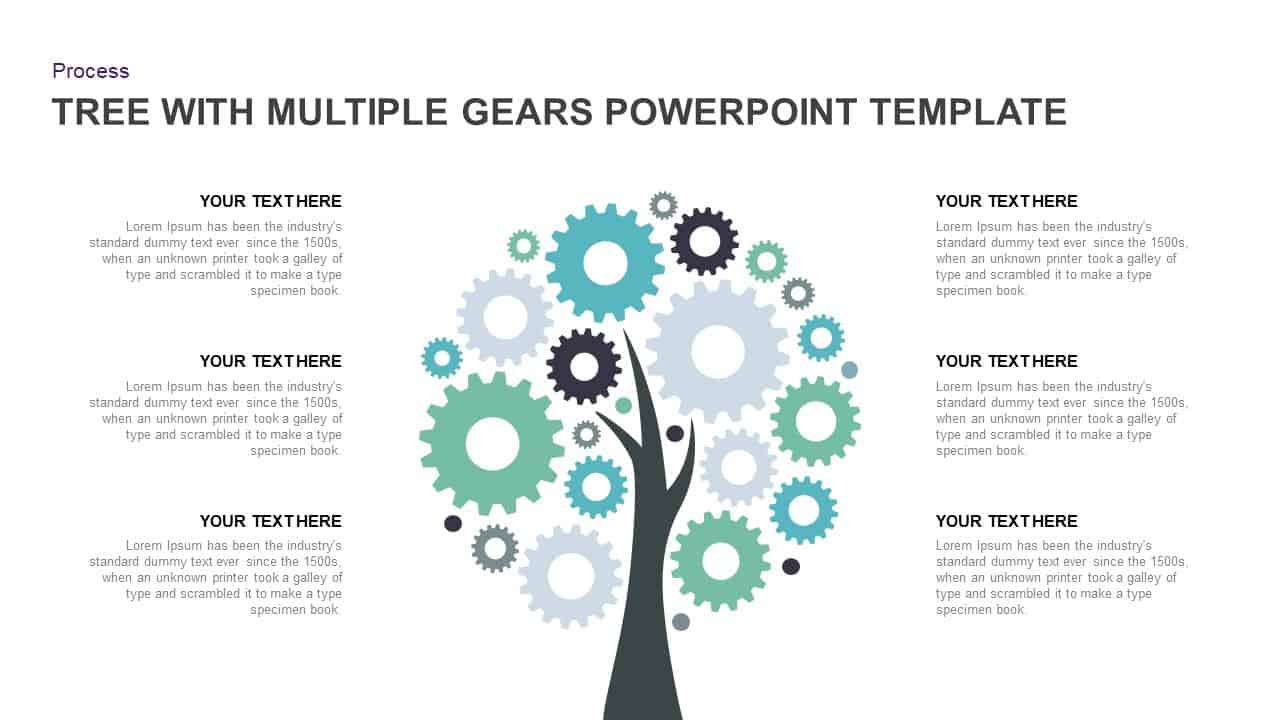
Tree Diagram with Gears Process Template for PowerPoint & Google Slides
Process
-
Fishbone Diagram Analysis Template for PowerPoint & Google Slides
Flow Charts
-
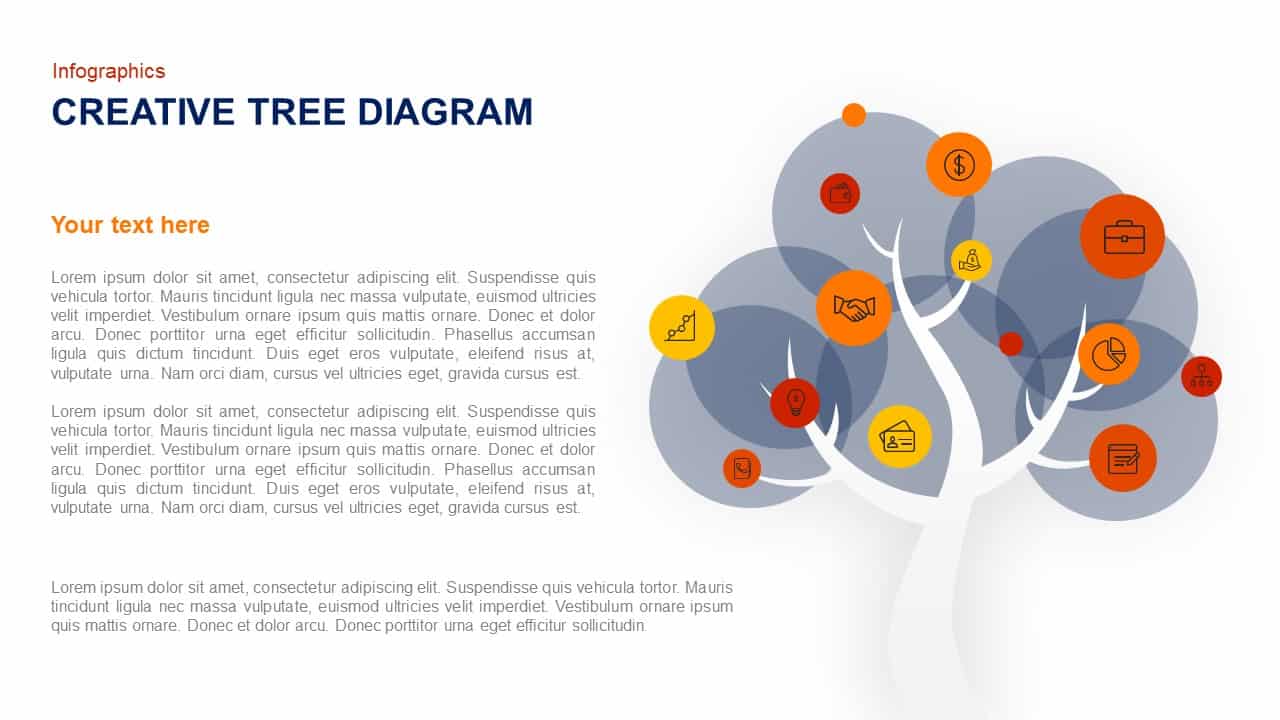
Creative Tree Diagram Template for PowerPoint
Infographics
-
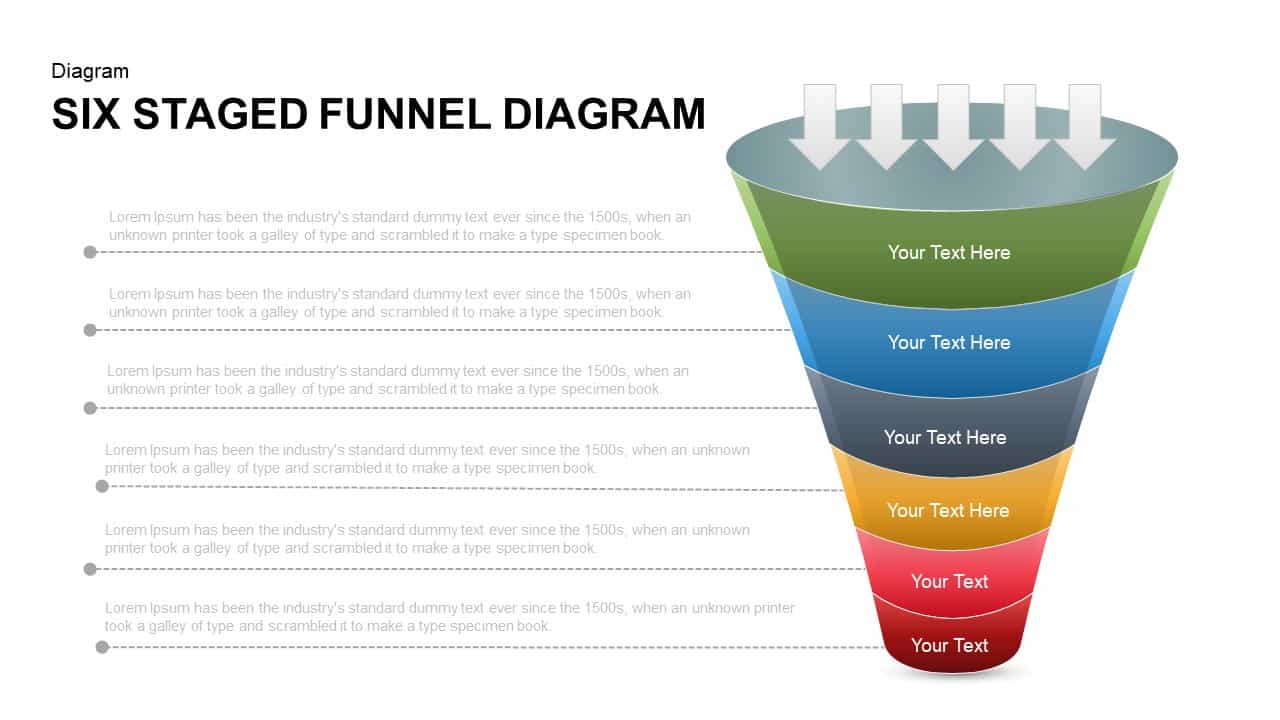
Six Staged Funnel Diagram for PowerPoint & Google Slides
Funnel
-
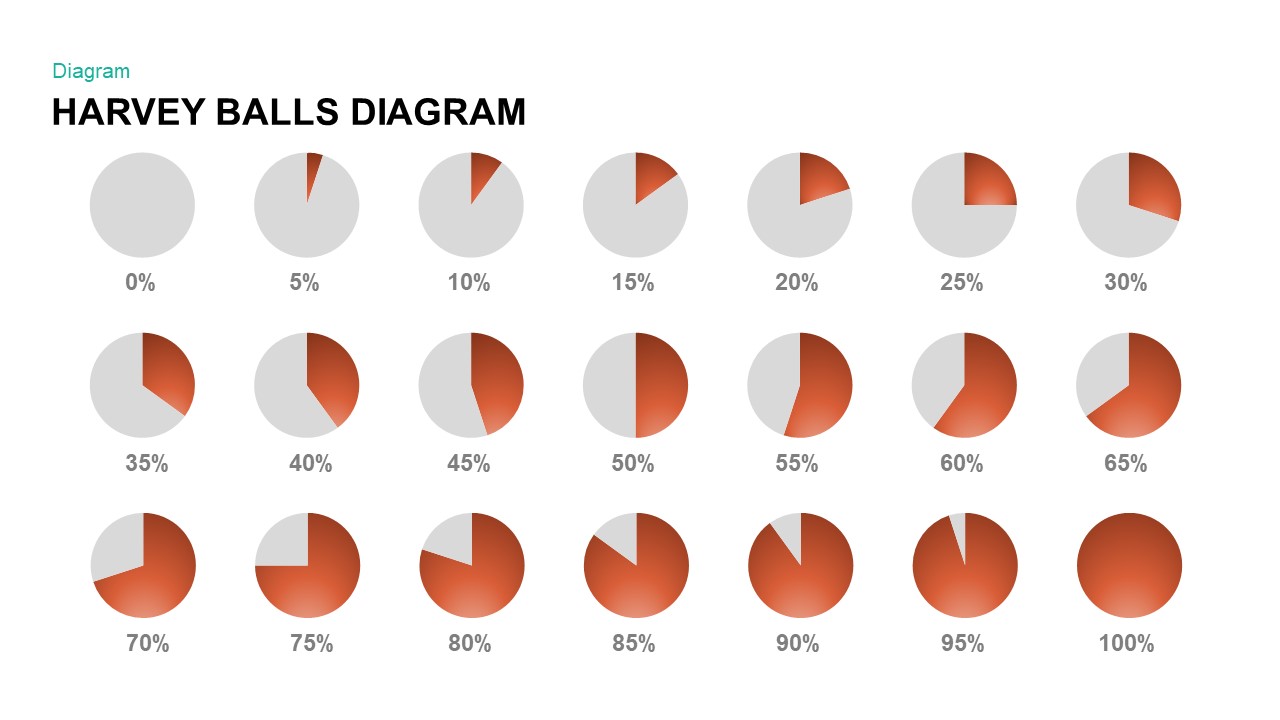
Harvey Balls PowerPoint Template Diagram Slide
Harvey Balls
-
Tornado Chart Data Comparison Slide Template for PowerPoint & Google Slides
Bar/Column
-

Free Project Dashboard PowerPoint Template
Charts
Free
-
Organization Hierarchy Template PowerPoint & Google Slides
Org Chart
-
Clustered Column Chart Data Analysis Template for PowerPoint
Bar/Column
-
Data-Driven Line Chart Diagram Template for PowerPoint
Comparison Chart
-
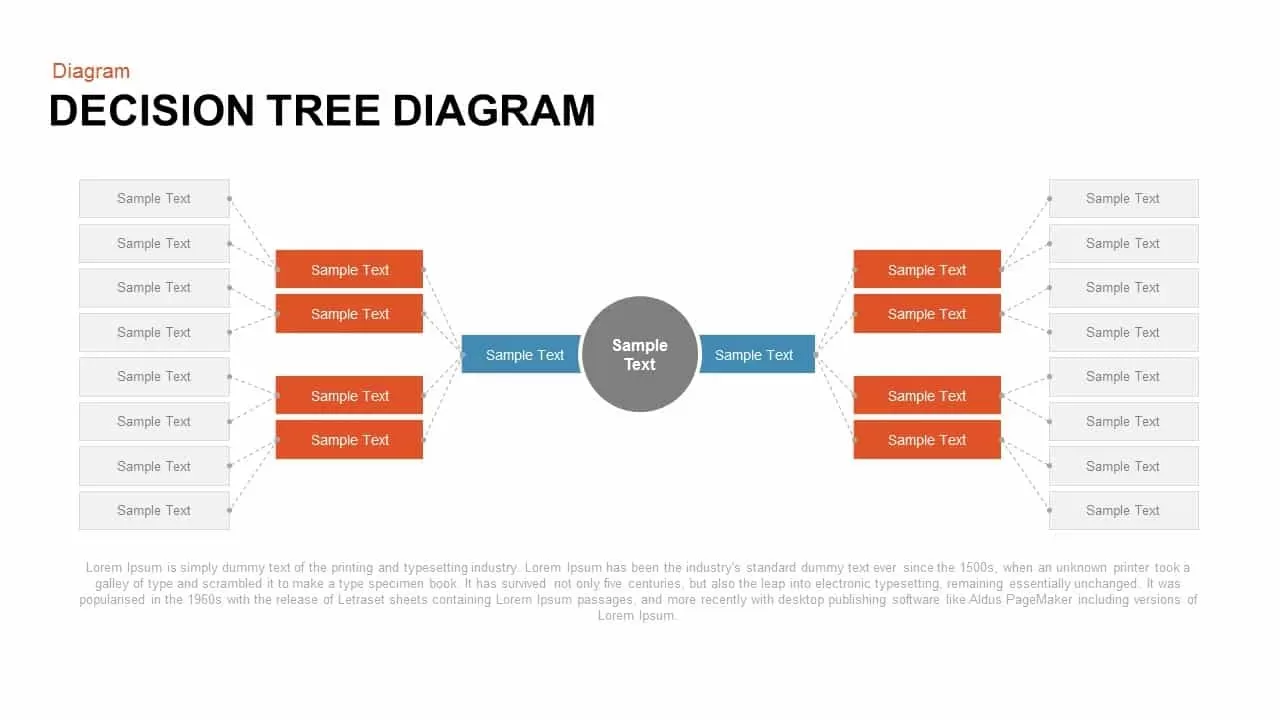
Decision Tree Diagram template for PowerPoint & Google Slides
Decision Tree
-
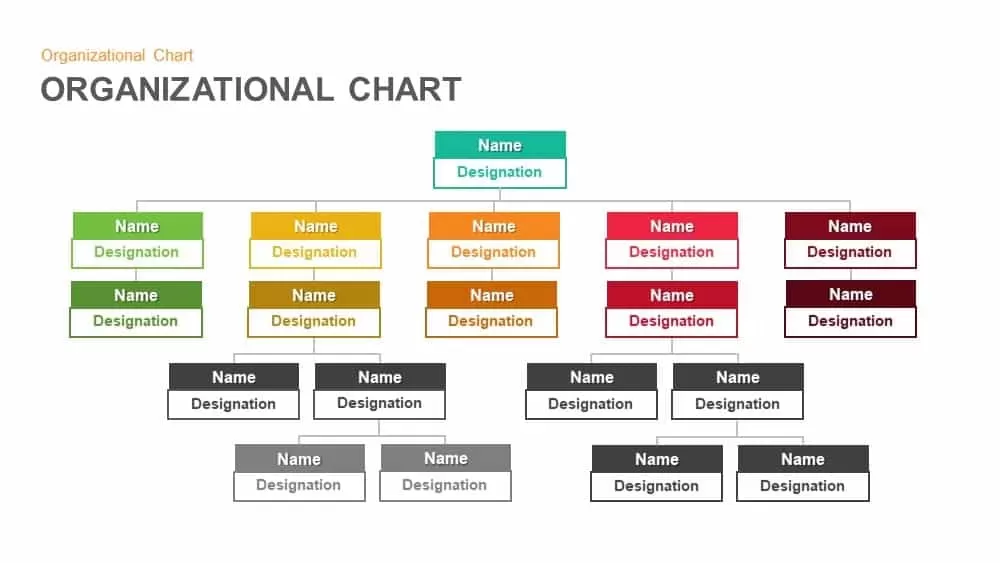
Organizational Chart PowerPoint Template
Org Chart
-
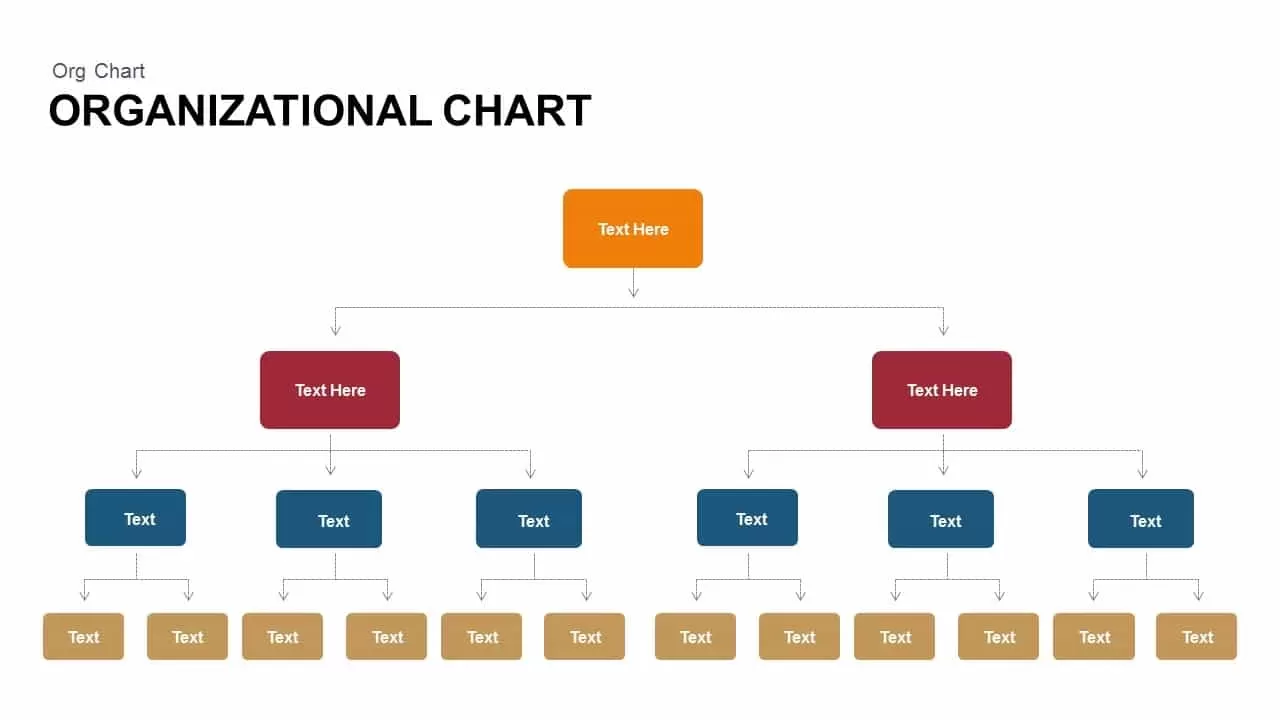
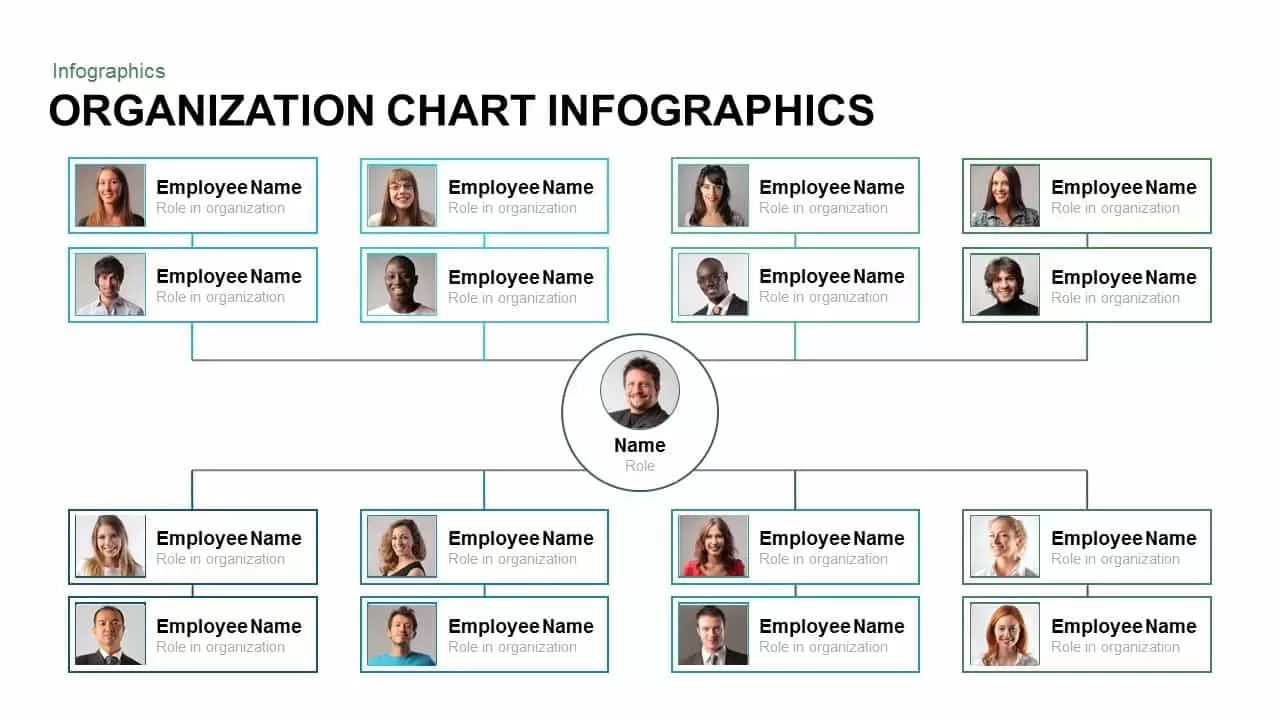
Organization Chart Overview template for PowerPoint & Google Slides
Org Chart
-

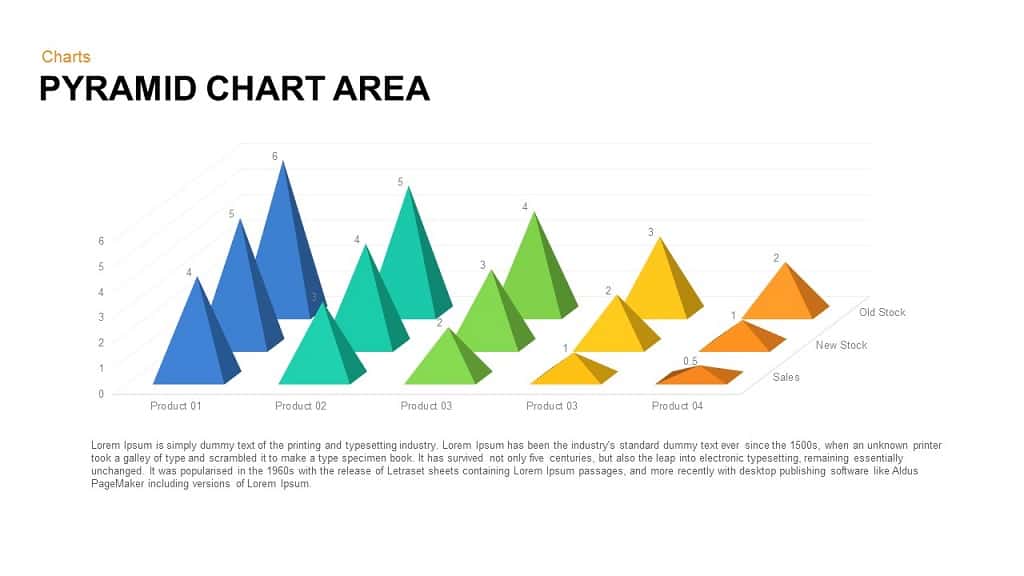
Pyramid Area Chart Template for PowerPoint
Pyramid
-

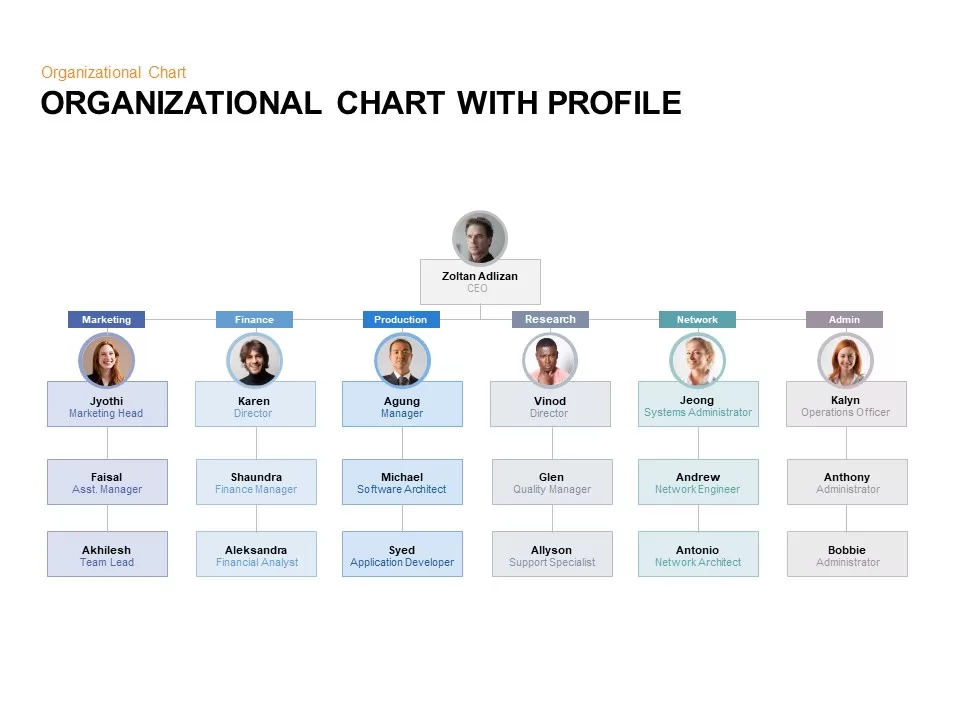
Organizational Chart with Profile PowerPoint Template
Org Chart
-

3D Column Chart with Data Table for PowerPoint & Google Slides
Bar/Column
-

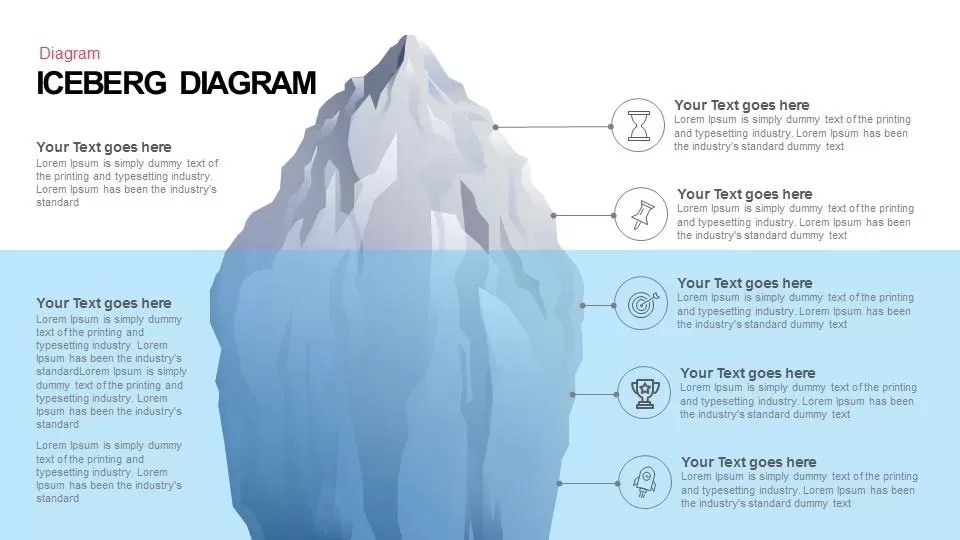
Iceberg Diagram for PowerPoint And Google Slides
Iceberg Charts
-
Line Chart Analysis template for PowerPoint & Google Slides
Charts
-
Weekly Data Chart Slide for PowerPoint & Google Slides
Comparison Chart
-
Data Bar Chart Template for PowerPoint and Keynote
Bar/Column
-
3d Line Chart PowerPoint Template
Charts
-
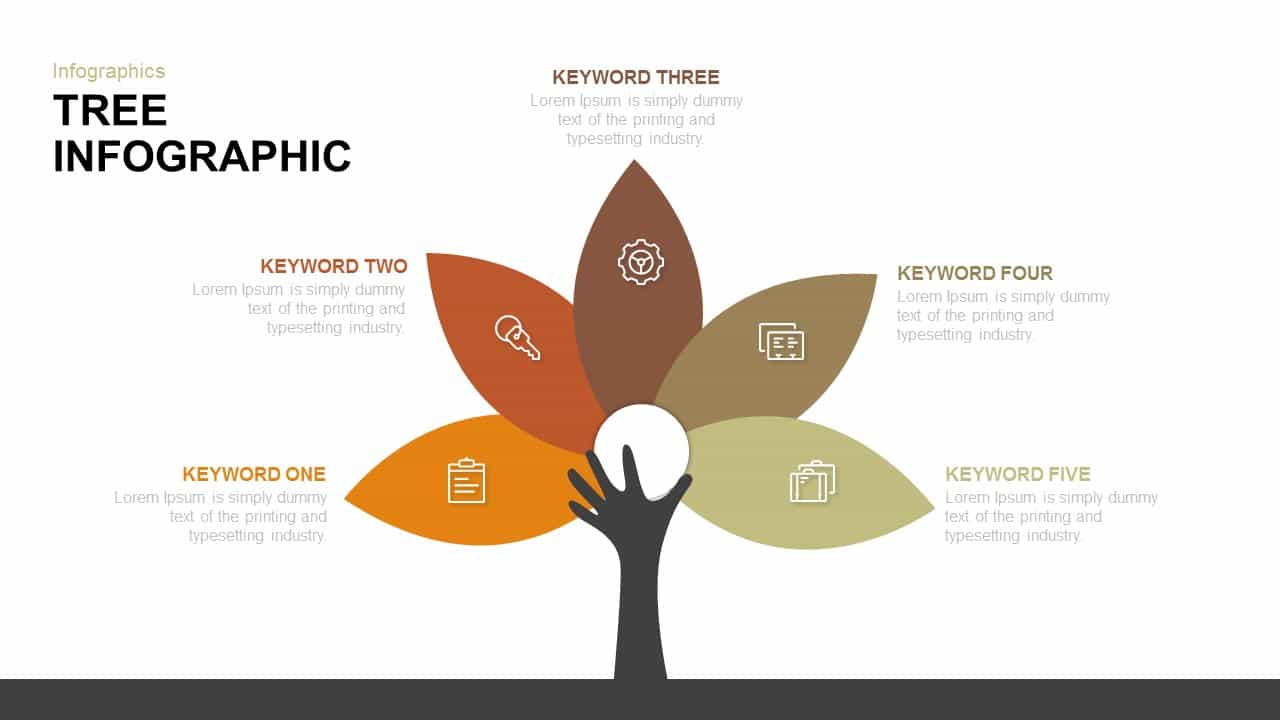
Tree Keyword Petals Infographic Template for PowerPoint & Google Slides
Process