PowerPoint Charts and Graphs Templates
![]() Filter
Filter
Filter
-
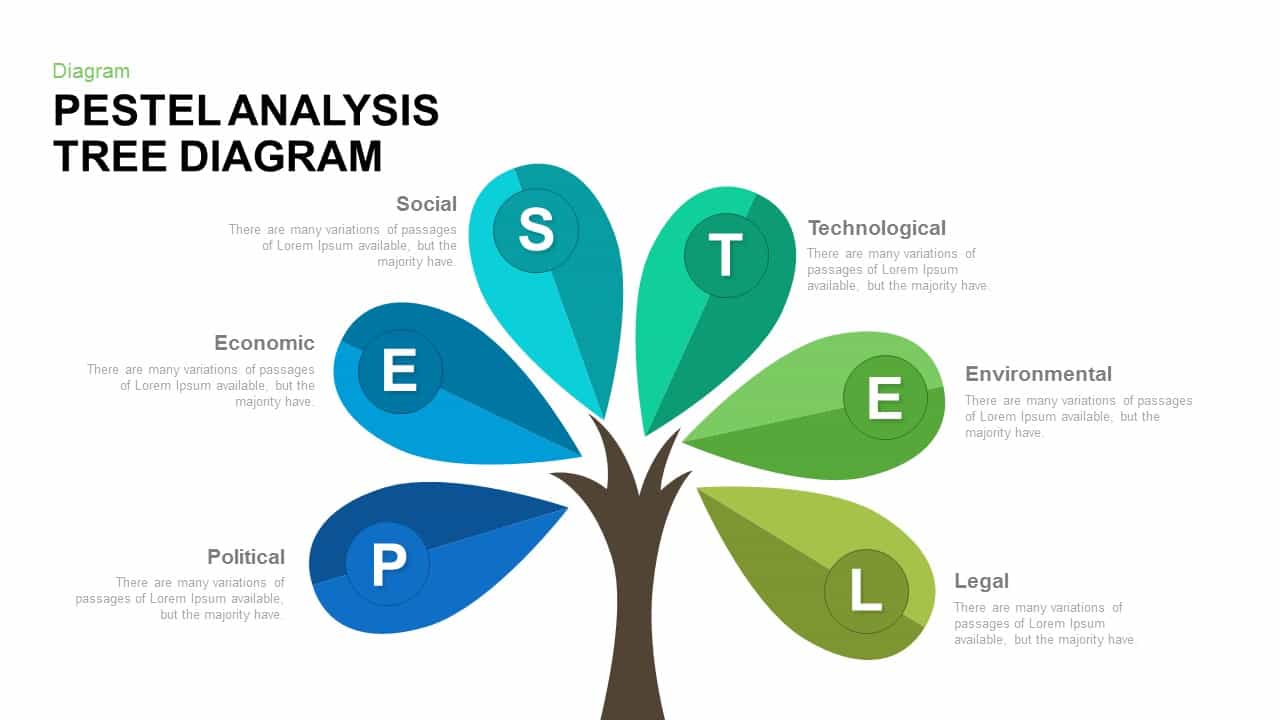
PESTEL Analysis Tree Diagram PowerPoint Template and Google Slides
Process
-

Gear Pie chart PowerPoint Template
Pie/Donut
-

Interactive Product Comparison Bar Chart Template for PowerPoint & Google Slides
Bar/Column
-

Organizational Structure Org Chart Template for PowerPoint & Google Slides
Org Chart
-

Sales vs Budget Performance Chart Template for PowerPoint & Google Slides
Bar/Column
-

Improvement Metaphor Template for PowerPoint
Bar/Column
-

Weighing Scale Metaphor PowerPoint Template
Charts
-

Pie Segment Diagram PowerPoint Template
Pie/Donut
-

3D Shape Linear Process Flow Template
Process
-
Tree Infographics PowerPoint Template and Keynote Slide
Infographics
-

Sales Bar Chart Template for PowerPoint and Google slides
Bar/Column
-

Wow Your Audience PowerPoint Template and Keynote Slide
Bar/Column
-
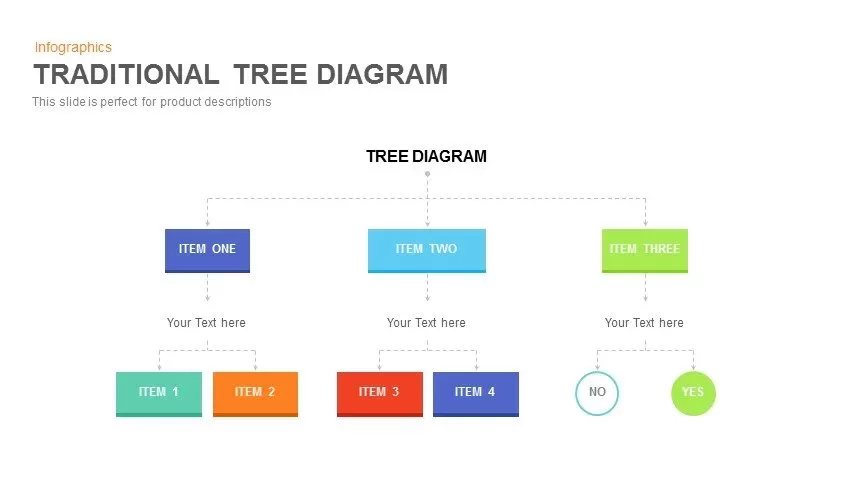
Traditional Tree Diagram PowerPoint Template and Keynote Slide
Decision Tree
-
Cone Chart PowerPoint Template
Bar/Column
-
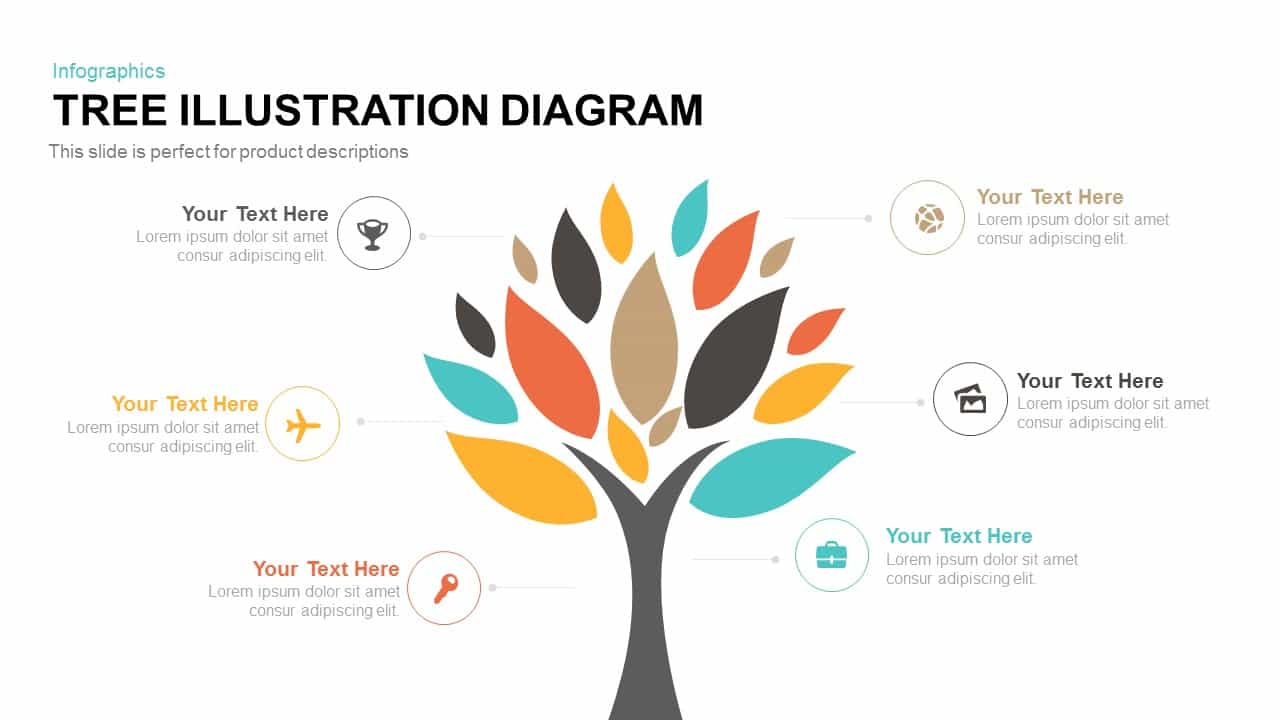
Tree Illustration Diagram PowerPoint Template
Process
-
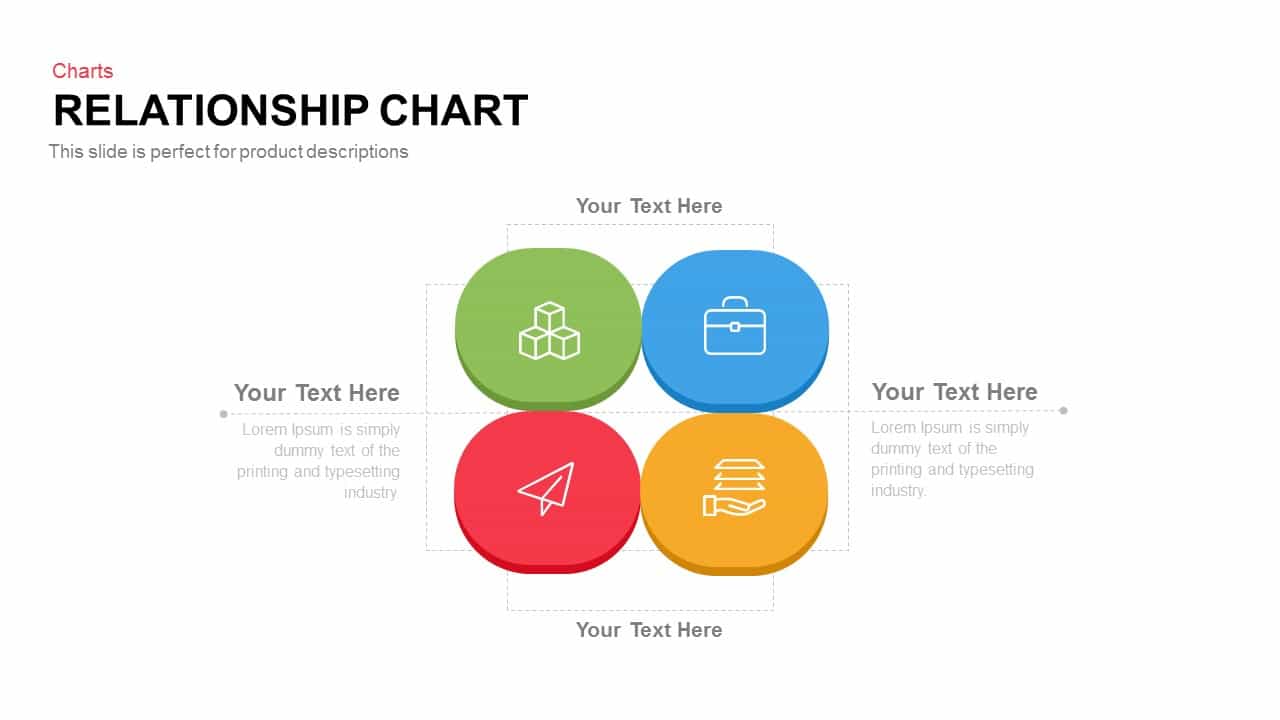
Relationship Chart PowerPoint Template and Google Slides
Diagrams
-
Social Media Metrics template for PowerPoint & Google Slides
Comparison Chart
-
Mobile Usage Metrics template for PowerPoint & Google Slides
Comparison Chart
-
Corporate Org Chart template for PowerPoint & Google Slides
Org Chart
-
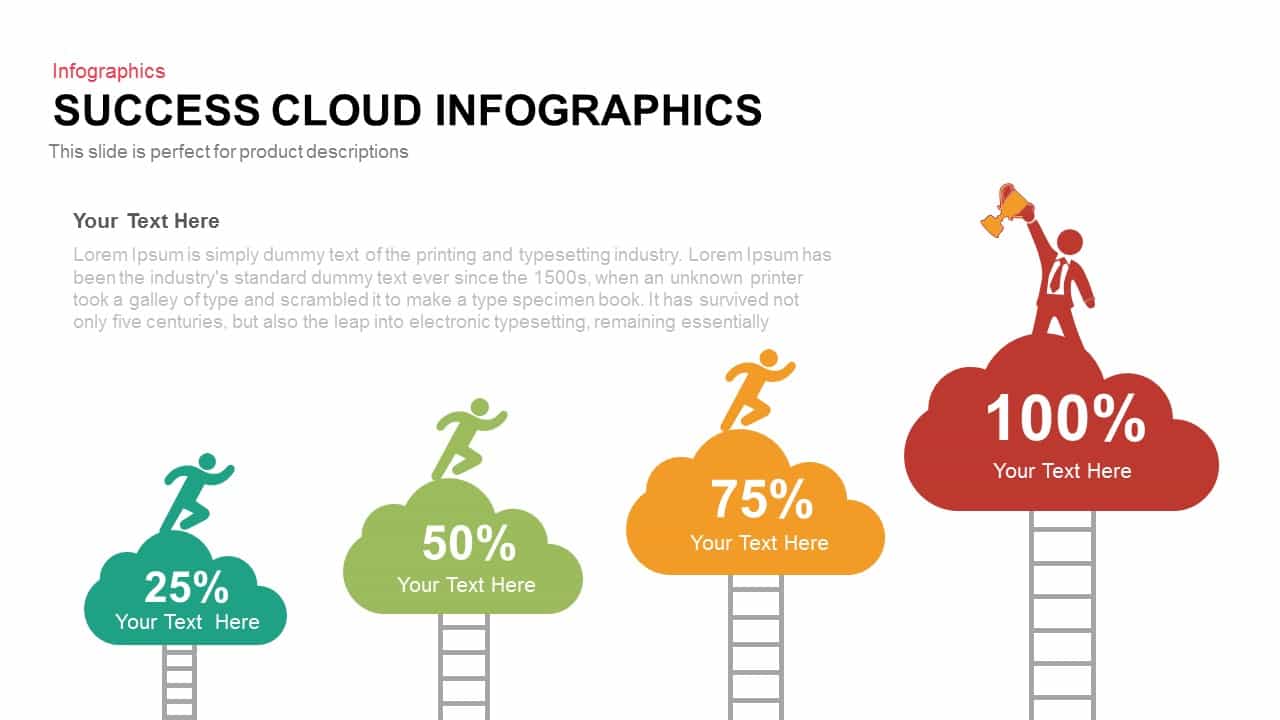
Success Cloud Infographics PowerPoint Template
Charts
-
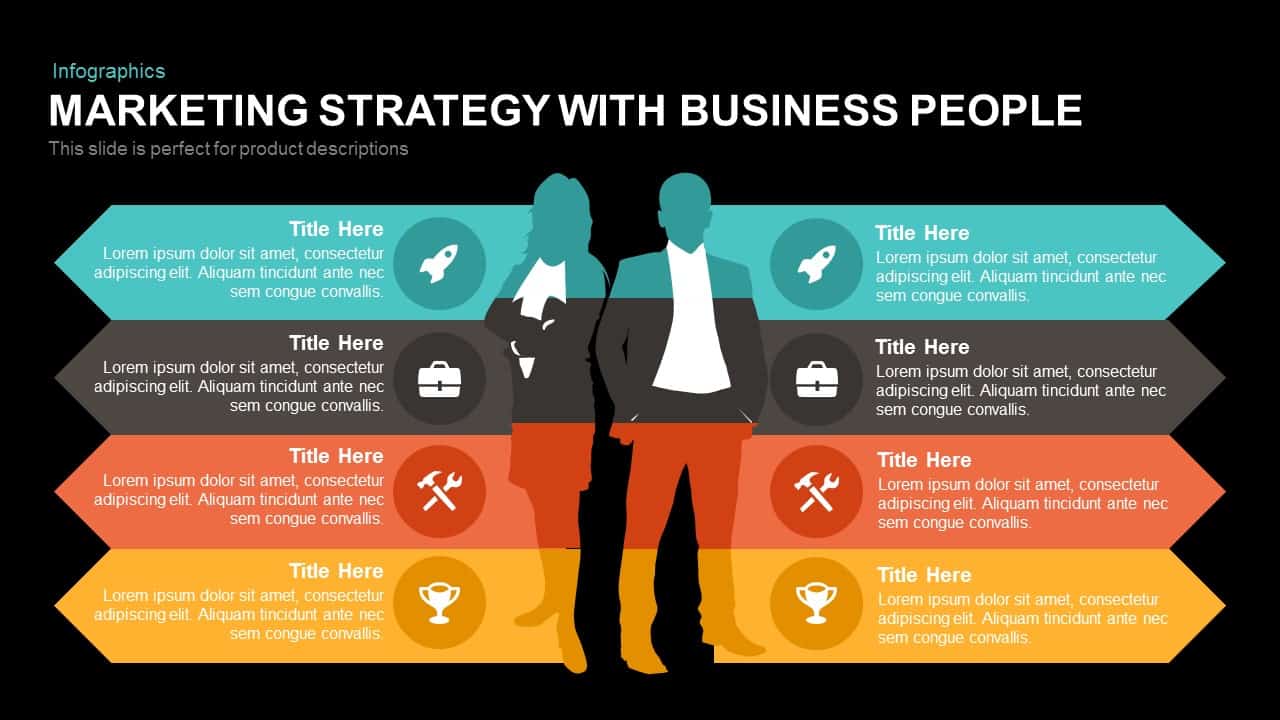
Marketing Strategy Arrow Infographic Template for PowerPoint & Google Slides
Comparison
-
Four Section Chart PowerPoint and Google Slide
Infographics
-
Pencil Bar Chart PowerPoint Template and Google Slide
Bar/Column
-
E-commerce Analytics Dashboard Template for PowerPoint & Google Slides
Bar/Column
-
Success Key Diagram with Donut Chart Template for PowerPoint & Google Slides
Pie/Donut
-
Market Development Matrix Chart Template for PowerPoint & Google Slides
Comparison Chart
-
Five 3D Growth Arrow Infographic Slide Template for PowerPoint & Google Slides
Arrow
-
Arrow Process Diagram Template
Arrow
-
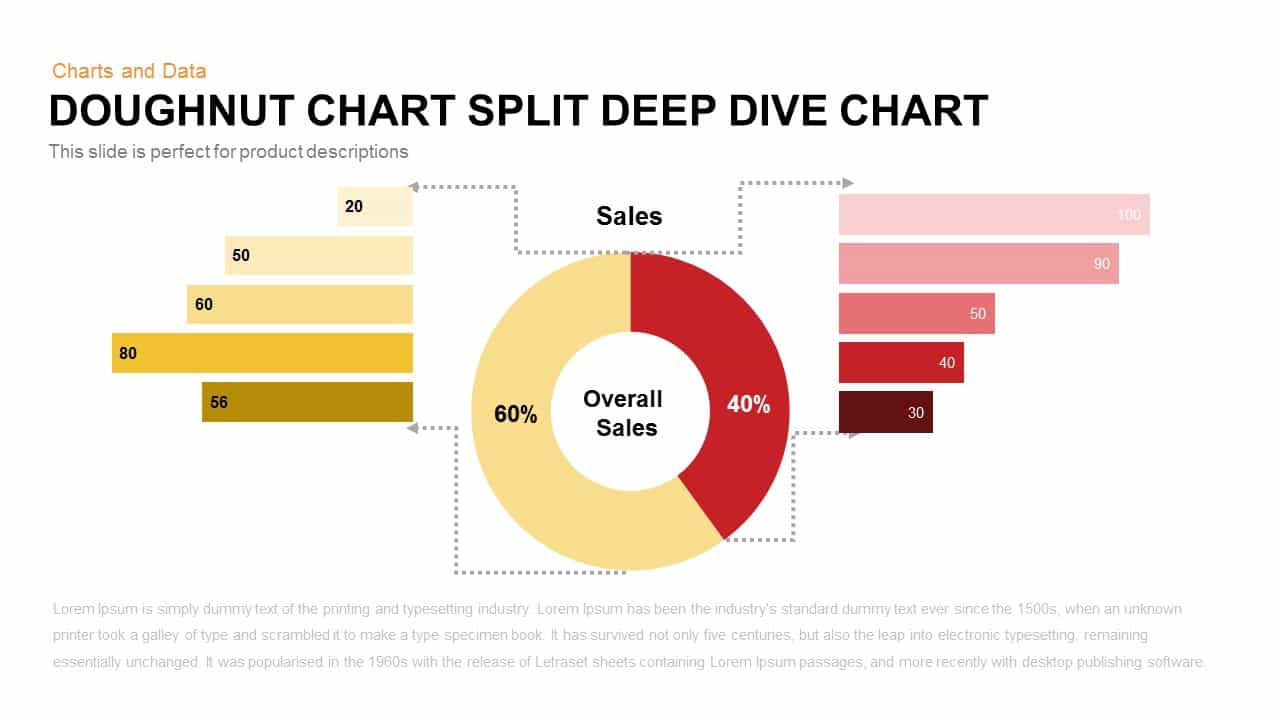
Split Doughnut Deep Dive Sales Analysis Template for PowerPoint & Google Slides
Pie/Donut
-
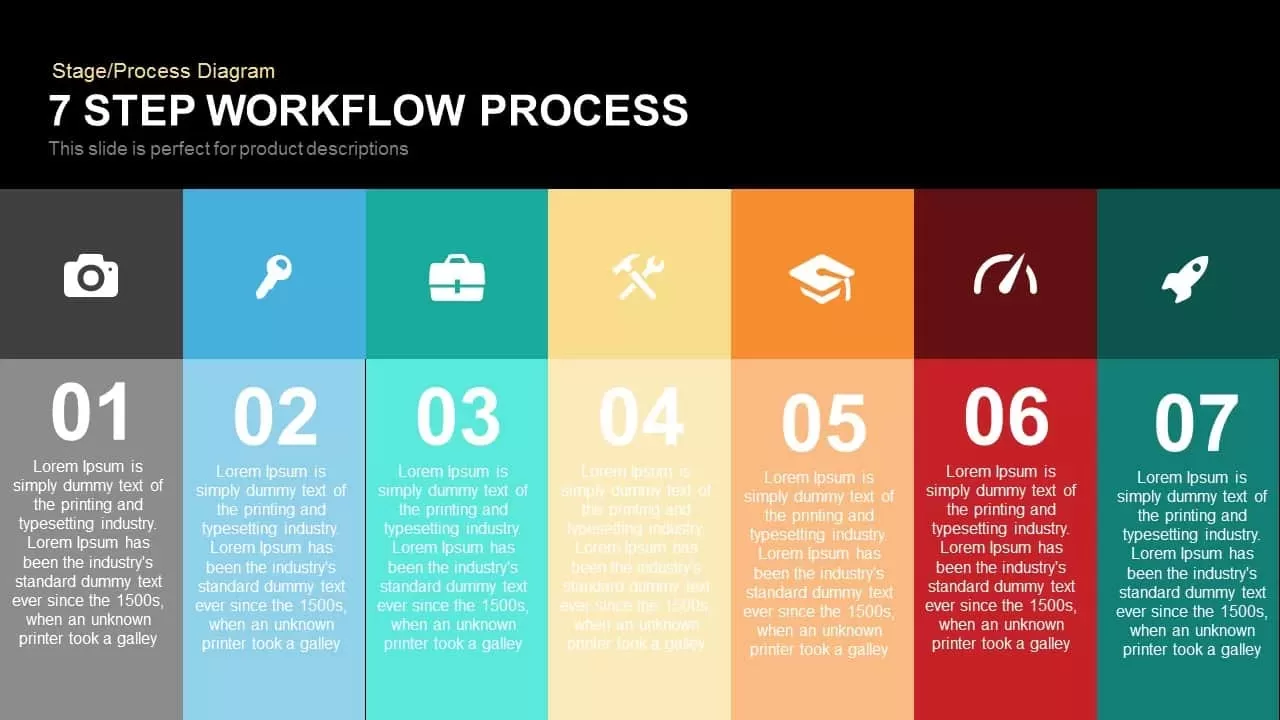
7 Step Process Workflow PowerPoint Template and Google Slide
Process
-
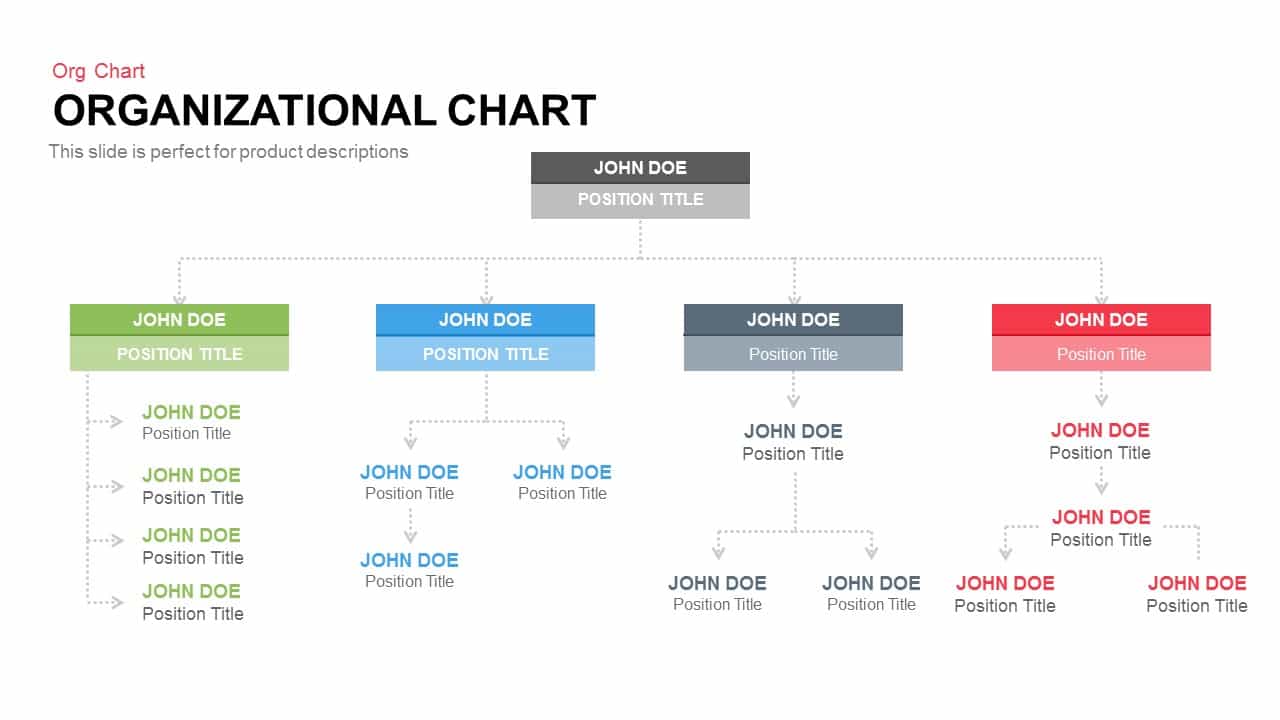
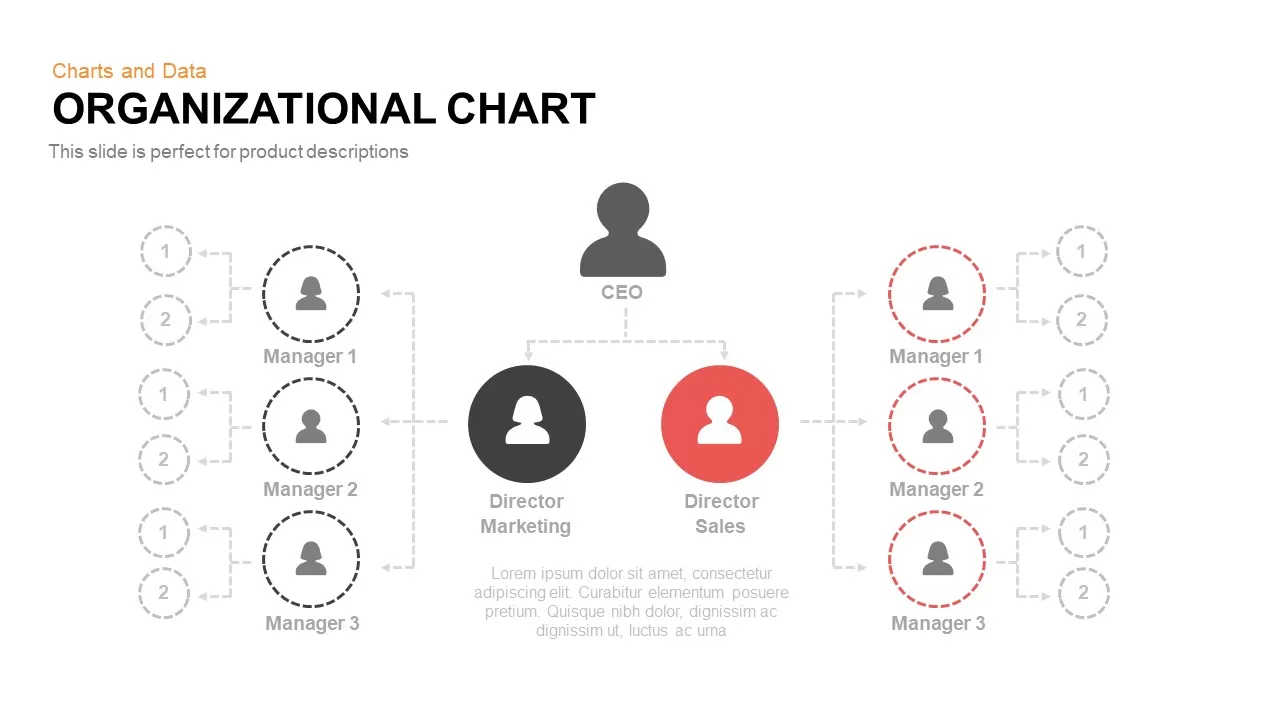
Organizational Chart Template for PowerPoint & Google Slides
Org Chart
-
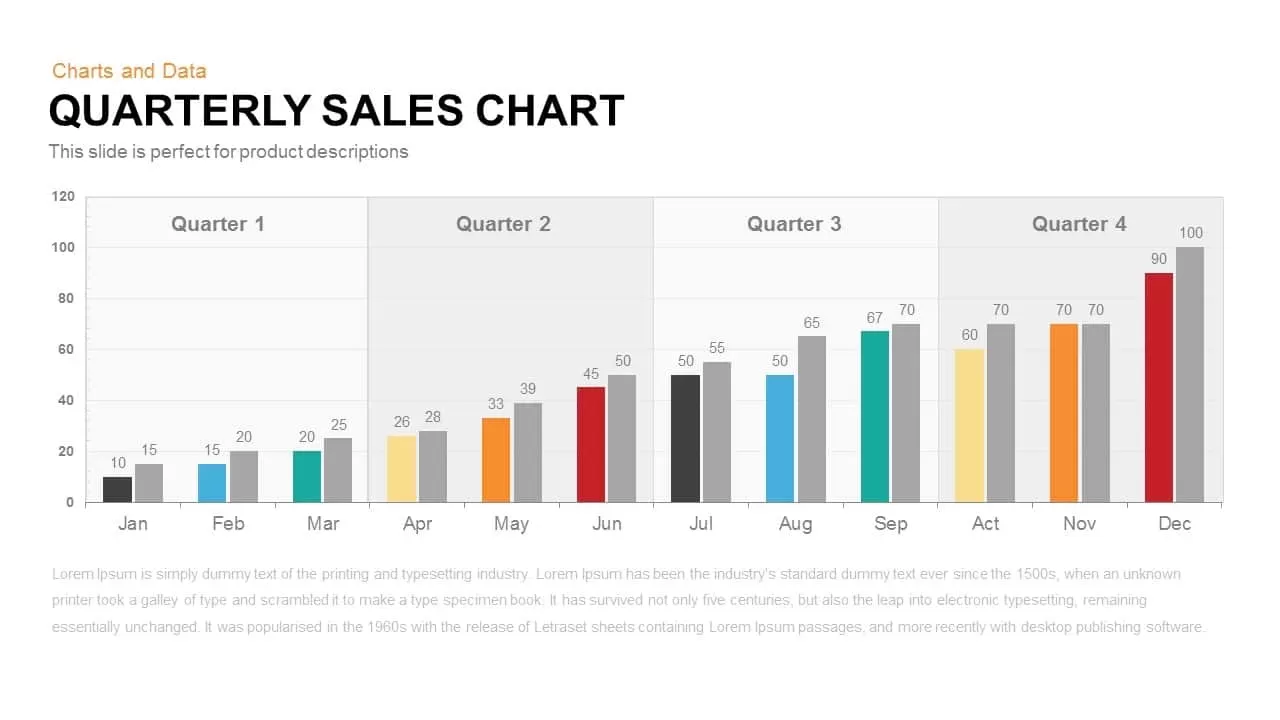
Quarterly Sales template for PowerPoint & Google Slides
Bar/Column
-
Three Bar Chart PowerPoint Template
Charts
-
Comparison Bar Chart template for PowerPoint & Google Slides
Comparison Chart
-
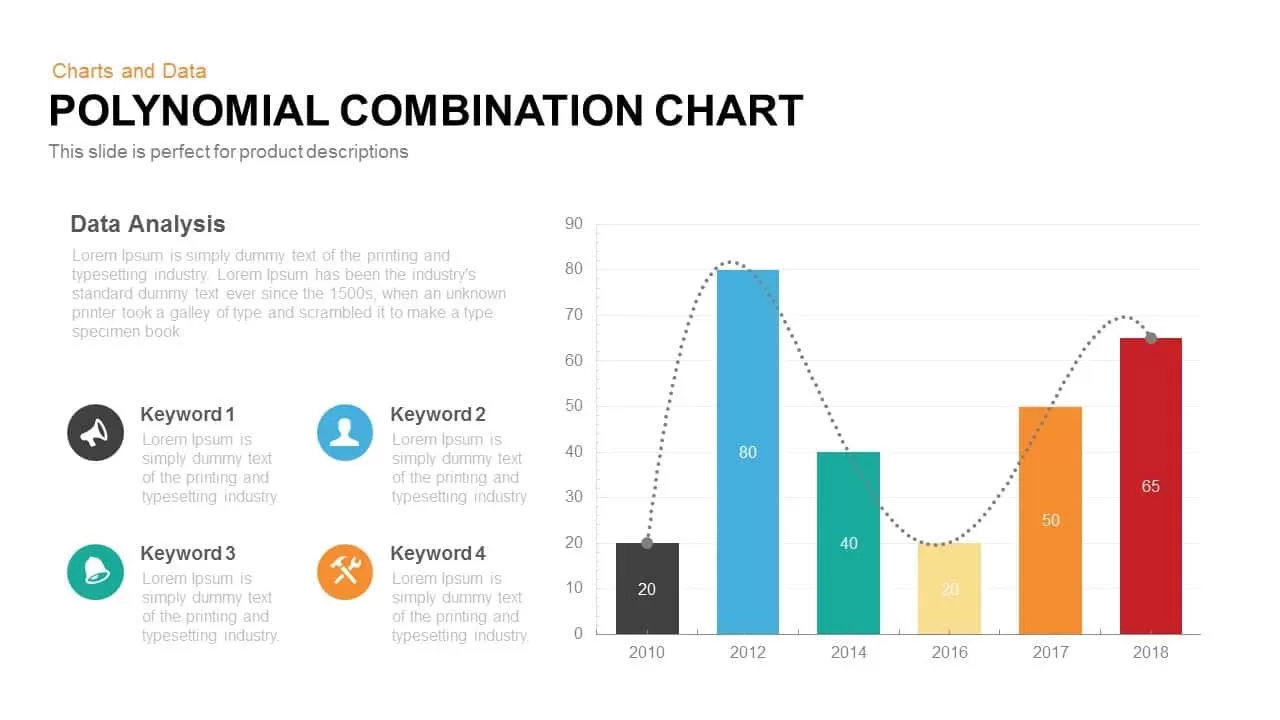
Combination Chart template for PowerPoint & Google Slides
Charts